Abstract
Currently, infrared fault diagnosis mainly relies on manual inspection and low detection efficiency. This paper proposes an improved YOLOv3 network for detecting the working state of substation high-voltage lead connectors. Firstly, dilated convolution is introduced into the YOLOv3 backbone network to process low-resolution element layers, so as to enhance the network’s extraction of image features, promote function propagation and reuse, and improve the network’s recognition performance of small targets. Then the fault detection model of the infrared image of the high voltage lead connector is created and the optimal infrared image test data set is obtained through multi-scale training. Finally, the performance of the improved network model is tested on the data set. The test results show that the improved YOLOv3 network model has an average detection accuracy of 84.26% for infrared image faults of high-voltage lead connectors, which is 4.58% higher than the original YOLOv3 network model. The improved YOLOv3 network model has an average detection time of 0.308 s for infrared image faults of high-voltage lead connectors, which can be used for real-time detection in substations.
1. Introduction
In order to find out faults in substations in time and eliminate the danger effectively, it is necessary to carry out a patrol inspection on substation equipment regularly or irregularly [1]. At present, the main inspection methods of equipment include manual inspection, robot inspection and unmanned aerial vehicle inspection. In the transformer substation, the main use is artificial inspection, and it has low efficiency. Robot inspection and unmanned aerial vehicle inspection are mainly used to take photos of equipment and generate a large number of data pictures. Workers should locate damaged or hidden safety equipment from these pictures, and quickly troubleshoot the equipment to ensure the normal operation of the substation. However, at present, this work is mainly completed manually, which is not only time-consuming and laborious, inefficient, but also inaccurate.
Infrared detection technology is widely used for thermal fault diagnosis of substation equipment due to its high precision and operation without power [2]. With the development of artificial intelligence technology in recent years, intelligent assessment of substation equipment faults based on patrol image data has become possible. For example, the target detection algorithm that extracts target characteristics by means of deep convolutional neural networks (CNN) can be used to intelligently identify and label substation fault devices [3,4,5]. At present, the widely used deep-learning target detection algorithms can be divided into two categories: the first class is region-based target detection algorithm, representing algorithms such as R-CNN [6], Faster R-CNN [7], Mask R-CNN [8] etc. These algorithms have high detection accuracy but slow detection speed. The other is regression-based target detection algorithms, also known as one-stage algorithms, such as you only look once, (YOLO) [9,10,11], single shot mulyibox detector(SSD) [12] and etc. They are characterized by end-to-end detection and high detection speed. Some researchers have successfully applied deep learning to infrared image fault recognition of electrical equipment. B. Wang et al. [13] used Mask R-CNN to automatically extract multiple insulators from the infrared image, but the recognition accuracy was not high enough, and the calculation speed could not perform real-time detection. C. Wei et al. [14] proposed a thermal fault diagnosis model of substation equipment based on ResNet and improved Bayesian optimization. Although identification accuracy was achieved, the size of the data set still had a great impact on the final identification accuracy. L. Xiao et al. [15] proposed an insulator detection method combining infrared image segmentation and artificial neural network fault diagnosis based on infrared image analysis and artificial neural network fault diagnosis, which can identify fault types and fault locations of fault insulators. He SY et al. [16] proposed a transmission line fault detection and diagnosis method based on infrared images. They used image processing and pattern recognition methods to process infrared images. J. Yin et al. [17] proposed an edge detection operator based on a double parity morphological gradient, so as to accurately segment and locate porcelain insulator strings in infrared images before thermal information is extracted to identify and diagnose insulator degradation. Zhao Z et al. [18] proposed a binary classification method combining a convolutional neural network and a support vector machine (SVM) to detect insulators in infrared images of power systems. It can be seen that the infrared image fault diagnosis method based on the convolutional neural network achieves excellent results and has the ability of automatic fault identification. Diagnosis no longer relies on manual identification, and has higher accuracy and efficiency compared with manual identification.
As ever more algorithms are applied to intelligent analysis of substation image data, such as substation equipment damage and substation equipment excessive temperature detection analysis, the real-time problem of fault diagnosis is becoming increasingly prominent. The YOLO network does not require the region proposal network (RPN), but performs regression directly to detect objects in the image, providing faster detection. YOLOv3 not only has high detection accuracy and speed, but also performs well in detecting small targets. Tian Y et al. [19] proposed an improved YOLOv3 network based on DenseNet. This network is used for apple detection and has good detection performance. Zhang X et al. [20] proposed an improved YOLOv3 network based on skipping connections and spatial pyramid pooling, which is used for helmet detection and has high detection accuracy. However, the YOLOv3 model has not been applied to substation high voltage lead joint detection. This paper proposes a real-time target detection model based on the improved YOLOv3 deep learning algorithm. This model can detect the faulty high-voltage lead connectors in real time from the patrol video data of the substation, help the maintenance department to carry out the evaluation of substation equipment and quickly determine the location, so as to provide auxiliary decision-making information for carrying out emergency repair.
The paper is organized as follows. Section 2 describes the real-time target detection model based on the improved YOLOv3, including the deep neural network structure for image feature extraction and target prediction; Section 3 improves the performance of the network by improving the YOLOv3 network model; Section 4 demonstrates the improvement of the performance of the network through experiments; Section 5 summarizes the performance of the whole testing system and presents the conclusions of this study.
2. YOLOv3 Network Structure Analysis
2.1. Introduction to YOLOv3 Algorithm
YOLOv3 (Redmon and Farhadi, 2018) networks evolved from YOLO (Redmon et al., 2016) and YOLOv2 (Redmon and Farhadi, 2017) networks. Compared to the faster R-CNN network, the YOLO network turns the detection problem into a regression problem. It does not require a proposed region; it generates the bounding box coordinates and probabilities for each class directly by regression. Compared with faster R-CNN, this greatly improves the detection speed.
While YOLO offers faster speeds than Faster R-CNN, it comes with a large detection error. To solve this problem, YOLOv2 introduced the idea of an “anchor box” in Faster R-CNN, and used k-means clustering method to generate an appropriate prior bounding box. As a result, the number of anchor boxes required to achieve the same crossover on the intersection over union (IoU) is reduced. YOLOv2 improves the network structure and replaces the full connection layer in the YOLO output layer with the convolutional layer. YOLOv2 also introduces batch normalization, high-resolution classifiers, dimensional clustering, direct location prediction, fine-grained features, multi-scale training, and other methods that greatly improve detection accuracy compared with YOLO.
YOLOv3 is an improved version of YOLOv2. It uses multi-scale prediction to detect the final target, and its network structure is more complex than YOLOv2. YOLOv3 predicts bounding boxes with different scales, and multi-scale prediction makes YOLOv3 more effective than YOLOv2 in detecting small targets.
2.2. YOLOv3 Algorithm Principle
The network structure of YOLO replaces the RPN network in the RCNN network by adopting the predefined candidate areas. The detection process of YOLOv3 is shown in Figure 1. The YOLOv3 algorithm divides the original input image into S × S grids, and predicts B bounding boxes in each grid to detect class C targets. It outputs the bounding boxes of each type of target and calculates the confidence of each bounding box, respectively. The confidence is determined jointly by the probability of detection target contained in each grid and the accuracy of the output bounding box, where the accuracy of output bounding box is defined as the IoU between prediction bounding box and real bounding box, and the formula is:
where confidence is the confidence of the bounding box; Pr (object) is the center point of the object to be detected in the grid, if there is, it is 1, otherwise, it is 0; is the intersection ratio between the reference and the predicted bounding box.
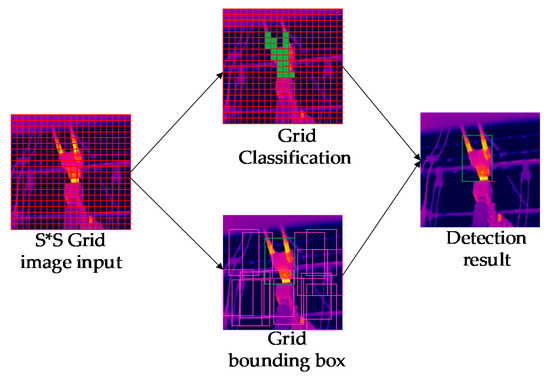
Figure 1.
Detection process.
The class confidence of each grid prediction is:
where i is the number of detection class, i = 1, 2, ... , i.
2.3. Calculation of the Loss Function
The loss function is used to describe the difference between the predicted value and the real value of the model. The loss function of the YOLOv3 algorithm mainly includes the prediction error of bounding box coordinates, confidence error of bounding box and classification prediction error. The YOLOv3 loss function is defined as:
The prediction error of bounding box coordinates is defined as:
where λcoord is the weight of the coordinate prediction error; s2 is the number of input image grids; B is the number of bounding boxes per grid; xi is the abscissa of the center of the bounding box in the ith grid; yi is the ordinate of the center of the bounding box in the ith grid; wi is the width of the bounding box in the ith grid; hi is the height of the bounding box in the ith grid; represents whether the jth bounding box of the ith grid is responsible for this object, if it is, the value of is 1, otherwise it is 0.
The IoU error is defined as:
where λnoobj is the IoU weight error; C is the total number of classes; represents whether the jth bounding box of the ith grid is responsible for this object, and if it is, the value of is 1, otherwise it is 0; represents whether the jth bounding box of the ith grid is not responsible for this object, and if it is, the value of is 1, otherwise it is 0.
The classification error is defined as:
where c is the class to which the target is detected, pi(c) refers to the real probability of the object belonging to class c in ith grid, and is the predicted value; represents whether the jth bounding box of the ith grid is responsible for this object, if it is, the value of is 1, otherwise it is 0.
3. Research into Improving YOLOv3
3.1. YOLOv3 Algorithm Network Structure
The YOLOv3 algorithm proposes a new feature extraction network Darknet-53 on the basis of Darknet-19 and ResNet network structure. The feature extraction network consists of 52 convolutional layers and 1 full connection layer. Convolution is carried out by using 3 × 3 and 1 × 1 size convolution kernel alternately. At the same time, YOLOv3 adopts the multi-scale detection mechanism to detect the feature map of 13 × 13, 26 × 26 and 52 × 52 at three scales, which enhances the ability to extract small targets. Compared with Darknet-19, ResNet-101 and ResNet-152, the Darknet-53 network has obvious advantages in top-1 accuracy, top-5 accuracy and floating-point operations per second. Its network structure is shown in Figure 2.
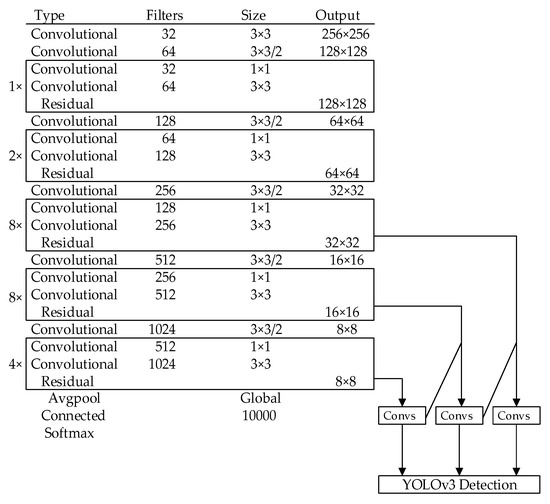
Figure 2.
YOLOv3 network structure.
3.2. Dilated Convolution Network
Dilated convolution expands the receptive field of the convolution kernel by changing the internal spaces of the convolution kernel [21]. For the detection of small targets, the usual processing method is to enlarge the feature map, and make it easier to be detected by enlarging the small targets in the image. However, there are also problems with simple image amplification. The most obvious problem is image distortion, which to a certain extent will lose the characteristics of the target and reduce the final detection accuracy. In order to solve the problem that small targets are not easy to detect, we use empty convolution to fill the feature map. Compared with the simple enlarged feature map, the cavity convolution can increase the visual field of convolution while keeping the parameter size of convolution kernel unchanged. In addition, before the void convolution, bilinear interpolation can be used to carry out up-sampling of the feature map and then the void convolution, so as to extract more global features while improving the pixel of the feature map.
Dilation rate is the main parameter of void convolution, which refers to the expansion rate of the convolutional layer and determines the number of pixels between each pixel in the feature map. However, for dilation rate, it is generally required that its size should not be a multiple greater than 1, such as [4,6,8]. In this way, the populated feature map is not an effective three-layer convolution. For dilation rate, the requirements meet the following formula:
where Mi is the maximum dilation rate of the ith layer; ri is the dilation rate of the ith layer.
Figure 3 shows the dilated convolution kernel with three different intervals. Rate represents the interval of the dilated inside the convolution kernel. Figure 3a is the dilated convolution of 3 × 3, rate = 1, and the receptive field range of the convolution kernel is 3 × 3. Figure 3b is the dilated convolution of 3 × 3, rate = 2, and the receptive field of the convolution kernel increases to 7 × 7. Figure 3c is the dilated convolution of 3 × 3, rate = 3, and the receptive field of the convolution kernel increases to 15 × 15, which ensures that the convolutional network can extract the feature information in a larger field of vision.
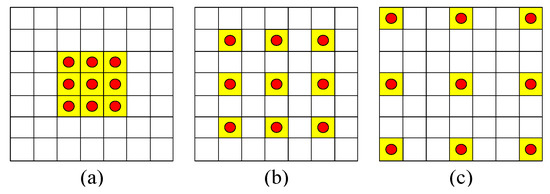
Figure 3.
Dilated convolution: (a) rate = 1; (b) rate = 2; (c) rate = 2.
3.3. Network YOLOv3 Based on Dilated Convolution
The YOLOv3 algorithm uses Darknet-53 feature extraction network, which improves the feature extraction ability by deepening the network layers compared with the Darknet-19 network. However, it is difficult to detect small targets and mutual occlusion in the high-voltage lead connectors of the infrared image in the substation, and it is difficult to extract features from the infrared image. In order to obtain the deep learning network more suitable for the fault target of substation high-voltage lead connectors, the risk of missing and wrong detection under complex background can be reduced. In this paper, improvements are made of YOLOv3 backbone network Darknet-53:
- In order to deal with high-resolution images better, the input image is adjusted to 512 × 512 pixels, which is used to replace the original figure 256 × 256 pixels. In the resolution transmission layer, feature extraction and fusion can be better, which is conducive to the extraction of small-scale targets.
- The YOLOv3 backbones darknet-53 architecture was used as the basic network structure. The improved network structure added Dilated Convolution network on the original transmission layer with low resolution. The YOLOv3 network includes 107 layers, consisting of 75 convolutional layers, 23 residual layers, 4 feature layers, 2 upsampling layers, and 3 yolo layers. On this basis, 6 layers of the convolutional layer and 18 layers of dilated convolutional layer are added to the deep network to enhance feature propagation and promote feature reuse and fusion. The improved YOLOv3 algorithm includes 131 layers, consisting of 81 convolutional layers, 23 residual layers, 18 dilated convolutional layers, 4 feature layers, 2 upsampling layers and 3 yolo layers. The network structure diagram is shown in Figure 4.
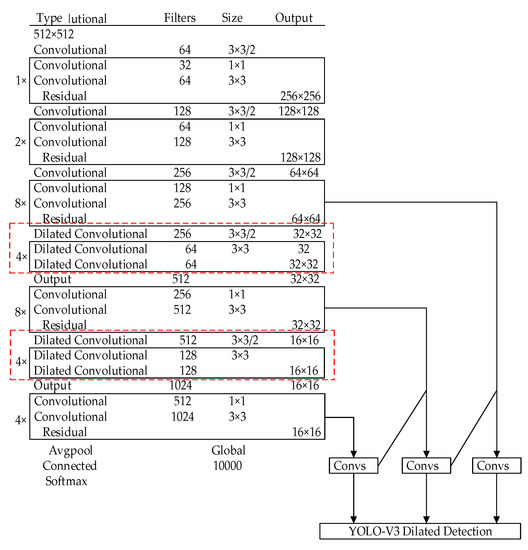 Figure 4. YOLOv3 network structure based on dilated convolution.
 - In the improved network, the 32 × 32 pixels and 16 × 16 pixels’ down sampling layer are replaced by the dilated convolution structure. The dilated convolution residual block structure [22] is shown in Figure 5. The dilated convolution with the size of 3 × 3 and rate = 2 is used for feature extraction with double channels, thus increasing the receptive field and feature expression capacity of the backbone network as a whole. The introduction of a void convolution residual block has the advantages of fewer network parameters and lower computational complexity of the residual unit. The structure uses 1 × 1 convolution to realize cross-channel feature fusion and better information integration. During training, when image features are transferred to a lower resolution layer, features of all previous feature layers will be received by the latter layer in dilated convolution, thus reducing feature loss. In this way, features can be reused, function utilization increased, and function usage improved between low-resolution convolutional layers.
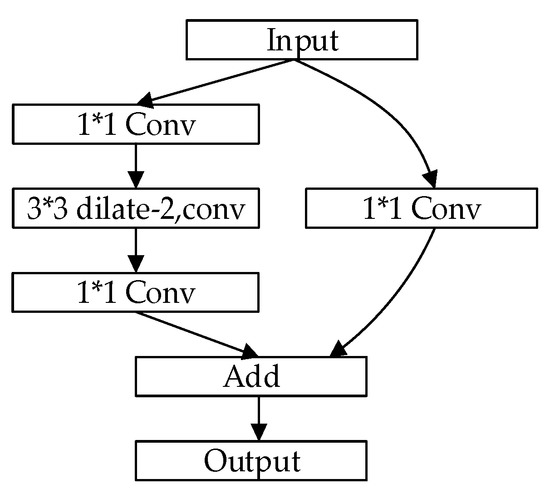 Figure 5. Residual structure of dilated convolution.
Firstly, the image is scaled into a unified form with a length and width of 512 for the whole network. Secondly, the feature extraction is performed by improving the YOLOv3 network, and the convolution kernels of 3 × 3 and 1 × 1 are alternately used for convolution operation. In order to improve the extraction of small target features and reduce feature loss, on the basis of the original network YOLOv3, a dilated convolution network is added to the low-resolution original transmission layer and a dilated convolution residual block is used to replace the network 32 × 32 pixel and 16 × 16 pixel downsampling layer. Finally, this paper puts forward the hollow YOLOv3 of the convolution algorithm to predict the three different scales of bounding box: 64 × 64, 32 × 32 and 16 × 16 to classify the target class, providing substation high-voltage lead connectors fault recognition.
3.4. Real-Time Detection Method of Infrared Image in Substation
A substation real-time infrared image detection method based on YOLOv3 network structure, add dilated convolutional network to the low resolution original transport layer and use dilated convolution residual block structure to replace the network 32 × 32 pixels and 16 × 16 pixels down sampling layer. The extraction of the low-resolution feature layer is improved, which is more conducive to detecting the fault of the substation high-voltage lead connectors. The structure flow diagram of the test is shown in Figure 6. The specific steps are as follows:
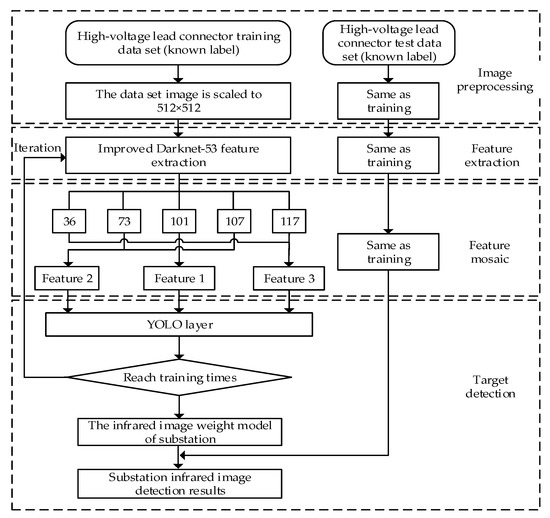
Figure 6.
The flow diagram of the detection structure.
- Image preprocessing is carried out for the data of substation high-voltage lead connectors in the training set, and the unified image after processing is taken as the input of the whole training network. Image preprocessing is carried out for the data of substation high-voltage lead connectors in the training set, and the unified image after processing is taken as the input of the whole training network.
- The processed image is fed into the improved Darknet-53 backbone network for infrared image feature extraction of the high-voltage lead connectors.
- The output of the 101th layer is extracted as the first feature, and a convolution and an up-sampling are performed for this feature.
- The output of the 107th layer and the output of the 73th layer are spliced to obtain the second feature, and a convolution and an up-sampling are performed for this feature.
- The output of the 117th layer and the output of the 37th layer are spliced to obtain the third feature.
- The three features are sent to the yolo layer for training. Weight model is generated.
- The image of the test set is input into the same network, and the weight model obtained by training is invoked to detect the fault of substation high-voltage lead connectors, and the detection result is output.
4. Experimental Results and Analysis
4.1. Operation State Partition of High-Voltage Lead Connectors and Creating Dataset
The fault of the high voltage lead connector is usually caused by excessive current caused by overload or bad contact. For the current heat-generating equipment, the guidelines classify the state of the equipment according to the relative temperature difference method [23]. The formula of the relative temperature difference method is as follows:
where T1 is the temperature of the hot spot; T2 is the temperature at the corresponding point of normal; T0 is the temperature of the ambient temperature reference body; τ is the relative temperature difference.
According to the relative temperature difference, the operation state of the joint is divided into three states: normal, general defect and serious defect. Figure 7 shows the infrared images of the high-voltage lead connectors under three operating conditions.
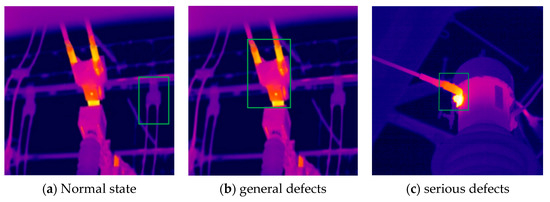
Figure 7.
Example of high voltage lead connectors status.
In the problem of target detection, the selection of the training data set and the production of original image label are two crucial steps. The accuracy of original image label directly affects the training effect and test accuracy. At present, in the substation patrol inspection, there is no publicly available data set suitable for deep learning training. In this paper, a data set of substation high-voltage lead connectors based on infrared images was created. This time, 3000 infrared images of the high-voltage lead connectors of the power station with general defects and serious defects were collected, and 300 images were used for testing. Firstly, the images in the database were sorted out in accordance with VOC2007 data set format. Secondly, the images in the training set were labeled one by one with labelling tool, and the corresponding target box position information file in eXtensible Markup Language (XML) format was generated. During labeling, the high-voltage lead connector with general defects and serious defects is labeled as 1 and 2 respectively. Finally, python program was written to normalize the location information of target box in XML format and convert it into Text (TXT) format, which is used as the label of substation high-voltage lead connectors data set.
4.2. Experimental Environment Configuration and Model Training Results
The Darknet framework was used to modify the algorithm model based on hollow convolution YOLOv3 used in this study. The experiment used an Intel-CPU-I7 (6700 K) processor, a GTX1080 Ti GPU (Graphics Processing Unit) and a 32 G memory strip. The experiment was carried out under Ubuntu16.00 operating system. In order to save the time of the experiment and improve the performance of the network, the GPU was called by CUDA8.0 and cuDNN6.0 for acceleration. Network initialization parameters are shown in Table 1.

Table 1.
Initialization parameters of D-YOLOv3 network.
The batch size for this article is set to 32 to take into account the memory limitations of your computer’s video card. To better analyze the training process, 50,000 training steps were used. The momentum, initial learning rate, weight attenuation regularization and other parameters are all the original parameters in the YOLOv3 model. After the training parameters were defined and the model was trained. When the training iteration reached 30,000 times and 40,000 times, the learning efficiency of the network was reduced to 0.001 and 0.0001, respectively, which is conducive to the convergence of the loss function. The convergence curve of loss value in the improved network training process is shown in Figure 8, and the change curve of the average alternating ratio is shown in Figure 9.
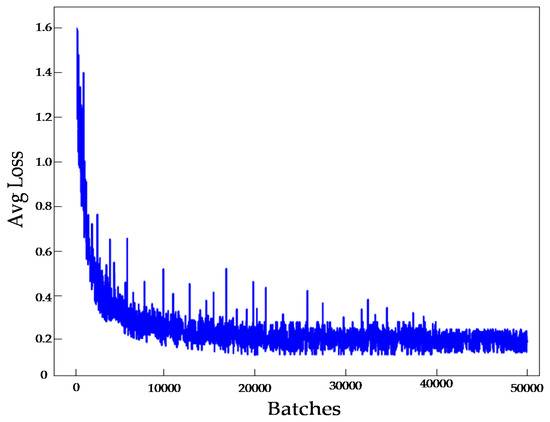
Figure 8.
The function curve of average loss.
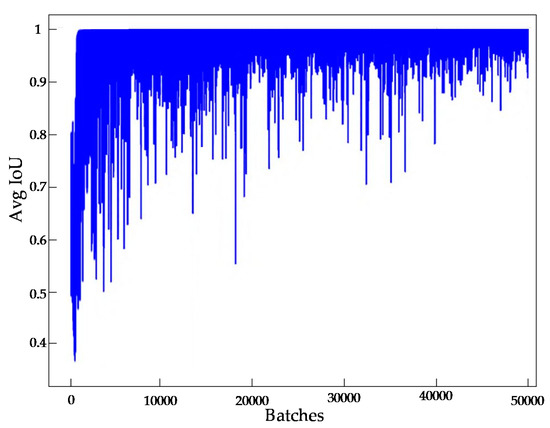
Figure 9.
The curve of intersection over union (IoU).
During the training, the dynamic process of training can be intuitively observed by drawing Loss curves. Figure 8 is the average loss (Avg Loss) curve corresponding to the training process of the YOLOv3 model based on cavity convolution. The abscissa represents the number of training iterations, and the ordinate represents the loss value in the training process. It can be seen from the figure that the loss function value at the beginning of training is about 1.6. As the number of training iterations increases, the loss value gradually decreases and the trend becomes stable. When the iteration reaches 50,000, the loss value drops to about 0.2, which can achieve a better training effect.
As can be seen from Figure 9, the average IoU at the beginning of the training was below 0.4. With the increase of the number of training iterations, the average (IoU) gradually increased, indicating that the detection accuracy of the model was constantly improving. After 10,000 iterations, it could be maintained at around 90%.
4.3. Performance Evaluation and Comparison
In this paper, a series of experiments are carried out with the trained YOLOv3 model based on cavity convolution, and the performance of the algorithm is verified by testing images. The test set is used to test the trained model, and the test indexes mainly included precision, recall, mean average precision (mAP), loss and IoU. The average minimum reliability is used to evaluate the classification performance of the multi-class target recognition algorithm. And the omission rate is used to test the performance of the algorithm to identify the target frame. The indicators are evaluated using the following formulas:
where TP is a positive; FP is false positive; FN is false negative.
where NC indicates the target type; N indicates the number of pictures.
where NB represents the total number of targets in the picture; NM represents the number of undetected targets.
where Soverlap is the intersection area of the predicted bounding box and the real bounding box; Sunion is the union area of the two bounding boxes.
In order to verify the performance of the model proposed in this paper, the proposed model is compared with YOLOv3 and VGG16-based Faster R-CNN network, aiming to illustrate the superiority of the YOLOv3 model proposed in this paper based on empty convolution. The indicators of YOLOv3, Faster R-CNN and D-YOLOv3 models are shown in Table 2.

Table 2.
Test comparison for three models.
The comparison of indicators of each network model in Table 2 shows that the D-YOLOv3 network model is superior to the YOLOv3 network model in terms of precision, recall, mean average precision, average minimum confidence, loss and IoU detection performance. Faster R-CNN can achieve the detection performance. In terms of average detection time, the average detection time of D-Yolov3 network model is 0.308 s, which is close to 0.296 s of the YOLOv3 network model and much shorter than the 2.42 s of the Faster R-CNN model, indicating that this model can provide real-time detection of infrared images of substation high-voltage lead connectors.
The precision-recall(P-R) curves of YOLOv3, Faster R-CNN and D-YOLOv3 models are shown in Figure 10. By analyzing and comparing the P-R curve of each model, it can be found that the ordinate accuracy in the figure represents the accuracy rate of segmentation of high-voltage lead connectors, while the abscissa recall rate represents the ability of network model to segment all high-voltage lead connectors in the image. Ideally, the P-R curve is a straight line with an accuracy of always 1. The accuracy of the model with good performance should be kept at a high value while the recall rate continues to increase, while the model with poor performance needs to sacrifice a lot of accuracy value in order to improve the recall rate. In terms of detection performance, D-YOLOv3 model proposed in this paper has better performance than YOLOv3 and Faster R-CNN model.
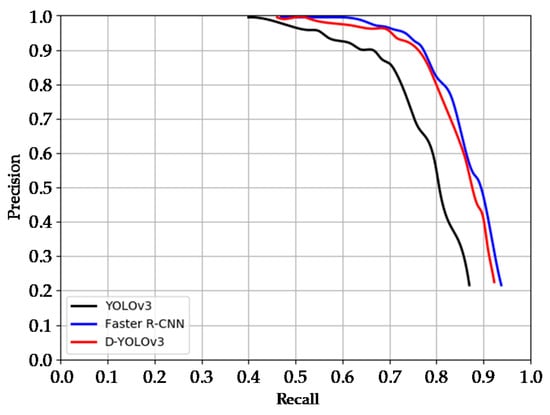
Figure 10.
Precision-Recall(P-R)curves.
4.4. Comparison of Test Results
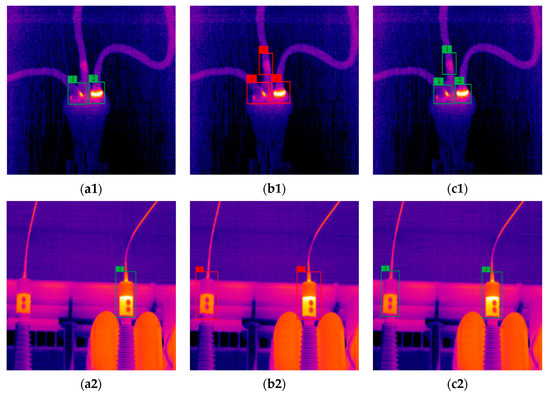
Figure 11.
The detection results of three network models: (a1,a2) YOLOv3; (b1,b2) Faster region-based convolutional neural network (R-CNN); (c1,c2) D-YOLOv3.

Table 3.
The detection results of three network models.
Based on the comparison of detection result data in Figure 11 and Table 3, in terms of accuracy and confidence, the D-YOLOv3 model proposed and the Faster R-CNN model obtained similar detection results, which were significantly higher than the original YOLOv3 model. Combined with the average detection time data in Table 2, D-Yolov3 model had a good real-time performance. By combining the two results, we can confirm the superiority of the D-Yolov3 network model proposed in this paper.
5. Conclusions
This paper presents an improved YOLOv3 algorithm for high-voltage lead connectors detection. Firstly, dilated convolution network structure is introduced into the Darknet-53 backbone network for feature extraction. Secondly, the residual structure of dilated convolution is used to extract the features with double channels, thus increasing the receptive field and feature expression capacity of the backbone network. Finally, the improved YOLOv3 network is used to realize high-voltage lead connectors detection. The conclusions can be summarized as follows:
- (1)
- An infrared image detection method for high-voltage lead connectors fault based on the deep learning YOLOv3 algorithm is proposed. Combining the deep learning method with substation high-voltage lead connectors fault, end-to-end detection of the substation high-voltage lead connector is realized.
- (2)
- Aiming at the problem of high missed detection rate in the detection of high-voltage lead connectors, an improved YOLOv3 network is proposed. By enhancing feature propagation, promoting feature reuse and improving network performance, the low-resolution feature layer in the YOLOv3 model is optimized, and the experience of the backbone network is increased. Compared with the original YOLOv3 network mAP value increased by 4.58%, but only increased by 0.02 s test time, and therefore still achieves good real-time performance.
- (3)
- Compared with the network structure of Faster R-CNN, the mAP value of the improved network is lower than 1.46% of the Faster R-CNN, but the detection time is shortened by 2.112 s. It can realize real-time detection of infrared image faults in the high-voltage lead connector of the substation.
Author Contributions
Q.X. and H.H. proposed and designed the method; X.Z. provided infrared images of substations and made the data set; H.H. wrote original draft preparation; C.Z. carried out the experimental verification. All authors have read and agreed to the published version of the manuscript.
Funding
This research was supported by the Chongqing Science and Technology Commission of China under Project No. cstc2018 jcyjA3148; graduate scientific research and innovation foundation of Chongqing, China under Grant No. CYS1807; graduate research and innovation foundation of Chongqing, China under Grant No. CYB18009.
Conflicts of Interest
The authors declare no conflict of interest.
References
- Wang, H.; Li, J.; Zhou, Y.; Fu, M.; Yang, S. Research on the Technology of Indoor and Outdoor Integration Robot Inspection in Substation. In Proceedings of the 2019 IEEE 3rd Information Technology, Networking, Electronic and Automation Control Conference (ITNEC), Chengdu, China, 15–17 March 2019; pp. 2366–2369. [Google Scholar]
- Liu, Y.; Xu, Z.; Li, G.; Xia, Y.; Gao, S. Review on applications of artificial intelligence driven data analysis technology in condition based maintenance of power transformers. High Volt. Eng. 2019, 45, 337–348. [Google Scholar]
- Nguyen, B.N.; Quyen, A.H.; Nguyen, P.H.; Ton, T.N. Wavelet-Based Neural Network for Recognition of Faults at NHABE Power Substation of the Vietnam Power System. In Proceedings of the 2017 International Conference on System Science and Engineering (ICSSE), Ho Chi Minh City, Vietnam, 21–23 July 2017; pp. 165–168. [Google Scholar]
- Jiang, A.; Yan, N.; Wang, F.; Huang, H.; Zhu, H.; Wei, B. Visible Image Recognition of Power Transformer Equipment Based on Mask R-CNN. In Proceedings of the 2019 IEEE Sustainable Power and Energy Conference (iSPEC), Beijing, China, 21–23 November 2019; pp. 657–661. [Google Scholar]
- Liu, Y.; Ji, X.; Pei, S.; Ma, Z.; Zhang, G.; Lin, Y.; Chen, Y. Research on automatic location and recognition of insulators in substation based on YOLOv3. High Volt. 2020, 5, 62–68. [Google Scholar] [CrossRef]
- Girshick, R.; Donahue, J.; Darrell, T.; Malik, J. Rich Feature Hierarchies for Accurate Object Detection and Semantic Segmentation. In Proceedings of the 2014 IEEE Conference on Computer Vision and Pattern Recognition, Columbus, OH, USA, 23–28 June 2014; pp. 580–587. [Google Scholar]
- Ren, S.; He, K.; Girshick, R.; Sun, J. Faster R-CNN: Towards Real-Time Object Detection with Region Proposal Networks. IEEE Trans. Pattern Anal. Mach. Intell. 2017, 39, 1137–1149. [Google Scholar] [CrossRef] [PubMed]
- He, K.; Gkioxari, G.; Dollár, P.; Girshick, R. Mask R-CNN. IEEE Trans. Pattern Anal. Mach. Intell. 2020, 42, 386–397. [Google Scholar] [CrossRef] [PubMed]
- Redmon, J.; Divvala, S.; Girshick, R.; Farhadi, A. You Only Look Once: Unified, Real-Time Object Detection. In Proceedings of the 2016 IEEE Conference on Computer Vision and Pattern Recognition (CVPR), Las Vegas, NV, USA, 26 June–1 July 2016; pp. 779–788. [Google Scholar]
- Redmon, J.; Farhadi, A. YOLO9000: Better, Faster, Stronger. In Proceedings of the 2017 IEEE Conference on Computer Vision and Pattern Recognition (CVPR), Honolulu, HI, USA, 21–26 July 2017; pp. 6517–6525. [Google Scholar]
- Redmon, J.; Farhadi, A. Yolov3: An incremental improvement. arXiv 2018, arXiv:180402767. [Google Scholar]
- Liu, W.; Anguelov, D.; Erhan, D.; Szegedy, C.; Reed, S.; Fu, C.Y.; Berg, A.C. SSD: Single Shot MultiBox Detector European Conference on Computer Vision; Springer International Publishing: Cham, Switzerland, 2016; pp. 21–37. [Google Scholar]
- Wang, B.; Dong, M.; Ren, M.; Wu, Z.; Guo, C.; Zhuang, T.; Pischler, O.; Xie, J. Automatic Fault Diagnosis of Infrared Insulator Images Based on Image Instance Segmentation and Temperature Analysis. IEEE Trans. Instrum. Meas. 2020, 69, 5345–5355. [Google Scholar] [CrossRef]
- Wei, C.; Tao, F.; Lin, Y.; Liang, X.; Wang, Y.; Li, H.; Fang, J. Substation Equipment Thermal Fault Diagnosis Model Based on ResNet and Improved Bayesian Optimization. In Proceedings of the 2019 9th International Conference on Power and Energy Systems (ICPES), Perth, Australia, 10–12 December 2019; pp. 1–5. [Google Scholar]
- Xiao, L.; Mao, Q.; Lan, P.; Zang, X.; Liao, Z. A Fault Diagnosis Method of Insulator String Based on Infrared Image Feature Extraction and Probabilistic Neural Network. In Proceedings of the 2017 10th International Conference on Intelligent Computation Technology and Automation (ICICTA), Changsha, China, 9–10 October 2017; pp. 80–85. [Google Scholar]
- He, S.; Yang, D.; Li, W.; Xia, Y.; Tang, Y. Detection and Fault Diagnosis of Power Transmission Line in Infrared Image. In Proceedings of the 2015 IEEE International Conference on Cyber Technology in Automation, Control, and Intelligent Systems (CYBER), Shenyang, China, 8–12 June 2015; pp. 431–435. [Google Scholar]
- Yin, J.; Lu, Y.; Gong, Z.; Jiang, Y.; Yao, J. Edge Detection of High-Voltage Porcelain Insulators in Infrared Image Using Dual Parity Morphological Gradients. IEEE Access 2019, 7, 32728–32734. [Google Scholar] [CrossRef]
- Zhao, Z.; Fan, X.; Xu, G.; Zhang, L.; Qi, Y.; Zhang, K. Aggregating Deep Convolutional Feature Maps for Insulator Detection in Infrared Images. IEEE Access 2017, 5, 21831–21839. [Google Scholar] [CrossRef]
- Tian, Y.; Yang, G.; Wang, Z.; Wang, H.; Li, E.; Liang, Z. Apple detection during different growth stages in orchards using the improved YOLO-V3 model. Comput. Electron. Agric. 2019, 157, 417–426. [Google Scholar] [CrossRef]
- Zhang, X.; Wang, W.; Zhao, Y.; Xie, H. An improved YOLOv3 model based on skipping connections and spatial pyramid pooling. Syst. Sci. Control Eng. 2020, 9, 1–8. [Google Scholar]
- Yu, F.; Koltun, V. Multi-scale context aggregation by dilated convolutions. arXiv 2016, arXiv:151107122. [Google Scholar]
- Li, Z.; Peng, C.; Yu, G.; Zhang, X.; Deng, Y.; Sun, J. DetNet: Design Backbone for Object Detection. Eur. Conf. Comput. Vis. 2018, 11213, 334–350. [Google Scholar]
- Dong, L.; Hu, X.; Wang, T.; Han, R.; Yin, S.; Wang, X. Construction and Implementation of Power Equipment Infrared Thermal Image Database Based on Curve Analysis Method. In Proceedings of the 2018 2nd IEEE Conference on Energy Internet and Energy System Integration (EI2), Beijing, China, 20–22 October 2018; pp. 1–5. [Google Scholar]
Publisher’s Note: MDPI stays neutral with regard to jurisdictional claims in published maps and institutional affiliations. |
© 2021 by the authors. Licensee MDPI, Basel, Switzerland. This article is an open access article distributed under the terms and conditions of the Creative Commons Attribution (CC BY) license (http://creativecommons.org/licenses/by/4.0/).