Article

Constructing Emotional Machines: A Case of a Smartphone-Based Emotion System

1
Department of Information and Learning Technology, National University of Tainan, Tainan 700, Taiwan
2
Zero Dimension Technology Co., Ltd., Taichung 407, Taiwan
*
Author to whom correspondence should be addressed.
Electronics 2021, 10(3), 306; https://doi.org/10.3390/electronics10030306
Submission received: 21 December 2020 / Revised: 20 January 2021 / Accepted: 22 January 2021 / Published: 27 January 2021
(This article belongs to the Special Issue Artificial Intelligence and Ambient Intelligence)

Abstract

:
In this study, an emotion system was developed and installed on smartphones to enable them to exhibit emotions. The objective of this study was to explore factors that developers should focus on when developing emotional machines. This study also examined user attitudes and emotions toward emotional messages sent by machines and the effects of emotion systems on user behavior. According to the results of this study, the degree of attention paid to emotional messages determines the quality of the emotion system, and an emotion system triggers certain behaviors in users. This study recruited 124 individuals with more than one year of smartphone use experience. The experiment lasted for two weeks, during which time participants were allowed to operate the system freely and interact with the system agent. The majority of the participants took interest in emotional messages, were influenced by emotional messages and were convinced that the developed system enabled their smartphone to exhibit emotions. The smartphones generated 11,264 crucial notifications in total, among which 76% were viewed by the participants and 68.1% enabled the participants to resolve unfavorable smartphone conditions in a timely manner and allowed the system agent to provide users with positive emotional feedback.

1. Introduction

Human interactions have gradually evolved toward diverse methods of interaction beyond conventional in-person ones. Software has become integral to human life, and software development has led to numerous advances. Currently, human–machine interactions are more prevalent than person–person interactions. The human–machine interface plays a crucial role in the diversified interactions between humans and machines, especially in the era of the Internet of Things (IoT), by enabling information exchange between humans and machines [1]. With a high market penetration rate, the smartphone market has matured. The high rates of smartphone ownership indicate that smartphone use has become widespread in daily life [2]. Since 2015, the percentage of smartphone users has continued to increase across multiple countries and age groups [3]. In the IoT era, wearable technology is in a rapid growth phase and has attracted increasing attention from both industry and academia over the past decade [4]. The use of wearable devices and IoT services in people’s daily lives is increasing, and individuals are exposed to diverse software and hardware services. An important objective of human–machine interaction, especially in the field of machine emotion expression, is to make the behavior of a machine more similar to that of a human [5].
In an ideal intelligent interactive environment, a machine has the same external stimulus perception ability as a human does. Such a machine can conduct a simulation to recognize, process, and understand external stimuli, and has the ability of emotion computation [5]. Currently, there is no single, well-developed human–machine interaction mechanism that can satisfy the requirements of those working with various related machines. This phenomenon is a key challenge in the field of human–machine interfaces. Human emotion is a wide research topic that covers different fields, including psychology, neuroscience, health science, and engineering. An accurate model of human emotion would be beneficial for developing an emotion recognition system and its applications [6]. The concept of an emotion system has been applied in various fields and has yielded many benefits. Emotions can be recognized from speech, activity, and facial expressions. For example, appropriate and personalized learning can be achieved by applying the affective tutoring system (ATS) in teaching through emotional computing technology. Thus, each student faces their own emotional learning system on their smartphones for learning [7]. The system will analyze the emotions of the student at each moment and complete the course content according to the student’s learning status [8]. However, emotion systems are mostly designed to serve a specific system. Because few studies have investigated attitudes toward machines, an emotion system was designed in this study to assign emotions to machines, thus transforming cold, impersonal machines into life-like entities, and this study explored users’ attitudes toward emotional machines. When machines have emotions, the positive effect is that machines with emotional intelligence are not the same as our “human” friends. The former will know everything about us, and we cannot hide anything from them. They may know us a lot more than ourselves. Therefore, they may be able to help us make better decisions and choices in life. It is invaluable to have such a “person” to accompany us in our lives. Making artificial intelligence more humane and empathetic is the future development goal of artificial intelligence [9]. Emotion is a necessary condition for communication. The understanding of both parties can be improved when there is more human–computer interaction. The emotions of the machine can improve human emotions in daily life situations [10]. If a machine has emotions, it will not only reduce the gap between the machine and the user, but also trigger or change the behavior of the user, allowing the user to actually adopt specific behaviors, thereby creating commercial value [11].
In this study, an emotion system was developed and installed on smartphones to enable them to exhibit emotions. The emotion system (in the form of an app) was designed for Android smartphones to track. Users have access to information on the past and present conditions of their smartphones. More warm and humane services can be realized by enabling emotions in machines. Thus, friendly artificial intelligence can be realized. The test subject will need a smartphone with the Android operating system. There will be compatibility issues when designing Android applications. When using the same application on different models, the application system cannot be used normally in some circumstances. Moreover, the app is equipped with a system agent that discloses smartphone conditions in a human-like manner. When a smartphone has an unfavorable condition (e.g., being extremely low on battery), the system automatically informs the user by sending them a timely notification. In addition, the system agent within the application notifies users of any smartphone problems. The agent also analyzes the view rate of such notifications and the instruction execution rate, which allows program designers to determine the effect of the developed emotion system on user behavior. After smartphone malfunctions are resolved, the agent provides users with positive emotional feedback. This study analyzed the following aspects:
(1).
Factors requiring attention during the development of emotional machines.
(2).
Users’ attitudes toward emotional messages.
(3).
Effects of the developed emotion system on user behavior.

2. Literature Review

2.1. Affective Computing

The concept of a human–machine interface was proposed by Norman, and Picard [12] laid the foundation for affective computing. Following these foundational works, the application of affective computing in human–machine interfaces received considerable attention [13]. Affective computing is an interdisciplinary field that focuses on computer models and methods for recognizing and expressing emotions [14]. Affective computing was originally proposed in 1997 by Rosalind Picard from the MIT Media Lab [12]. It results from biomedical engineering, psychology, and artificial intelligence. Affective computing aims to allow computer systems to detect, use, and express emotions [15]. It is a constructive and practical approach that focuses on improving human-like decision support and human–machine interaction [16].
In the field of human–machine interfaces, user experience is essential, and users’ emotions and reactions affect user satisfaction [17]. Many studies on emotion systems have established affective tutoring systems [18] and verified the positive influence of emotion system interfaces on learning. In addition, affective computing has been incorporated into human–machine interfaces. For example, the eMoto system proposed by Sundström et al. in [19] is an emotional text messaging interface that builds on the physiological data (e.g., body movement data) captured by a smart pen to generate graphical and expressive backdrops for messages. The Affective Diary system proposed by Ståhl et al. in [20] collects data on user emotions through a physiological sensor on the day of use. The results, represent a user’s affective memories of the day of use. In summary, the aforementioned research indicates that affective computing positively affects human–machine interfaces when emotion systems are appropriately designed [21].

2.2. Emotion Systems

Research on affective computing can be divided into two main branches that focus on (1) detecting and recognizing emotional messages, and (2) expressing emotions. This study focused on the expression of emotions. Bretan et al. in [22] constructed a robot with the ability to express emotions and process languages. They found that participants who interacted with the robot exhibited a greater sense of participation and joy than those who did not. This result may be attributed to users finding a system more valuable when it provides emotional feedback. Therefore, the effective expression of emotions is key to establishing an appropriate emotion system. Research has also been conducted on enabling machines to exhibit emotions. For example, Bates conducted a preliminary study by developing a simplified emotional agent that expresses fundamental emotional states [23]. Subsequently, Ushida et al. in [24] developed a set of emotion modules in which emotions are expressed through a life-like emotional agent. Maria and Zitar [25] modeled artificial emotions through agents and proposed emotional algorithms for the operation of the emotion module. Evidently, the literature on incorporating emotions into machines is gradually expanding. All studies on this topic have indicated that emotion systems must be equipped with an emotion module that satisfies the research objective.

2.3. Emotional Expression

Emotional expression refers to how emotions are conveyed. Emotion systems are generally equipped with emotion modules and use emotional expression as the framework to support the operational processes of emotion modules. Emotional expression research is based on two mainstream theories: discrete emotion theory and continuous emotion theory. Discrete emotion theory is characterized by a discrete classification of emotions. The most prominent discrete categorization is that proposed by Ekman [26] and comprises fear, anger, disgust, sadness, happiness, and surprise [27].
Proponents of continuous emotion theory argue that emotions can be fully expressed through neural and physiological systems. In discrete emotion theory, emotions are classified according to the neurophysiological systems associated with them. Continuous emotion theory was first proposed in 1897 by the psychologist Wundt, who divided emotions into three dimensions: pleasurable versus unpleasurable, arousing versus subduing, and straining versus relaxing [28]. Subsequently, as an extension of Wundt’s theory, Woodworth and Schlosbeg [29] reformulated the three dimensions of emotions as pleasantness–unpleasantness, attention–rejection, and level of activation. In addition to these three-dimensional models, two-dimensional models, including the circumplex model [30], vector model [31], and PANA model [32], have been widely applied in the literature. However, the present study adopted continuous emotion theory and computed emotional expression.

3. Research Methods

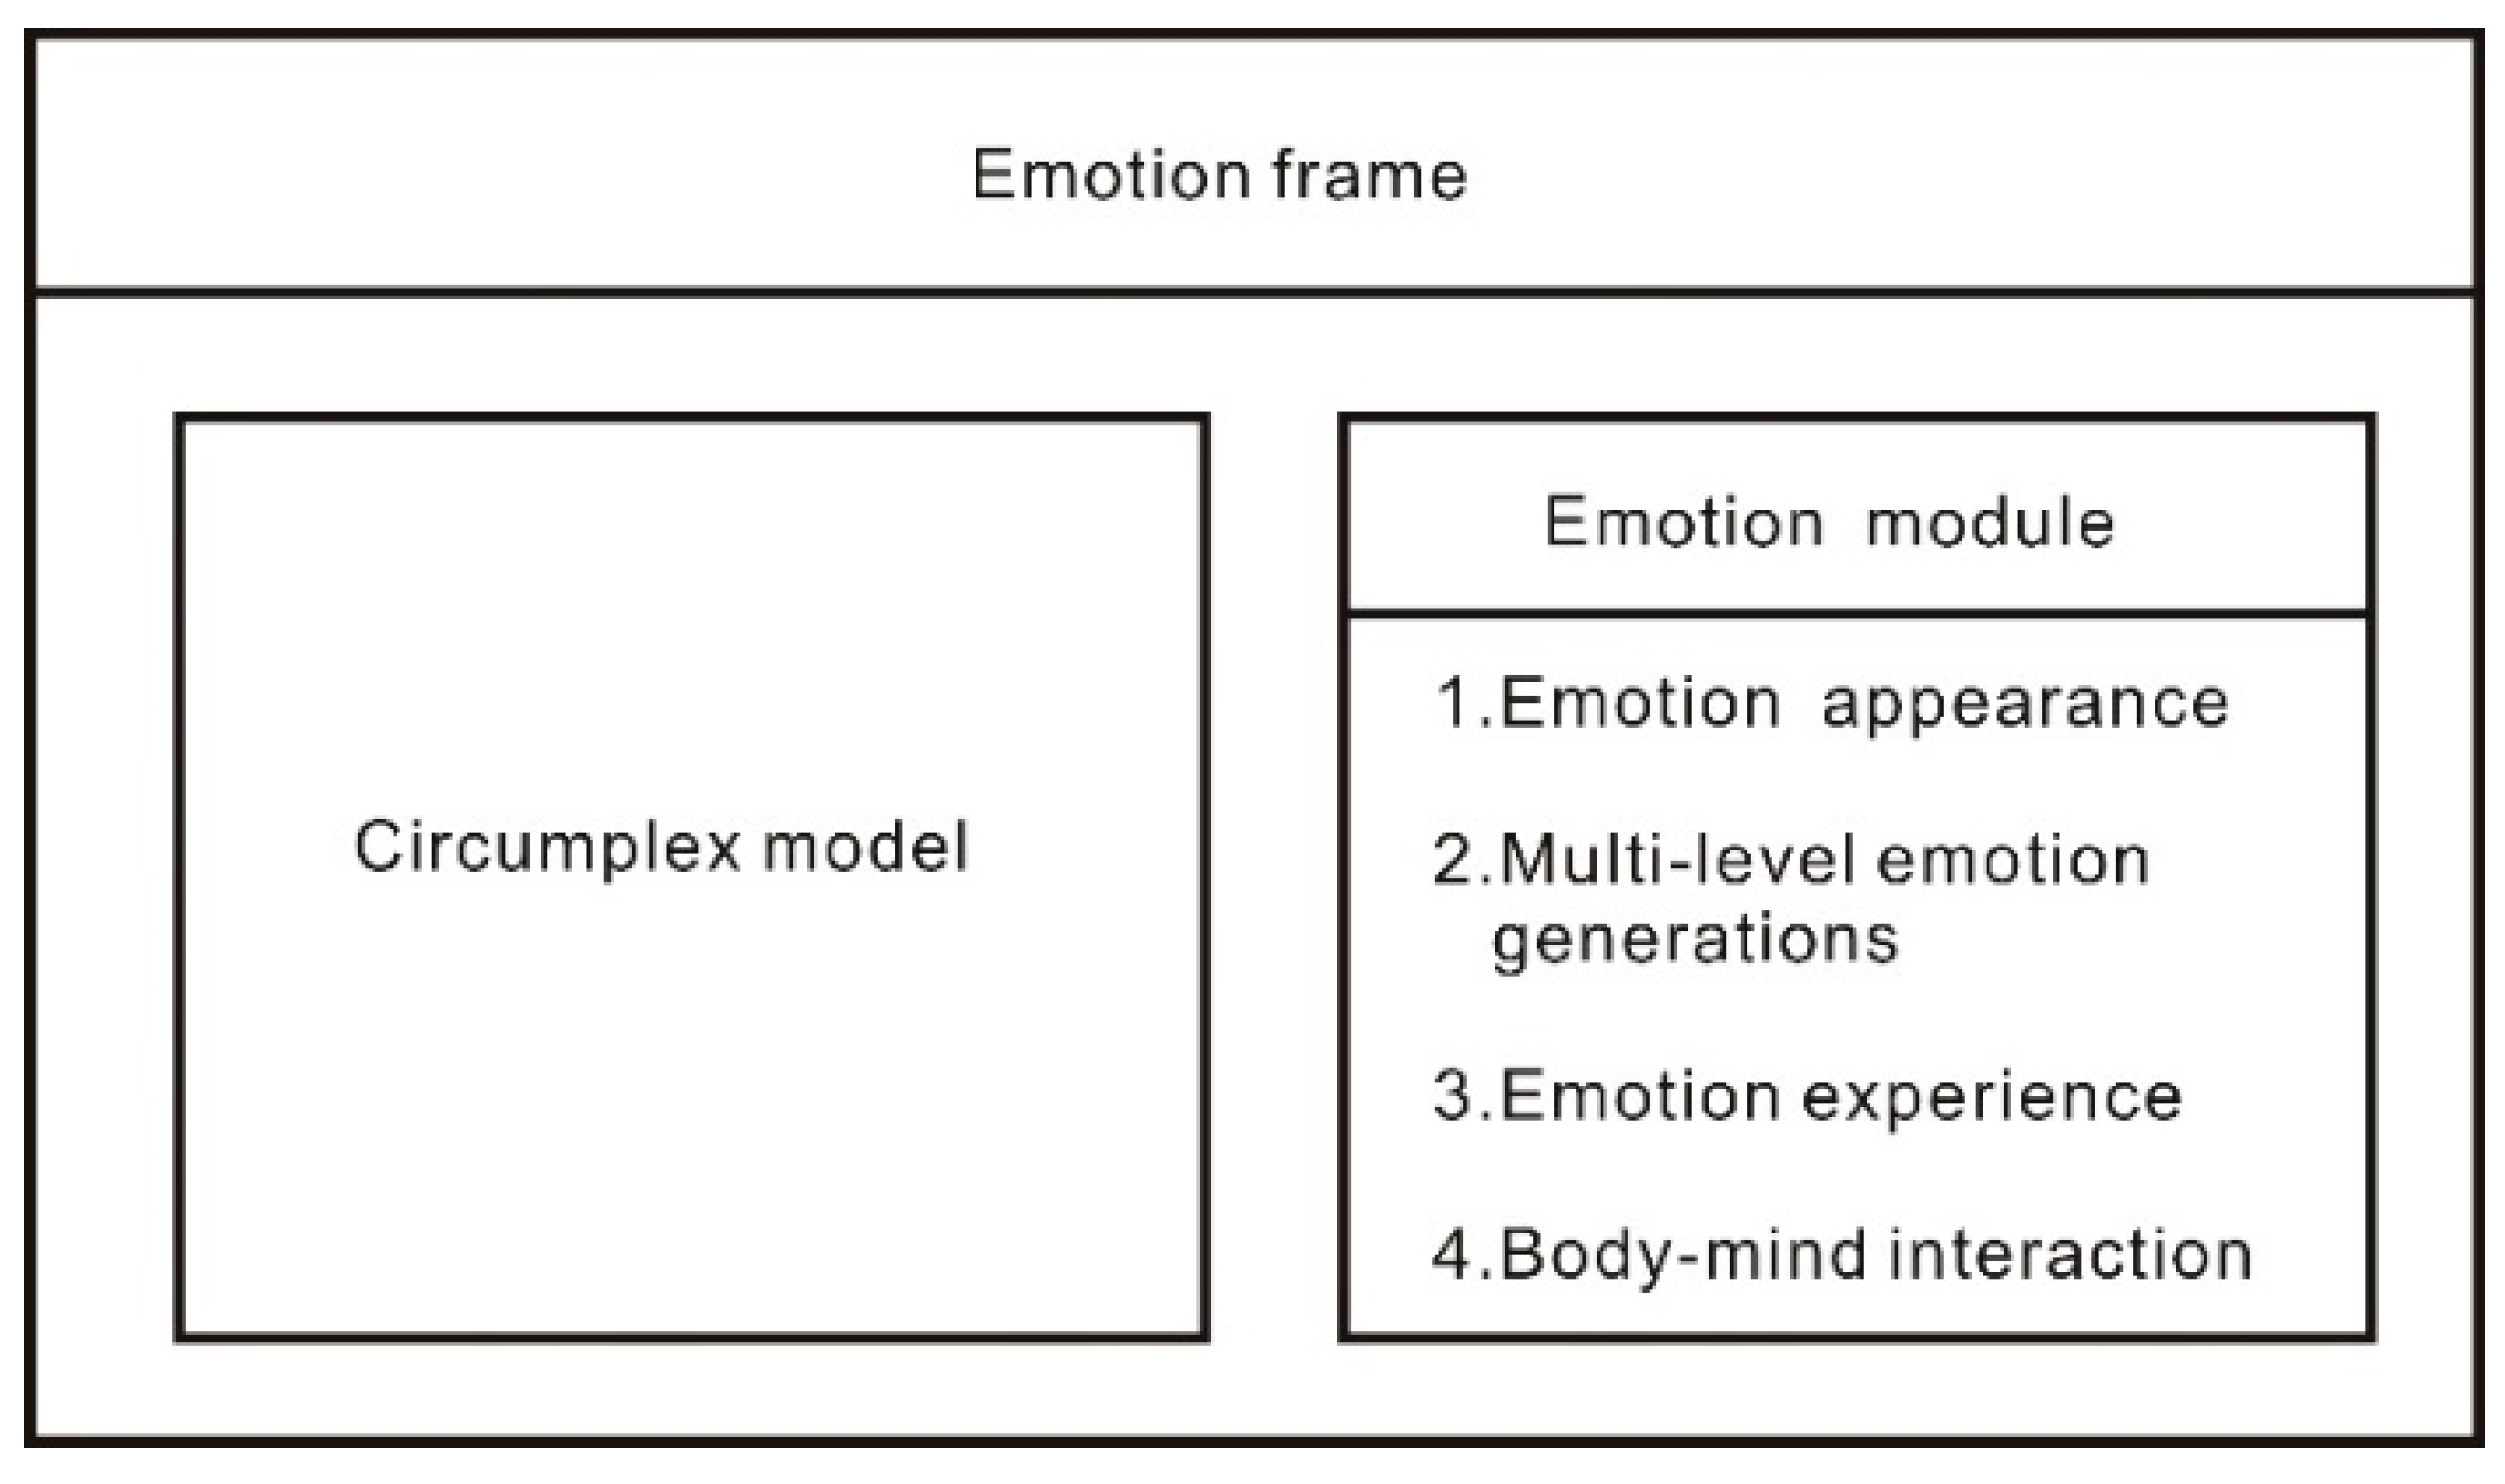
3.1. Assigning Emotions to Smartphones

To assign emotions to smartphones, this study first designed emotion modules in accordance with Picard’s four motivations for enabling machines to exhibit emotion. Then, the circumplex model was adopted as the framework for the expression of emotions. The emotion modules were designed to perform affective computing in a two-dimensional emotional space (Figure 1).

3.1.1. Developing Emotional Expression

Russell represented emotional expression by using a spatial model in which affective concepts fall in a circle in the following order: pleasure, 0°; excitement, 45°; arousal, 90°; distress, 135°; displeasure, 180°; depression, 225°; sleepiness, 270°; and relaxation, 315° [20]. The present study employed Russell’s circumplex model of affect as the foundation for constructing a two-dimensional integer space containing valence and arousal dimensions, which are represented on the horizontal and vertical axis, respectively. The center of the space represents the origin (0, 0). According to an analysis of system requirements, a clear correspondence between emotions and behaviors should be achieved. To satisfy this requirement, the system must convert quantitative emotional data into categories of emotions. In the aforementioned emotion coordinates, each quadrant covers 45°; thus, the two-dimensional space is divided into eight categories of emotions. The first to fourth quadrants represent happiness/joy, anger/dissatisfaction, sadness/pain, and calmness/peace, respectively (Figure 2).

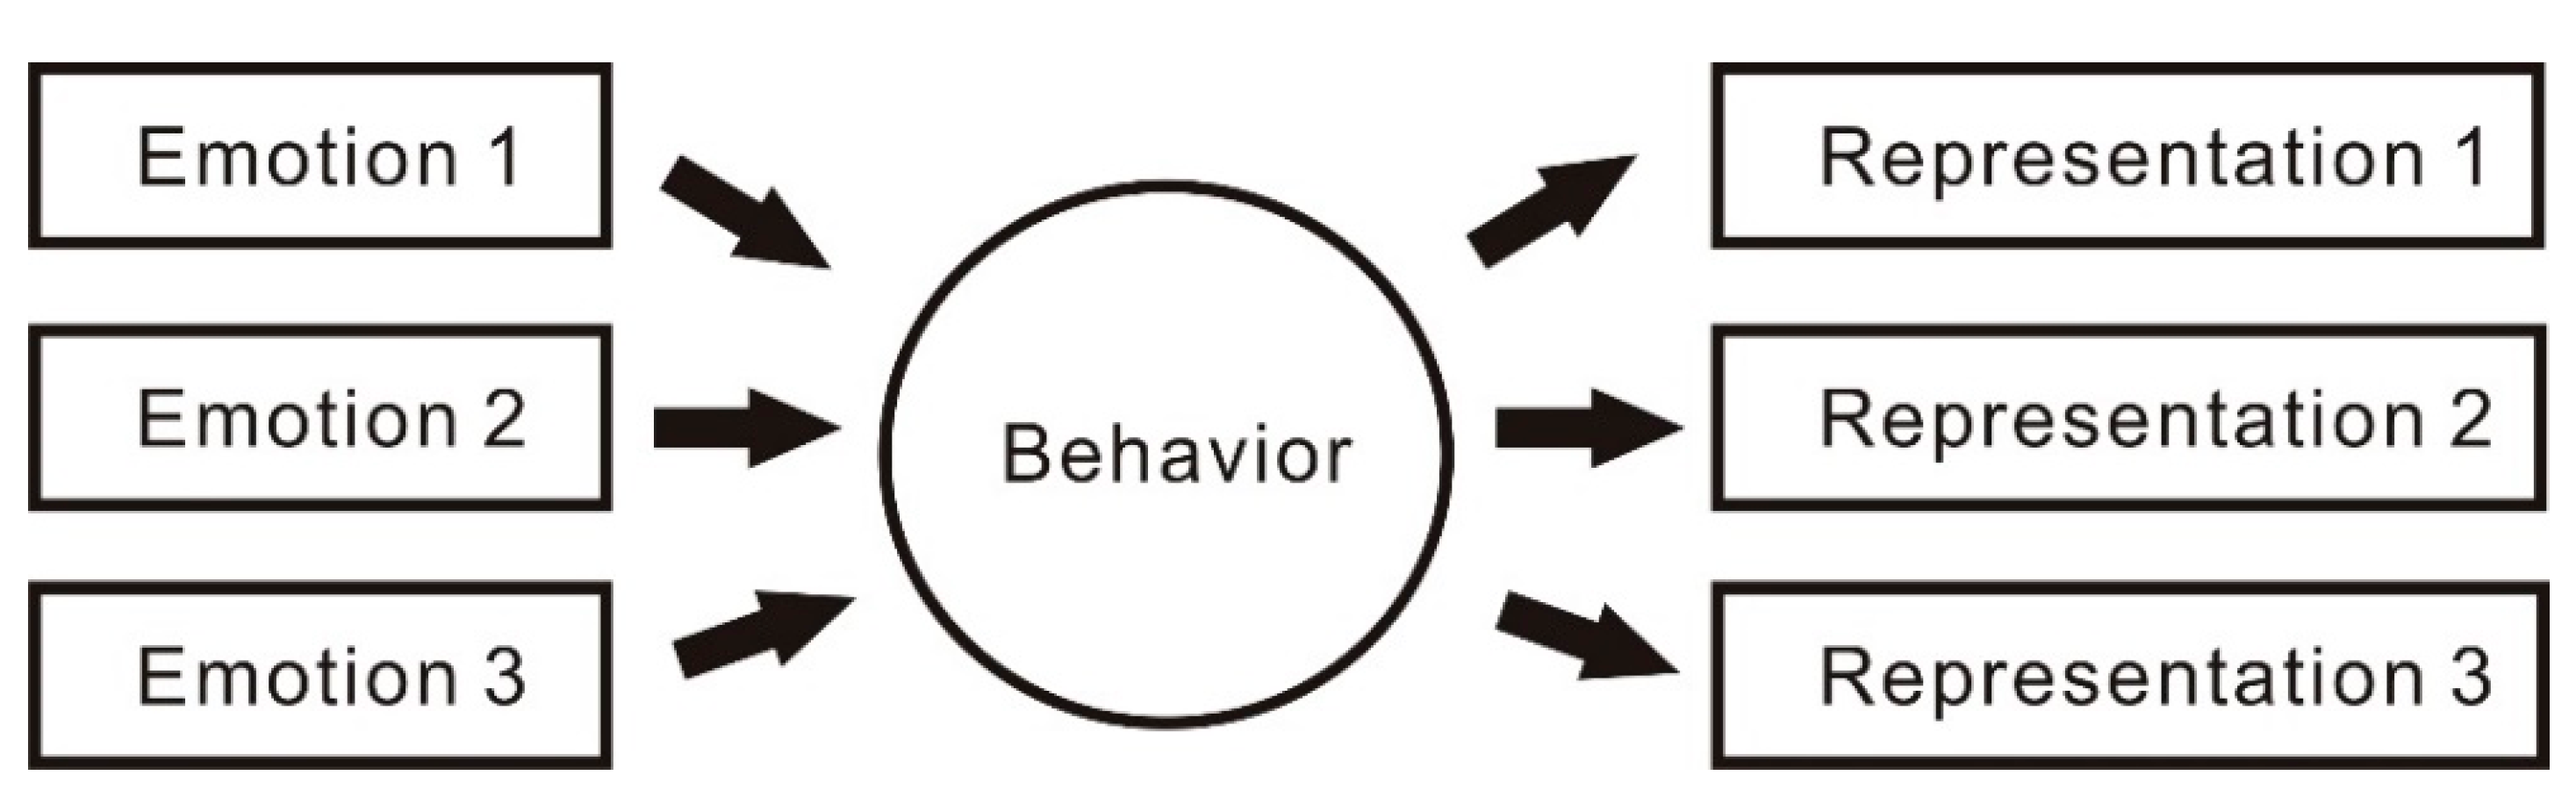
3.1.2. Developing Emotional Representation

Machines should exhibit emotions in a unique manner, and different emotions for the same behavior should have different manifestations (Figure 3).
The agent built within the system can express the emotional state and activities of the system. The agent follows a certain schedule and plans specific activities for each time period. An agent’s engagement in certain activities determines the emotional state of the system, projects it to the activities in practice, and results in the generation of emotional representations (Figure 4).
According to the principle of emotion representation, different emotions may correspond to the same behavior, producing different representations. Each activity corresponds to eight types of emotions. Thus, each activity will have eight emotion representations. There are 12 types of activity items and 8 types of emotions in this system. Based on the principle of emotion representation, the system produces 96 emotion representations. At each specific time, the agent has a type of activity to be performed. However, if the same activity is performed throughout the day, the activity of the agent is the same throughout the day for the user, resulting in no variability. The system sets the activity category as an activity collection, and each activity collection contains an activity subcollection. For example, let us consider the activity collection of eating. Its subcollection will include eating French fries, eating burgers, eating cake, etc. Therefore, users will observe different agent activities at the same time on different days.

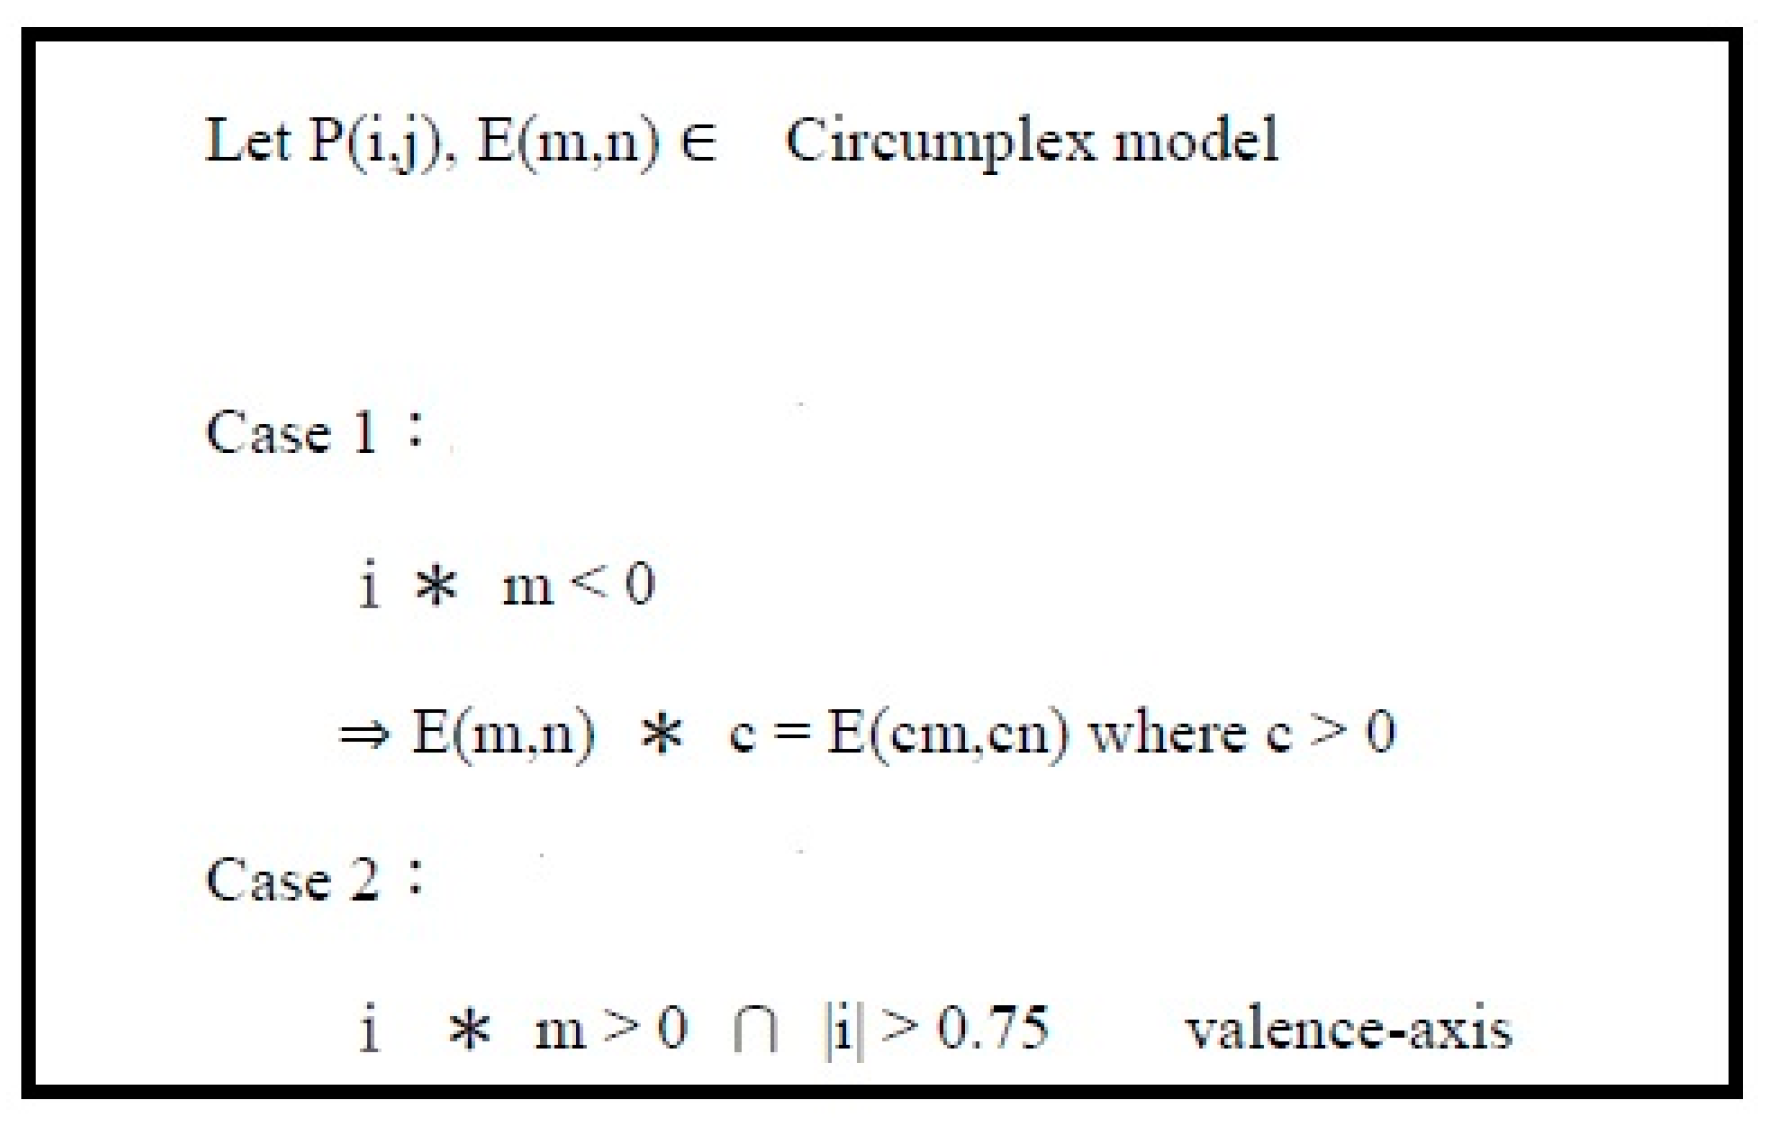
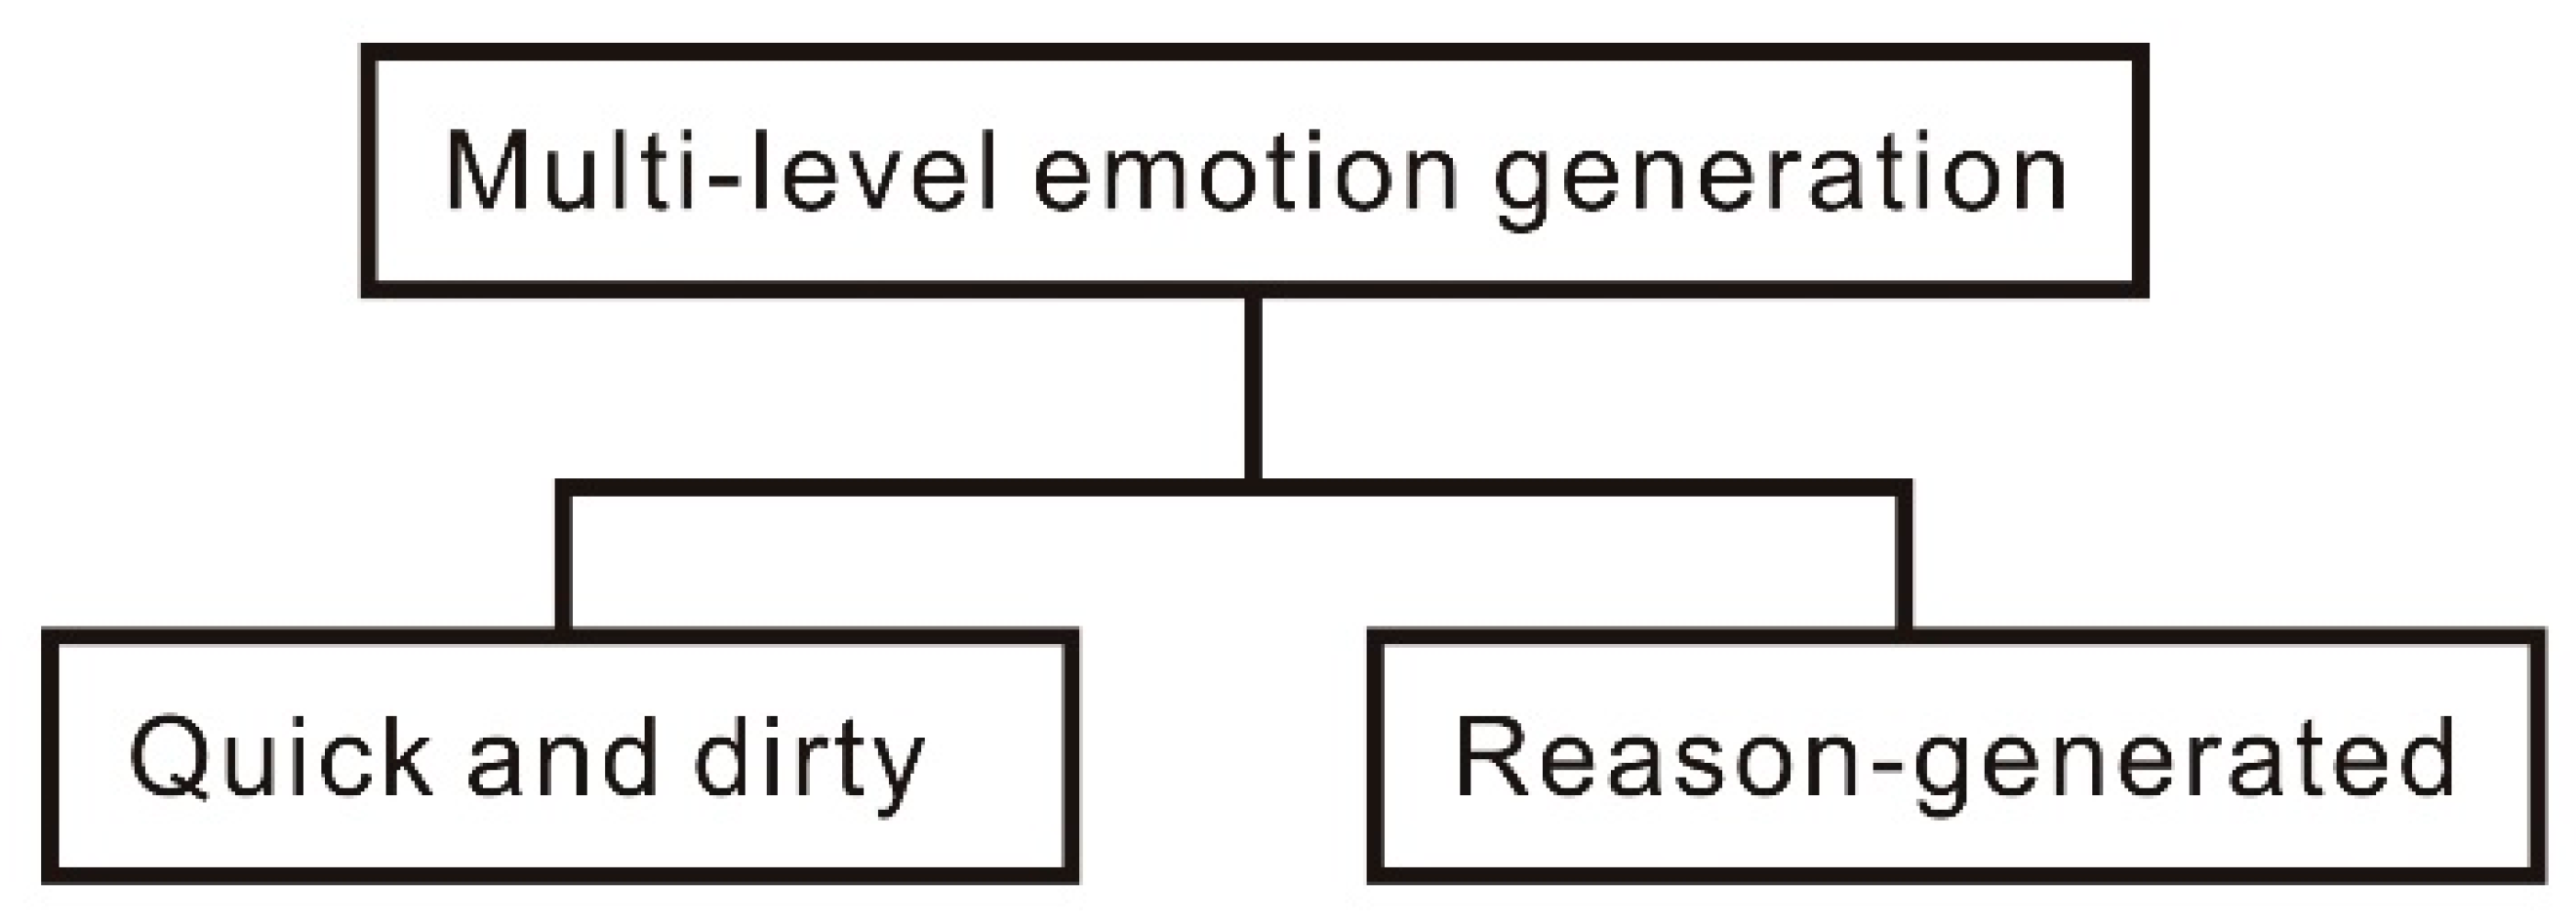
3.1.3. Principles for Multidimensional Emotion Generation

According to the concept of multidimensional emotion generation, emotions can be generated through various methods. Multidimensional emotions were generated in this study through the adoption of the reason-generated operation and the quick and dirty method proposed by Picard [12]. Specifically, this study’s system operates as follows. First, reason-generated events trigger Picard’s algorithm. The system then processes the emotional parameters of the emotional event table and determines the system’s present emotional state through the circumplex model. Picard’s algorithm is subsequently executed to obtain the new emotional parameters of the events. The emotional event table is then updated with the new parameters in accordance with the principle of reason-generated operation (Figure 5).
The quick and dirty method was implemented according to the emotional event table with timely responses (Table 1). Quick and dirty events prompted the system to generate emotional representations rapidly without updating the emotional event table (Figure 6).

3.1.4. Developing Emotional Experiences

Emotional experience implies that a machine can recognize an event it had encountered and knows which emotional reactions that type of event typically elicits. The proposed system is a practical cognitive module. First, it establishes an emotional event table to classify an unfavorable smartphone event and record the emotional parameters induced by this event. The combination of emotional parameters induced by an unfavorable event is termed an emotional event table (Table 2).
An emotional event stores the parameters of state events, and emotional events must be mapped to a two-dimensional emotional space. The lengths of the horizontal and vertical axes are related to the absolute values of the parameters of all events constituting an emotional event. According to the initial parameters of the emotional event in Table 2, the horizontal axis length (valence) of the two-dimensional emotional space in the developed system is 31, and the vertical axis length (arousal) is 37. The system event is divided into categories such as battery status, network status, memory status, storage space status, and incoming call notification. Four battery statuses exist, namely: above 75%, 50–75%, 25–50%, and below 25%. A battery level of 25% or lower is a quick and dirty event. Four memory statuses exist: above 75%, 50–75%, 25–50%, and below 25% memory use. Memory use of above 75% is a quick and dirty event. Four storage space statuses exist, namely: above 90%, 70–90%, 40–70%, and below 40% storage use. The memory card has no direct influence on the smartphone status, thus no quick and dirty events related to storage are handled by the system. The network status event category has two subcategories, namely increased and decreased network traffic. The system regularly calculates the network traffic and records the average traffic during different periods. When the average flow rate in an interval increases, the system triggers an event that increases the flow rate. When the average flow rate in an interval decreases, the system triggers a flow decrease event. The call notification setting is also set as an emotional event. When the smartphone receives an incoming call, the system triggers an emotional event. This emotional event has no parameters for positive and negative emotions; it only has emotional intensity parameters.
Whenever events that are unfavorable to the smartphone occur, the system identifies the corresponding emotional event from the emotional event table and obtains the corresponding emotional parameter. The system may also update the emotional event with new emotional parameters according to the principle of reason-generated operation.

3.1.5. Developing Psychophysical Interactionism

Psychophysical interactionism refers to the interaction between the software and hardware conditions of a machine. The emotions of a machine are affected when both the aforementioned factors are considered. For example, sufficient memory space increases efficiency by providing sufficient time for computation, enables software programs to run smoothly, and ensures that the smartphone remains in a positive emotional state. The emotional event table records software and hardware events. When predicting the system’s emotional responses to specific events, the hardware condition is considered. For example, when a smartphone is completely charged, the system must permit higher memory use to prevent negative emotions arising from increased memory use.

3.1.6. Method for Detecting Smartphone Conditions

In response to changes in a smartphone’s condition, the developed system identifies the emotional event corresponding to the changes and the corresponding emotional parameters from the emotional event table. The developed system is a program that runs in the background and remains visible on the home screen. Therefore, when a user turns on their mobile smartphone, the developed system runs automatically. A priority table comprising emotional events to be prioritized in selection is established by the system. This system and the algorithm serve as the guide for selecting the emotional events triggered by changes in smartphone condition. The system detects the condition of the smartphone through the native battery life tracking and notification functionality of Android systems. Each event detection is associated with a given level of battery.
To establish an event selection mechanism, the developed system divides the battery charge level into three intervals: (1) >75%, (2) 35–75%, and (3) <35%. The events prioritized and selected by the system vary with the battery charge interval. Specifically, if a smartphone falls within the first and second battery intervals, the system prioritizes events with positive and negative emotions, respectively. Under these intervals, when more than one event occurs, the system prioritizes notifications regarding limited storage space, followed by increased network traffic, high smartphone temperature, excessive random-access memory (RAM) usage, and low battery. If none of the aforementioned events occur, the system randomly selects other suitable events that match the condition of the smartphone. When the charge level falls in the third interval, the system prioritizes events with negative emotions. For this interval, when more than one event occurs, the system prioritizes notifications related to increased network traffic, followed by those related to high smartphone temperature, excessive RAM usage, insufficient storage space, and low battery. Because negative events are necessarily highlighted in the third interval, no other emotional events are randomly selected.
Quick and dirty events are prioritized in the selection of unfavorable smartphone events. The quick and dirty events are as follows: battery at <25% charge, >75% of RAM used, overheating battery, battery being charged, an incoming call, and the system having a negative emotional state when the smartphone is being charged in sleep mode. If two events occur simultaneously, the developed system prioritizes notifications in the following order: incoming call, the system having a negative emotional state when the smartphone is being charged in sleep mode, battery being charged, battery at <25% charge, overheating battery, and >75% of RAM used. Such prioritization ensures event uniqueness when multiple quick and dirty events occur simultaneously.

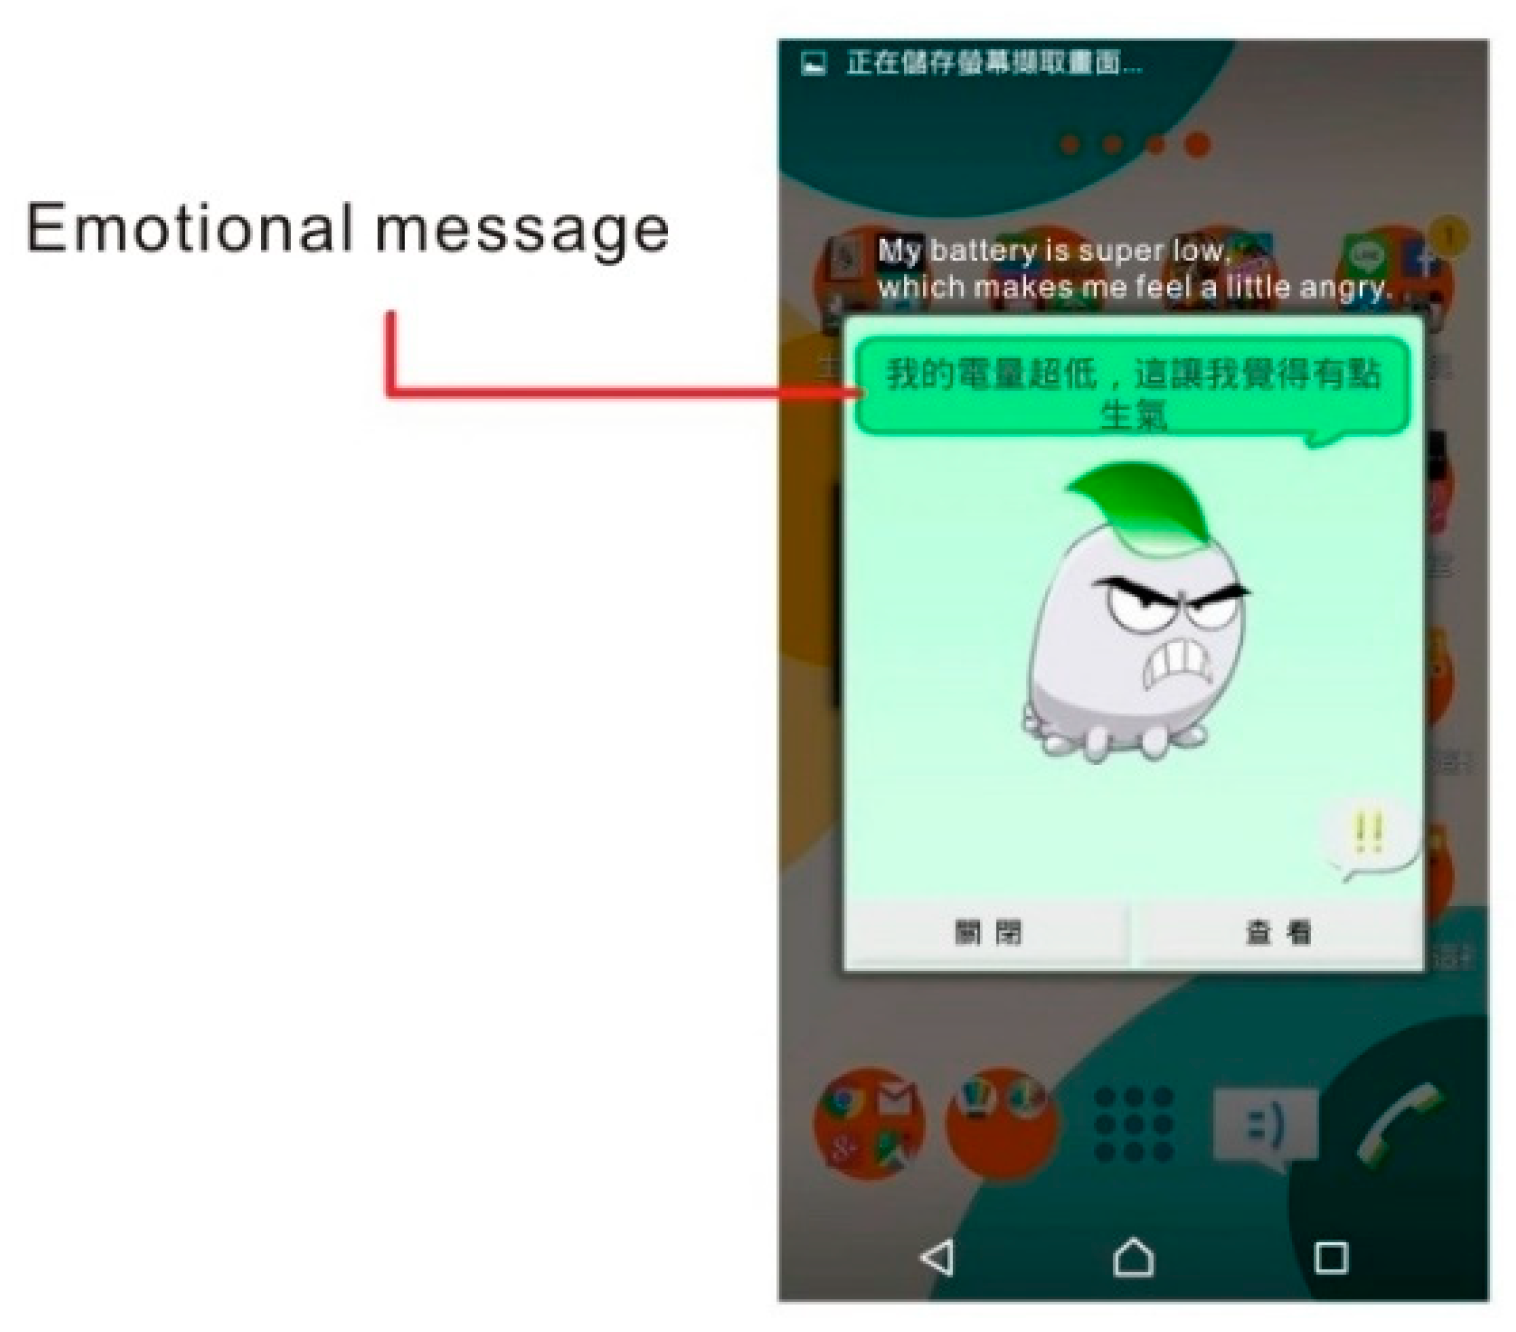
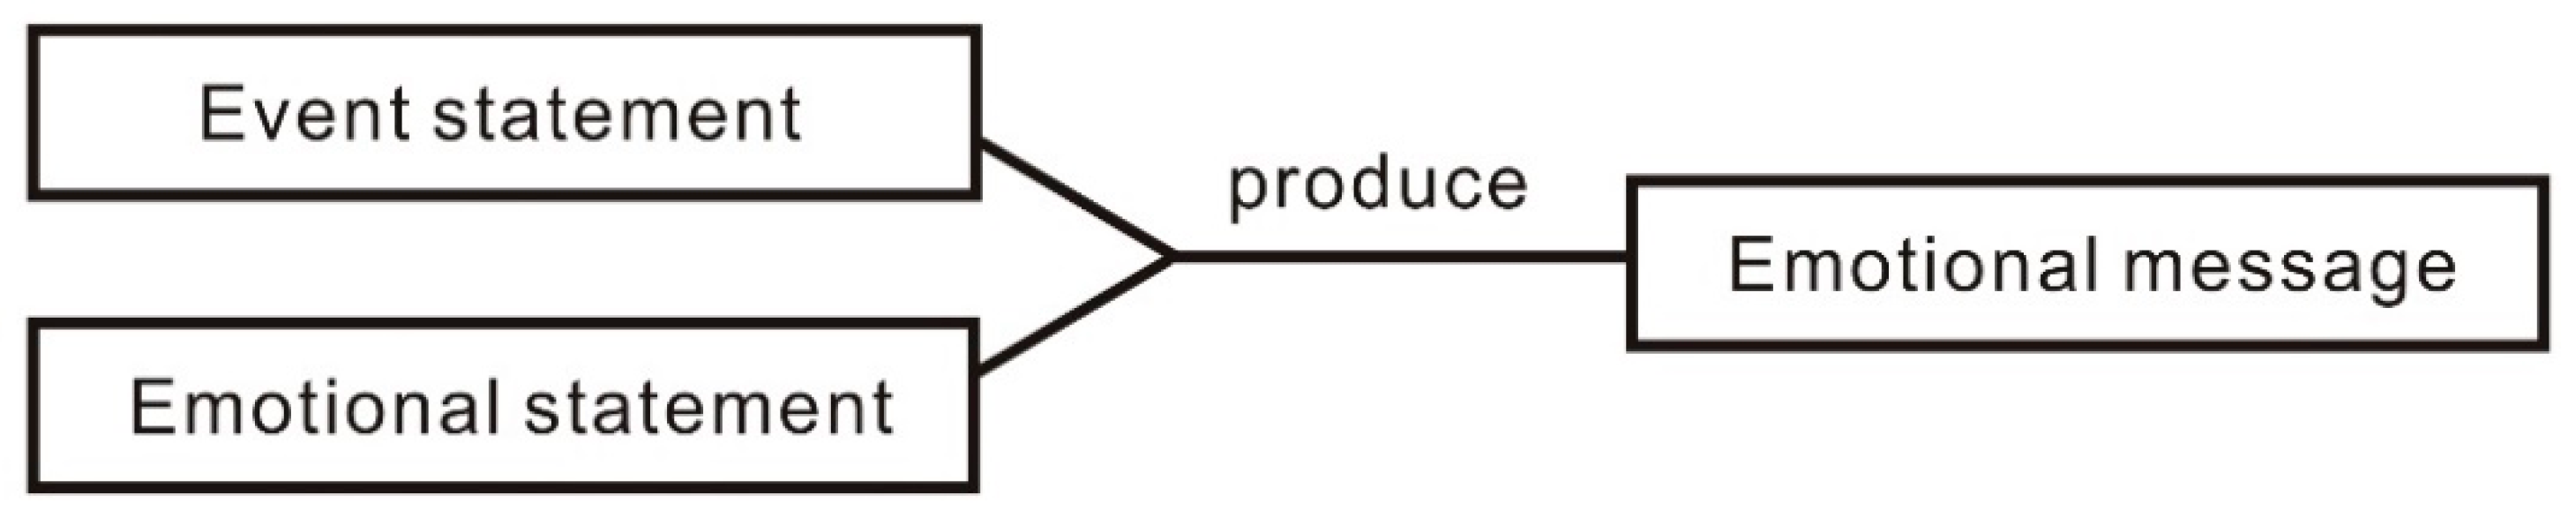
3.2. Assigning Emotions to Messages

According to the function of the developed system, a message pertaining to the smartphone’s condition is generated by the system. For example, when a large amount of memory is used, the system provides a corresponding notification to the user in the form of a text message containing emotional phrases. The types of emotions in text messages are determined by the system’s present emotion (Figure 7).
After a user clicks on the system agent, the agent provides a few sentences of feedback that comprises two parts. The first part describes the present condition of the smartphone, and the second part describes the system’s current emotional state (Figure 8).
The messages sent by the developed system depend on the events that occur and the system’s emotions. Sentences about such events contain emotional parameters, and events are divided into positive and negative events according to the system’s emotions. Sentences about emotions are, by nature, positive or negative. Therefore, the following four combinations are produced through the combination of sentences about events and emotions: positive–positive, positive–negative, negative–positive, and negative–negative. The system redefines these four combinations into two categories: consistent and inconsistent. Consistency between sentences about an event and emotions suggests that the event and emotional state elicit the same emotions (positive or negative).

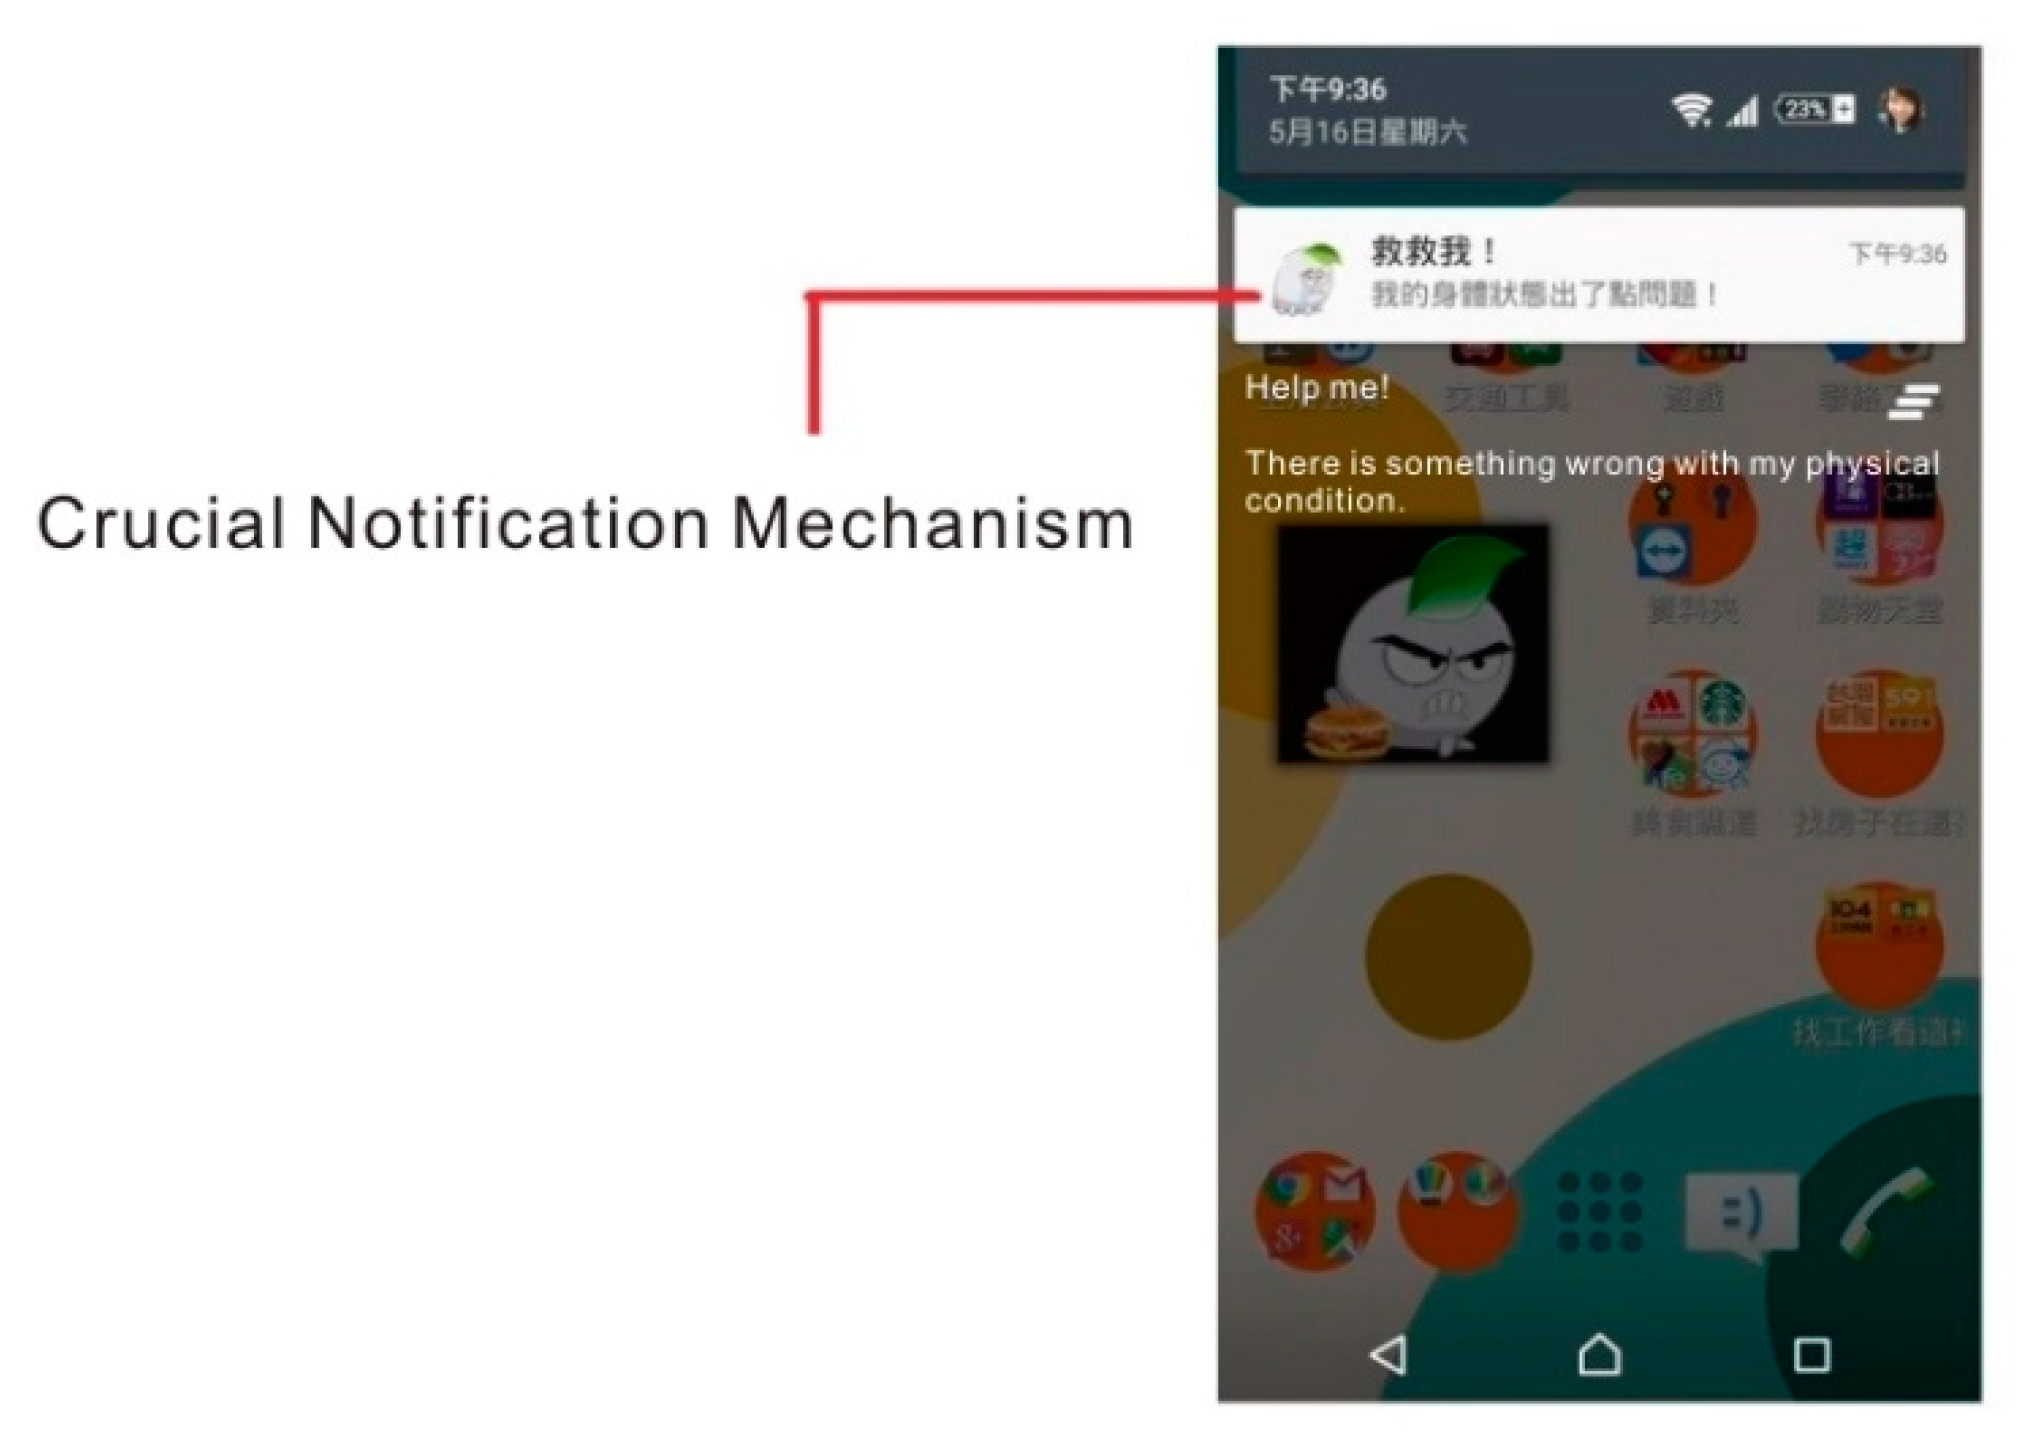
3.3. Developing a Crucial Notification Mechanism

On the basis of the push notification function native to the Android operating system, a crucial notification mechanism was designed for the developed system. The developed system uses push notifications to highlight events with negative emotional parameters (Figure 9).
The system’s notification mechanism was designed to determine whether users are prompted by crucial notifications to follow related instructions and complete a specific action. A schematic of the system’s software architecture is shown in Figure 10, in which four modules are displayed.
The event detector is a module for detecting the smartphone’s condition. The event getter in the aforementioned module, which is driven by the operating system, determines the current state of the smartphone according to the order specified in the priority table to define the smartphone’s condition. The event getter can notify users of any changes in the smartphone’s condition by sending crucial notifications. Once users have read these notifications, the system tracks their follow-up actions, that is, whether they follow the instructions and complete a specific action.
The event detector transfers the smartphone’s condition to a cognitive module of emotions called “consciousness.” The consciousness module matches the smartphone condition with an event in the emotional event table. Conditions identified as quick and dirty events are then forwarded to the Emo-handler module, whereas those identified as reason-generated events have their parameters reset according to the principle of affective computing. The emotional event table is then updated with new emotional parameters, which is then forwarded to the emo-handler module.
On the basis of James Russell’s emotional expression method, the emo-handler module executes events and affective computing. After receiving information regarding an event from the consciousness module, the emo-generator projects the event onto a two-dimensional emotion space to determine the present emotions of the system; thus, the emo-generator can calculate the emotional parameters of the event and the system emotions to update the emotional state of the system. Subsequently, the event is recorded as a past event in the archive. In addition, the emo-handler module transmits the system’s emotional state to the scheduler module, which converts emotional parameters into categories of emotions. This conversion allows the scheduler module to generate emotional representations effectively. After obtaining the system’s emotions, the scheduler module determines the agent’s current activity table and generates corresponding representations according to the principle of emotional representation.

3.4. Research Tools

3.4.1. System Usability Scale

In this study, the System Usability Scale (SUS) developed by Digital Equipment Co Ltd. in 1986 was used to assess users’ evaluation of the system usability. This scale contains 10 items, and each item is scored using a 5-point Likert scale ranging from 1 to 5. A higher score indicates higher user satisfaction with the system’s usability. The SUS, which is presented in Table A1, is reliable, fast, convenient, and inexpensive [33].

3.4.2. Research Questionnaire

The four dimensions of the research questionnaire are based on the architecture proposed by Picard [34]. The research questionnaire is divided into four parts to (1) test whether users believe that the machine has emotions, and determine to (2) users’ attention to emotional information, (3) users’ interest in emotional information, and (4) the effect of emotional information about users. This questionnaire is answered using a 5-point Likert scale ranging from 1 to 5. In this study, expert interviews were conducted in three rounds by using the Delphi method [35]. The experts had expertise in different fields, such as affective computing, interaction design, and user experience. Through factor analysis, the researchers selected 18–23 items for which consensus was reached among the experts. The research questionnaire is presented in Table A2.

4. Research Results and Analysis

4.1. Reliability Analysis

This study involved 124 individuals as participants, among which there were 62 males and 62 females. These individuals were college students between the ages of 20 and 25 years, all of whom had experience in using smartphone applications and had been using smartphones for at least one year. Among the participants, 32 had knowledge about affective computing, whereas the remaining participants had no experience with affective computing systems. The experiment lasted for 2 weeks. The research questionnaire’s reliability was evaluated using Cronbach’s α. The Cronbach’s α value ranges between 0 and 1. The criteria for identifying the internal consistency of a questionnaire are presented in Table 3. The questionnaire used in this study had excellent reliability (α = 0.914, Table 4). The reliability of the research questionnaire for different aspects is presented in Table 5. The questionnaire had high reliability for all the considered aspects.

4.2. Descriptive Statistics

4.2.1. Existence of Emotions in Machines

For items regarding participant perceptions of whether the machine had emotions, the overall mean score provided by the participants was 3.6, with a standard deviation (SD) of 0.6 and a standard error (SE) of 0.1. A total of 76 participants provided above-average scores, and 48 participants provided below-average scores (Table 6).
The mean scores for all the items regarding the existence of emotions in machines were >3 points. The frequency distribution results for the existence of emotions in machines are presented in Table 7. The modal scores of Q1 and Q3 was “agree”, and the Q2 score was “neutral,” which indicates that most of the participants perceived their machines to have emotions.

4.2.2. Attention Paid to Emotional Messages

For items regarding the attention paid to emotional messages, the participants provided an overall mean score of 3.0, with an SD of 0.8 and an SE of 0.1. A total of 72 participants had above-average scores, and 52 participants had below-average scores (Table 8).
The mean scores of all the items regarding the attention paid to emotional messages were >3 points. Table 9 presents the frequency distribution results for items regarding the attention paid to emotional messages. The modal score of Q6 and Q8 was “agree”; that of Q4, Q5, and Q7 was “neutral”; and that of Q9 was “strongly disagree.” This is not a positive result on a 5-point Likert scale; thus, on average, the participants did not pay attention to the emotional information provided by the system. The participants paid attention to emotional messages when the agent was in sight. Although the participants were willing to read the emotional messages produced by the system, they tended not to open the system when the agent was not in sight. Some participants voluntarily turned on their smartphones to check the system’s emotions.

4.2.3. Interest in Emotional Messages

For items regarding user interest in emotional messages, the participants had an overall mean score of 3.5, with an SD of 0.8 and an SE of 0.2. A total of 80 participants had above-average scores, and 44 participants had below-average scores (Table 10).
The mean scores of all the items regarding user interest in emotional messages were >3 points. The frequency distribution results for items regarding user interest in emotional messages are presented in Table 11. The modal score of Q10, Q11, and Q12 is “agree.” For Q11, 54% of the participants agreed that emotional information is interesting, which is a positive result on a 5-point Likert scale. This result indicates that participants were generally interested in the emotional message compiled by the system.

4.2.4. Effects of Emotional Messages

For items regarding the effects of emotional messages, the participants had an overall mean score of 3.5, with an SD of 0.7 and an SE of 0.1. A total of 72 participants had above-average scores, and 52 participants had below-average scores (Table 12).
The mean scores of all items regarding the effects of emotional messages were >3 points. The frequency distribution results for the aforementioned items are presented in Table 13. The modal score of Q13, Q14, Q15, Q16, and Q18 was “agree,” whereas that of Q17 was “disagree,” which represents a positive result on a 5-point Likert scale. The aforementioned result indicates that emotional messages affected most users and prompted them to reexamine and be mindful of their smartphone usage habits. Moreover, participants who read the emotional messages, which served as a trigger for reflections, reflected on their smartphone usage habits.

4.2.5. System Usability

For items regarding system usability, the participants had an overall mean score of 4.1, with an SD of 0.5 and an SE of 0.1. A total of 60 participants had above-average scores, and 64 participants had below-average scores (Table 14).
The total score for the aforementioned items was 78.1 points, which indicated that most of the participants found the developed system to have acceptable usability and be unobtrusive in terms of daily smartphone use (Table 15).

4.2.6. View Rate of Crucial Notifications and Instruction Execution Rate

Information on crucial notifications was obtained from the operation data collected by the developed system. During the experiment, 11,264 crucial notifications were generated, of which 8636 were viewed by the participants. The overall view rate of crucial notifications was 76.6%, and 7672 instructions were executed to resolve unfavorable smartphone conditions and restore the device to normal conditions. The overall instruction execution rate was 68.1%. In this study, a high view rate of the system’s crucial notifications and a high instruction execution rate were achieved.

4.3. Experimental Results

4.3.1. Factors Influencing the Participants’ Perception of Emotions in Machines

The participants provided a mean score of 3.0 for items regarding the attention paid to emotional messages. However, this study revealed that the participants rarely paid active attention to emotional messages and were sometimes indifferent toward these messages. Thus, the developed system’s emotional messages can be improved. The participants provided a mean score of 3.6 for items related to their perception regarding whether their machine had emotion. Generally, those who devote much attention to emotional messages tend to perceive that their machine has emotions.

4.3.2. Participants’ Attitudes toward Emotional Messages

The participants had a mean score of ≥3.0 for items regarding their interest toward emotional messages and the effects of emotional messages. Moreover, the modal score for these items was satisfactory. However, the participants generally did not pay sufficient attention to emotional messages. This result implies that the influence of messages on users is determined by how interested users are in these messages. A high score on the effects of emotional messages indicates the system’s effectiveness in arousing user interest. Therefore, the effectiveness of emotional messages can be enhanced by increasing user interest in them.

4.3.3. Effects of Crucial Notifications on User Behavior

The view rate of crucial notifications was 76.6%, and instruction execution rate was 68.1%. These results indicated that user behavior was affected by the emotions of the system. The instruction execution rate was high because most of the participants were convinced that their machine had emotions, and they were willing to reflect on the emotional messages they received.

4.3.4. Research Limitations

This study recruited students enrolled in the general education courses of a university as the research participants. Therefore, the study results could only reflect the characteristics of the student population in the university and the region where the university is located. To address this limitation, future scholars should increase their sample size and diversify the participants in their research. Additionally, the system used in this study is only operable using Android devices and does not work on iOS devices. Therefore, future designs should account for compatibility with iOS devices. This will allow more users to operate the proposed system.
Picard posited that for machines to possess emotions, they must contain the following components: emergent emotion and emotional behavior, fast primary emotion, cognitive-generated emotion, emotional experiences, cognitive awareness, physiological awareness, subjective feelings, and body–mind interaction. Accordingly, this study employed these components to construct the proposed system. Picard also asserted standards should be developed to evaluate the performance of these components. The present researchers will further explore such standards in their future studies.

5. Conclusions

The experimental findings of this study indicate that compared with the participants’ interest in emotional messages, the degree of attention paid by them to emotional messages more substantially affected their perception of whether their machine had emotions. Therefore, developers should focus on enhancing such attention to make users more willing to receive emotional messages or even click on the agent voluntarily to receive emotional messages. After attracting user attention, program designers should enhance the influence of emotional messages on users by appropriately designing the content of these messages, thereby persuading users that the emotion system gives their machine the ability to express emotions. The frequency of push notifications should not be excessively high. If this frequency is excessively high, users’ willingness to receive emotional messages may decrease. In the future, researchers should first design an effective method for emotional expression and then appropriately design the content of emotional messages. Moreover, the system should affect user behavior by convincing users that their machine has emotions. Finally, the degree of attention paid to emotional messages determines the quality of an emotion system, and researchers and designers should bear this in mind. In future, we hope that this system can be used in medicine to help people with long-term emotional distress achieve “micro-intervention” psychotherapy to improve their mood. “Micro-interventions,” such as breathing training and visualization, allow the subjects to use various adopted or more modern psychotherapy practice modes [36]. Further, it helps the elderly achieve a better experience in using smartphones and a sense of intimacy similar to younger people.

Author Contributions

Formal analysis, H.-C.K.L.; Data curation, Y.-C.M.; Writing—original draft, H.-C.K.L., Y.-C.M. and M.L.; Writing—review & editing, H.-C.K.L., Y.-C.M. and M.L.; Methodology, Y.-C.M. All authors have read and agreed to the published version of the manuscript.

Funding

This research received no external funding

Conflicts of Interest

The authors declare there are no conflict of interest.

Appendix A

Table A1. System usability scale.
ItemsDescriptions-
1I think that I would like to use this system frequently.12345
2I found the system to be unnecessarily complex.12345
3I thought the system was easy to use.12345
4I think that I would need the support of a technician to use this system.12345
5I found the various functions in this system to be well integrated.12345
6I think that excessive inconsistency exists in this system.12345
7I believe that most people would learn to use this system very quickly.12345
8I found the system to be very cumbersome to use.12345
9I felt very confident using the system.12345
10I had to learn many things before I could begin using this system.12345
Table A2. Research questionnaire.
ItemsDescriptions-
1When the smartphone expresses emotions, I feel as if the smartphone is alive.12345
2Irrespective of whether the smartphone has emotions, I have the same view of the smartphone.12345
3I care about the emotions of the smartphone.12345
4Every time I turn on the smartphone, I often observe the emotions of the smartphone.12345
5Even if I see the system’s emotion icon, I may not always check its emotions.12345
6After closing other apps, if I see the agent of the system, I pay attention to the emotions of the smartphone.12345
7I turn on the smartphone specifically to check emotional messages.12345
8When I think about the emotions of the smartphone, I do not turn on the smartphone.12345
9Sometimes, I turn on the smartphone simply to check the agent’s emotions.12345
10I pay attention to the messages and emotional statements of the system.12345
11I am not interested in the messages and emotional statements of the system.12345
12I am curious about the emotional state of the system.12345
13After reading the message of the system, I think about what makes the smartphone produce such emotions.12345
14Even if I read the messages of the system, I do not understand the reason why the mobile smartphone produces such emotions.12345
15After reading the information of the system, I can understand why the smartphone has negative or positive emotions.12345
16The information provided by the system indicates the ways in which I should avoid using my smartphone.12345
17The information provided by the system does not cause me to change the way I use my smartphone.12345
18I adjust how I use my smartphone according to the information provided by the system and guess the emotions that the smartphone may generate.12345

References

  1. Tang, G.; Shi, Q.; Zhang, Z.; He, T.; Sun, Z.; Lee, C. Hybridized wearable patch as a multi-parameter and multi-functional human-machine interface. Nano Energy 2021, 81. [Google Scholar] [CrossRef]
  2. Gadzama, W.; Joseph, B.; Aduwamai, N. Global smartphone ownership, internet usage and their impacts on humans. J. Commun. Net. 2017, 1. Available online: http://www.researchjournali.com/view.php?id=3876 (accessed on 26 January 2021).
  3. Taylor, K.; Silver, L. Smartphone Ownership is Growing Rapidly around the World, but Not Always Equally; Pew Research Center: Washington, DC, USA, 2019. [Google Scholar]
  4. An, T.; Anaya, D.V.; Gong, S.; Yap, L.W.; Lin, F.; Wang, R.; Yuce, M.R.; Cheng, W. Self-powered gold nanowire tattoo triboelectric sensors for soft wearable human-machine interface. Nano Energy 2020, 77. [Google Scholar] [CrossRef]
  5. Xiao, G.; Ma, Y.; Liu, C.; Jiang, D. A machine emotion transfer model for intelligent human-machine interaction based on group division. Mech. Syst. Signal Process. 2020, 142. [Google Scholar] [CrossRef]
  6. Liang, Z.; Oba, S.; Ishii, S. An unsupervised EEG decoding system for human emotion recognition. Neural Net. 2019, 116, 257–268. [Google Scholar] [CrossRef]
  7. Kaklauskas, A.; Kuzminske, A.; Zavadskas, E.K.; Daniunas, A.; Kaklauskas, G.; Seniut, M.; Raistenskis, J.; Safonov, A.; Kliukas, R.; Juozapaitis, A.; et al. Affective tutoring system for built environment management. Comput. Educ. 2015, 82, 202–216. [Google Scholar] [CrossRef]
  8. Dinakaran, K.; Ashokkrishna, E.M. Efficient regional multi feature similarity measure based emotion detection system in web portal using artificial neural network. Microprocess. Microsyst. 2020, 77. [Google Scholar] [CrossRef]
  9. Górriz, J.M.; Ramírez, J.; Ortíz, A.; Martínez-Murcia, F.J.; Segovia, F.; Suckling, J.; Leming, M.; Zhang, Y.-D.; Álvarez-Sánchez, J.R.; Bologna, G.; et al. Artificial intelligence within the interplay between natural and artificial computation: Advances in data science, trends and applications. Neurocomputing 2020, 410, 237–270. [Google Scholar] [CrossRef]
  10. Shi, Y.; Zhang, Z.; Huang, K.; Ma, W.; Tu, S. Human-computer interaction based on face feature localization. J. Vis. Commun. Image Represent. 2020, 70. [Google Scholar] [CrossRef]
  11. Feng, C.M.; Park, A.; Pitt, L.; Kietzmann, J.; Northey, G. Artificial intelligence in marketing: A bibliographic perspective. Australas. Mark. J. 2020. [Google Scholar] [CrossRef]
  12. Picard, R.W. Affective computing: From laughter to IEEE. IEEE Trans. Affect. Comput. 2010, 1, 11–17. [Google Scholar] [CrossRef] [Green Version]
  13. Yadegaridehkordi, E.; Noor, N.F.B.M.; Ayub, M.N.B.; Affal, H.B.; Hussin, N.B. Affective computing in education: A systematic review and future research. Comput. Educ. 2019, 142. [Google Scholar] [CrossRef]
  14. Poria, S.; Cambria, E.; Bajpai, R.; Hussain, A. A review of affective computing: From unimodal analysis to multimodal fusion. Inf. Fusion 2017, 37, 98–125. [Google Scholar] [CrossRef] [Green Version]
  15. Calvo, R.A.; D’Mello, S.; Gratch, J.; Kappas, A. The Oxford Handbook of Affective Computing; Oxford University Press: Oxford, UK, 2015. [Google Scholar]
  16. Nalepa, G.J.; Kutt, K.; Bobek, S. Mobile platform for affective context-aware systems. Future Gener. Comput. Syst. 2019, 92, 490–503. [Google Scholar] [CrossRef]
  17. Shi, Q.; Zhang, Z.; Chen, T.; Lee, C. Minimalist and multi-functional human machine interface (HMI) using a flexible wearable triboelectric patch. Nano Energy 2019, 62, 355–366. [Google Scholar] [CrossRef]
  18. Mao, X.; Li, Z. Agent based affective tutoring systems: A pilot study. Comput. Educ. 2010, 55, 202–208. [Google Scholar] [CrossRef]
  19. Sundström, P.; Ståhl, A.; Höök, K. A user-centered approach to affective interaction. Lect. Notes Comput. Sci. 2005, 1, 931–938. [Google Scholar]
  20. Ståhl, A.; Höök, K.; Svensson, M.; Taylor, A.S.; Combetto, M. Experiencing the affective diary. Pers. Ubiquitous Comput. 2009, 13, 365–378. [Google Scholar] [CrossRef]
  21. Tsutsumi, D.; Gyulai, D.; Takács, E.; Bergmann, J.; Nonaka, Y.; Fujita, K. Personalized work instruction system for revitalizing human-machine interaction. Procedia CIRP 2020, 93, 1145–1150. [Google Scholar] [CrossRef]
  22. Bretan, M.; Hoffman, G.; Weinberg, G. Emotionally expressive dynamic physical behaviors in robots. Int. J. Human Comput. Stud. 2015, 78, 1–16. [Google Scholar] [CrossRef]
  23. Bates, J. The role of emotion in believable agents. Commun. ACM 1994, 37, 122–125. [Google Scholar] [CrossRef]
  24. Ushida, H.; Hirayama, Y.; Nakajima, H. Emotion model for life-like agent and its evaluation. In Proceedings of the 15th National Conference on Artificial Intelligence and 10th Innovative Applications of Artificial Intelligence Conference, Madison, WI, USA, 26–30 July 1998; pp. 62–69. [Google Scholar]
  25. Maria, K.A.; Zitar, R.A. Emotional agents: A modeling and an application. Inf. Softw. Technol. 2007, 49, 695–716. [Google Scholar] [CrossRef]
  26. Posner, J.; Russell, J.A.; Peterson, B.S. The circumplex model of affect: An integrative approach to affective neuroscience, cognitive development, and psychopathology. Dev. Psychopathol. 2005, 17, 715–734. [Google Scholar] [CrossRef]
  27. Savery, R.; Weinberg, G. A survey of robotics and emotion: Classifications and models of emotional interaction. In Proceedings of the 2020 29th IEEE International Conference on Robot and Human Interactive Communication (RO-MAN), Naples, Italy, 31 August–4 September 2020; pp. 986–993. [Google Scholar]
  28. Balzer, W.; Moulines, C.U.; Sneed, J.D. Structuralist Knowledge Representation: Paradigmatic Examples; Rodopi: Amsterdam, The Netherlands, 2000. [Google Scholar]
  29. Woodworth, R.S.; Schlosberg, H. (Eds.) Experimental Psychology; Holt, Rinehart and Winston: New York, NY, USA, 1954. [Google Scholar]
  30. Russell, J.A. A circumplex model of affect. J. Personal. Soc. Psychol. 1980, 39, 1161. [Google Scholar] [CrossRef]
  31. Bradley, M.M.; Greenwald, M.K.; Petry, M.C.; Lang, P.J. Remembering pictures: Pleasure and arousal in memory. J. Exp. Psychol. Learn. Mem. Cogn. 1992, 18, 379. [Google Scholar] [CrossRef]
  32. Watson, D.; Tellegen, A.; Weinberg, G. Toward a consensual structure of mood. Psychol. Bull. 1985, 78, 1–16. [Google Scholar] [CrossRef]
  33. Brooke, J. SUS: A quick and dirty usability scale. In Usability Evaluation in Industry; CRC Press: Boca Raton, FL, USA, 1995; Volume 189. [Google Scholar]
  34. Alepis, E.; Virvou, M. Automatic generation of emotions in tutoring agents for affective e-learning in medical education. Expert Syst. Appl. 2011, 55, 9840–9847. [Google Scholar] [CrossRef]
  35. Bohn, N.; Kundisch, D. What are we talking about when we talk about technology pivots?—A Delphi study. Inf. Manag. 2020, 57. [Google Scholar] [CrossRef]
  36. Meinlschmidt, G.; Tegethoff, M.; Belardi, A.; Stalujanis, E.; Oh, M.; Jung, E.K.; Kim, H.C.; Yoo, S.S.; Lee, J.H. Personalized prediction of smartphone-based psychotherapeutic micro-intervention success using machine learning. J. Affect. Disord. 2020, 264, 430–437. [Google Scholar] [CrossRef]
Figure 1. Emotional framework of the designed system.
Electronics 10 00306 g001
Figure 2. Emotion categories in the vector space.
Electronics 10 00306 g002
Figure 3. Schematic of emotional representation.
Electronics 10 00306 g003
Figure 4. Representations of happiness (left) and pain (right) during eating.
Electronics 10 00306 g004
Figure 5. Principle of reason-generated operation.
Electronics 10 00306 g005
Figure 6. Schematic of multidimensional emotion generation.
Electronics 10 00306 g006
Figure 7. An emotional message generated by the system.
Electronics 10 00306 g007
Figure 8. Schematic of the system message generation method.
Electronics 10 00306 g008
Figure 9. Crucial notification mechanism.
Electronics 10 00306 g009
Figure 10. Schematic of the software architecture.
Electronics 10 00306 g010
Table 1. List of quick and dirty events.
Event ContentPositive and Negative EmotionsIntensity of Emotion
Power < 25%−4−4
RAM dosage > 75%−4−4
Call notification01
Charging12
When the power < 50%, sleeping, and charging23
Table 2. Emotional event table.
Event IdNameValenceArousalQuick and Dirty
1Battery > 7532false
2Battery 50~7511false
3Battery 25~50−1−2false
4Battery < 50−4−4true
5RAM > 751−4true
6RAM 50~75−12false
7RAM 25~5011false
8RAM < 5032false
9Storage > 90−4−4false
10Storage 70~90−1−2false
11Storage 40~7011false
12Storage < 4032false
13Network increased−1−1false
14Network decreased11false
15Temperature good11false
16Overheat−1−1true
17Charging12true
18Call incoming01true
19Sleep-negative charging23true
Table 3. Ranges of Cronbach’s alpha for different categories of internal consistency.
Cronbach’s AlphaInternal Consistency
α ≥ 0.9Excellent
0.9 > α ≥ 0.8Good
0.8 > α ≥ 0.7Acceptable
0.7 > α ≥ 0.6Questionable
0.6 > α ≥ 0.5Poor
0.5 > αUnacceptable
Table 4. Overall reliability of the research questionnaire.
Cronbach’s AlphaInternal Consistency
0.914Excellent
Table 5. Reliability of different aspects of the research questionnaire.
Research OrientationCronbach’s AlphaInternal Consistency
Existence of Emotions in Machines0.790Acceptable
Attention Paid to Emotional Messages0.792Acceptable
Interest Toward Emotional Messages0.707Acceptable
Effects of Emotional Messages0.751Acceptable
System Usability0.807Good
Table 6. Descriptive statistics for items regarding the existence of emotions in machines.
MeanMaxMinSDSE
3.6520.60.1
Table 7. Frequency distribution table for items regarding the existence of emotions in machines.
ItemStrongly DisagreeDisagreeNeutralAgreeStrongly Agree
Q10032 (25%)68 (54%)24 (19%)
Q2020 (16%)72 (58%)24 (19%)8 (6%)
Q308 (6%)40 (32%)60 (48%)16 (12%)
Table 8. Descriptive statistics for items regarding the attention paid to emotional messages.
MeanMaxMinSDSE
3510.80.1
Table 9. Frequency distribution table for items regarding the attention paid to emotional messages.
ItemStrongly DisagreeDisagreeNeutralAgreeStrongly Agree
Q4036 (29%)40 (32%)28 (22%)20 (16%)
Q58 (6%)24 (19%)40 (32%)32 (25%)20 (16%)
Q68 (6%)12 (9%)28 (22%)48 (38%)28 (22%)
Q728 (22%)28 (22%)40 (32%)20 (16%)8 (6%)
Q84 (3%)16 (12%)48 (38%)48 (38%)8(6%)
Q948 (38%)28 (22%)28 (22%)16 (12%)4 (3%)
Table 10. Descriptive statistics for items regarding user interest in emotional messages.
MeanMaxMinSDSE
3.5510.80.2
Table 11. Frequency distribution table for items regarding user interest in emotional messages.
ItemStrongly DisagreeDisagreeNeutralAgreeStrongly Agree
Q1012 (9%)16 (12%)24 (19%)56 (45%)16(12%)
Q114 (3%)12 (9%)40 (32%)68 (54%)0
Q128 (6%)12 (9%)28 (22%)48 (38%)28 (22%)
Table 12. Descriptive statistics for items regarding the effects of emotional messages.
MeanMaxMinSDSE
3.5510.70.1
Table 13. Frequency distribution table for items regarding the effects of emotional messages.
ItemStrongly DisagreeDisagreeNeutralAgreeStrongly Agree
Q134 (3%)12 (9%)16 (12%)56 (45%)36 (29%)
Q14016 (12%)32 (25%)56 (45%)20 (16%)
Q154 (3%)16 (2%)8 (6%)60 (48%)36 (29%)
Q164 (3%)8 (6%)36(29%)60 (48%)16 (12%)
Q174 (3%)40 (32%)32(25%)40 (32%)8 (6%)
Q1812 (9%)28 (22%)24 (19%)44 (35%)16 (12%)
Table 14. Descriptive statistics for items regarding system usability.
MeanMaxMinSDSE
4.1520.50.1
Table 15. Frequency distribution table for items regarding system usability.
ItemStrongly DisagreeDisagreeNeutralAgreeStrongly Agree
Q104 (3%)48 (38%)56 (45%)16 (12%)
Q20024 (19%)68(54%)32 (25%)
Q30020 (16%)68 (54%)36 (29%)
Q40016(12%)40 (32%)68 (54%)
Q508 (6%)44 (35%)48 (38%)24 (19%)
Q604 (3%)32 (25%)48 (38%)40 (32%)
Q70016 (12%)52 (41%)56 (45%)
Q804 (3%)28 (22%)36 (29%)56 (45%)
Q90012 (9%)52 (41%)60 (48%)
Q100016 (12%)48 (38%)60 (48%)
Publisher’s Note: MDPI stays neutral with regard to jurisdictional claims in published maps and institutional affiliations.

