Article

Rotation Estimation and Segmentation for Patterned Image Vision Inspection

1
Intelligent Convergence Research Laboratory, ETRI, Deajeon 34129, Korea
2
Department of Computer and Information Science, Korea University, Sejong 30019, Korea
3
Machine Vision Research Team, Bluetilelab, Seongnam 13529, Korea
*
Author to whom correspondence should be addressed.
Electronics 2021, 10(23), 3040; https://doi.org/10.3390/electronics10233040
Submission received: 4 October 2021 / Revised: 28 November 2021 / Accepted: 2 December 2021 / Published: 5 December 2021
(This article belongs to the Section Computer Science & Engineering)

Abstract

:
Pattern images can be segmented in a template unit for efficient fabric vision inspection; however, segmentation criteria critically affect the segmentation and defect detection performance. To get the undistorted criteria for rotated images, rotation estimation of absolute angle needs to be proceeded. Given that conventional rotation estimations do not satisfy both rotation errors and computation times, patterned fabric defects are detected using manual visual methods. To solve these problems, this study proposes the application of segmentation reference point candidate (SRPC), generated based on a Euclidean distance map (EDM). SRPC is used to not only extract criteria points but also estimate rotation angle. The rotation angle is predicted using the orientation vector of SRPC instead of all pixels to reduce estimation times. SRPC-based image segmentation increases the robustness against the rotation angle and defects. The separation distance value for SRPC area distinction is calculated automatically. The performance of the proposed method is similar to state-of-the-art rotation estimation methods, with a suitable inspection time in actual operations for patterned fabric. The similarity between the segmented images is better than conventional methods. The proposed method extends the target of vision inspection on plane fabric to checked or striped pattern.

1. Introduction

Most cameras used in machine vision support high-resolution image acquisition to detect detailed defects [1]. The acquired images should be cropped before use because deep learning neural networks have limited input data sizes for low memory usage considering the low spec of PC installed environments and preventing image loss [2]. Figure 1 shows examples of images acquired using a machine vision camera.
The image is cropped using a matching technique such as correlation analysis based on a predefined template [3] if a specific area of the image is targeted as with semiconductor chip inspection. When the template is not specified, such as for concrete cracks, data can be generated by dividing the image into sizes that are easy to learn. An elaborate segmentation criterion is required to ensure uniformity in the shapes of cropped patterns obtained from their images. Thus, for an image that is rotated or has a defect, many problems can occur when finding the split reference point.
It is also possible to perform vision inspection by deep-learning through data augmentation without cutting unit patterns based on a certain criterion. However, if images are augmented at various angles for various types of fabrics, the learning time increases proportionally. In addition, this study assumes that learning for fabric vision inspection is processed only with normal data in actual environments as described in [4,5] where it is difficult to obtain abnormal samples for each new-patterned fabric. For this reason, there is a possibility that it is judged as a defect but not a defect because it learns the various unit shapes generated by the sliding window during augmentation as normal even though there is an error with a different pattern area as shown in Figure 2. Moreover, it is difficult to determine the template area of learning and inspection images only by data augmentation, so the segmentation reference point candidate (SRPC)-based scheme is proposed to get the similar area. If a template is determined, leaning is performed by segmented images which have same size and similar shape. Otherwise, the learning takes a long time because more images are cropped in different sizes and shapes which should be used for the learning process. Extracting SRPC not only does not require image augmentation, but it is also possible to define templates. Therefore, it has advantages in terms of both time and accuracy performances as the cropped shape of learning and inspection images are matched only when the segmentation process is based on a criterion.
This study analyzes problems associated with segmenting pattern images to generate deep-learning input data and presents a solution for fabric defect detection (FDD) in many pattern images. Textile fabrics classified by form and shape, lattice/striped, and solid-color fabrics, are mostly used in apparel production. Therefore, as mentioned in [6], most research related to fabric defect detection efforts focus on plain solid-color fabric. For a single-color fabric image, we can easily set the size and crop it like concrete images; however, fabrics with lattice and line patterns require split reference points for cropping. Methods to determine optimal vertical and horizontal split lines for unrotated images have been proposed. This method only support unrotated fabric images shown as Figure 3 [7]. The same interval distance between split lines also can be a problem when a fabric image has abnormal pattern area such as Figure 2.
Therefore, a split reference point is required for rotated images and a suitable rotation angle must be estimated in advance to extract a reference point without errors, thereby facilitating collection of similar divided images. Algorithms that can predict rotation angles have already been proposed [8,9] based on line detection techniques. However, long computation times or large rotation-angle errors depending on the detection resolution are major drawbacks. Predicting the rotation angle cannot perfectly guarantee nonrotation; therefore, a split reference point needs to be extracted. From these problems, applying deep learning techniques to the vision inspection of rotated pattern fabric is difficult.
This study proposes a method for applying the extracted reference points not using split line or line detection methods to both rotation-angle estimation and image segmentation to ensure high inspection and segmentation performance for various pattern shapes within an appropriate performance time. As mentioned in [10], in general, images can be segmented by comparing multiple pixels with a template predefined by the user. Because this method uses only reference points not all pixels, it takes a short time for segmentation process. Within this low time consumptions, the proposed system achieves high accuracy as described in the below simulation section. Furthermore, we propose a method for increasing the performance stability and operational convenience using automatically calculated variables such as a threshold. By applying the proposed scheme, deep learning-based FDD can be extended from an existing solid color to pattern images.
The rest of this paper is organized as follows: Section 2 describes the radon transformation (RT) and Hough transformation (HT) techniques used in rotation-angle estimation; furthermore, template-based correction (TC) [7] for segmenting image is also discussed. Section 3 introduces the overall structure of the proposed algorithm. Section 4 provides details of the proposed algorithm. The SRPC is extracted and the rotation angle is estimated using SRPC. Then, the reference point is confirmed, and the image is segmented. For each step, SRPC using Euclidean distance mapping (EDM)—a method for estimating the rotation angle quickly and accurately—and another method for segmenting images by merging or generating reference points are introduced. Section 5 presents the performance test for evaluating the error performance of the rotation-angle estimation algorithm and identifies how well the image was segmented. Finally, in Section 6, the significance, applicability, and limitations of this study, and the additional research required in the future are analyzed comprehensively.

2. Previous Work and Problem

2.1. Rotation-Angle Estimation

Rotation-angle estimation can be divided into two methods: obtaining an absolute angle or getting a relative angle using a reference image. Fabric defect detection needs absolute angle estimation because the inspection requires accurate segmentation in the entire image area. As mentioned in [11], similarity measure direct pixel matching (DPM) and principal axes matching (PAM) methods find the angle by measuring the similarity with the registered reference. Reference images are also needed for histogram-oriented gradients (HOG) based on studies such as [12]. This study aims to get a rotation-angle estimation method applicable to actual operations by considering both accuracy and time appropriately. HOG and Radon based methods are relatively accurate but estimate angles by using all possible candidate angles. Hough is fast, but the accuracy is unstable depending on the case. This section analyzes Radon and Hough, that can estimate the absolute rotation-angle and are widely used as representative basic algorithms because of their high accuracy and low execution time.

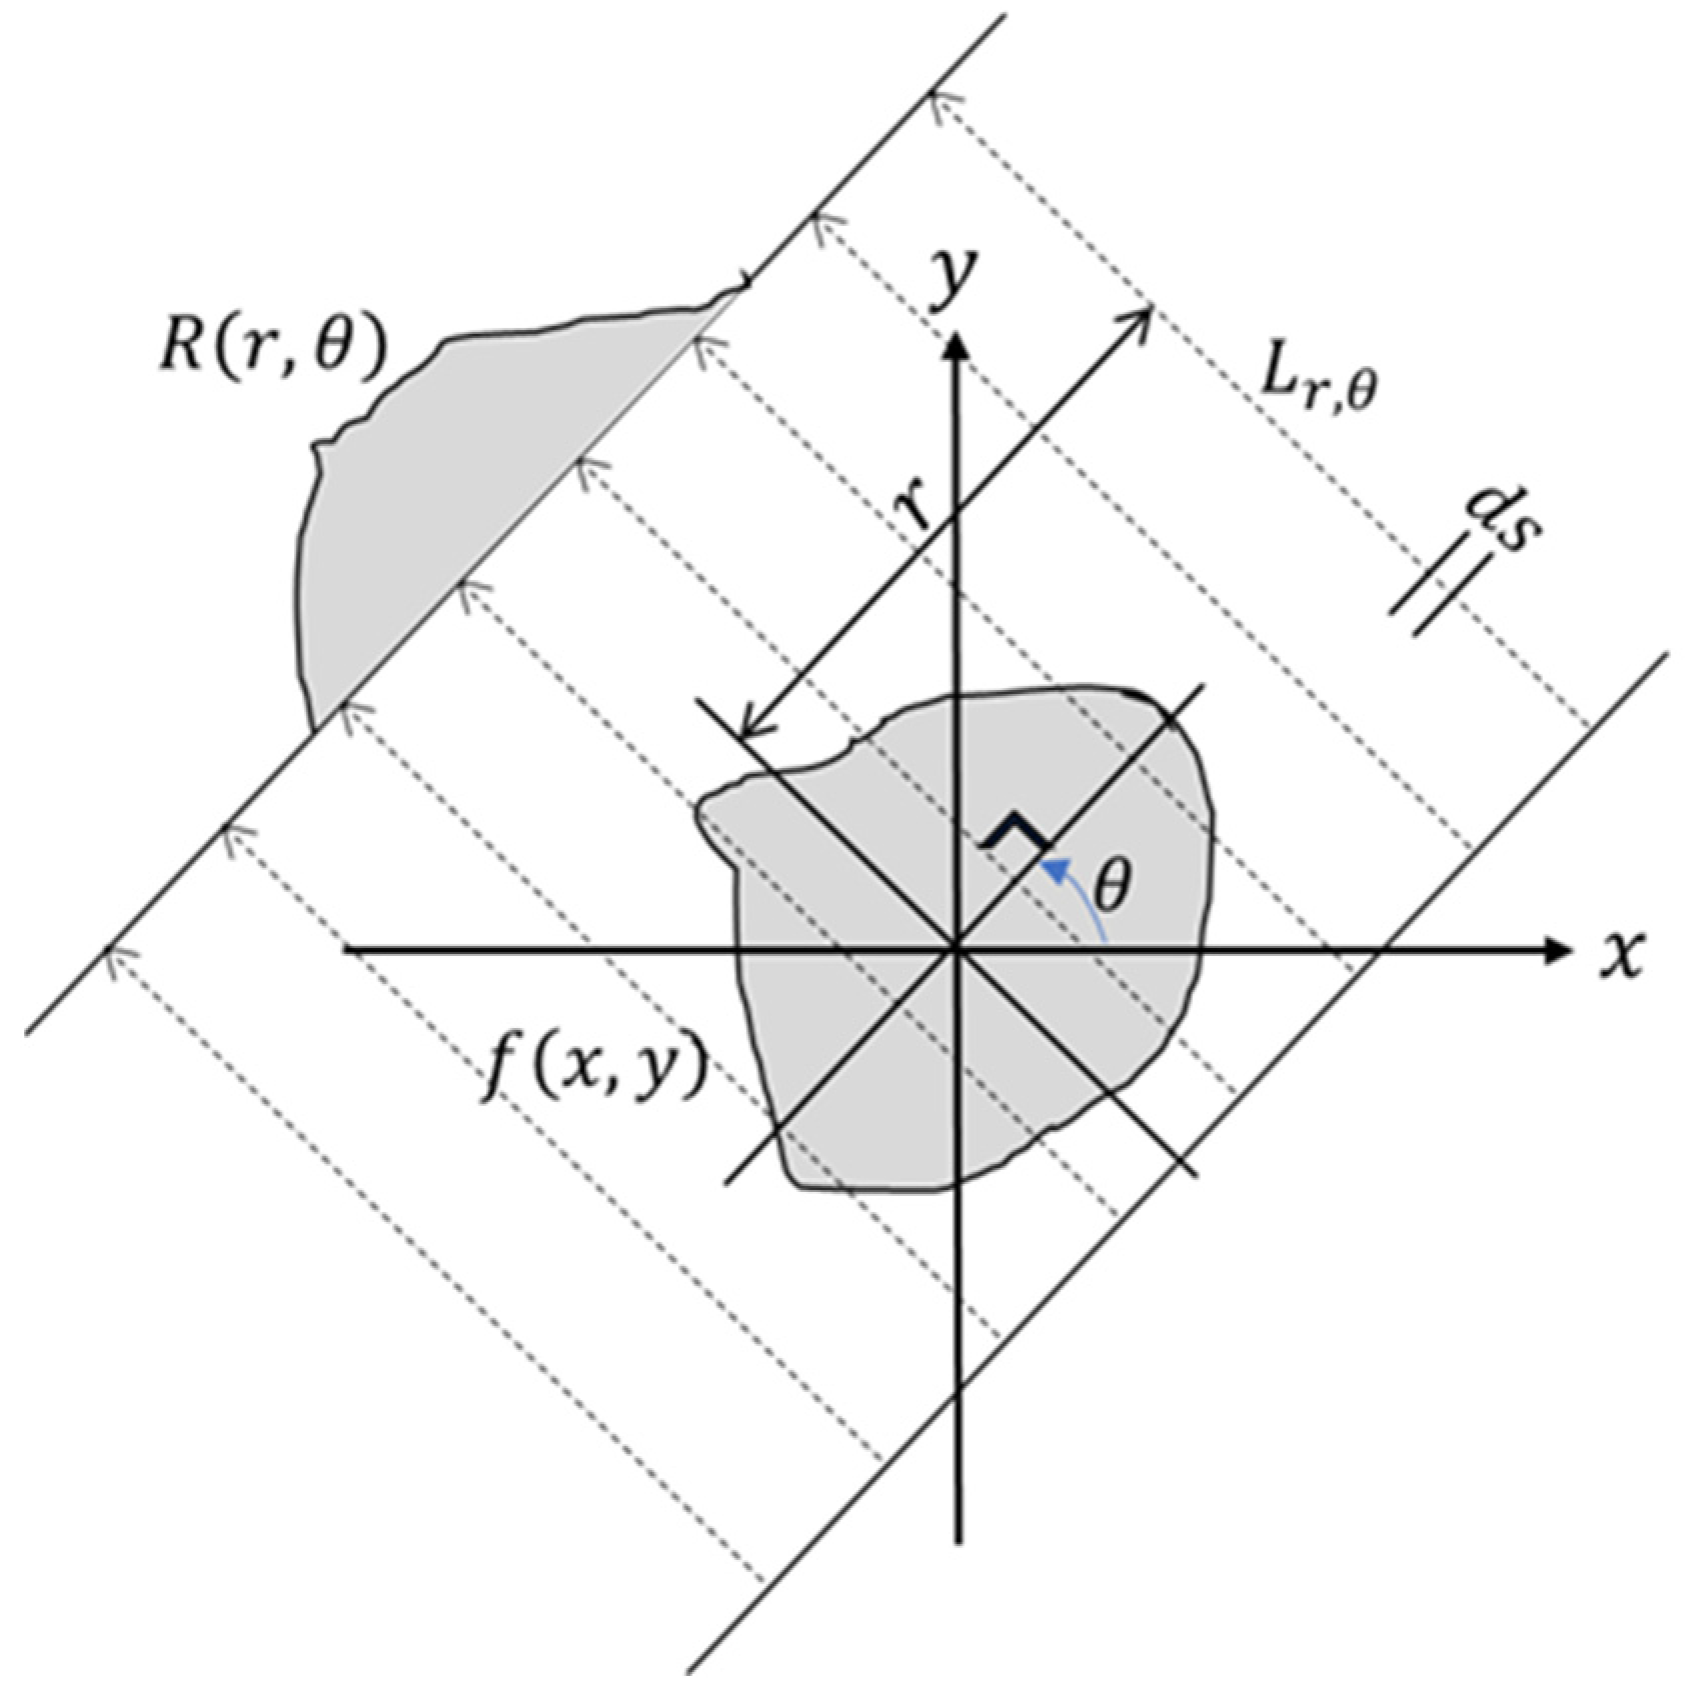
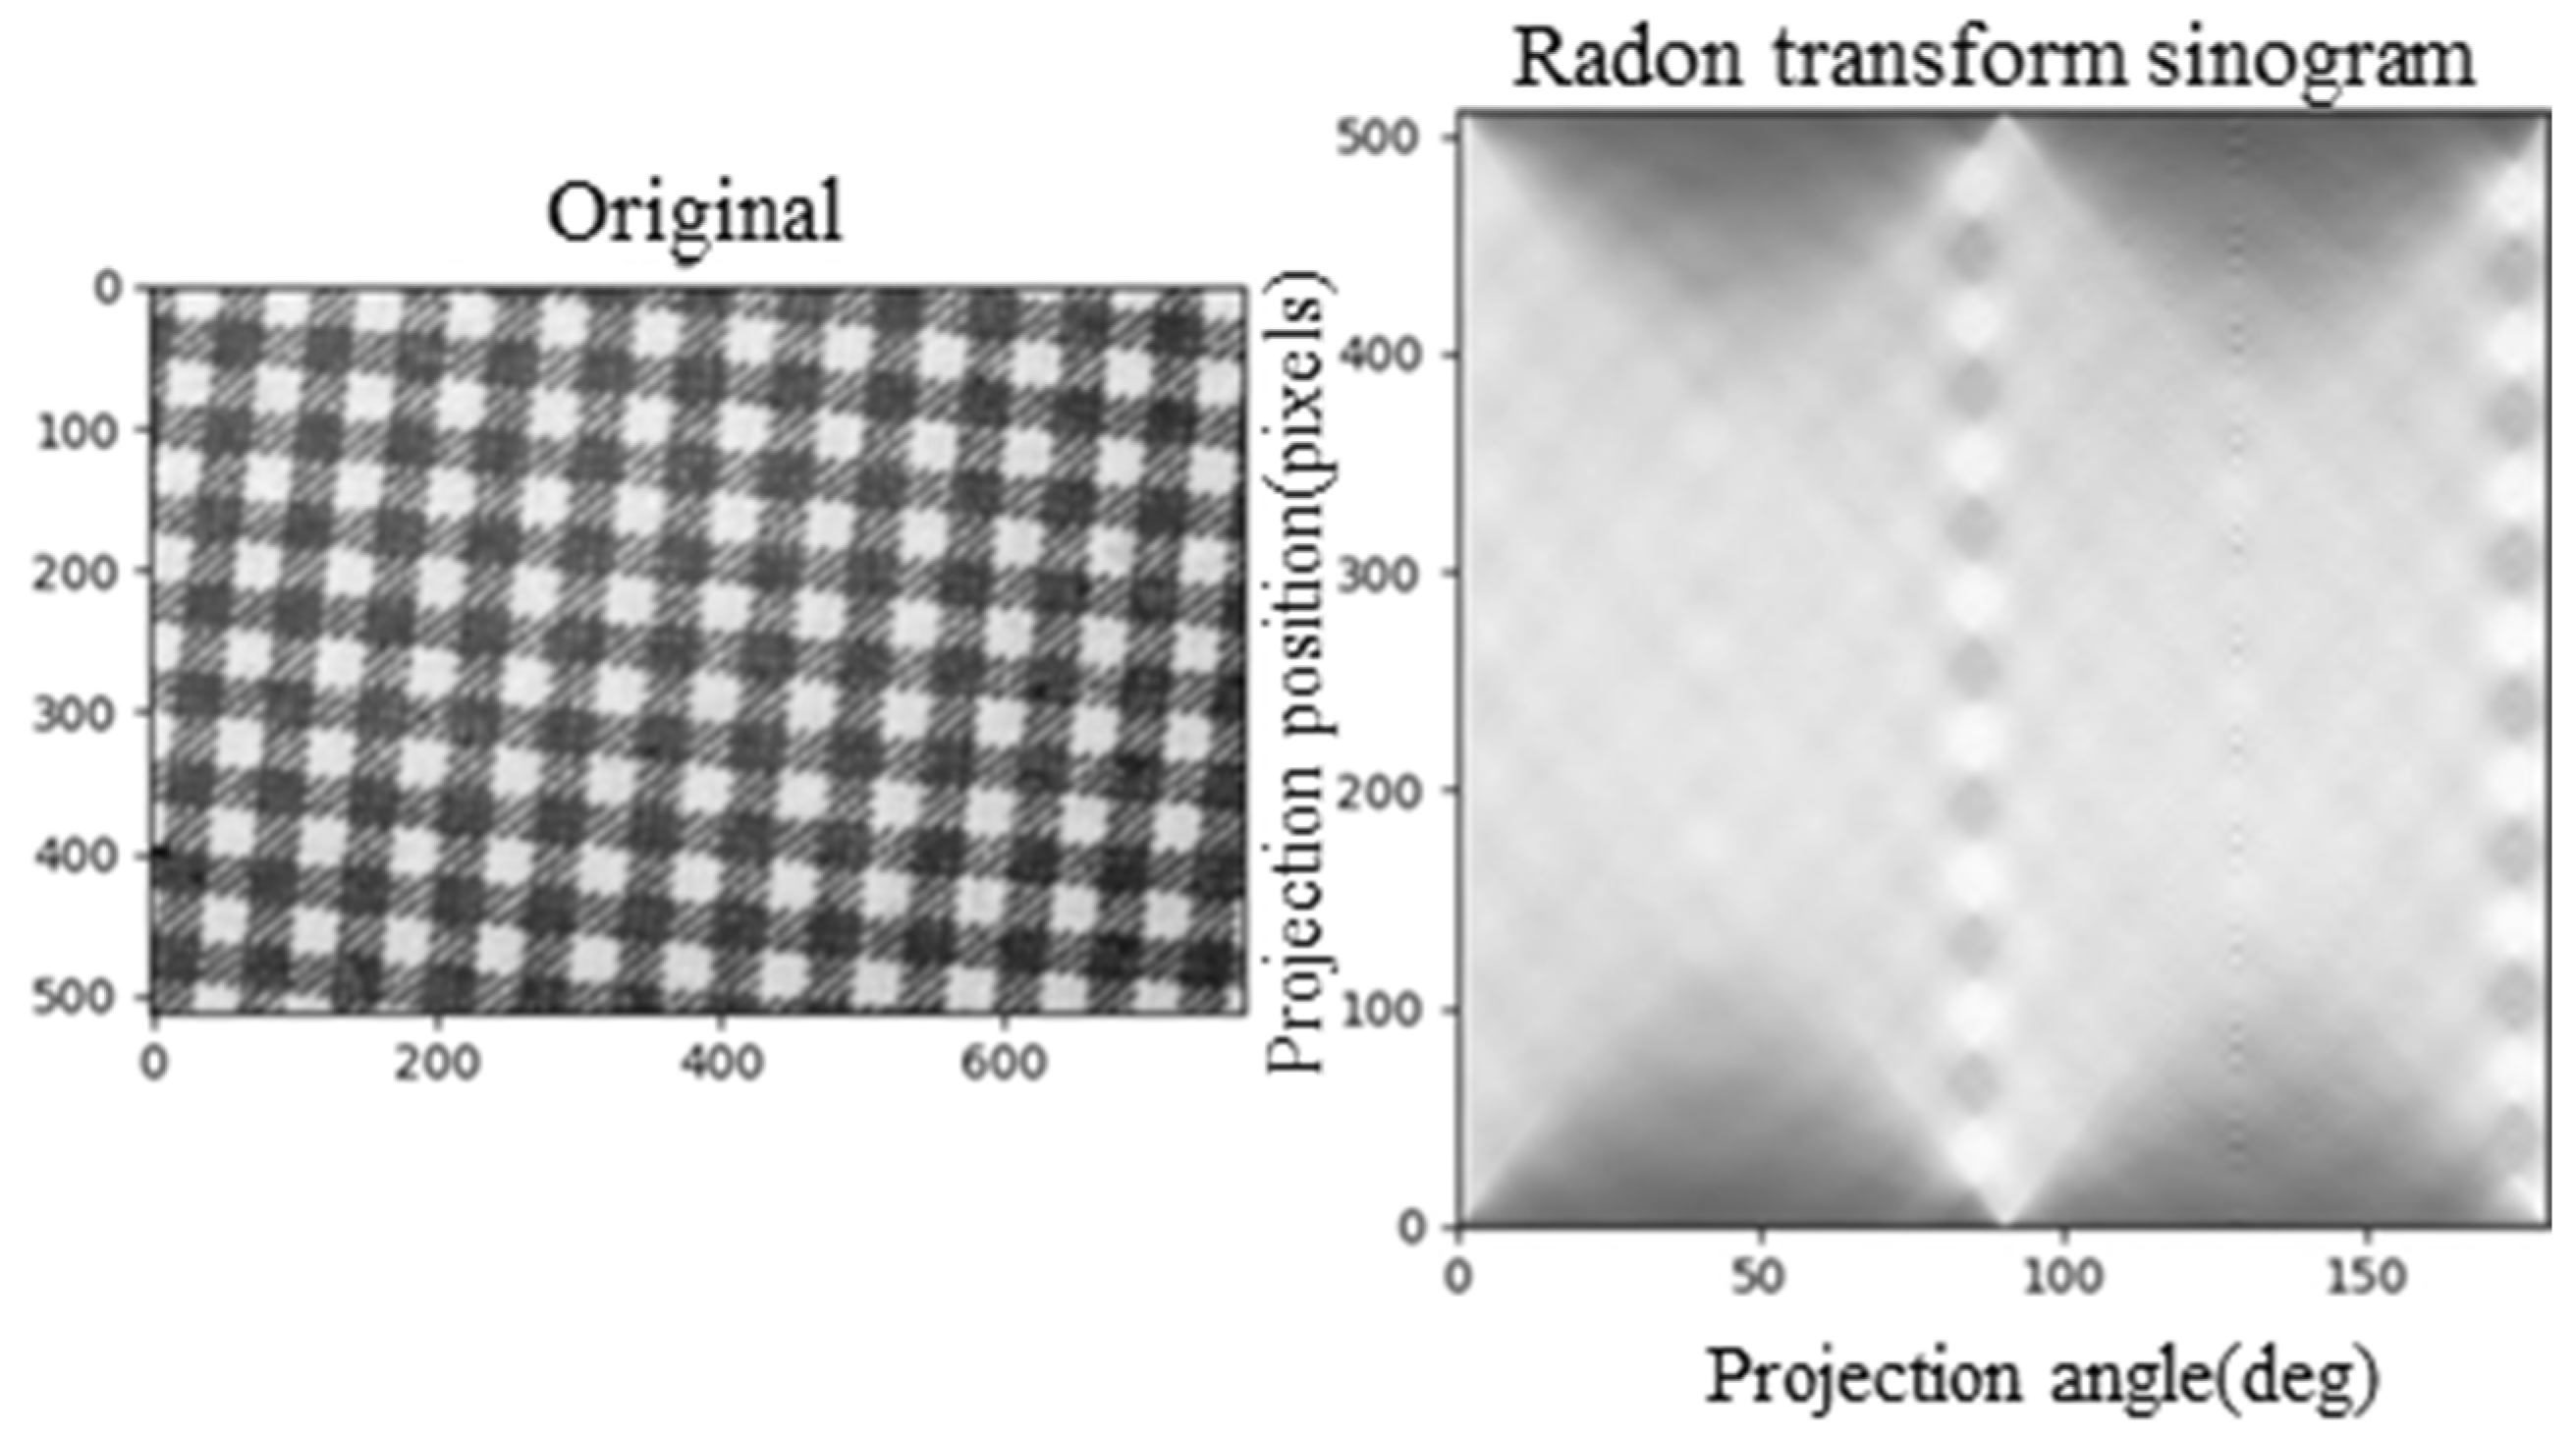
2.1.1. Radon Transformation

Figure 4 represents the RT value R ( r , θ ) can be determined by projecting L r ,   θ at a distance r from the origin when the target image I ( x , y ) is viewed at angle θ and then calculating the line integral. Here, the line L r ,   θ is projected in the direction of adding π / 2 to the line which forms the angle θ with the x -axis. According to [13], RT can be expressed as
R ( r , θ ) = I ( x , y ) δ ( r x cos θ y sin θ ) d x d y ,   δ ( · )   is   the   Dirac   delta   function  
This process is performed while rotating projection direction within the angle range. Consequently, R ( r , θ ) overlaps when L r ,   θ passes through I ( x , y ) . If the variance of RT obtained along the line at a specific θ m is the largest, then the image has a line component θ L perpendicular to the angle [8].
θ m = a r g ( max 0 θ < π r = 1 n | R ( r , θ ) | 2 n ) ,   θ L = θ m + π 2
Figure 5 shows RT result for the lattice pattern image. Since θ m is 84 ° , it needs to rotate only 6 ° in the counterclockwise direction. Thus, because the detection of the rotation angle by RT extracts the global linear component, then, the denser the projection angle spacing, the more accurate the value obtained. However, a long computation time is a major constraint when using machine vision for inspection since performance speed is a critical requirement. For example, if we want to achieve a 10 times more accurate resolution, we must endure a performance time that is approximately 10 times longer.

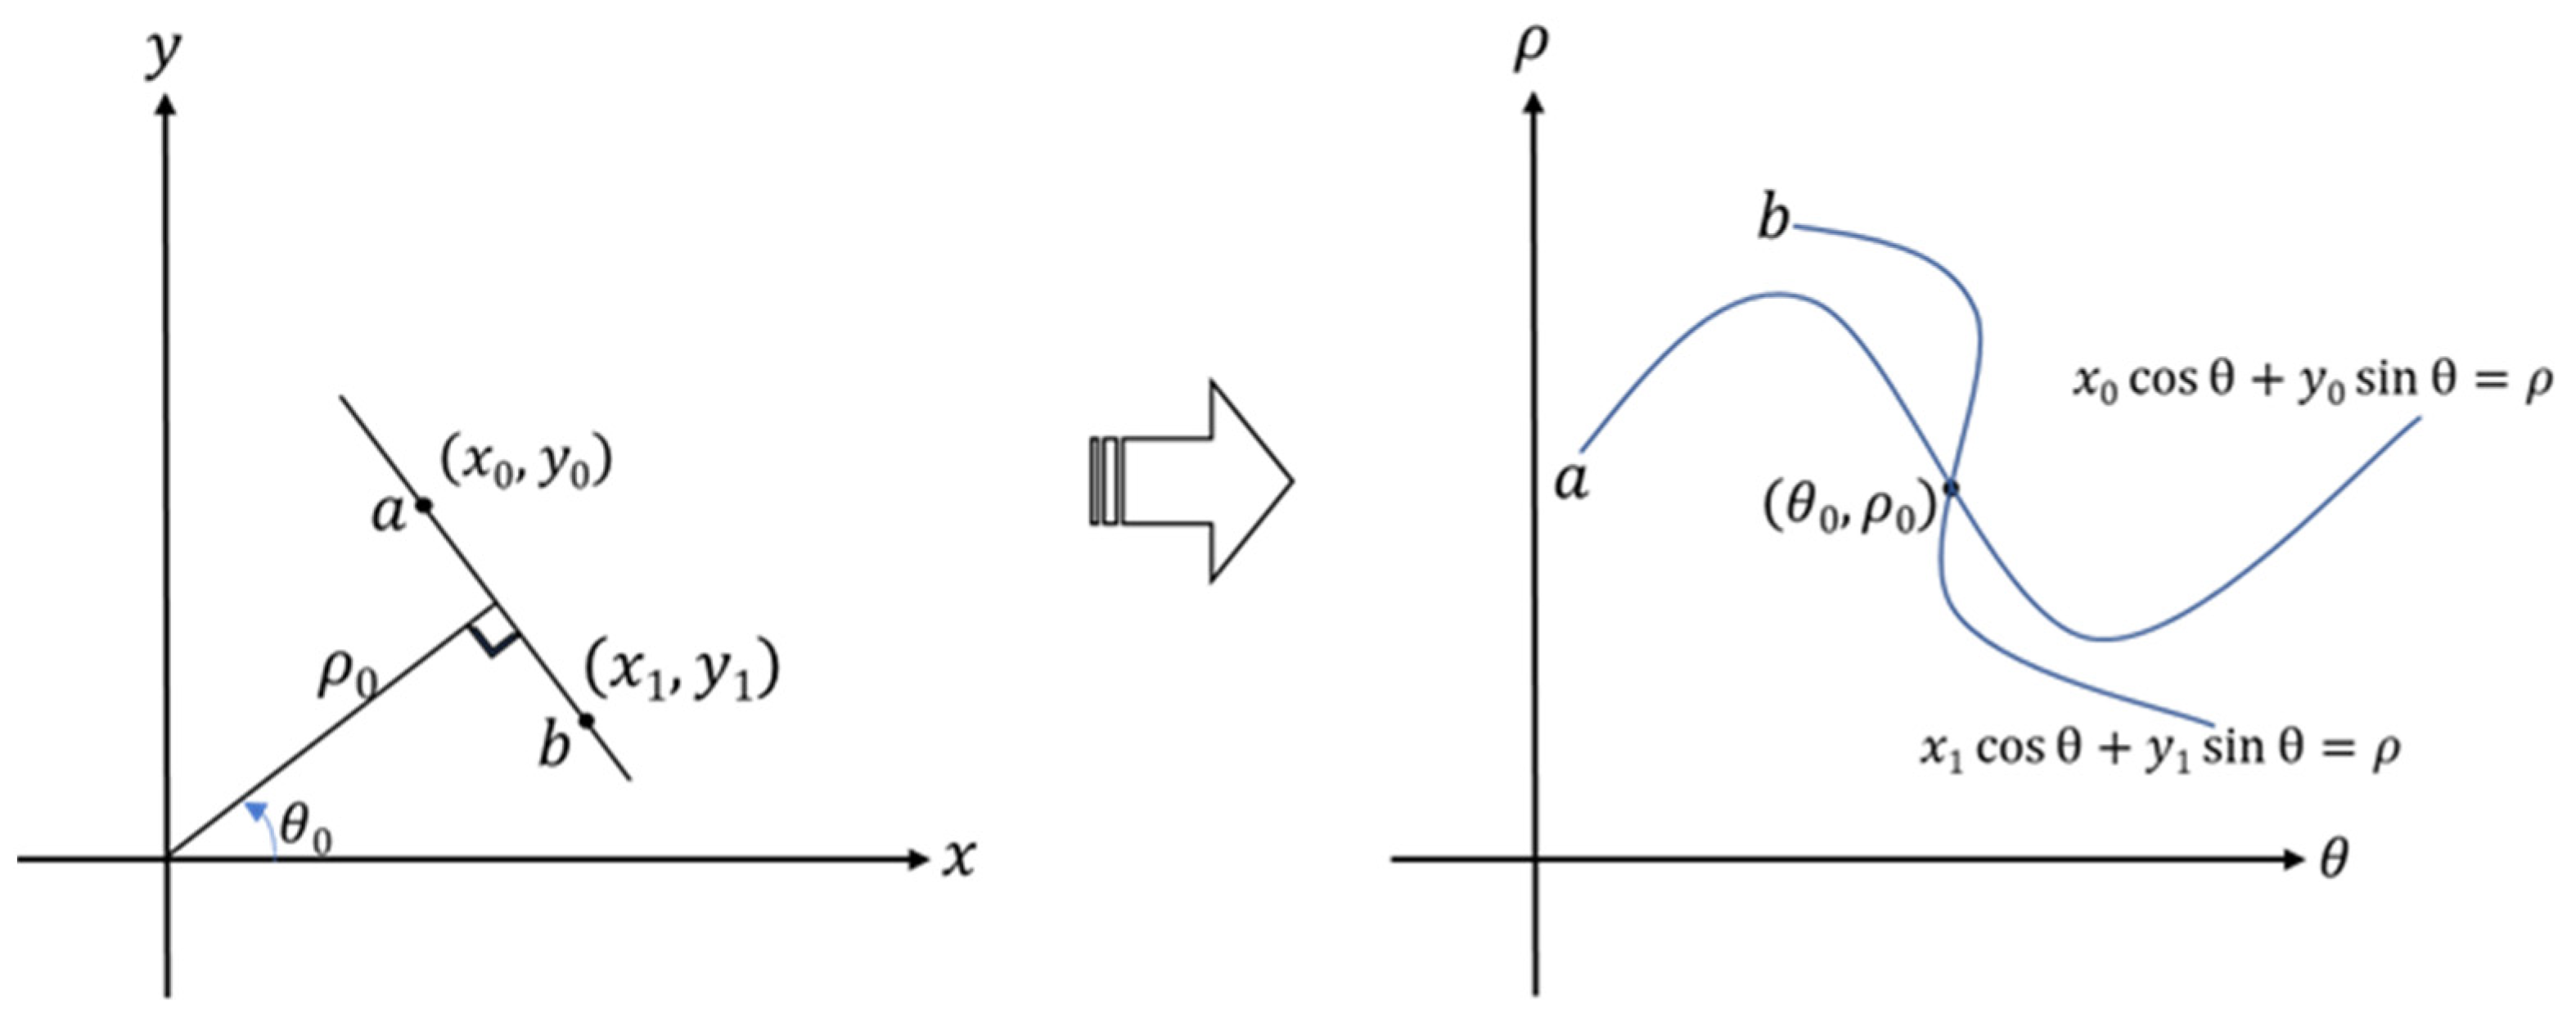
2.1.2. Hough Transformation

HT [9] is an algorithm that detects a straight line by converting a linear equation to a parameter space in a two-dimensional orthogonal coordinate system. As shown in Figure 6, when there is a straight line ρ , a point in the x-y plane is expressed as a curve in the θ - ρ plane. If two points of ‘a’ and ‘b’ on a straight line of the x-y plane are converted to the θ - ρ plane, they are located at the same point ( θ 0 , ρ 0 ) .
When each point is inserted into an accumulation array of θ - ρ using the edge component of images extracted using the canny edge (CE) filter [14], the value at the intersection becomes greater. After finding such local maximum points, the points larger than the set threshold are detected as a line. When an accumulation array is configured, the precision and computation speed vary relative to the interval of parameters. If the interval is small, the precision increases and the computation speed decreases; if the interval is large, the precision decreases and the computation speed increases.
Linear components extracted by applying HT after CE are shown in Figure 7a–c. Lattice patterns are occasionally extracted accurately; however, other linear components are also detected, as shown in Figure 7b. The lines that represent various angles can be detected in the pattern and their average value is the final rotation angle.
Both CE and HT have a drawback; the performance changes depending on the threshold. Therefore, an appropriate threshold must be set; however, calibrating various fabric shapes is difficult. Therefore, using rotation-angle estimation with HT in machine vision inspection is inefficient.

2.2. TC Segmentation

Most methods for segmenting pattern images determine the optimal split lines by assuming the unrotated image as shown in Figure 3. In [7], the authors defined the loss function f   ( r * ,   c * ) and found the horizontal and vertical length ( r ,   c ) that minimizes the function. Let S 2 ( x ,   y ) denote the variance between blocks after the image is cropped. This method finds the horizontal and vertical sizes that generate the maximum number of similar blocks while applying various sizes.
( r ,   c ) = a r g m i n f ( r * ,   c * )
f ( r * ,   c * ) = 1 r * × c * x = 1 r * y = 1 c * S 2 ( x ,   y )
The conventional method causes problems in error inspection from two aspects: First, when an error area between patterns is added or partially lost, the pattern blocks of the inspected image are pushed or pulled and all blocks after that area are judged as defective. Second, unlike the learning image, if the inspection image is rotated, the reference point itself is also rotated; therefore, all objects can be recognized as defective. To solve the second problem, unit blocks are rotated in a certain range through data augmentation and learned together; however, this solution is inefficient because of the time required for learning and performance.
Hence, both the rotation angle and segmentation reference point (SRP) are determined when solving the aforementioned problems. If the image is cropped at the reference point instead of the uniform intervals after calibrating the estimated rotation angle and the image is unrotated, then, it is possible to prevent the additional learning because of data augmentation or performance degradation caused by image loss.

3. Proposed Structure

3.1. Target Scenario

Figure 8 shows a conceptual diagram of a machine vision system for the automatic inspection of fabrics through image analysis applied to a fabric-inspecting machine. For fabric, 1.5 m or larger in width, multiple cameras are employed to process the assigned areas simultaneously and some parts are overlapped to consider rotations when the inspection is performed. Machine vision cameras acquire high-megapixel resolution images. Since it is difficult to use single images directly as input data for deep learning, the image is converted to a low-resolution image or divided into detailed areas to detect fine defects.
Considering that machine vision inspection of fabrics using deep learning, a reference point extraction and rotation-angle estimation algorithm for image segmentation are proposed in this study. One roll of fabric usually has a size of 1.5 m × 50 m or more and consists of the same oriented pattern. Therefore, the rotation angle estimation is performed only once at the beginning, and the result is applied to the rest of the region. The lattice and line patterns are target images for application and performance result are verified using generated images based on the purpose of the test or using the existing fabric image data.

3.2. Overall Procedure

Figure 9 shows the implementation process of the proposed image segmentation method, which is largely divided into the SRPC extraction, rotation-angle estimation, and image segmentation stages, respectively. The SRPC is extracted by generating an EDM from the original image and then finding the local maximum. The minimum separation distance (MSD) value, which is automatically determined using the connected component labeling (CCL) technique for distinguishing local areas, influences the performance.
The rotation angle is estimated relative to the area belonging to the coordinate system of the SRPC, mutual distance, and orientation vector. The estimated angle is corrected in the SRPC and original image. A single SRP exists only in each area to accurately segment the image. The SRPC is calibrated by integrating or generating the image and then arranged to determine the SRP. Finally, the image is resized to a certain size that can be used as input data for training and inspection.

4. SRPC-Based Segmentation

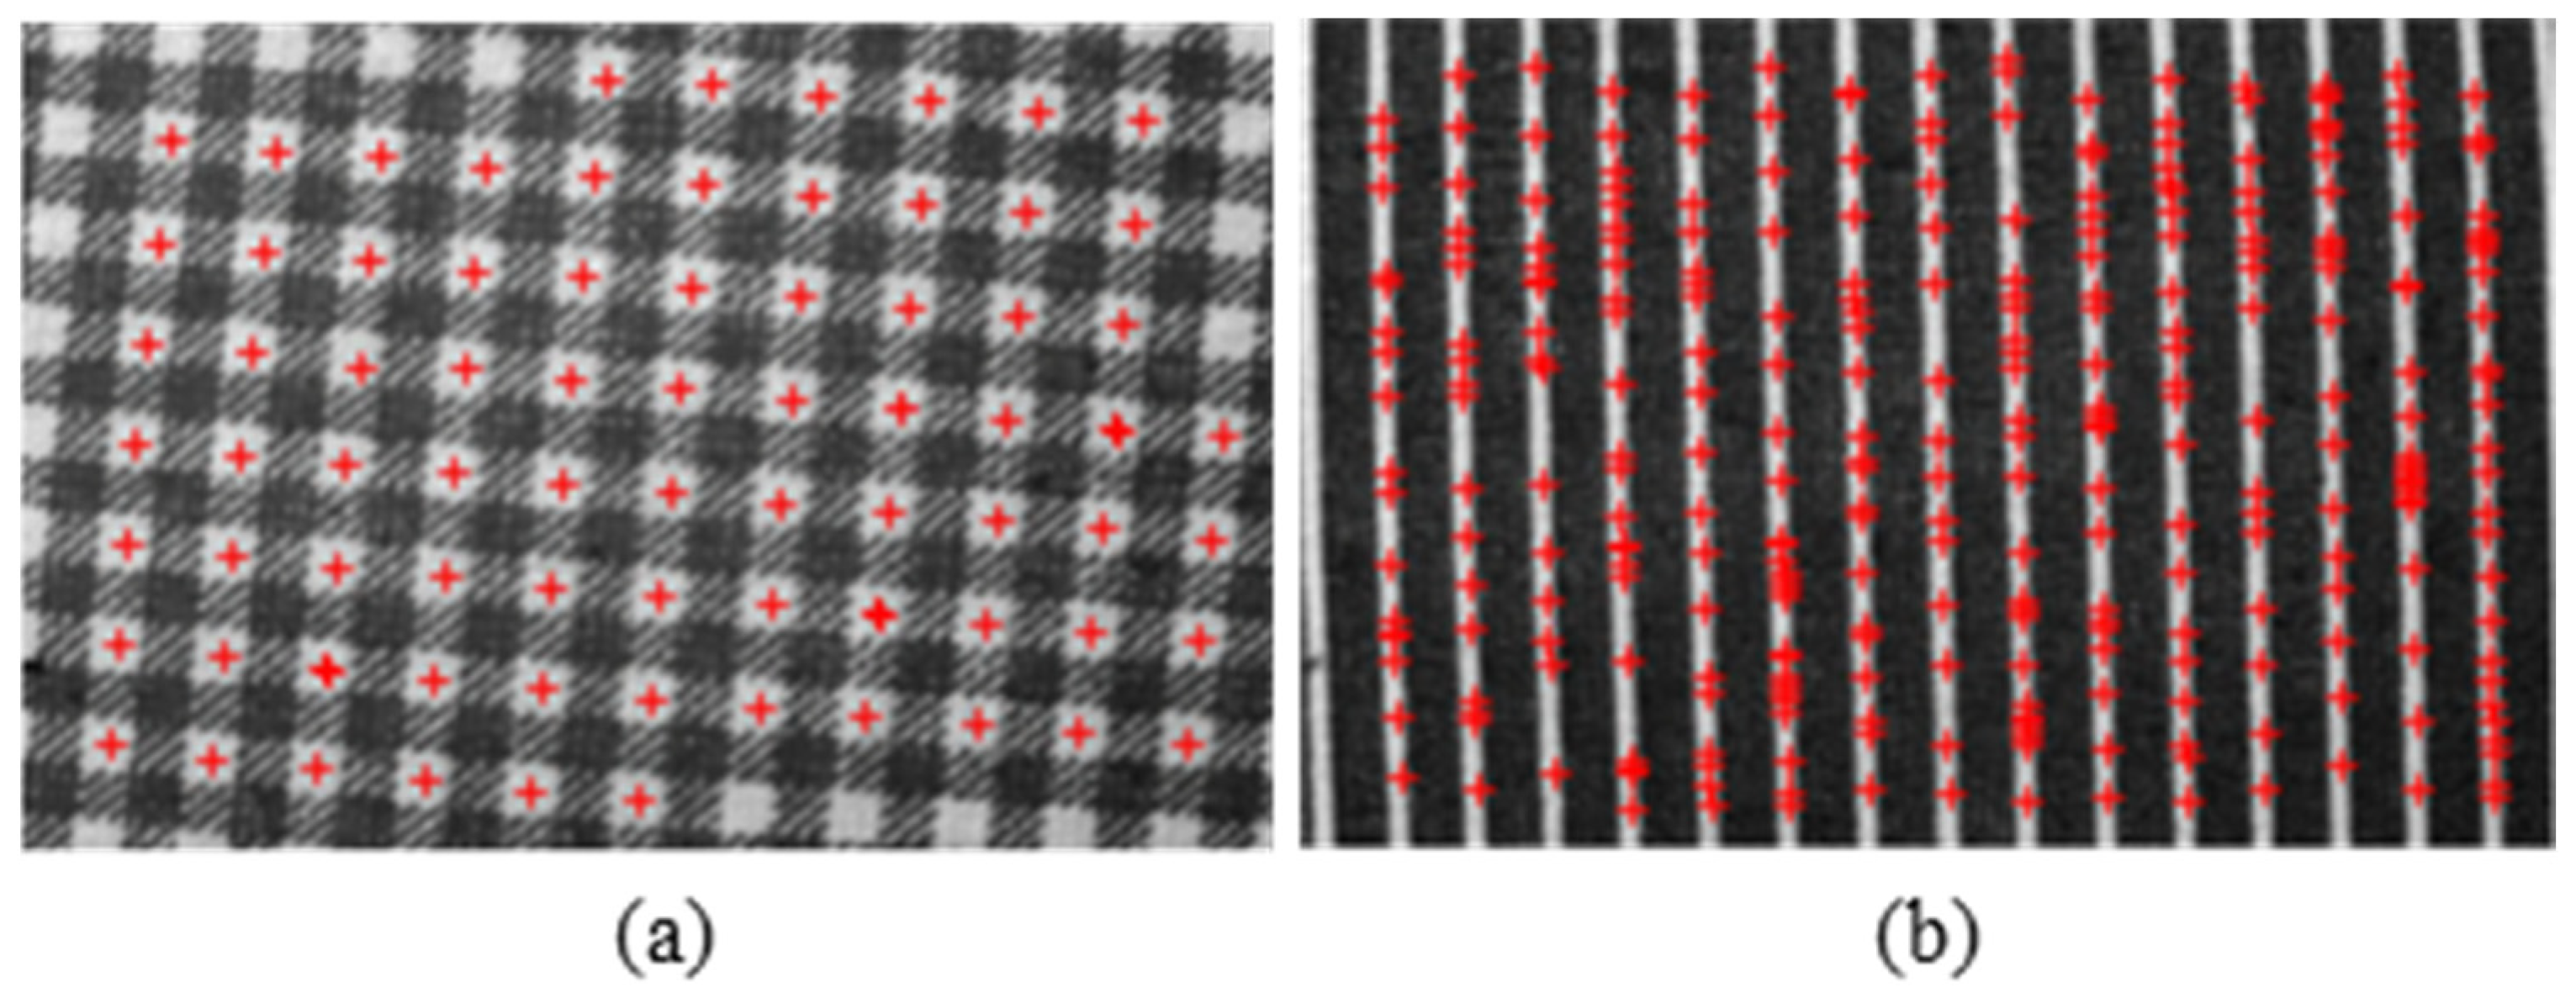
4.1. SRPC Extraction

4.1.1. EDM Generation

The result of EDM represents the distance of each pixel to the closest black pixel [15]. There are no set values because EDM process only has a Euclidean distance calculation between pixels. Figure 10 shows the image from which the EDM was obtained after binarizing the lattice pattern image. The white area decreased compared to the binarized image because although the pixels have the same white color, they have a lower value since their distance from the black area is shorter, expressing a color close to black. Otsu’s [16] technique is used for the binarization performed before the generation of EDM. Otsu algorithm automatically finds the threshold value that best divides the brightness of the image into two areas based on the normalized histogram distribution, so there is no need setting a parameter by the user.

4.1.2. MSD Auto Decision and Find Local Maxima

After the maximum filter (MF) processing of the EDM image, points with the same value as the original image are obtained, and the SRPC is extracted by merging these points by area. An appropriate area size must be defined for MF processing. It can be specified by the user during the initial setting. However, it is cumbersome because a different area size must be set for each object inspected, and a higher possibility of making mistakes when the spacing between areas is narrower exists. Hence, a process of automatically determining the minimum distance for area distinction is required.
Therefore, the EDM image obtained above must be binarized using the Otsu technique. The connected component (CC) can be distinguished by operating with CCL, and the number of connection elements, center position, and size information can be obtained.
For the CCL algorithm, block-based connected components labeled with decision trees (BBDT) [17] that can minimize memory access was used. Figure 11 shows the CC and labeling number obtained from the binarized image of the EDM for the lattice and line patterns.
Lattice patterns must be filtered because the size of the unit element is too small or too large due to noise or a defect in the target material. As shown in Equation (5), the CC exceeding a certain size based on the average size of each element a a v g are filtered and removed. The lower boundary values B l and B u for the width and height of the area were determined based on the probabilistic median value; however, that can change depending on the image characteristics. The set of areas before filtering is given as A = {   a 1 ,   a 2 ,   ,   a i } , and the new set after filtering is A F .
( B l a a v g   <   a i   <   B u a a v g ) A F ,   ( B l = 0.5 2 , B u = 1.5 2 )
After obtaining the averages of width w and height h, respectively, of the CCs remaining after filtering as shown in Equation (5), the smaller of the two values is set as the minimum distance d c for the area distinction.
The filtering process is performed for the line and lattice patterns. Upon obtaining the average width and height, w a v g   and   h a v g of the remaining elements, the longer side defines the direction of the line pattern. This direction information is used for obtaining the rotation angle later. The line pattern determines the minimum distance for area distinction with only the number of elements. When the width w o and height h o of the original image are divided by the number of elements N c c , the minimum distance for area distinction d c for the vertical and horizontal line patterns can be obtained respectively as:
d c = {   min ( w a v g ,   h a v g ) ,   Lattice   min ( w o N c c ,   h o N c c ) ,   Line
One example of obtaining the SRPC after MF processing for the EDM image using the minimum distance for area distinction obtained using this approach is shown in Figure 12.

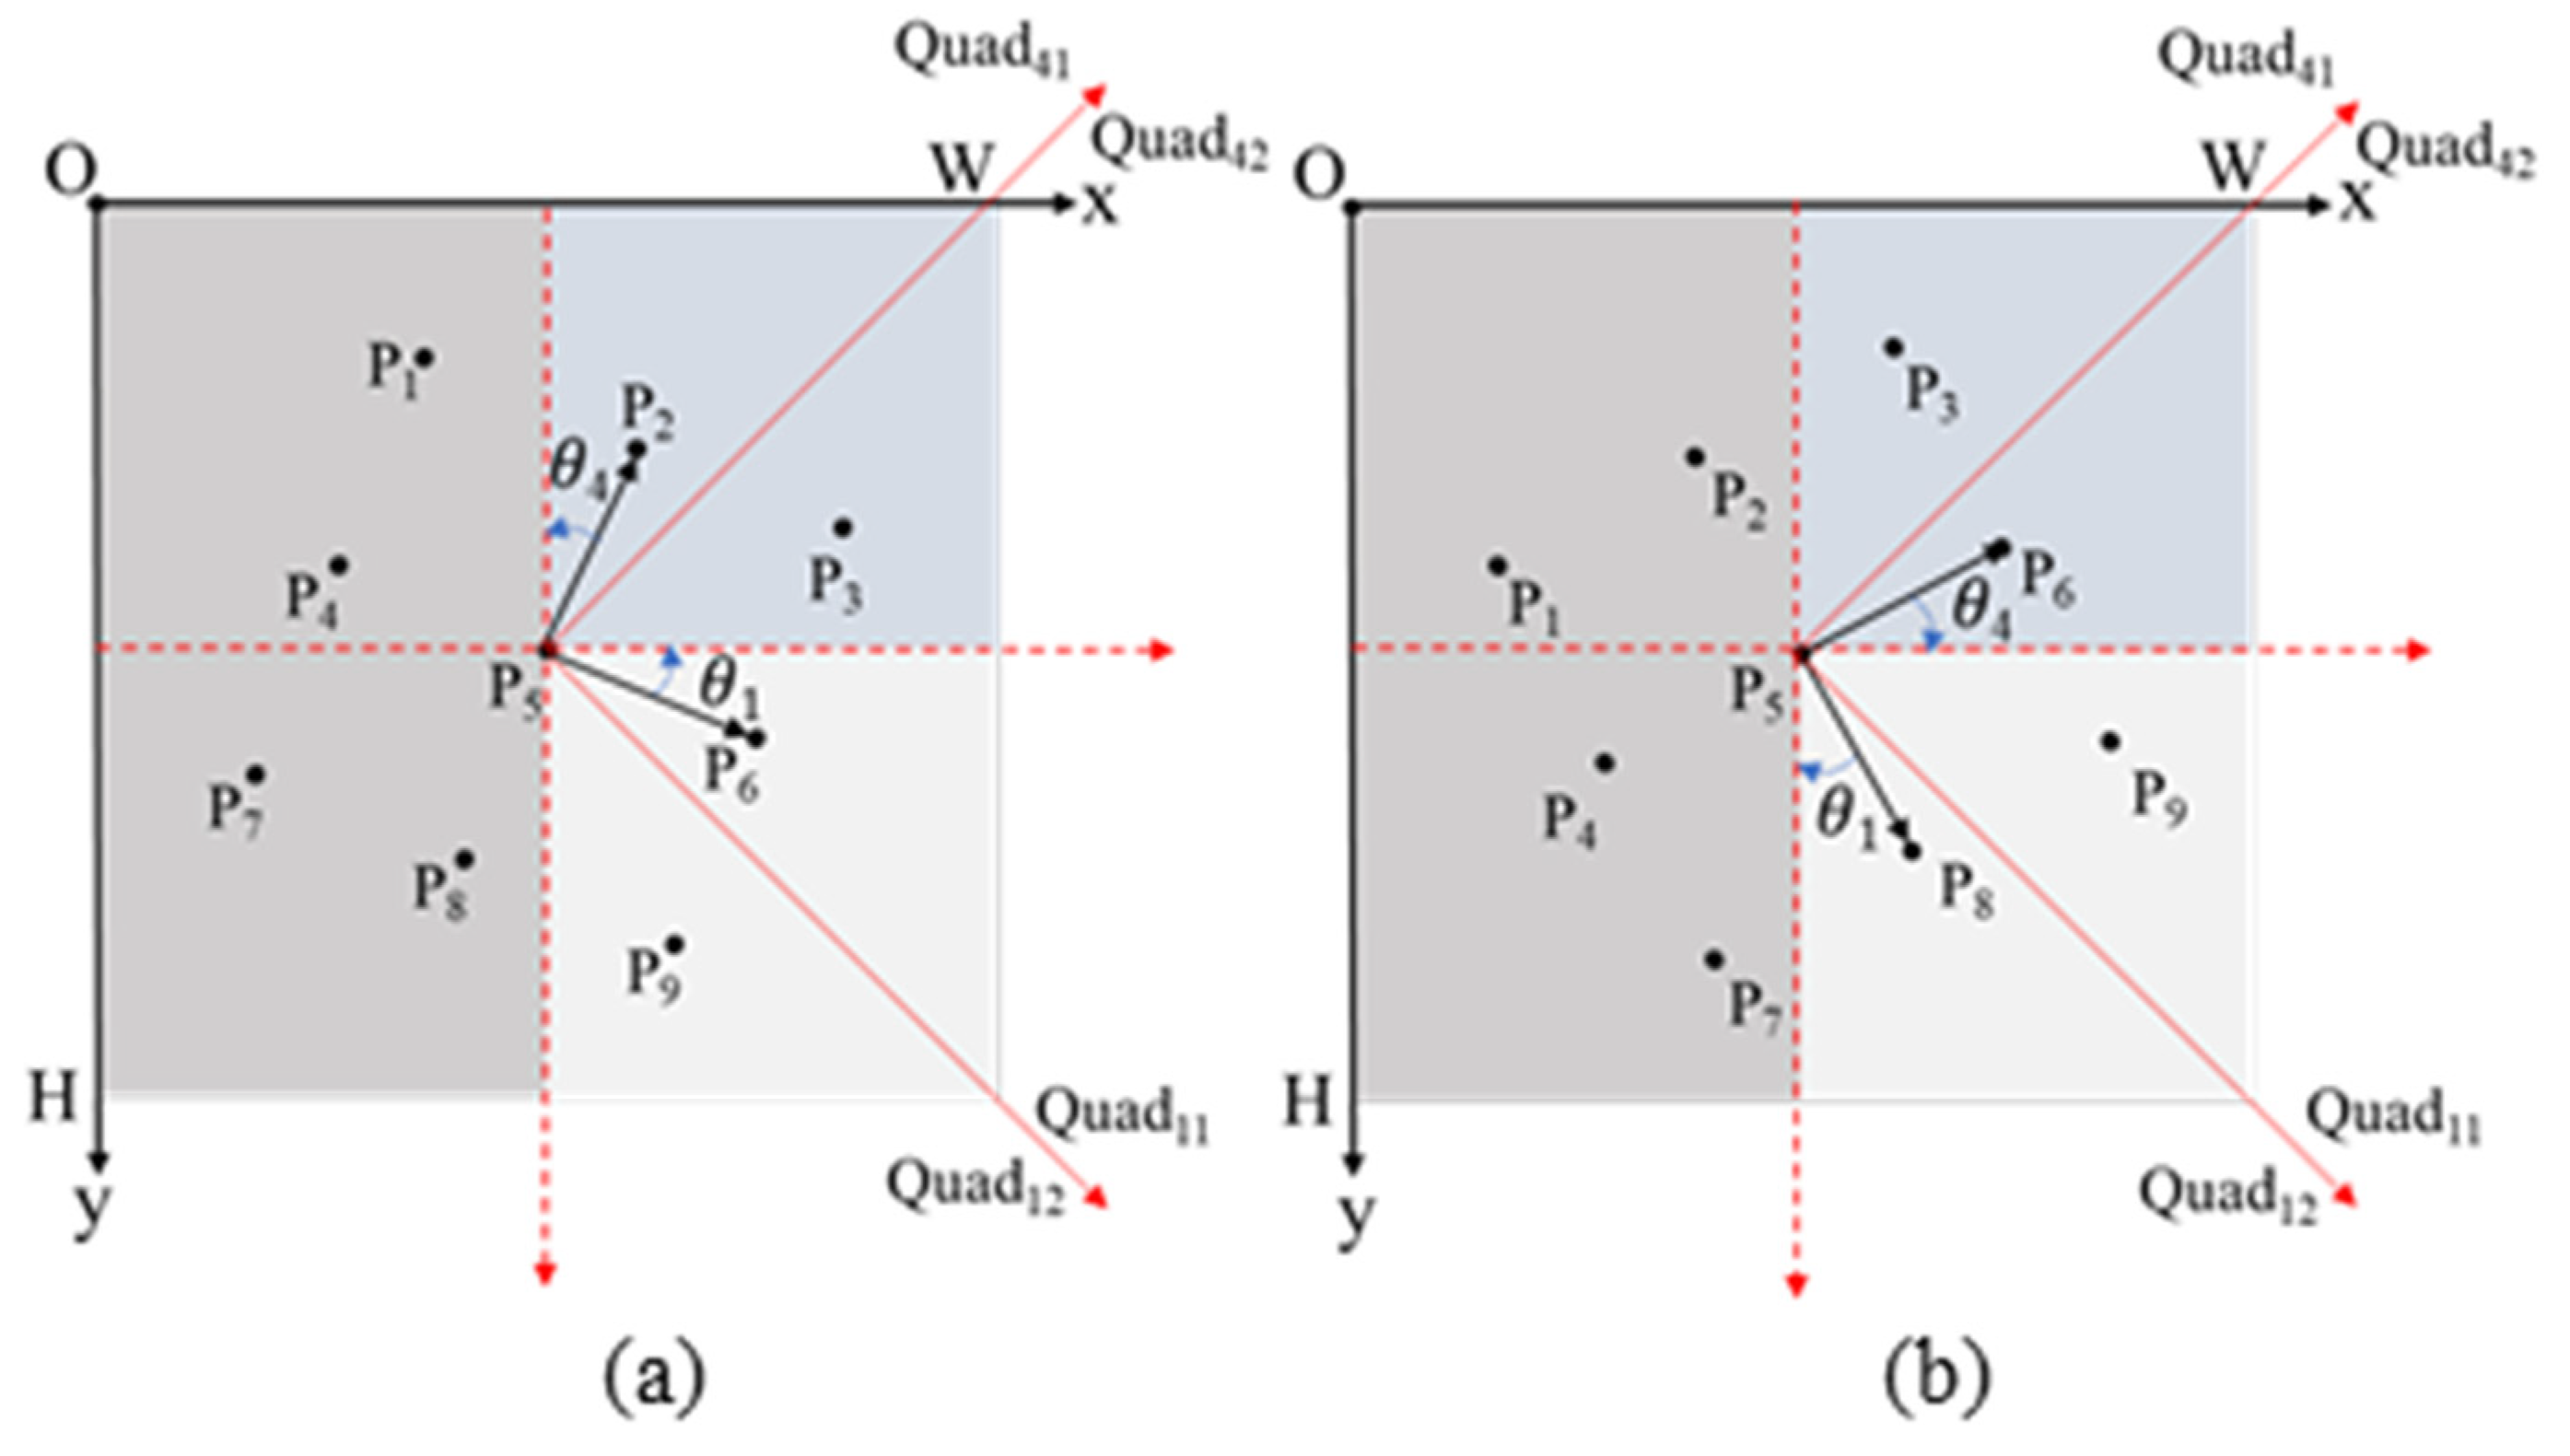
4.2. Rotation-Angle Estimation

Candidate orientation vectors for estimating the rotation angle are obtained by connecting the SRPCs extracted from EDM. The line and lattice patterns have one and two orientation vectors, respectively, related to the rotation angle when there is no image distortion.
The rotation angle can be estimated if the orientation vector is obtained after setting only the nearest points for Quad1 and Quad4, on the right side when the image is divided into quadrature (“Quad”) based on the SRPC. Since the position of the nearest point changes depending on the image rotation direction, Quad1 and Quad4 are divided in half diagonally and the position of the nearest point is distinguished again to estimate the rotation angle regardless of the rotation direction. Figure 13a shows the nearest point is located in Quad11 and Quad41, which must be rotated counterclockwise. However, in Figure 13b, which will be rotated clockwise, it exists in Quad12 or Quad42.
For every SRPC from P 1 to P 9 , the orientation vector with the nearest point above Quad1 or Quad4 on the right-side location is found. Then, we determine which among Quad11, Quad12, Quad41, and Quad42 the orientation vector belongs to; the determined orientation vectors are added. Finally, the direction of P 5 P 9 , P 5 P 6 , P 5 P 3 , and P 5 P 2 are selected as the candidate vectors for Quad12, Quad11, Quad42, and Quad41, respectively. Note that Quad1, Quad4, Quad11, Quad12, Quad41, and Quad42 areas in each step are formed around the corresponding SRPC.
For both horizontal and vertical line patterns, the candidate orientation vector is obtained by the same process as the lattice pattern. Hence, they can be integrated into one algorithm. Pseudocode for rotation angle estimation is represented in Algorithm 1, including the equation for finding the rotation angle.
Algorithm 1. Estimate rotation angle.
Input: A list P = [ p i ] ,   i = 0 ,   1 ,     , n 1 , where each element consists of pixel [ y , x ]
Output: Rotation Angle
1 A = [ A 11 ,   A 12 ,   A 41 ,   A 42 ] ; / / Define   a   direction   vector   A
2 A 11 = [0, 0] ,   A 12 = [0, 0] ,   A 41 = [0, 0] ,   A 42 = [0, 0]; //Initialize the direction vector elements
3
4 for   ( i = 0   to   n 1 )
5  C = sub (P, pi);  //Move the center of P to pi, C = [p0 p i ,   p 1 p i ,   , pn−1pi]
6  R = [];
7     for   ( j = 0   to   n 1 ) //Pick points which lie on the quadrant 1 or 4
8       if   ( c j [ 1 ] 0   )
9         if   ( c j [ 1 ] = = 0   and   c j [ 0 ] = = 0 ) pass;
10         else   R.append   ( c j ) ;   //R = [r0 ,   r 1 ,   ,   r m 1 ] ,   m =   len ( R )
11   d min = | r 0 p i | ;  //Initialize a minimum separation distance(MSD)
12     for   ( k = 0   to   len ( R ) 1 )
13       / / Find   minimum   vector   which   has   MSD   between   p i and R
14       if   ( | r k p i | < d min )   V min = r k ;
15  //Add the minimum vector to its direction vector element
16     if   ( V min [ 1 ] 0   and   V min [ 0 ] 0 )   //Quadrant 1
17       if   ( V min [ 1 ] V min [ 0 ] ) A 11 = add   ( A 11 ,   V min );  //Lower diagonal
18       else   A 12 = add   ( A 12 ,   V min );  //Upper diagonal
19     elseif   ( V min [ 1 ] 0   and   V min [ 0 ] < 0 )  //Quadrant 4
20       if   ( V min [ 1 ] < V min [ 0 ] ) A 41 = add   ( A 41 ,   V min ); //Lower diagonal
21       else   A 42 = add   ( A 42 ,   V min );  //Upper diagonal
22
23 if   ( A 11 = = max   ( | A | ) )   angle = arctan   ( | A 11 [ 0 ] | / | A 11 [ 1 ] |);
24 elseif   ( A 12 = = max   ( | A | ) )   angle = arctan   ( | A 12 [ 0 ] | / | A 12 [ 1 ] |);
25 elseif   ( A 41 = = max   ( | A | ) )   angle = arctan   ( | A 41 [ 1 ] | / | A 41 [ 0 ] |);
26 else   ( A 42 = = max   ( | A | ) )   angle = arctan   ( | A 42 [ 1 ] | / | A 42 [ 0 ] |);
27
28return angle

4.3. Pattern Segmentation

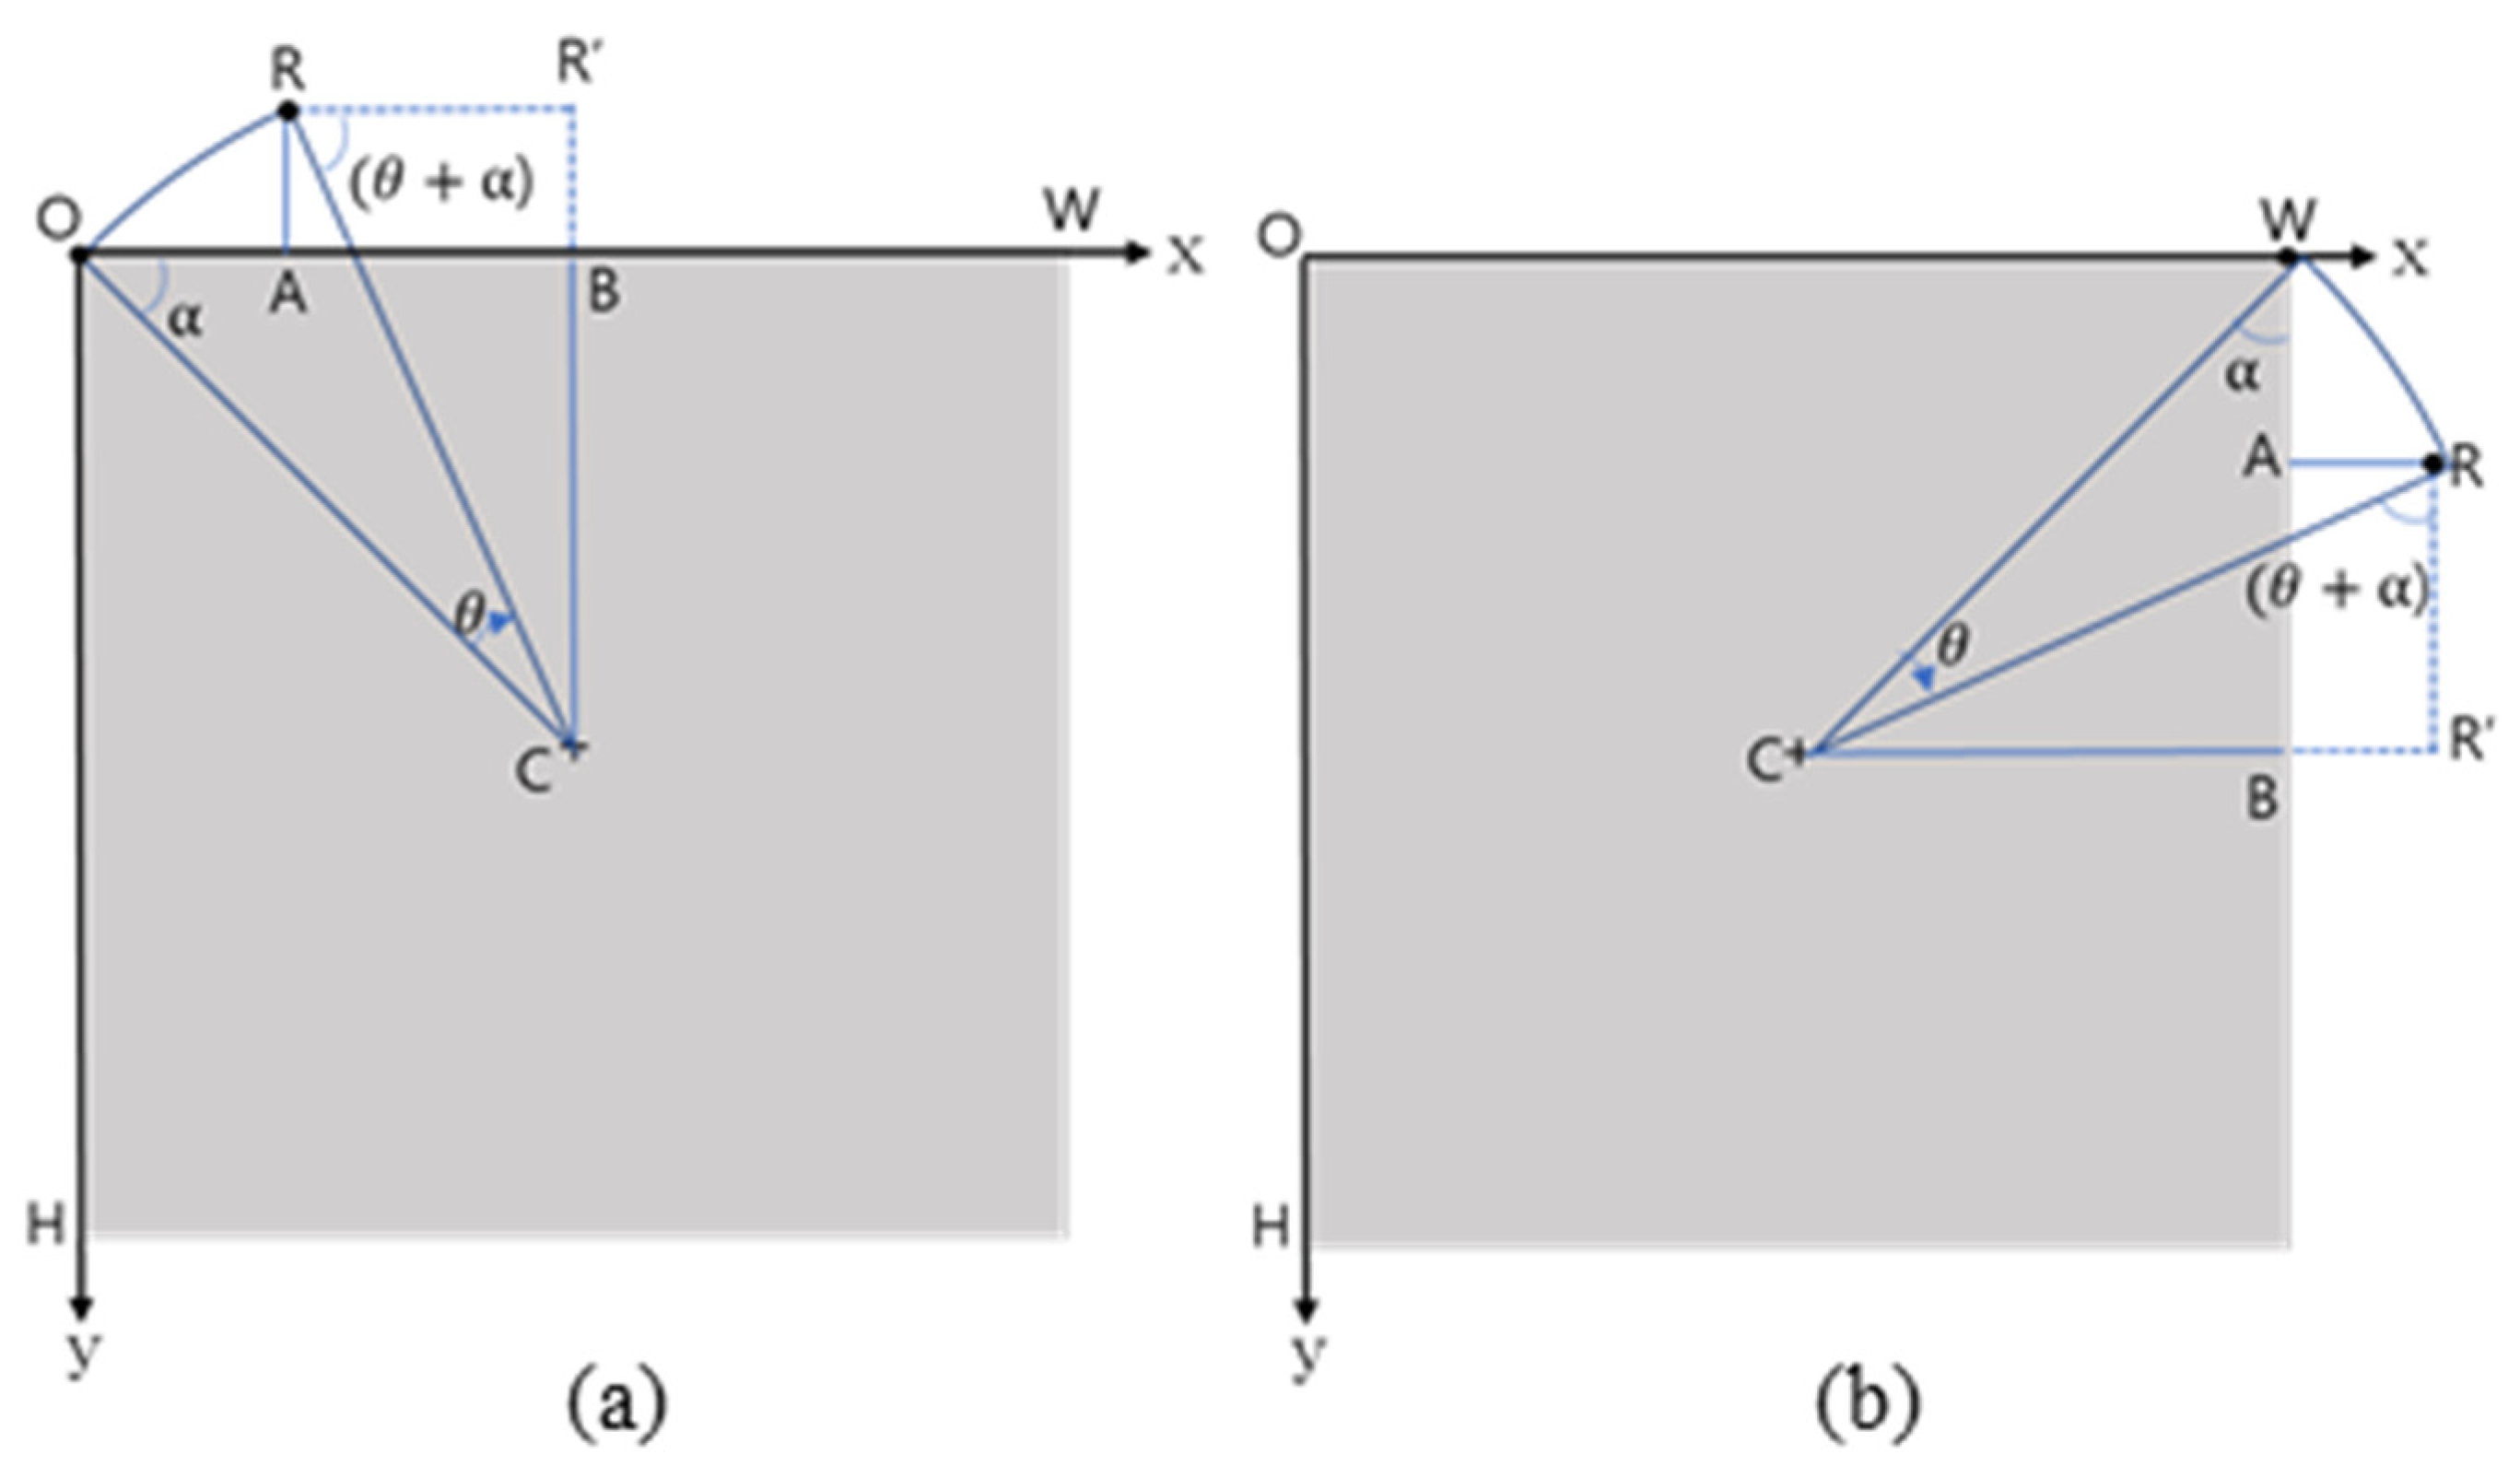
4.3.1. Correct Rotation Angle
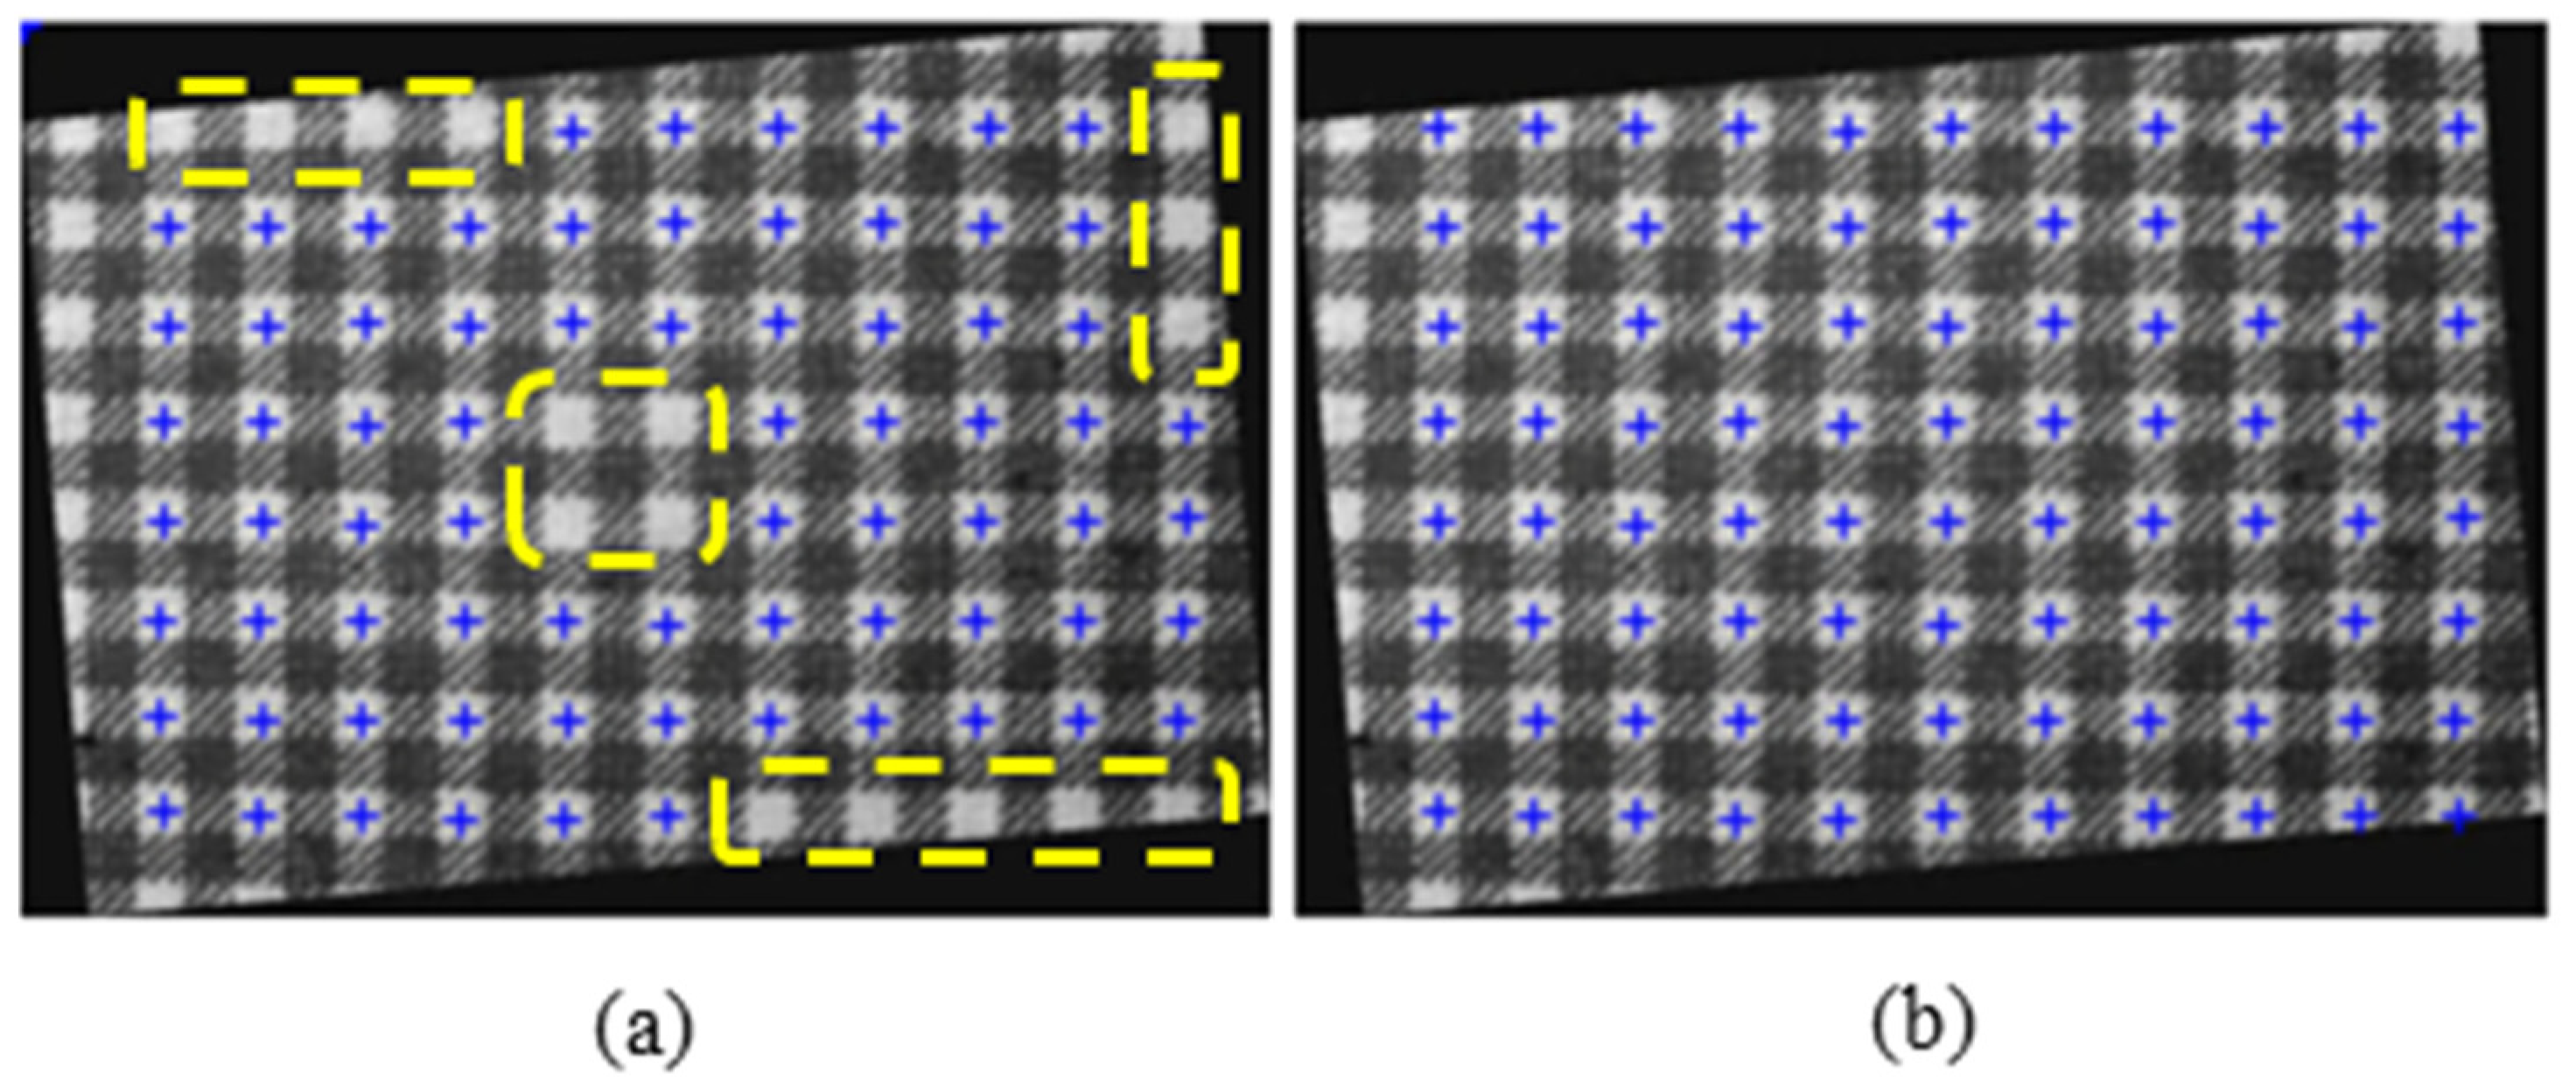
Let the position of each pixel of the original image be ( x ,   y ) , the image center be ( x 0 ,   y 0 ) and the position where all pixels are moved by the rotation angle θ is ( x ,   y ) , the conversion matrix according to affine transformation (AT) [18] is given as:
[ x y 1 ] = [ x y 1 ] [ 1 0 0 0 1 0 x 0 y 0 1 ]   [ cos θ sin θ 0 sin θ cos θ 0 0 0 1 ] [ 1 0 0 0 1 0 x 0 y 0 1 ]
If the horizontal and vertical sizes of the original image are given as ( w o ,   h o ) , then, the image size expanded by rotation ( w r ,   h r ) can be expressed as
w r = w o cos θ + h o sin θ ,   h r = w o sin θ + h o cos θ
Consequently, the final position ( x ,   y ) of new pixels including all rotation images are given as
x = ( x x 0 ) cos θ + ( y y 0 ) sin θ + x 0 + ( w r w o ) y = ( x x 0 ) sin θ + ( y y 0 ) cos θ + y 0 + ( h r h o )
The new position of the SRPC is calculated using the same method as that for the image pixel. Since the value of the rotated position value can be a real number, it must be converted to an integer.

4.3.2. SRP Decision

The positions of the points in the matrix must be specified to crop the image based on SRP. Elements are sorted in ascending order between row groups based on the y-axis coordinates for the lattice pattern; they should be sorted in ascending order with the x-axis coordinates. The row groups are sorted in ascending order based on the y-coordinate value P y , ignoring the x-coordinates. Then, the row group R o w ( i ) is changed when the difference in P y for each point exceeds the row minimum group separation distance (MGSD) D r _ m i n , which can be determined by dividing the image height H by the number of SRPCs P N , thereby assuming that the maximum number of possible rows is equal to the total number of points. In a lattice pattern, P N can range from four at the minimum to H 2 at the maximum.
D r _ m i n = H P N ,   when   4 P N H 2
P y ( n + 1 ) P y ( n )   D r _ m i n ,   ( i f .   ( P ( n + 1 ) ,   P ( n ) ) R o w ( i ) )
When determining SRP, multiple SRPC points need to be merged into a single point because the image cropping each criterion should exist as a single point. As Figure 14, two SRPC points belonging to the same column group are converted into a single SRP.
In order to merge multiple SRPCs, column grouping is performed after row grouping in the same manner as Equations (10) and (11). The columns MGSD and D c _ m i n can be determined by finding the column group Column(j) after changing height H to width W in Equation (10) and changing P y to P x , an x-coordinate, in Equation (11). Suppose multiple elements exist in the column group, either the average is obtained, or one point is selected and merged with the representative point.
Figure 15 shows the error tolerance calculated for detecting the rotation angle. If R A ¯ equals MGSD when the point at the origin O—one of the outermost edge points—rotates to R around the center C, the angle θ at that time is the maximum tolerance angle. After the tolerance angles for the row and column are determined, as shown in the following Equations (12)–(14), smaller values are selected.
α = tan 1 ( B C ¯ O B ¯ ) = tan 1 ( H W )  
sin ( θ + α ) = C R ¯ C R ¯ = H / 2 + H / P N ( H / 2 ) 2 + ( W / 2 ) 2 = ( P N + 2 ) H P N H 2 + W 2
θ r = sin 1 ( H + 2 D r _ m i n H 2 + W 2 ) tan 1 ( H W ) ,   D r _ m i n = H P N
The column case Equation (15) also can be derived by the same way of the row tolerance angle.
θ c = sin 1 ( W + 2 D c _ m i n H 2 + W 2 ) tan 1 ( W H )
For the Tilda [19] lattice image of 768 × 512 pixels, θ r and θ c are calculated as 4.84° and 8.32°, respectively, meaning that even if the rotation-angle estimation error is as large as 4.84°, the SRP group is maintained and there is no problem segmenting the image.
The line pattern has a larger number of SRPCs than the lattice pattern; the difference between groups is larger than the difference between group elements. For grouping, the SRPCs of the vertical line are sorted in the ascending order from values on the x-axis, and those of the horizontal line are sorted in the ascending order corresponding to values on the y-axis. When the differences between the sorted points are determined, they are squared and averaged. This average value becomes the reference value for grouping, i.e., C G .
C G = n = 1 N 1 ( P ( n + 1 ) P ( n ) ) 2 N 1 ,   N = SRPC   number ,
These values are squared to prevent an increase in the number of groups caused by a decrease in grouping reference values using the average effect if the number of SRPCs is too large compared to the number of groups. Suppose the square of the difference between the sorted points is smaller than the grouping reference value, the points are assigned to the same group; however, if it is larger, they are separated. The final grouping follows this manner. Once the grouping is completed, the final SRP is determined.
For the lattice pattern, once the SRP is generated when omissions or additional images should be secured as shown in Figure 16a, the SRP to be used is finally determined.
Figure 17 shows the SRP result for the vertical line pattern. The average value of the group elements C is the reference value of the corresponding pattern direction; the average of the reference values is used as the segment length value D in the direction orthogonal to the pattern. The same method is applicable to the horizontal line pattern.

5. Simulation

The simulation environment comprises an Intel® Core™ i7-7820HK CPU @2.9 GHz, 32 GB RAM, and Nvidia GeForce GTX 1070 GPU as the hardware; It is simulated with Python 3.7.7 using libraries such as OpenCV, ScipPy, and skimage on a system with Windows 10 64bit OS.
For the target image data, the lattice and line pattern images are used with the TILDA images. As shown in Figure 18, various positions and rotation angles are applied for the normal case and the seven defect types. A total of 806 images including about 50 images for the pattern and error type were used. Each image consists of 768 × 512 pixels of gray-level.
Optimal performance of the rotation angle cannot be achieved with the image data only. Tilda does not have accurate rotation-angle information and the directly photographed fabric images can collect different information of the linear components by area depending on the characteristics of the optical system. Hence, the accuracy of the rotation-angle estimation is subjective.
Therefore, to measure the accuracy of rotation-angle estimation, the lattice and line pattern images are directly generated as in Figure 7b,c. Furthermore, the performance of the conventional algorithms is measured for the same images to examine their relative difference in performance. By rotating in 0.1° units in the range of −44 to 44, 881 data points were generated for each pattern shape.
The image segmentation test applied the rotation-angle estimation algorithm to Tilda images and the correlation of the segmented images was calculated and analyzed.

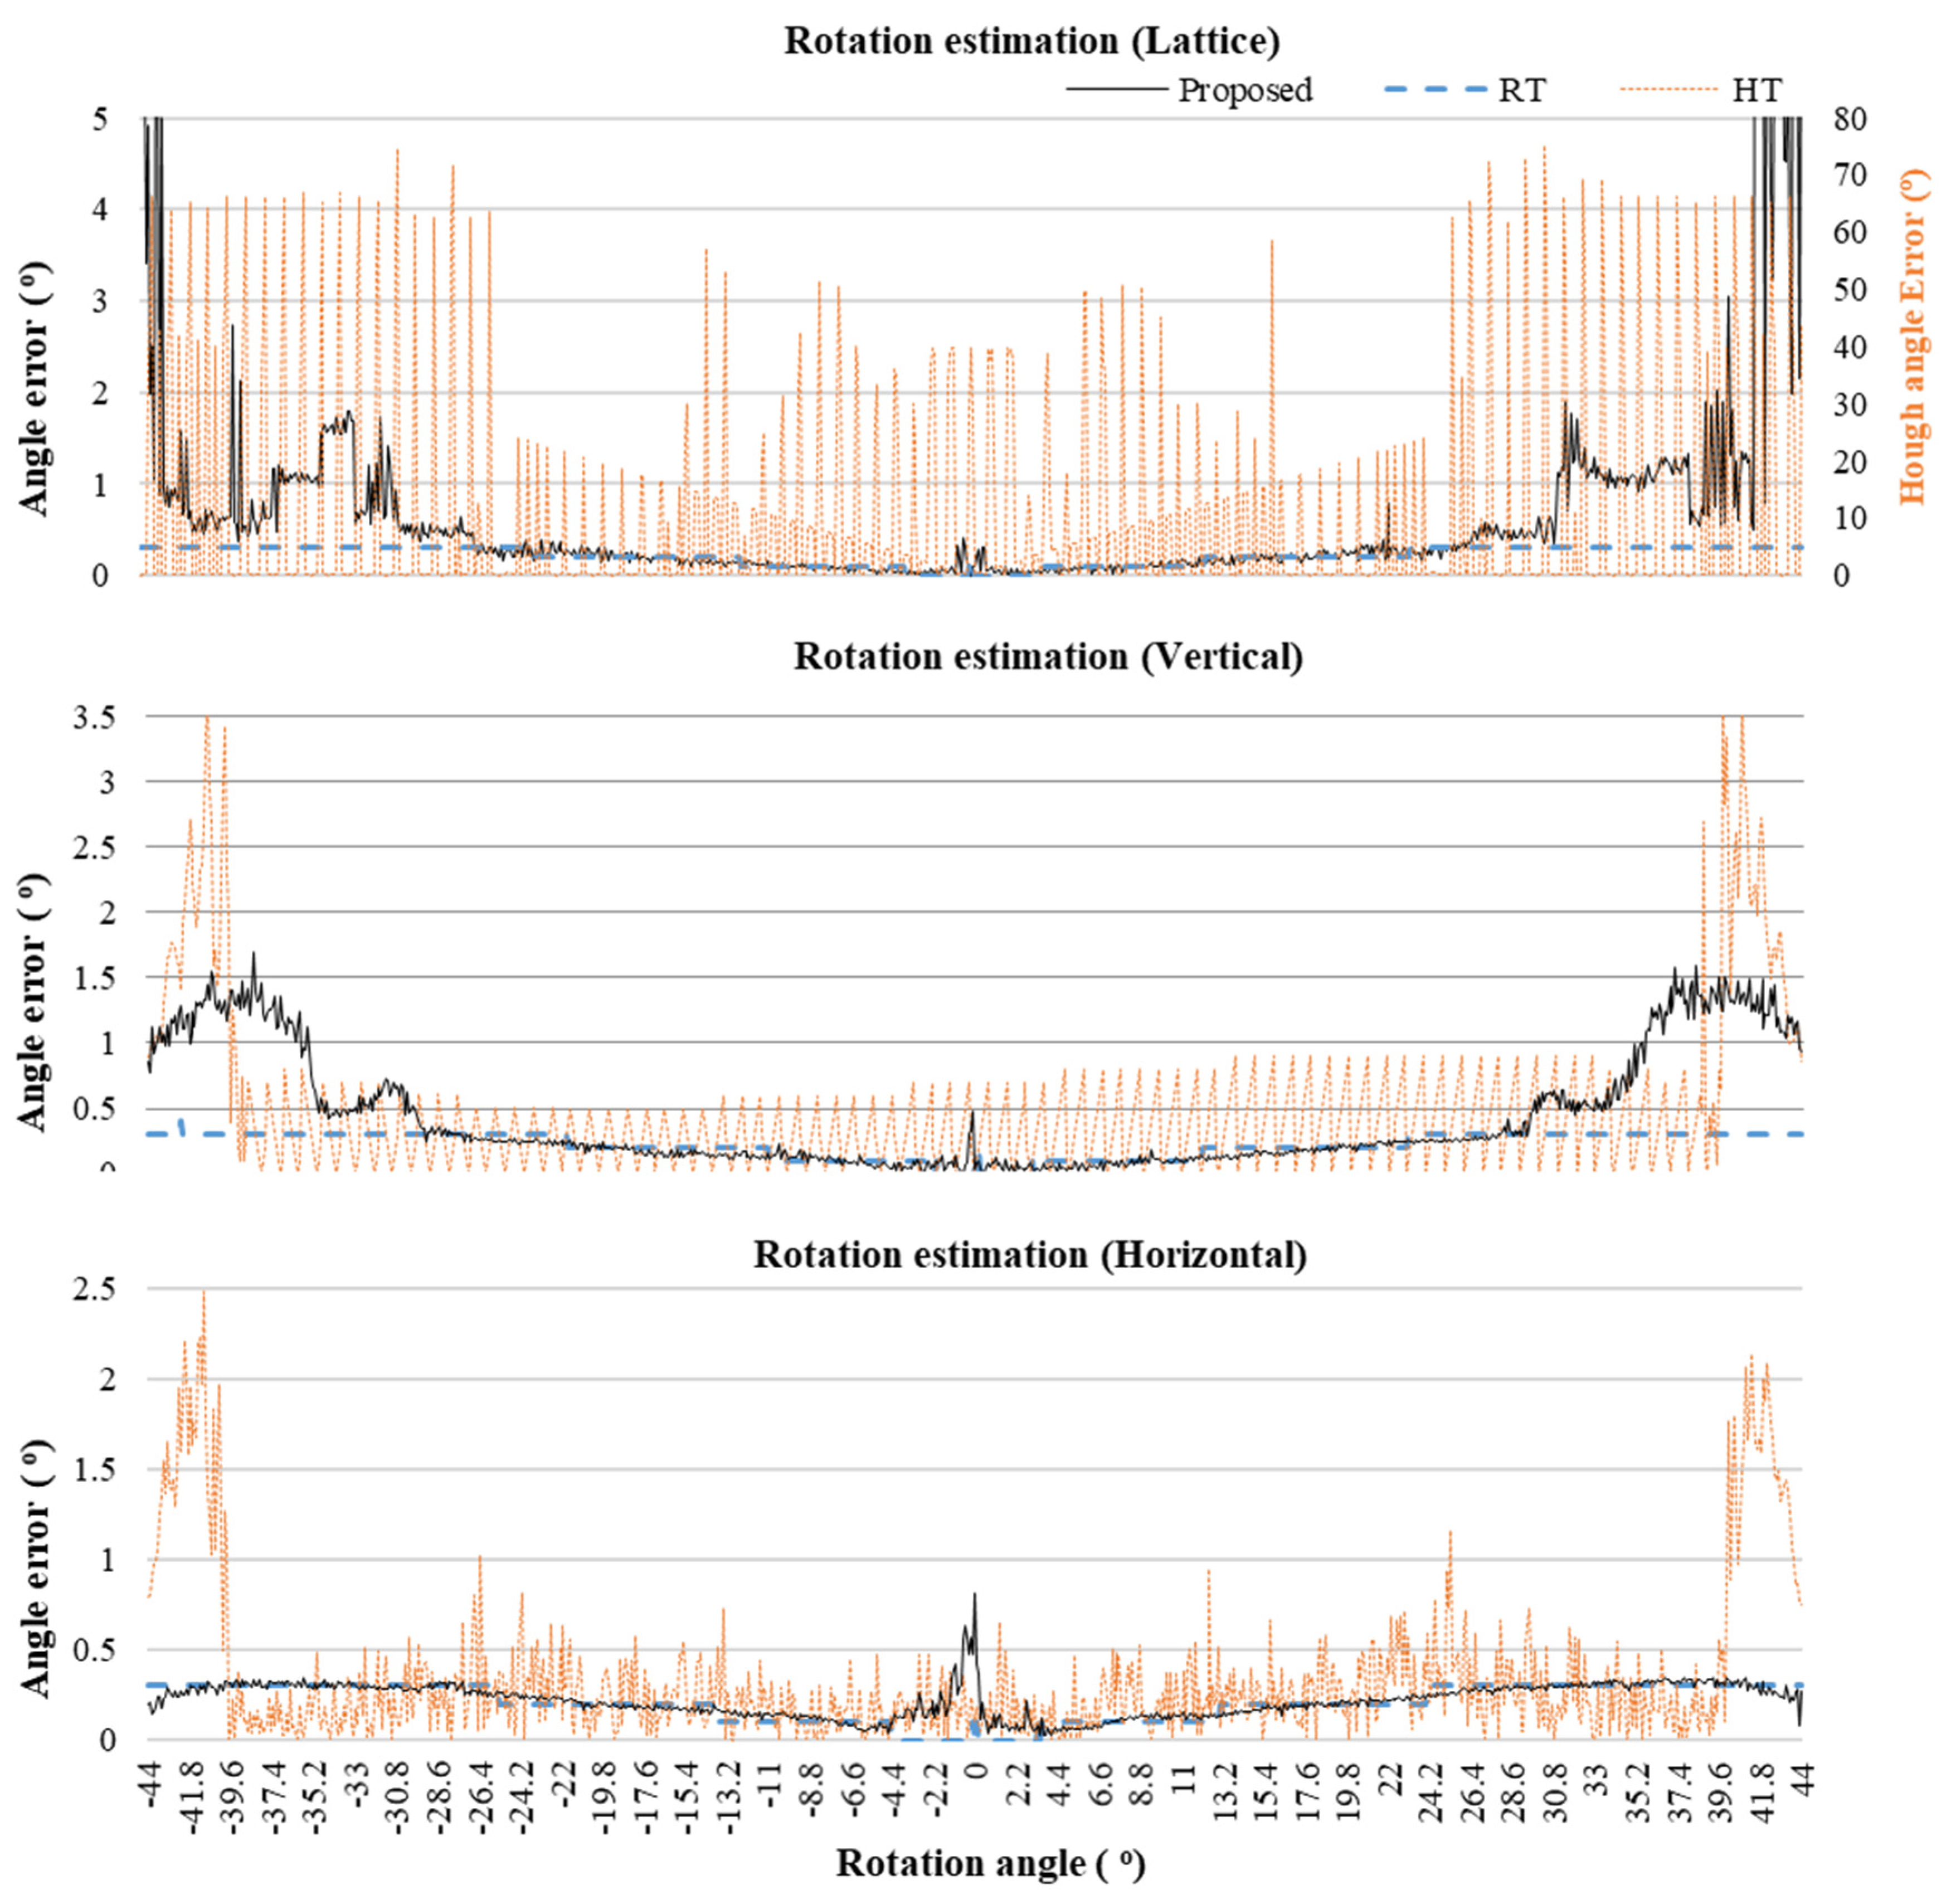
5.1. Error of Rotation-Angle Estimation

This section discusses the results of the rotation-angle estimation obtained by applying the RT, HT, and the proposed algorithm to the generated lattice, vertical, and horizontal line patterns containing the same rotation-angle error.
Figure 19 shows the error of the rotation-angle estimation. RT shows good and stable performance in the range 0.3~0.4 for every pattern. Since the test was performed in 0.1° units, the error increased by 0.1° steps for every pattern.
For HT, the lattice and line patterns show distinct differences in performance. The maximum error in line patterns is below 1° within ±39° for both vertical and horizontal line patterns. However, the lattice pattern shows a low performance at specific rotation angles and the error is several tens of degrees large at many angles. The reason is illustrated in Figure 7a. Viewing the pattern shape in detail, we see that linear components exist at other angles that are not lattice components of the pattern.
The proposed algorithm has an error of 0.8° or less within ±30° and 2° or less within ±41.5° for all patterns. Since actual fabrics have extreme rotation angles below ±40°, then the proposed algorithm is suitable for the application. Even with a large rotation angle, it does not affect the line patterns and solves the lattice patterns problem by performing the proposed algorithm twice.
Summarily, it is difficult to apply HT to lattice patterns. The proposed algorithm has the lowest error value, similar to RT, in actual operating environments. The accurate prediction of rotation angles increased the probability of elaborating pattern segmentation. Although RT shows good performance in rotation estimation, it is not suitable for fabric vision inspection because of its long performance time. Figure 20 shows the result of measuring the time required for rotation-angle estimation. When the resolution was set to 0.1°, it took approximately 30 s in most cases regardless of the pattern type and rotation angle. This required time can be reduced by lowering the detection resolution and if the resolution is increased, the required time becomes longer. Even if the required time is reduced to 1/10 by lowering the resolution to 1°, that of 3~4 s is still unacceptable for machine vision inspection.
The required time for HT-based rotation-angle estimation was the shortest among the compared methods. As with RT, the generated image was measured with a detection resolution of 0.1°. In every pattern, it was 0.05 s or less at most rotation angles and was less than 0.2 s in the worst case. If only the required time is considered, then HT is the most suitable for actual system applications. However, with respect to the accuracy of rotation-angle estimation, HT is applicable only under specific conditions because of the large estimated error angle from the lattice pattern and the errors generated from the parameter settings.
The proposed algorithm shows stable results of 0.1~0.3 s within ±25°; the required time increased as the boundary value approached ±45°. The pattern rotations of images photographed within one roll of fabrics did not show significant differences. Hence, it applies to actual operation because the rotation angle can be estimated for the first few images are applied to the entire fabrics.
The number of SRPCs has the largest effect on the required time of the proposed algorithm. This is because the larger the number of SRPCs, the more time it takes for the SRPCs to be generated and determined in extracting the orientation vector. However, the number of SRPCs depends on the pattern type. In this experiment, the maximum number of SRPCs is generated by assuming the segmentation of the image in pattern units of minimum size. However, in the actual case, especially for line patterns, a smaller time is expected because there is a high possibility of dividing several basic patterns into groups.
As such, SRPC-based estimation of rotation angle is the best method for vision inspection of patterned fabric because it has the highest level of performance and takes a short computation time.

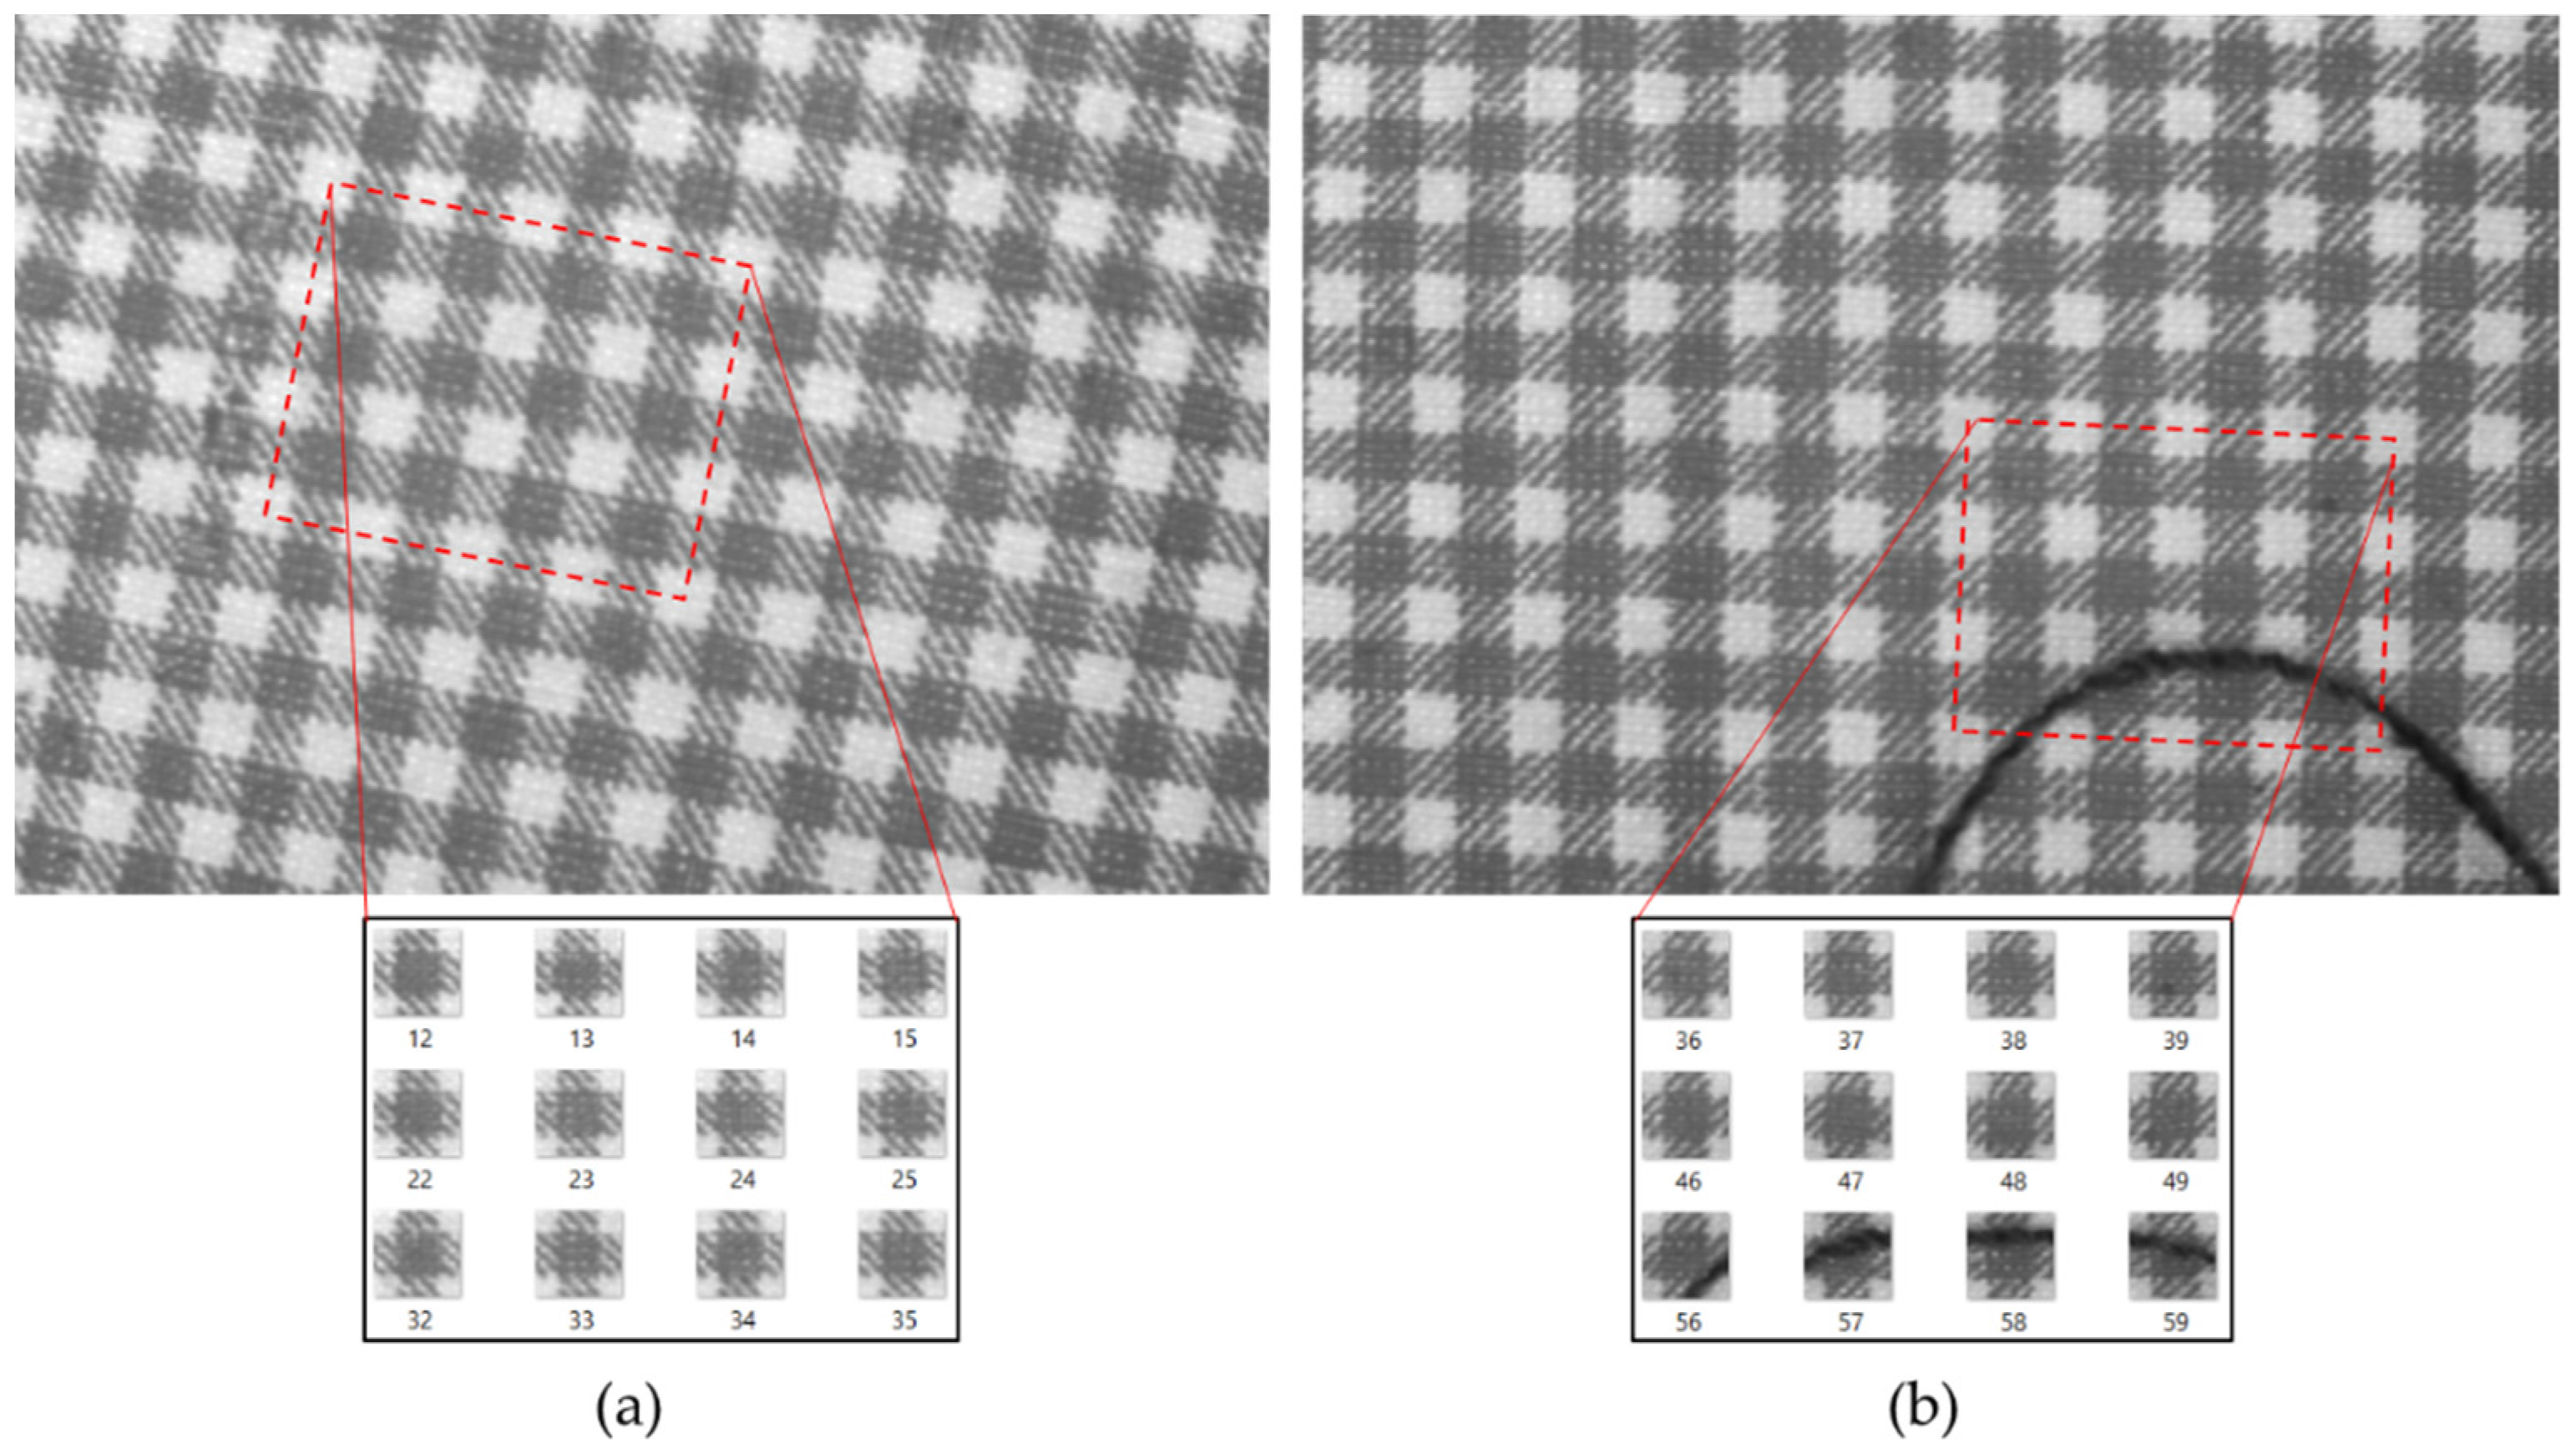
5.2. Segmented Images Similarity (SIS)

Image segmentation is performed after the estimated rotation angle for Tilda images is corrected. Figure 21 shows a segmentation result using the proposed algorithm. Even though normal and abnormal cases have rotation or distortion, the segmentation is well performed. This study compared the image segmentation performance of the conventional TC method with that of SRP-based image segmentation using Equation (15) for normalized cross-correlation (NCC).
To determine the similarity between two images I 1 and I 2 , all the pixels are multiplied with each other and the results are summed up and then divided by the size for normalization. The resulting value is closer to 1 if they are similar.
R 12 ( x ,   y ) = ( i ,   j ) W I 1 ( i ,   j ) · I 2 ( x + i ,   y + j ) ( i ,   j ) W I 1 2 ( i ,   j ) · ( i ,   j ) W I 2 2 ( x + i ,   y + j ) 2 ,
When there are N-generated template images, the NCC operation values of N–1 images, except themselves, are added. This calculation is performed for all N images as shown in Equation (16); furthermore, the resulting value is divided by the total number of additions. Thus, we can measure how similar the original image was segmented.
S I S = 1 N ( N 1 ) m = 1 N n = 1 n m N R m n ,
Table 1 shows the NCC-based SIS performance result. The conventional method showed large differences in performance between normal and error images; however, the proposed algorithm shows a relatively even performance. The conventional algorithm is vulnerable to defects because the segmentation size is constant and feature point information is not used. Particularly, the correlation is low when there are many wrinkles or if distance distortion occurs. The proposed algorithm regenerates feature points lost by defects and removes duplicates based on the SRPC, thereby flexibly adjusting the segmentation size to minimize the information difference between segmented images.
The proposed algorithm also showed relatively low performance with wrinkles. In lattice patterns, both horizontal and vertical SRPCs exist, whereas, for the line patterns, the SRPCs are extracted only in the pattern direction. Thus, defects across them or defects existing in a wide area affect performance.
When the proposed algorithm is applied having a limitation in image segmentation besides wrinkle images, image segmentation with a mean correlation of 0.72 or higher is possible. Such results demonstrate that the similarity between segmented images is high, meaning the quality of input data is also high, thus increases defect detection performance. Considering that a satisfactory detection performance was achieved when deep learning was used with images segmented by the TC method, a higher performance can be attained using the proposed method. The performance difference by image type is partly related to the error in rotation-angle estimation and the limited number of Tilda images. Therefore, the reliability of the performance result can be improved if more images are used.

6. Conclusions

This paper described a method for appropriately segmenting fabric images with rotated or defective lattice and line patterns that can be used as a deep learning input data for machine vision inspection. Images segmented using conventional methods had large errors from estimating the rotation angle or the performance time was long. Several performance variations by threshold, and the need for setting these thresholds depending on the fabric pattern shapes were other problems to be solved.
Since the absolute rotation angle is calculated by considering only the orientation vector of the SRPC instead of all pixels, the calculation time can be reduced while satisfying the required accuracy. Furthermore, the variables required for algorithm performance such as MSD were automatically obtained from the corresponding the pattern shape.
The rotation angle estimated was similar to that of RT, which has the highest accuracy for all pattern types. The performance time was longer than that of HT; however, it was considerably shorter than RT, which shows suitability for actual vision inspection.
In the image segmentation step, conventional methods had low SIS because the rotation angle of the image was not accurately estimated or there was a defect. In contrast, the proposed method can achieve a relatively high SIS by increasing the robustness for image rotation and defects in image segmentation because it uses the SRPC extracted based on EDM.
If the results of this study are applied to machine vision inspection for fabrics using deep learning, the objects of inspection can be expanded from a single color and unrotated patterns to lattices with rotations and line patterns. Improved error detection accuracy is possible by reducing the time required for deep learning and enhancing the SIS by removing the data augmentation process through a rotation-angle estimation. The proposed method can be applied to several fields that require rotation-angle estimation or image segmentation because of patterns. It can also be applied to defect inspection in smart factories and geographic information systems in addition to the fabric inspection.
The time required for line patterns is irregular compared to lattice patterns because the number of SRPCs is relatively large. Thus, a method that prevents an increase in the number of SRPCs according to the line pattern shape is additionally required. This study has a limitation, which is the difficulty of applying the proposed method to repeated patterns of a general design.
In the future, studies on the configuration of neural networks and the measurement of inspection performance using segmented images in deep learning-based fabric inspection are expected. Further research will also cover the comparison between original and segmented images as deep-learning input with respect to overall time consumptions including training and inspection. Furthermore, algorithms that can be applied to more diverse fields and pattern types should be developed, and additional methods to enhance the performance of the rotation-angle estimation and reduce the required time should be explored.

Author Contributions

Conceptualization, C.O. and H.K.; methodology, C.O.; software, C.O.; validation, C.O., H.K.; formal analysis, C.O.; investigation, C.O.; resources, H.K.; data curation, H.K.; writing—original draft preparation, C.O.; writing—review and editing, C.O., H.K. and H.C.; visualization, C.O.; supervision, H.C.; project administration, H.C. All authors have read and agreed to the published version of the manuscript.

Funding

This work was supported by Electronics and Telecommunications Research Institute (ETRI) grant funded by the Korean government. [21YR2100, Development of smart pen for handwriting recognition of children].

Acknowledgments

The authors give thanks to the contributors to the TILDA datasets.

Conflicts of Interest

The authors declare no conflict of interest.

References

  1. Li, P.; Zhao, Z.; Zhang, L.; Zhang, H.; Jing, J. The Real-Time Vision System for Fabric Defect Detection with Combined Approach. In Proceedings of the 8th Internal Conference on Image and Graphics, Tianjin, China, 13–16 August 2015; pp. 460–473. [Google Scholar]
  2. Sotiropoulos, Y. Handling Variable Shaped & High-Resolution Images for Multi-Class Classification Problem. Master’s Thesis, University Polytechnique of Catalunya, Barcelona, Spain, April 2020; p. 1. [Google Scholar]
  3. Huang, S.; Pan, Y. Automated Visual Inspection in the Semiconductor Industry: A survey. Comput. Ind. 2015, 66, 1–10. [Google Scholar] [CrossRef]
  4. Wang, L.; Zhang, D.; Guo, J.; Han, Y. Image Anomaly Detection Using Normal Data Only by Latent Space Resampling. Appl. Sci. 2020, 10, 8660. [Google Scholar] [CrossRef]
  5. Liu, K.; Li, A.; Wen, X.; Chen, H.; Yang, P. Steel Surface Defect Detection Using GAN and One-Class Classifier. In Proceedings of the 2019 25th International Conference on Automation and Computing (ICAC), Lancaster, UK, 5–7 September 2019; pp. 1–6. [Google Scholar]
  6. Li, Y.; Zhao, W.; Pan, J. Deformable Patterned Fabric Defect Detection with Fisher Criterion-Based Deep Learning. IEEE Trans. Autom. Sci. Eng. 2017, 14, 1256–1264. [Google Scholar] [CrossRef]
  7. Chang, X.; Gu, C.; Liang, J.; Xu, X. Fabric Defect Detection Based on Pattern Template Correction. Math. Prob. Eng. 2018, 2018, 3709821. [Google Scholar] [CrossRef]
  8. Deans, S.R. The Radon Transform and Some of Its Applications; Wiley: New York, NY, USA, 1983. [Google Scholar]
  9. Dupa, R.O.; Hart, P.E. Use of the Hough Transformation to Detect Lines and Curves in Pictures. Commun. ACM 1972, 15, 11–15. [Google Scholar]
  10. Cui, Z.; Qi, W.; Liu, Y. A Fast Image Template Matching Algorithm Based on Normalized Cross Correlation. J. Phys. Conf. Ser. 2020, 1693, 012163. [Google Scholar] [CrossRef]
  11. Spiclin, Z.; Bukovec, M.; Pernus, F.; Likar, B. Image registration for visual inspection of imprinted pharmaceutical tablets. Mach. Vis. Appl. 2011, 22, 197–206. [Google Scholar] [CrossRef]
  12. Bratani, B.; Pernuá, F.; Likar, B.; Tomaževi, D. Real-time rotation estimation using histograms of oriented gradients. PLoS ONE 2014, 9, e92137. [Google Scholar] [CrossRef] [PubMed]
  13. Kourosh, J.K.; Hamid, S.Z. Radon Transform Orientation Estimation for Rotation Invariant Texture Analysis. IEEE Trans. Pattern Anal. Mach. Intell. 2005, 27, 1004–1008. [Google Scholar]
  14. Canny, J. A Computational Approach to Edge Detection. IEEE Trans. Pattern Anal. Mach. Intell. 1986, PAMI-8, 679–698. [Google Scholar] [CrossRef]
  15. Danielsson, P.E. Euclidean Distance Mapping. Comput. Graph. Image Process. 1980, 14, 227–248. [Google Scholar] [CrossRef] [Green Version]
  16. Otsu, N. A Threshold Selection Method from Gray-level Histograms. IEEE Trans. Syst. Man. Cyber. 1979, 9, 62–66. [Google Scholar] [CrossRef] [Green Version]
  17. Grana, C.; Borghesani, D.; Cucchiara, R. Optimized Block-based Connected Components Labeling with Decision Trees. IEEE Trans. Image Process. 2010, 19, 1596–1609. [Google Scholar] [CrossRef] [PubMed] [Green Version]
  18. Hartley, R.; Zisserman, A. Multiple View Geometry in Computer Vision, 2nd ed.; Cambridge University Press: Cambridge, UK, 2004; pp. 37–44. [Google Scholar]
  19. Workgroup on Texture Analysis of DFG, TILDA Textile Texture-Database V1.0. 1996. Available online: http://lmb.informatik.uni-freiburg.de/resources/datasets/tilda.en.html (accessed on 4 September 2021).
Figure 1. Examples of an acquired image from the machine vision camera: (a) semiconductor; (b) concrete; (c) pattern.
Electronics 10 03040 g001
Figure 2. A false negative case after learning by only normal augmented images.
Electronics 10 03040 g002
Figure 3. Cropping examples for un-rotated images.
Electronics 10 03040 g003
Figure 4. A conceptual diagram of RT.
Electronics 10 03040 g004
Figure 5. Radon transform of a textile image.
Electronics 10 03040 g005
Figure 6. A conceptual diagram of HT.
Electronics 10 03040 g006
Figure 7. Line detection via HT: (a) error case; (b) lattice normal; (c) line normal.
Electronics 10 03040 g007
Figure 8. A concept of fabric defect detection using multiple cameras.
Electronics 10 03040 g008
Figure 9. Procedure of proposed image segmentation method.
Electronics 10 03040 g009
Figure 10. EDM image: (a) binary; (b) EDM result.
Electronics 10 03040 g010
Figure 11. CCL result: (a) lattice; (b) line.
Electronics 10 03040 g011
Figure 12. SRPC example: (a) lattice; (b) line.
Electronics 10 03040 g012
Figure 13. Area of orientation vector with its rotation angle: (a) counterclockwise; (b) clockwise.
Electronics 10 03040 g013
Figure 14. An example of merging SRPC.
Electronics 10 03040 g014
Figure 15. Angle error tolerance: (a) row; (b) column.
Electronics 10 03040 g015
Figure 16. SRP generation: (a) before filled; (b) filled.
Electronics 10 03040 g016
Figure 17. SRP decision for line pattern.
Electronics 10 03040 g017
Figure 18. Error types of cropped TILDA image: (a) normal; (b) hole or cut; (c) stain; (d) missing; (e) foreign matter; (f) crease; (g) shade; and (h) distortion.
Electronics 10 03040 g018
Figure 19. Error in rotation-angle estimation.
Electronics 10 03040 g019
Figure 20. Time consumption in rotation-angle estimation.
Electronics 10 03040 g020
Figure 21. Image segmentation result: (a) rotated normal case; (b) rotated abnormal case.
Electronics 10 03040 g021
Table 1. SIS of segmented images by error type.
Pattern TypeAlgorithmError Type
NormalE1E2E3E4E5E6E7
latticeTC0.7850.5370.3960.6940.5750.1120.5830.435
SRP0.9140.8750.8860.8770.8780.8730.8890.855
verticalTC0.7580.6830.6200.6740.5600.0980.7110.503
SRP0.9350.8960.8730.8770.7250.4530.8950.862
horizontalTC0.7660.6300.6330.7070.5430.4510.6940.520
SRP0.8820.8090.8270.8670.8970.6530.7920.822
Publisher’s Note: MDPI stays neutral with regard to jurisdictional claims in published maps and institutional affiliations.

