1. Introduction
With the increasing data traffic in wireless and vehicular networks, it has become difficult to meet data traffic requirements. To this end, cellular network architectures have been researched as a potential solution. In traditional architectures, one base station (BS) is deployed in one cell to provide voice and data services. To improve the bandwidth for 5G cellular networks, many architectures have been studied including heterogeneous network (HetNet), cloud radio access network (C-RAN), and heterogeneous cloud radio access network (H-CRAN).
In HetNet, one macro-cell and multi-small cells are overlapped to satisfy the rapidly growing data traffic requirements. The small cells cover a smaller range than the macro cell and are deployed close to users to provide a higher data rate. However, small cells also consume more system energy at BSs than traditional network architectures. To minimize the system energy consumption, the BS structure is divided into baseband unit (BBU) and remote radio head (RRH) in C-RAN. The BBUs that process signals are centralized in a BBU pool and RRHs that serve as radio-frequency transceivers are distributed in the cells. However, it also causes serious interference because of the dense deployment. The H-CRAN has been developed to utilize the advantage of both HetNet and C-RAN [
1]. In one cell of H-CRAN, multiple small RRHs are connected to the BBU pool through fronthaul links and a macro BS is connected to the BBU pool through the backhaul link. The macro BS functions only as a voice service, and RRHs function only as wireless data services. Hence, the BBU pool can manage and allocate communication resources efficiently.
Device-to-device (D2D) communication has also been developed to satisfy the high data rate requirements. With D2D communication, nearby wireless devices can communicate directly without RRHs, reducing the system energy consumption. However, the rapidly varying channel condition owing to high mobility in the vehicular environment makes it difficult to collect instantaneous channel state information (CSI) at RRH. Unlike common wireless networks, data traffic in vehicular networks can have regularities in the spatial—temporal dimension as a result of the periodicity in urban traffic flow [
2]. Hence, considerable research has been conducted on vehicle-to-everything (V2X) communication to improve road safety and to ensure reliable and low latency services [
3,
4,
5,
6]. Two communication modes in cellular V2X, vehicle-to-infrastructure (V2I) and vehicle-to-vehicle (V2V) have been modified to accommodate various vehicular applications.
In this paper, we propose a deep reinforcement learning (DRL) based resource allocation algorithm with a clustering method in cellular V2X communication. In our algorithm, neighboring RRHs are grouped to reduce signaling overhead in DRL deployments. Vehicles are clustered to collect periodical messages and request resource allocation to minimize system energy consumption. The DRL based resource allocation learns an optimal allocation strategy to maximize the sum of achievable data rates. As there is a trade-off relationship between the energy consumption and achievable data rate, it is important to identify the strategy that optimizes both objectives. Hence, the main goal of our proposed algorithm is to maximize the system energy efficiency while ensuring quality of service (QoS) and reliability.
The remainder of this paper is organized as follows.
Section 2 provides an overview of related works. In
Section 3, we describe the system model and formulate the problem.
Section 4 presents the proposed algorithm, which consists of RRH grouping, vehicle clustering, and DRL based resource allocation. A performance evaluation and discussion on our proposed algorithm are presented in
Section 5. Finally, we present the conclusion in
Section 6.
2. Related Works
Several optimization methods have been studied to improve system energy efficiency and QoS in vehicular networks [
7]. In ref. [
8], a context based scheduling scheme was proposed that uses the geographical location of vehicles and the interference level of shared resources. The distribution of interference is obtained through resource allocation and the reduction of packet collisions ensures stable management of resources. The cluster method classifies vehicles into different groups to facilitate dissemination of messages to other vehicles, as a typical method of vehicular communication. In ref. [
9], a low-cost cluster-based communication method, which includes data estimation, was developed to improve the QoS of driver assistance with crash warning application. The intra-cluster communication method was applied for data estimation to reduce the additional cost of inter-cluster communication.
It is difficult to ensure QoS requirements of the various existing algorithms that exploit traditional optimization methods. Machine learning has shown promise in addressing decision-making problems involving uncertain network communications [
10]. The method finds optimal or close to optimal solutions in the uncertain and inherently non-stationary environment of vehicular networks. In [
11], a reinforcement learning scheme was developed to fulfill the diverse requirements of different entities with stringent QoS requirements. This algorithm can minimize the overhead of resource provisioning for vehicular clouds. In [
12], an online reinforcement learning based user association algorithm for network balancing was proposed to cope with dynamic changes using historical-based reinforcement learning. In [
13], a two-level cluster-based routing method was developed for efficient data dissemination by adjusting two cluster methods, level-1 cluster heads and level-2 cluster heads. The level-1 cluster heads were selected by applying fuzzy logic to relative velocity, k-connectivity and link reliability factors. The level-2 cluster heads were selected by Q-learning to reduce communication overhead.
In vehicular networks with multiple sensing components and realistic channel gain, high mobility generates large-scale continuous state space, which makes Q-learning inefficient. DRL, which uses deep neural networks (DNN) to represent the Q-table, can be modified to solve resource allocation problem in vehicular networks such that the continuous state is a direct input to the DNN [
14]. In [
15], the deep deterministic policy gradient (DDPG) based resource allocation scheme was proposed to maximize the sum rate of V2I communications, where the resource allocation problem is formulated as a decentralized discrete-time and finite-state Markov decision process (MDP) with incomplete network information. DDPG is capable of handling continuous high-dimensional action spaces while determining the optimal resource allocation strategy. In [
16], a decentralized resource allocation mechanism based on DRL was proposed to maximize the achievable data rate and minimize the interference of V2I communications. DRL can be modified to both unicast and broadcast scenarios with a V2V vehicle as an agent. The agent decides on the optimal sub-band and transmission power levels. In [
17], a DRL based decentralized mode selection and resource allocation algorithm was proposed to maximize the sum capacity while meeting the latency and reliability requirements. The mode selection and resource allocation problems were formulated as a Markov decision process to select the optimal transmission mode, sub-band and transmission power level. To address the limitations of local DRL models, a two-timescale federated DRL and graph theory based vehicle clustering method was developed.
High mobility in vehicular networks results in frequent handover and channel state changes. The aforementioned studies consider neither realistic vehicle mobility nor changing channel states. Channel state changes caused by high mobility result in the frequent update of channel information, causing signaling overhead and latency. Therefore, an appropriate method is required to maximize system energy efficiency while reducing signaling overhead and guaranteeing latency requirements. Typical optimization methods are highly complex and incur signaling overhead. The Q-learning method is not capable of processing high-dimensional data or learning directly the network data. Hence, there is need for research on a DRL based technique capable of reducing the signaling overhead of channel state updates generated from vehicle mobility.
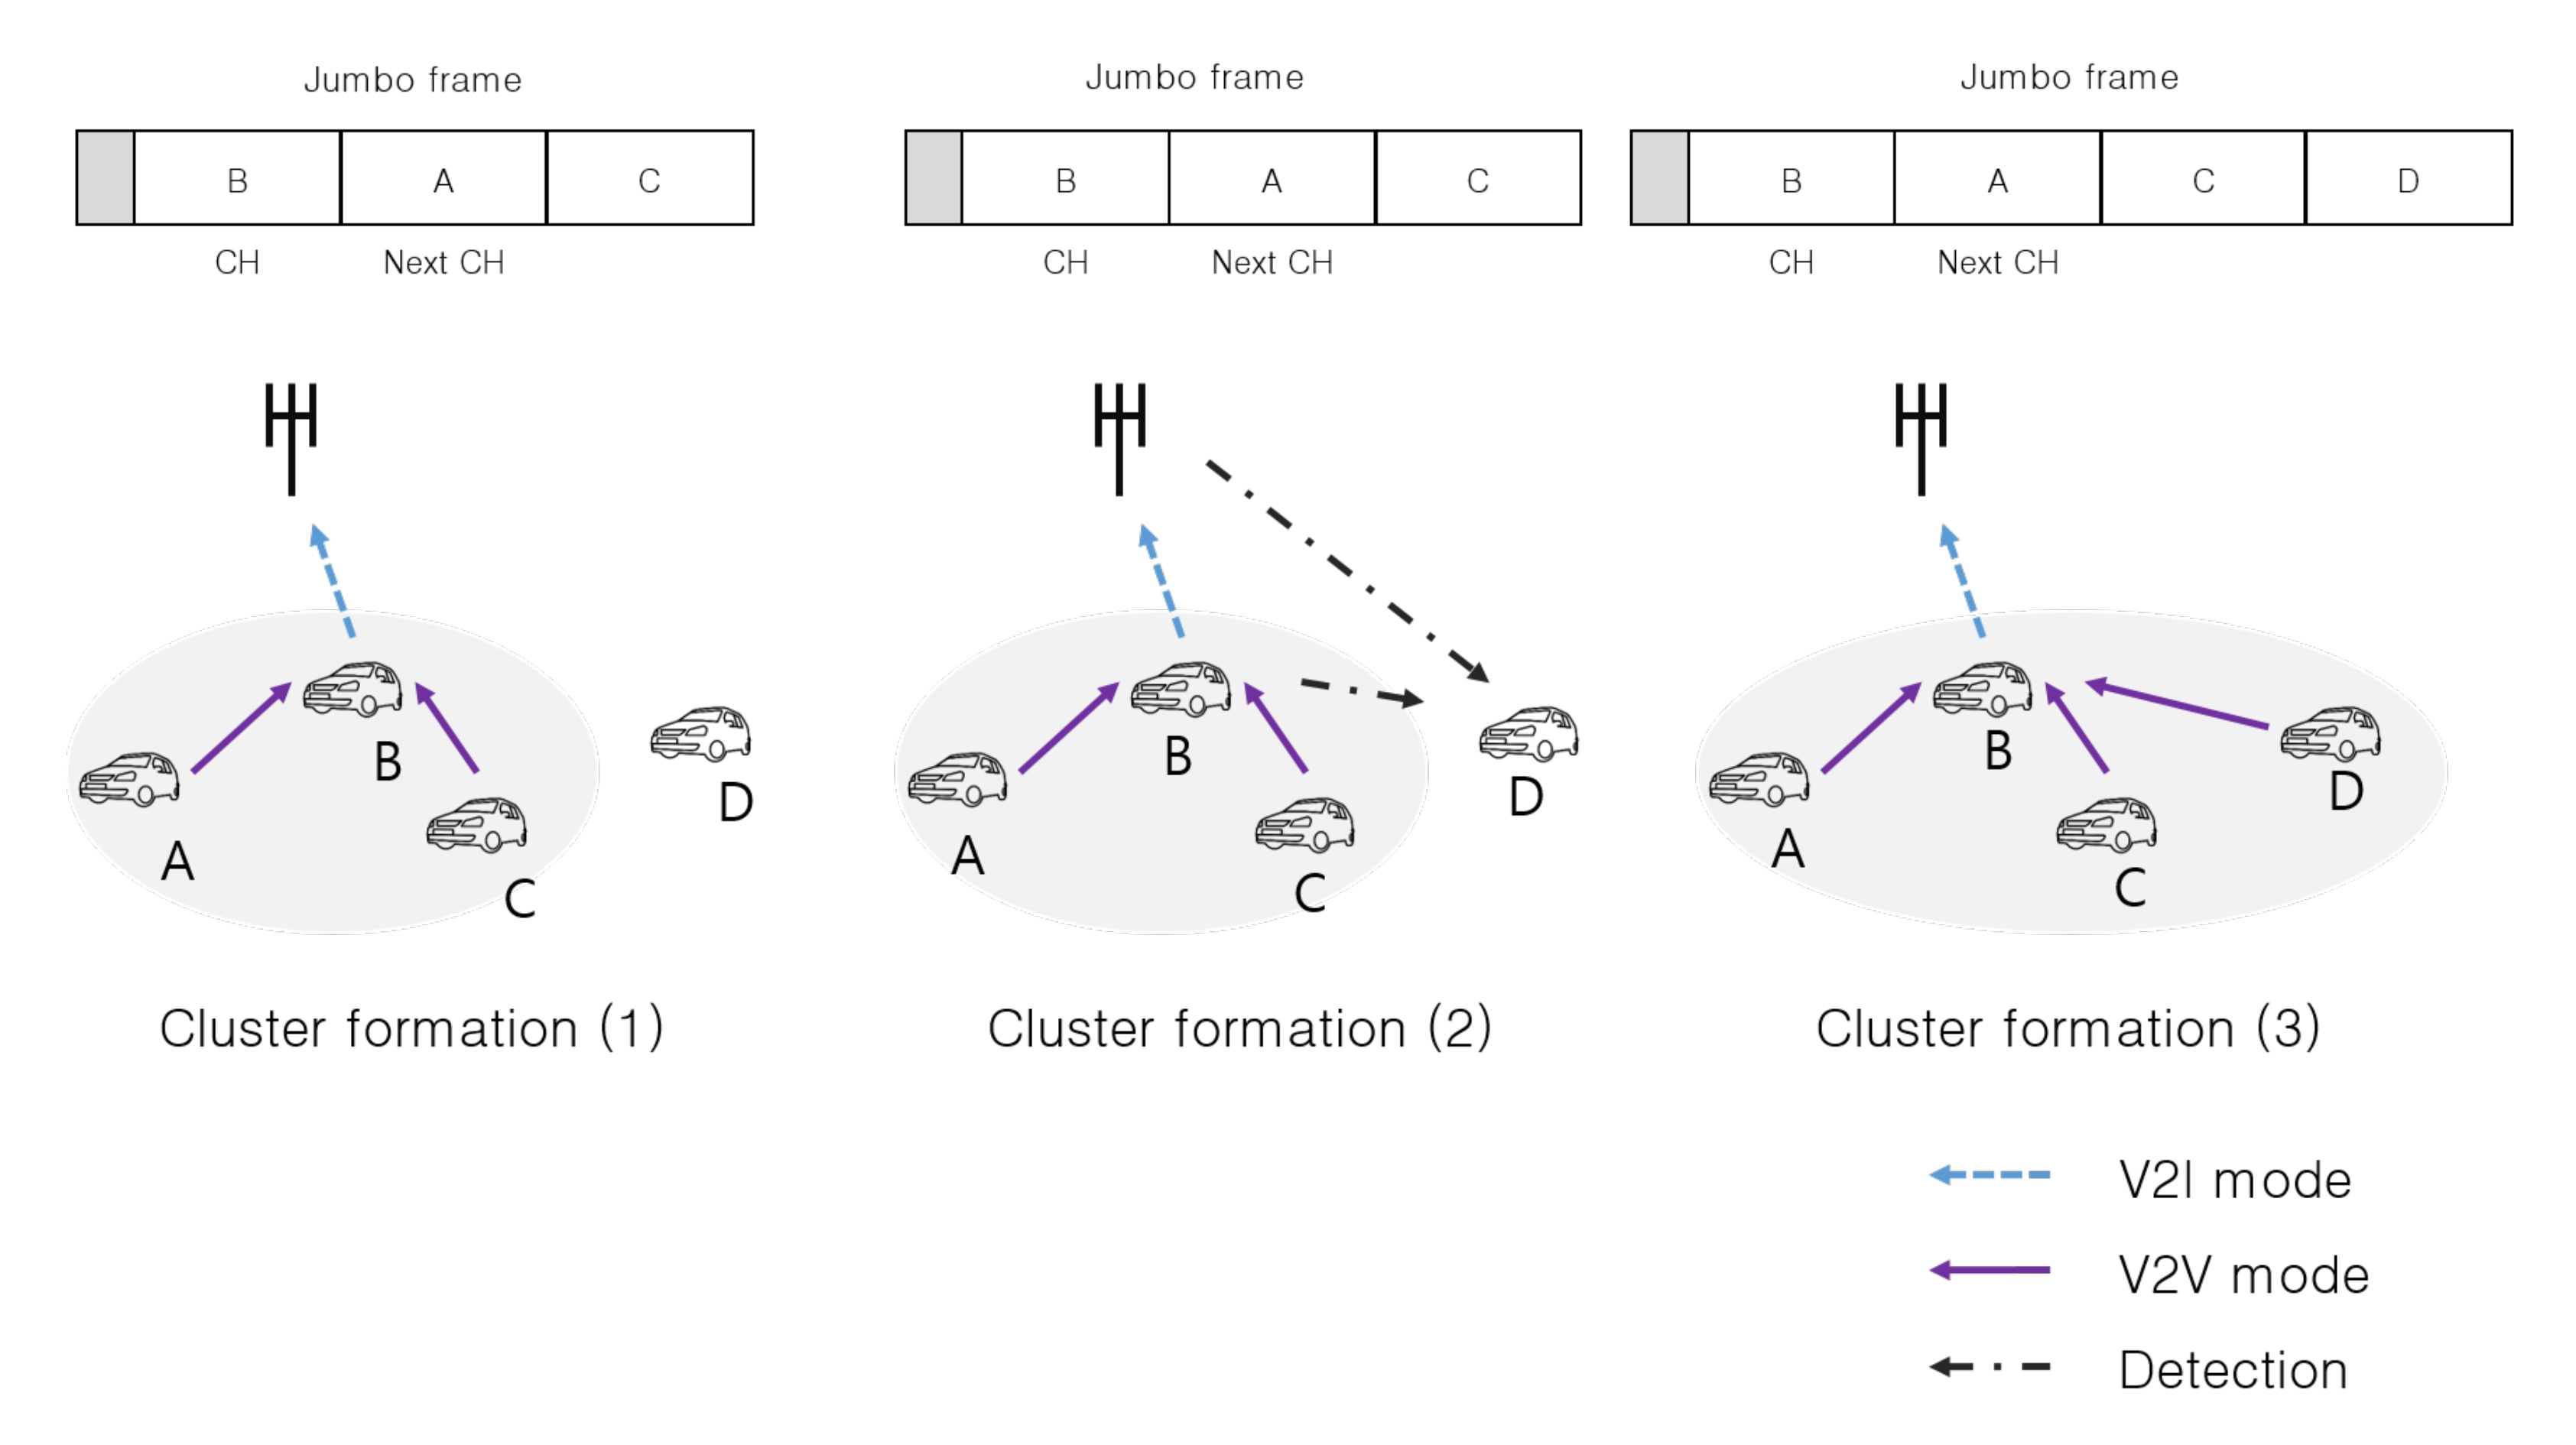
In this paper, we present a DRL based resource allocation algorithm with RRH grouping and vehicle clustering for cellular V2X communication while guaranteeing QoS and reliability requirements. Our goal is to maximize system energy efficiency. The proposed algorithm consists of three parts: One for RRH grouping, for vehicle clustering, and a DRL based resource allocation method. The RRH grouping method is a clustering technique that groups neighboring RRHs to reduce the communication overhead and maintenance cost of DRL. The vehicle clustering method clusters vehicles to reduce the signaling overhead of periodic messages. Each vehicle cluster constructs a jumbo frame from the periodic messages of cluster members and requests resource allocation. To allocate communication resources, the DRL based resource allocation is adjusted. Agents are deployed to each RRH, to learn to maximize the sum capacity of the system so that the RRH grouping and vehicle clustering method can minimize system energy consumption, and the DRL based resource allocation method can maximize the sum capacity of the system.
3. System Model and Problem Formulation
We consider concurrent V2I and V2V, based on Mode 3 specified in 3GPP cellular V2X framework, which consists of multiple RRH and multiple vehicle equipment (VE). The RRHs are deployed at the center of intersections and connected to BBU pool through fronthaul link; the VEs are distributed across the network and move on the roads. The RRHs. In Mode 3, the RRHs allocate communication resources to V2I mode VEs, for the subsequent reuse by V2V mode VEs. A V2I mode VE can interfere with V2V mode VE while multiple V2V mode VEs share the same resources. The total VE set can be expressed as
, and consists of a V2I VE set
and a V2V VE set
. We denote the set of RRHs as
within the total available bandwidth
. The total bandwidth
is divided into
resource block (RB)s, allocated to each V2I VE. The used symbols are summarized in
Table 1.
In V2V communication, it is imperative to ensure stringent latency and reliability requirements when safety-critical messages are being transmitted. However, it is difficult to formulate the latency and reliability requirements as constraints of the optimization problem. Therefore, according to Little’s law, the latency requirement is converted into data queue length, and the reliability requirement is converted into outage probability [
18]. The outage probability is defined as the probability that the signal to interference plus noise ratio (SINR) of the VEs is lower than the predefined SINR threshold [
19]. Increasing the outage probability results in packet loss, and reveals re-transmission occurrence leading to reduced reliability. When reusing cellular resources, there is mutual interference between V2I and V2V communication. Thus, the SINR is derived to consider the interference between V2I and V2V communication. The SINR of
cth V2I VE at the
kth RB is
where
is the transmission power of RRH;
is the channel gain between the V2I VE
c and the associated RRH
s on
kth RB.
N is the noise power spectral density and
is the transmission power of V2V VE
v at the
kth RB. The SINR of V2V VE
v at the
kth RB is
where
is the transmission power of V2V VE
v at the
kth RB. The total system capacity is
where
is the system bandwidth. Only the power consumption of the RRHs and the associated fronthauls were considered. The macro BS is only involved in voice services; hence, its energy consumption is disregarded. The power consumption model of RRH is
where
is the circuit power of the RRH,
is the slope of load-dependent power consumption of RRH, as reported in [
20], and
is the association indicator for V2I VE
c, with values of 1 for association and 0 for nonassociation. The power consumption model of the fronthaul links is
where
is the circuit power from the fronthaul transceiver and switch,
is the power consumption per bit/s and
is the traffic associated with RRH
s. The power consumption model of the total system is
The system energy efficiency can be defined as
Our main goal is to maximize the energy efficiency of the system, which can be defined as
where
is the SINR of VE;
is the SINR threshold;
is the maximum transmission power of VE;
is the outage probability of the system; and
is the maximum outage probability constraint;
is the allocation indicator with values of 1 for allocation to V2I VE
c at
kth RB and 0 for non-allocation. Of these constraints, C1 ensures that VEs satisfy the SINR constraint; C2 ensures that the outage probability in the system does not exceed the threshold outage probability constraint; C3 ensures that the transmission power of V2V transmitters does not exceed the maximum power level because of the critical interference problem; C4 denotes that each V2I VE can be allocated to an RB. It means that each V2I VE can be allocated to only one RB, and other V2I VE cannot share the allocated the RB.
5. Simulation Results and Discussions
In this section, the performance of the proposed algorithm was compared with that of other existing algorithms. Simulations were carried out using Tensorflow 2.0 and the Simulation of Urban Mobility (SUMO) simulator [
23]. In the simulations, the multi-cell H-CRAN environment was considered; the parameters are summarized in
Table 2. The parameters and system requirements are set in accordance with the 3rd Generation Partnership Project (3GPP) specifications release 15 and 16 [
20,
24]. In addition, Rayleigh fading, log-normal shadowing, and the path-loss model(
) were considered [
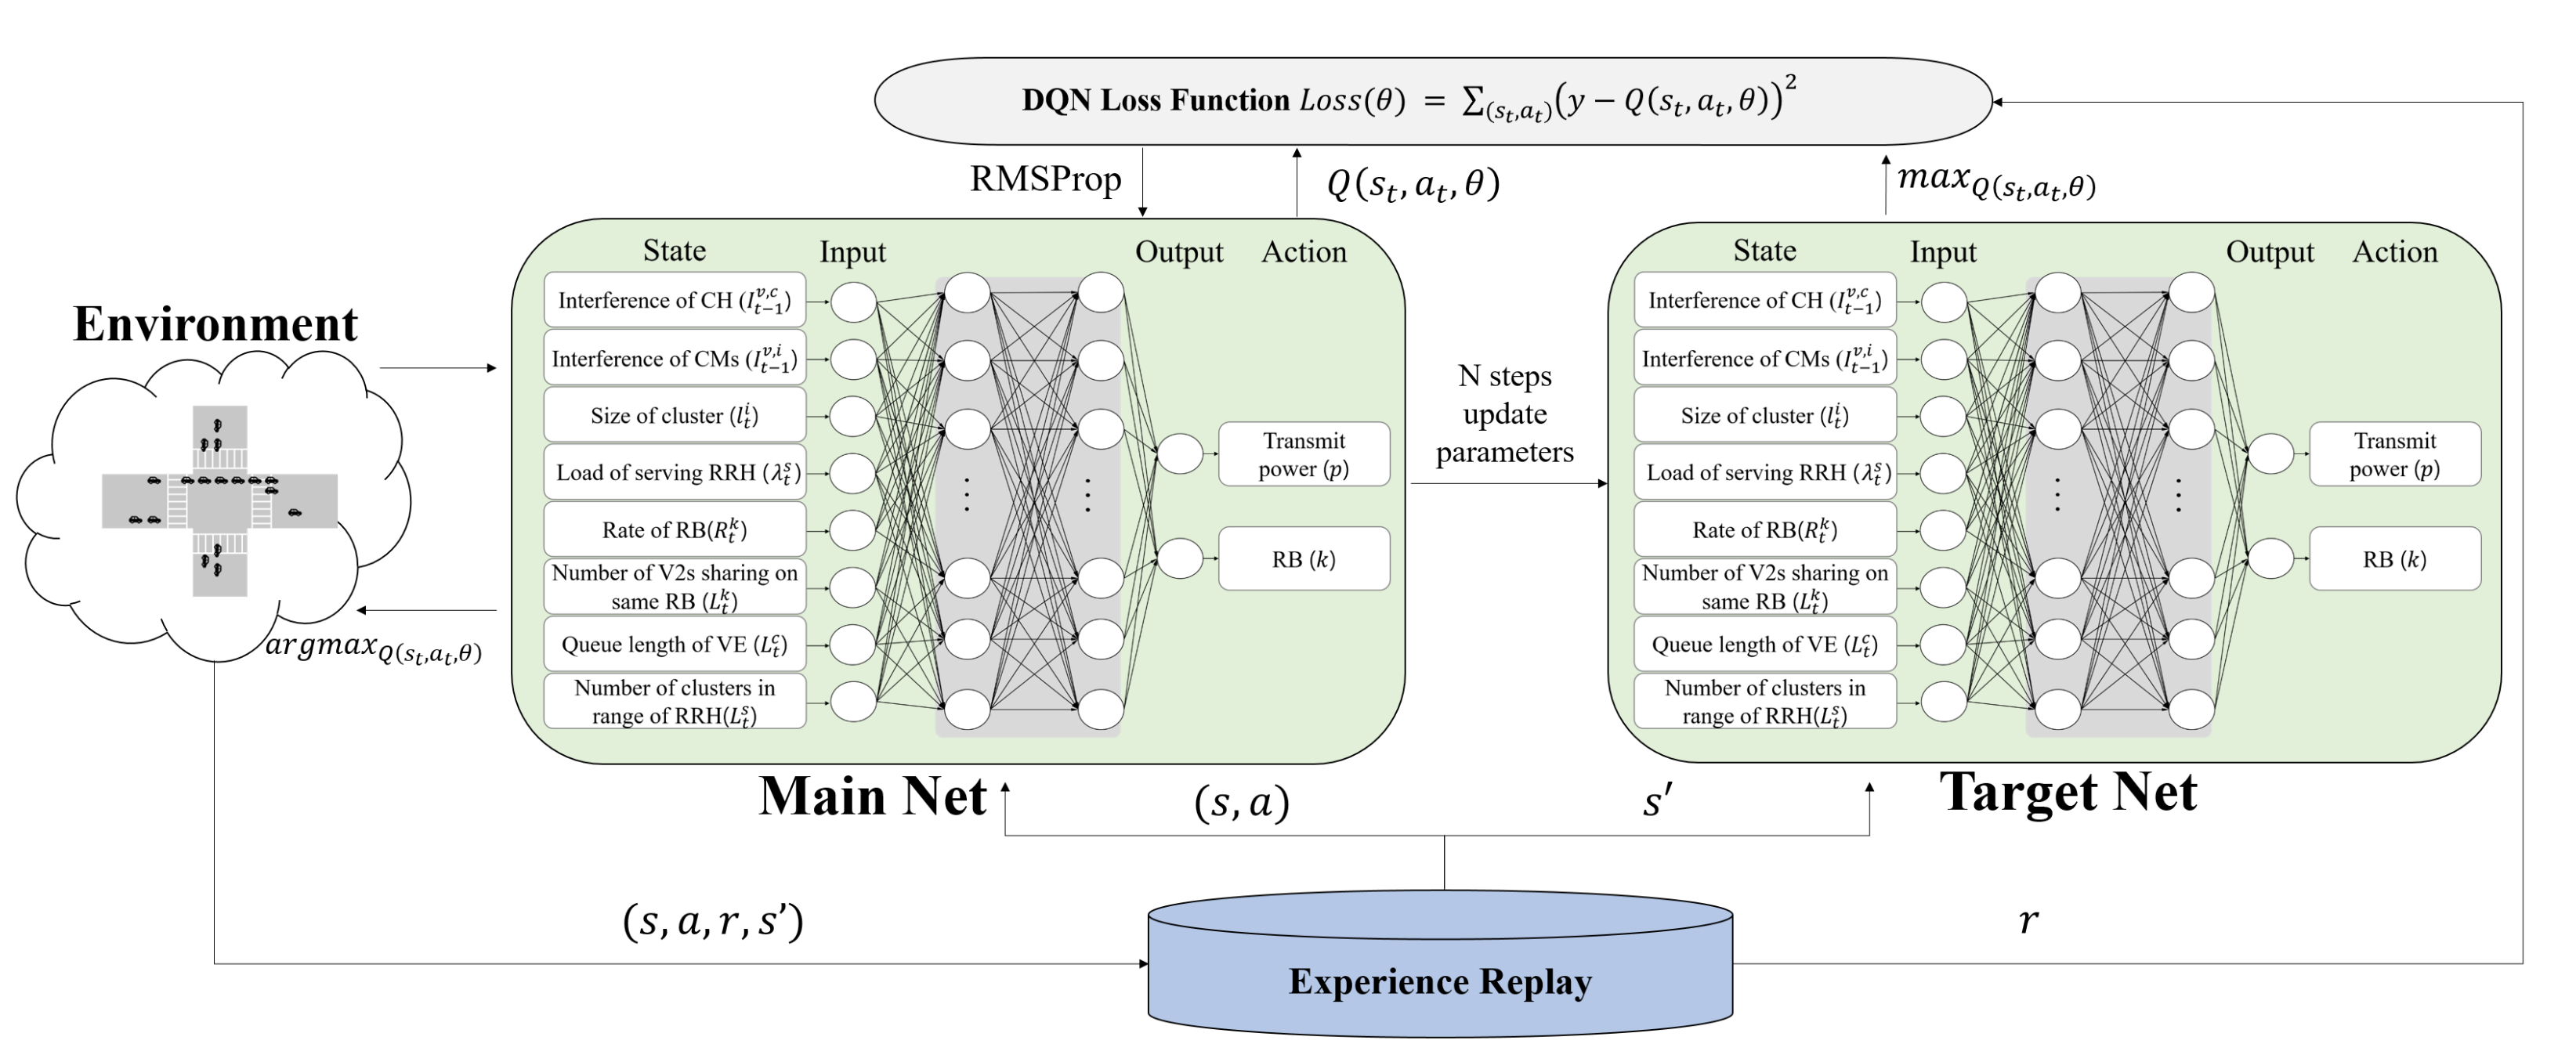
25]. The DQN adopted for the simulation was a fully connected neural network consisting of an input layer, a hidden layer, and an output layer. The number of neurons in the hidden layer was 256 and ReLu was utilized for the activation function. The DQN parameters had learning rate
, discount factor
. The replay memory size is 3000, network update frequency is 2, and target network update frequency is 30. Each network update occurs every unit episodes.The latency and reliability requirements were 10 ms and an outage threshold of 3 dB, respectively.
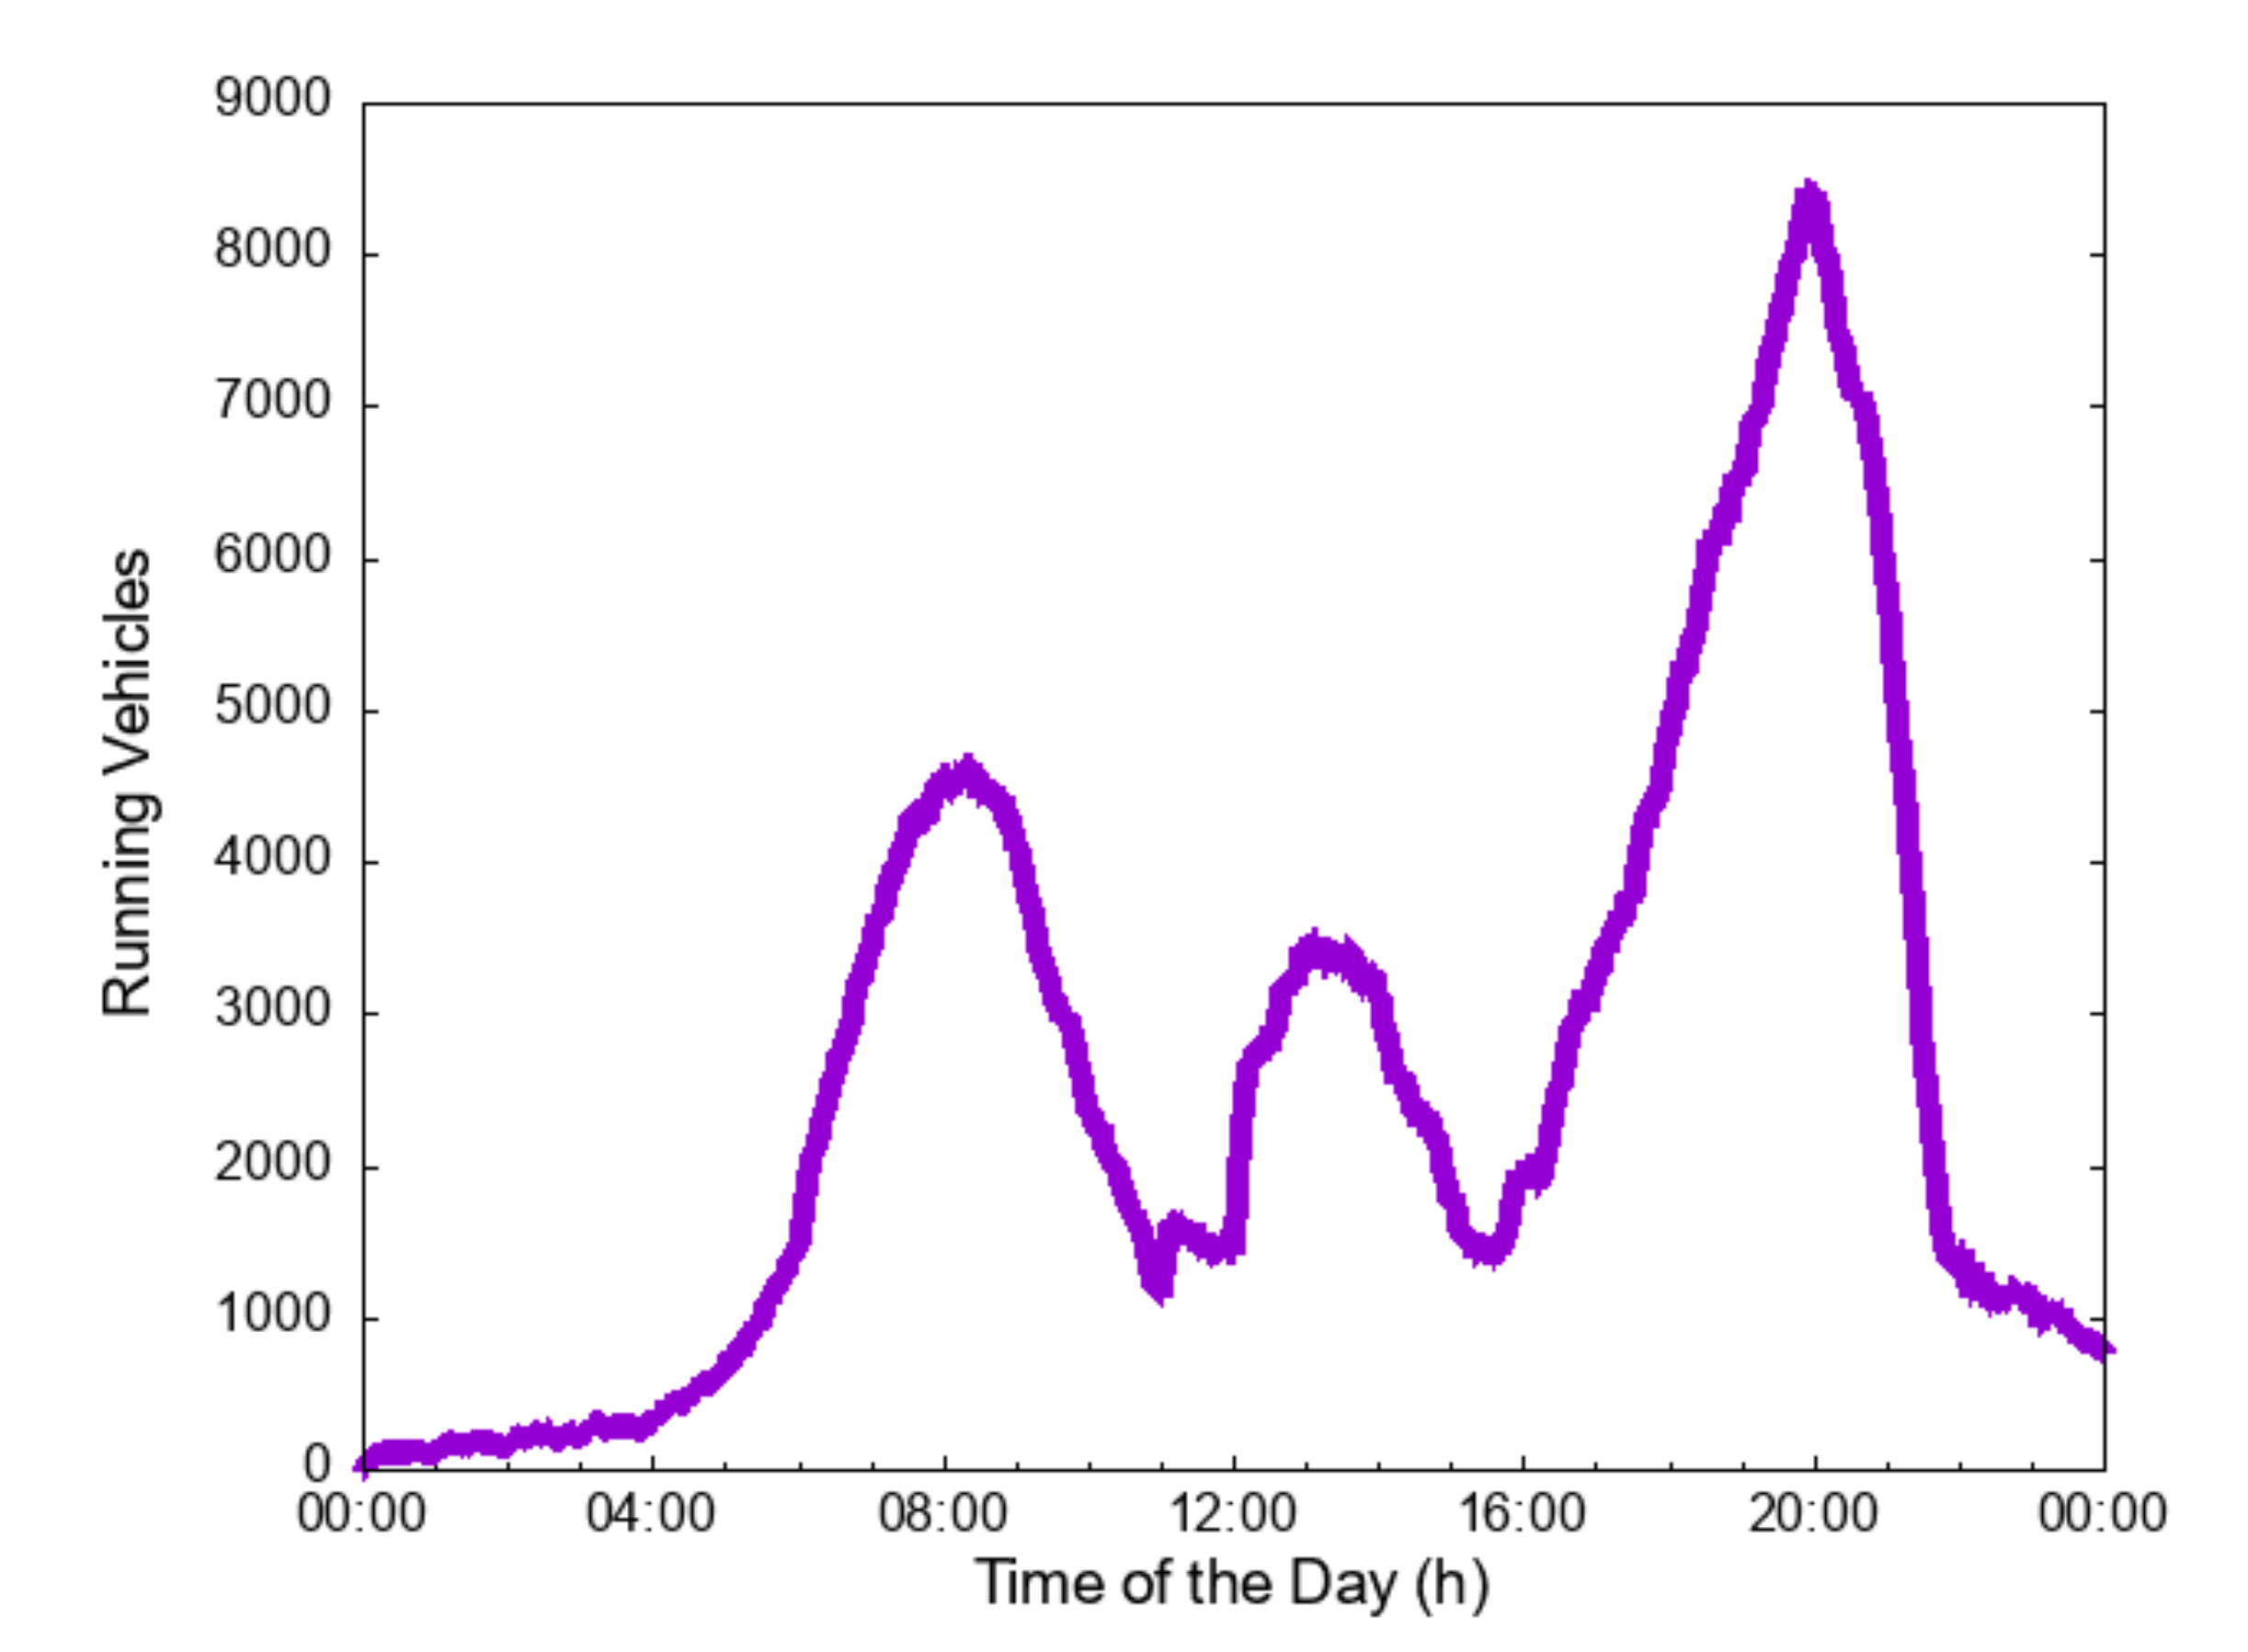
In the multi-cell environment, 43 RRHs were deployed at the center of intersections, and the vehicles were distributed and moved on the roads. The Luxembourg SUMO traffic Scenario [
26] dataset was used for the mobility and intersection simulations to create a scenario that would meet common requirements and contain realistic traffic demand and mobility patterns. With this dataset, we composed two types of scenarios: Low traffic and high traffic. As the
Figure 3, the high traffic scenario shows mobility during rush hour peaks around 20:00 with high traffic demands for one day. In the low traffic scenario, the required traffic demand is about half that of the high traffic scenario.
To evaluate the performance of the proposed algorithm, we used four metrics: Average SINR, average achievable data rate, system energy efficiency, and outage probability. The SINR is the important factor to show interference condition of vehicles, so the average SINR of total vehicles is used to show the increase or decrease in interference due to resource allocation. The average achievable data rate means system capacity that can be achieved in a given bandwidth, and it used to show efficiency of resource allocation method. The system energy efficiency means the achievable data rate per energy consumption, it is the main objective of our proposed algorithm. So the system energy efficiency is used to evaluate main performance of proposed algorithm. The outage probability is also used to show ensuring QoS constraint. We also simulated with four metrics as a function of the variation in V2V communication distance and maximum cluster size. Because V2V communication distance is a parameter related to cluster size and QoS of the vehicle, we compared the performance as a function of the change in V2V communication distance.
In the evaluation of the performance of the proposed algorithm, the other three algorithms used were as follows: A baseline algorithm, clustering with DQN based mode selection and resource allocation algorithm, and DQN based resource allocation algorithm. First, we used the SINR-based algorithm in which VEs communicate with only the V2I mode. In this algorithm, VEs associated with RRHs that served the highest SINR. It was denoted as “Method with SINR-based V2I communication (
BA)”. Second, for vehicle clustering comparison, the DQN based mode selection and resource allocation algorithm in [
17] was used to learn to maximize the system achievable data rate with vehicle clustering, mode selection and resource allocation method. We denote this as “Method with clustering and DQN (
Compare1)”. Unlike the proposed algorithm, the communication mode and resource allocation of the vehicle were determined in consideration of the channel state of the individual vehicle in
Compare1. Therefore, this algorithm was used to compare performances with the proposed algorithm which is considering the sharing state of resources in use with the vehicle cluster. Third, for a comparison with the DQN based resource allocation algorithm, the algorithm in [
16] was used to learn to maximize the system achievable data rate with the resource allocation method. We denote this as “Method with DQN (
Compare2)”. Unlike the proposed algorithm,
Compare2 only considered channels and resource states that can be checked at RRHs. Therefore, this algorithm was used to compare performance with the proposed algorithm that considered local information of vehicles.
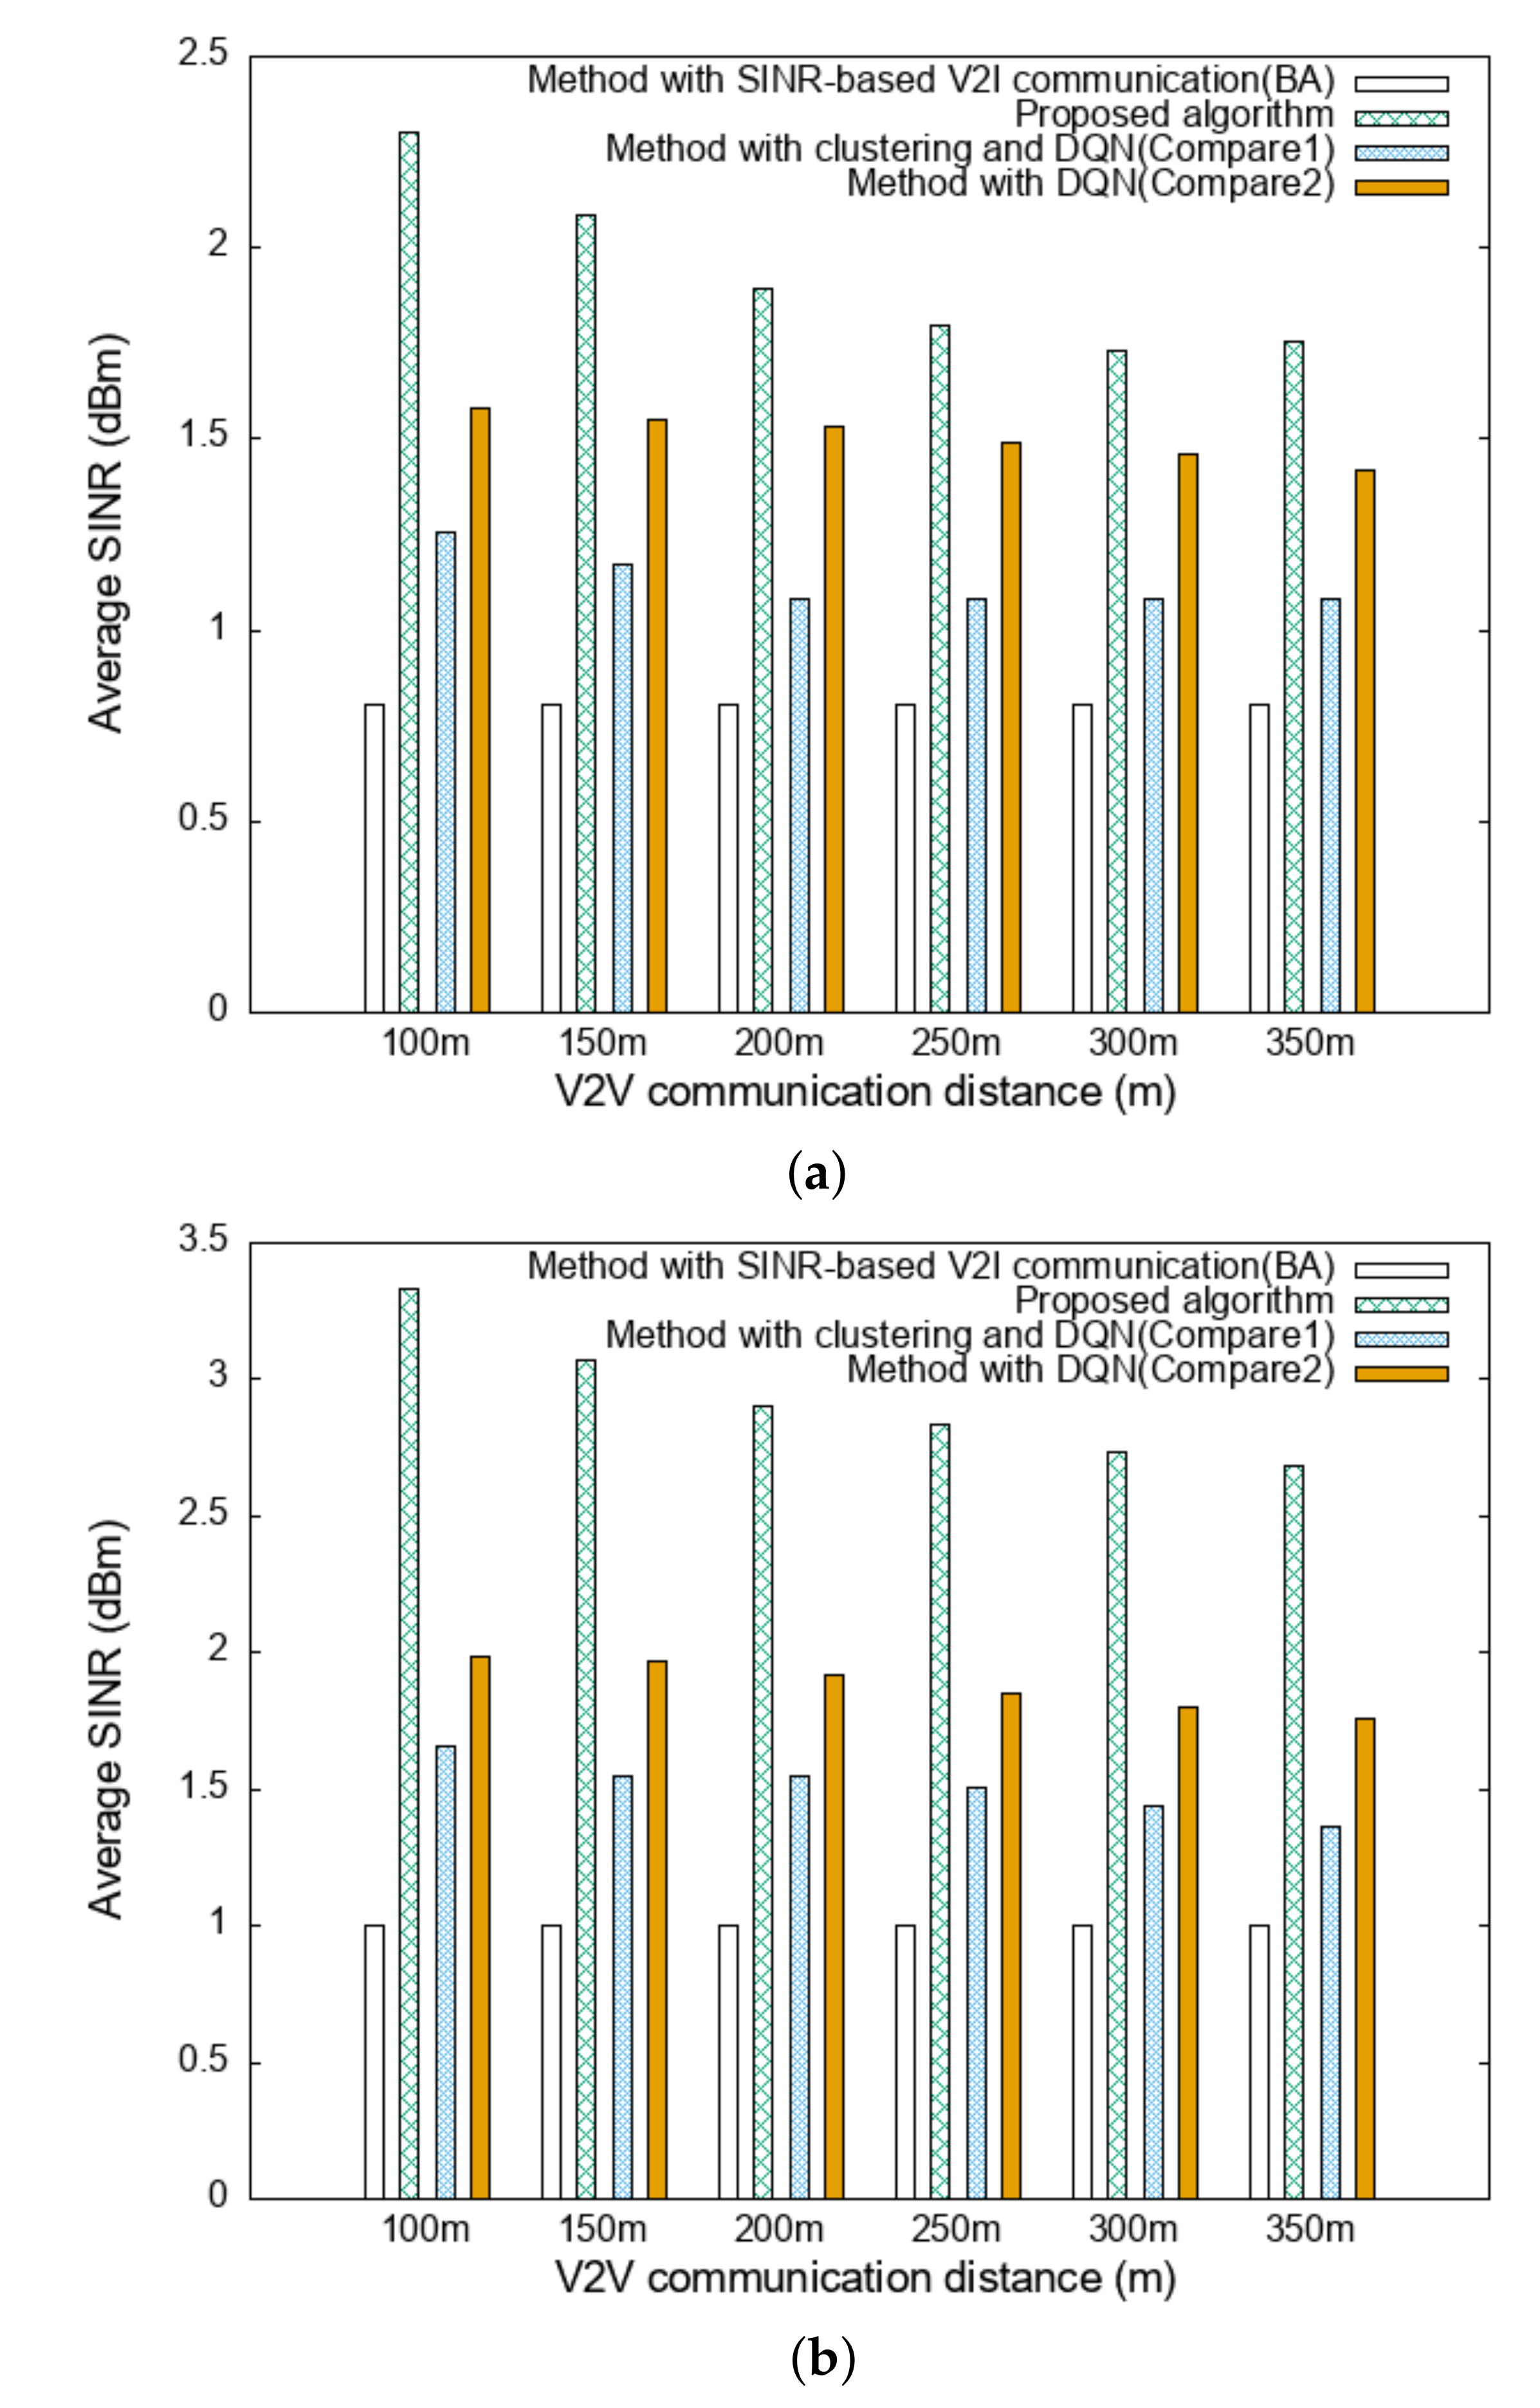
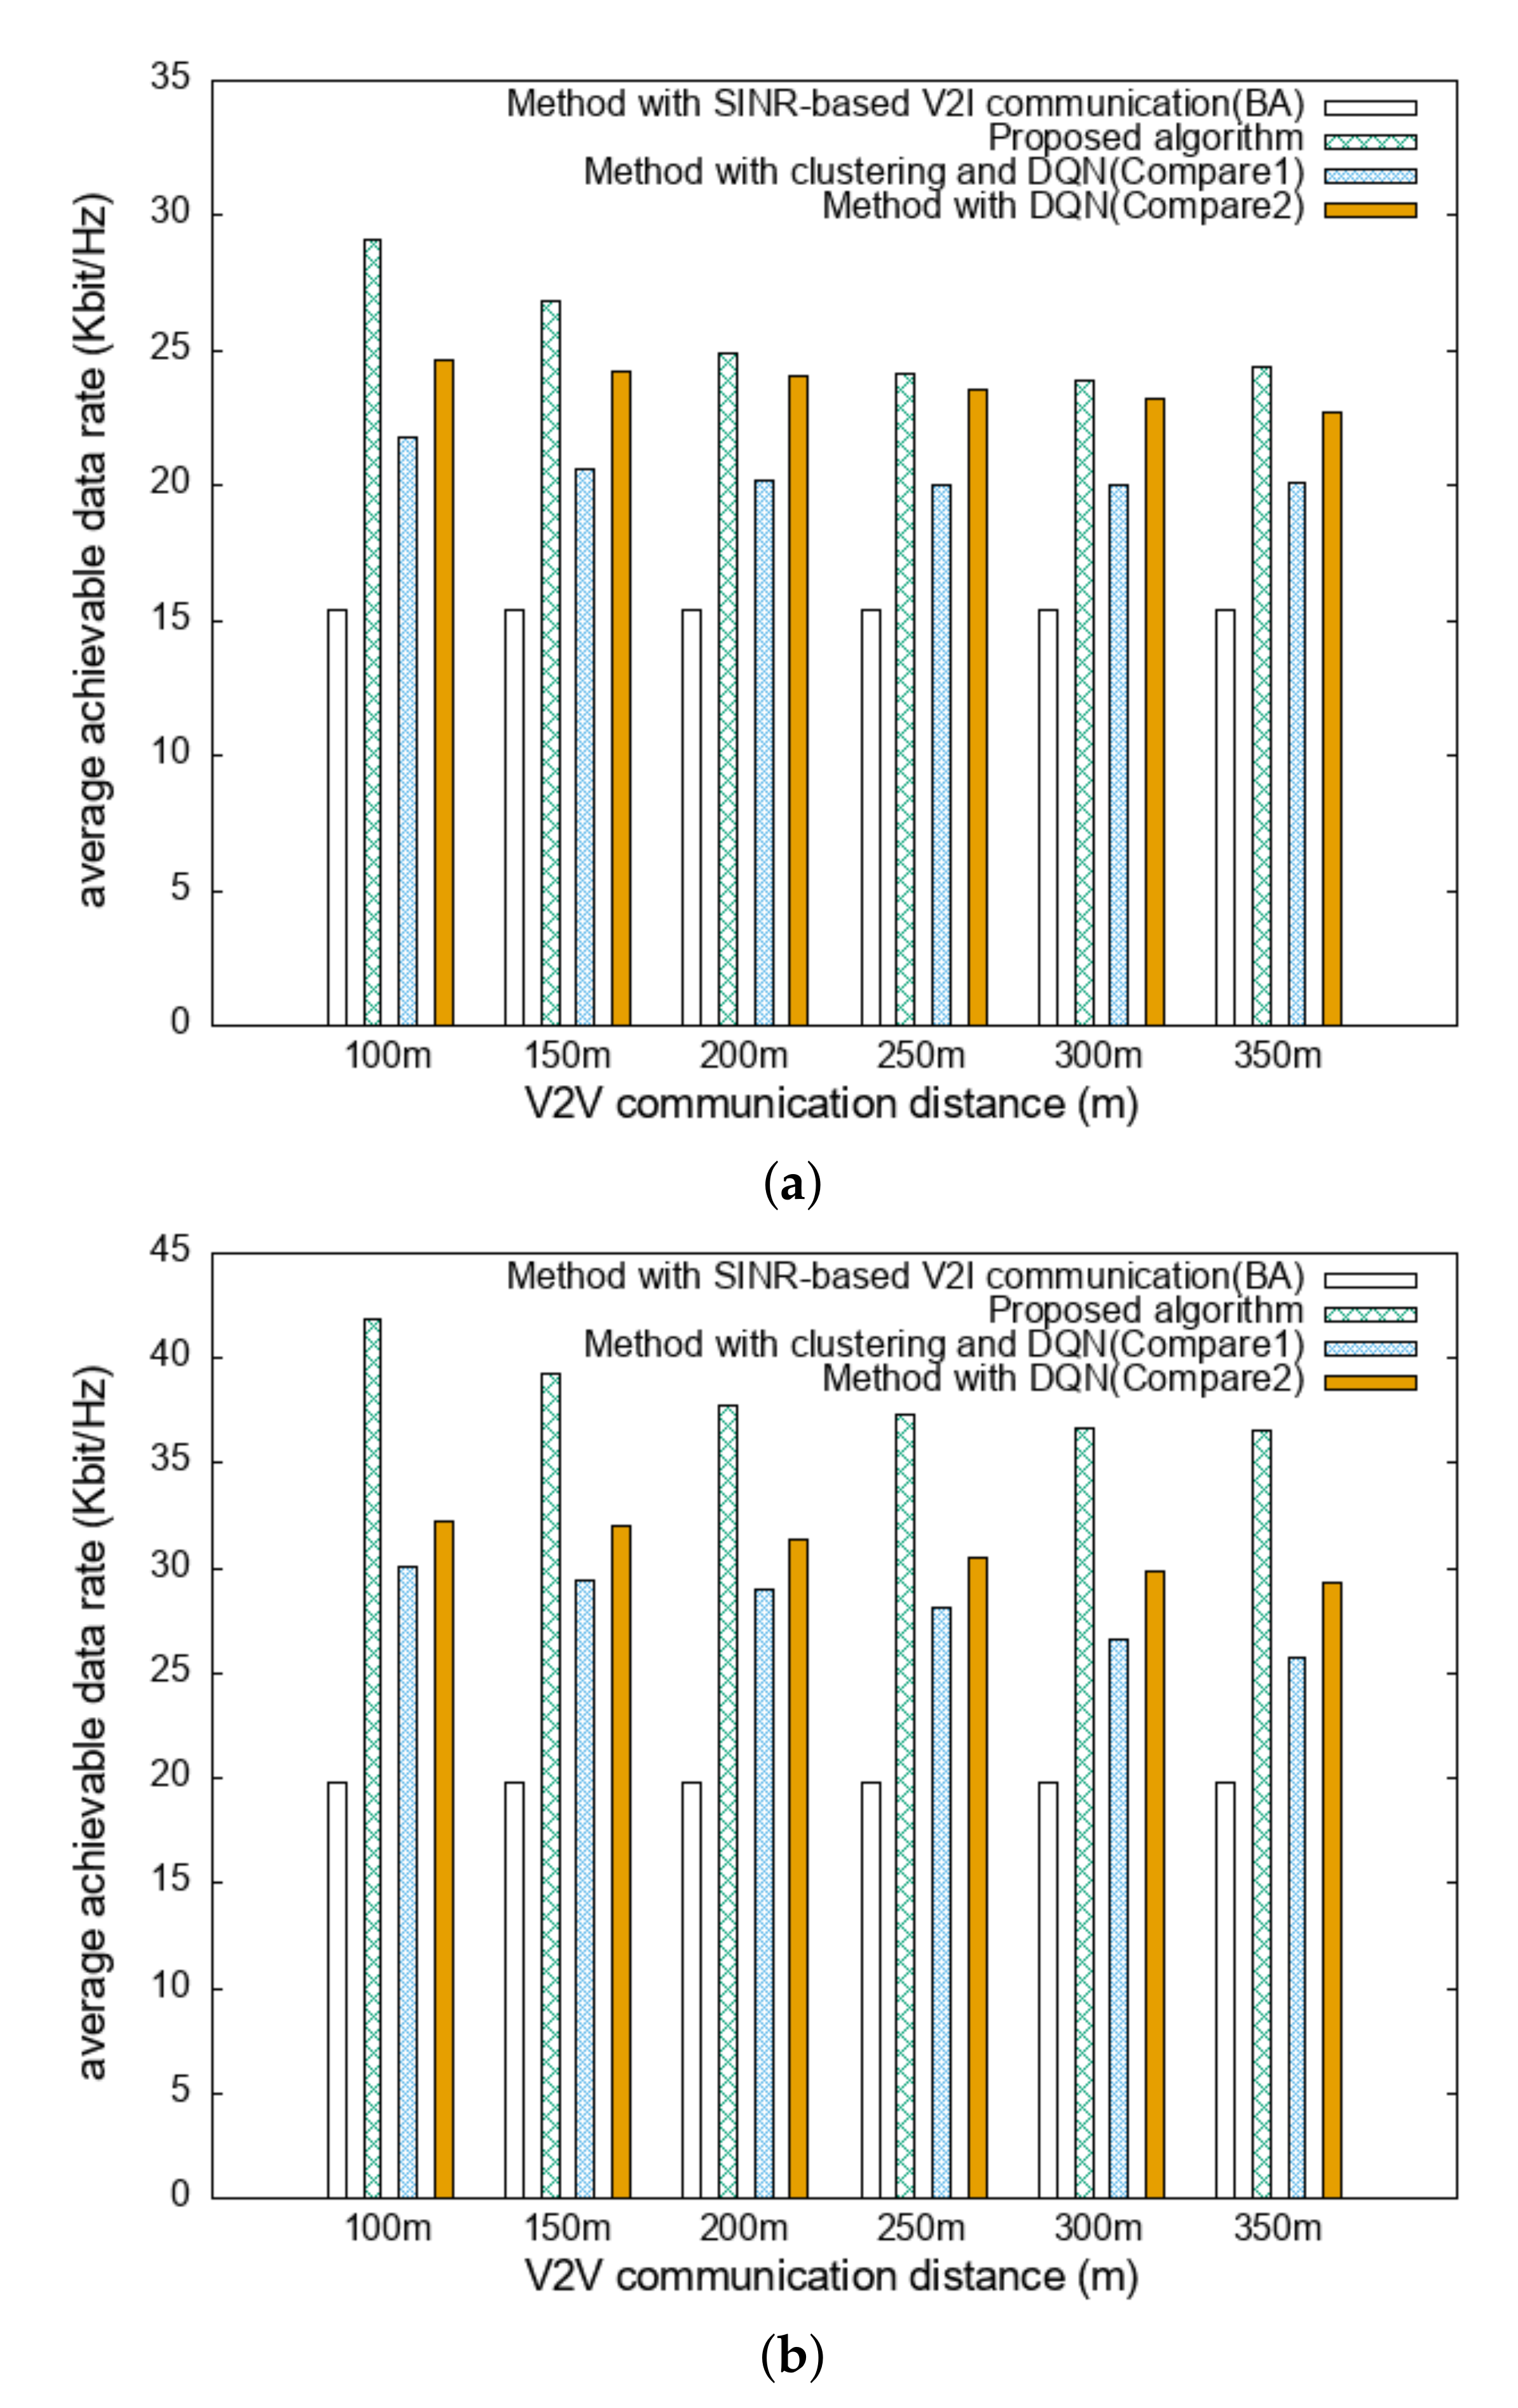
The average SINR and average achievable data rate for two traffic load scenarios are compared as a function of the V2V communication distance, as displayed in
Figure 4 and
Figure 5. In
Figure 4 and
Figure 5, as the V2V communication distance increases, the average SINR and achievable data rate decrease because of the increasing distance between V2V VEs. The proposed algorithm performs better than the other algorithms. When compared with
Compare1, the clustering algorithm
Compare1 has a higher ratio of V2I mode VEs and higher interference, resulting in lower average SINR. The achievable data rate also decreases due to increasing interference. This is because the proposed algorithm selects the VE with the highest SINR as CH and enters the cluster with the highest SINR. Compare1 exhibits lower SINR and achievable data rate than
Compare2, which does not employ a clustering method.
Compare2 selects a communication mode in which VEs can receive the best SINR. Because the proposed algorithm allocates resources in units of vehicle clusters, the average SINR and achievable data rate are higher than those of
Compare2 due to low interference. Compared to the low traffic scenarios, the performance of high traffic scenarios is observed to be better. This is because the vehicle density in high traffic scenarios is higher than the density in low traffic scenarios making V2V communication possible with VEs relatively closer to each other.
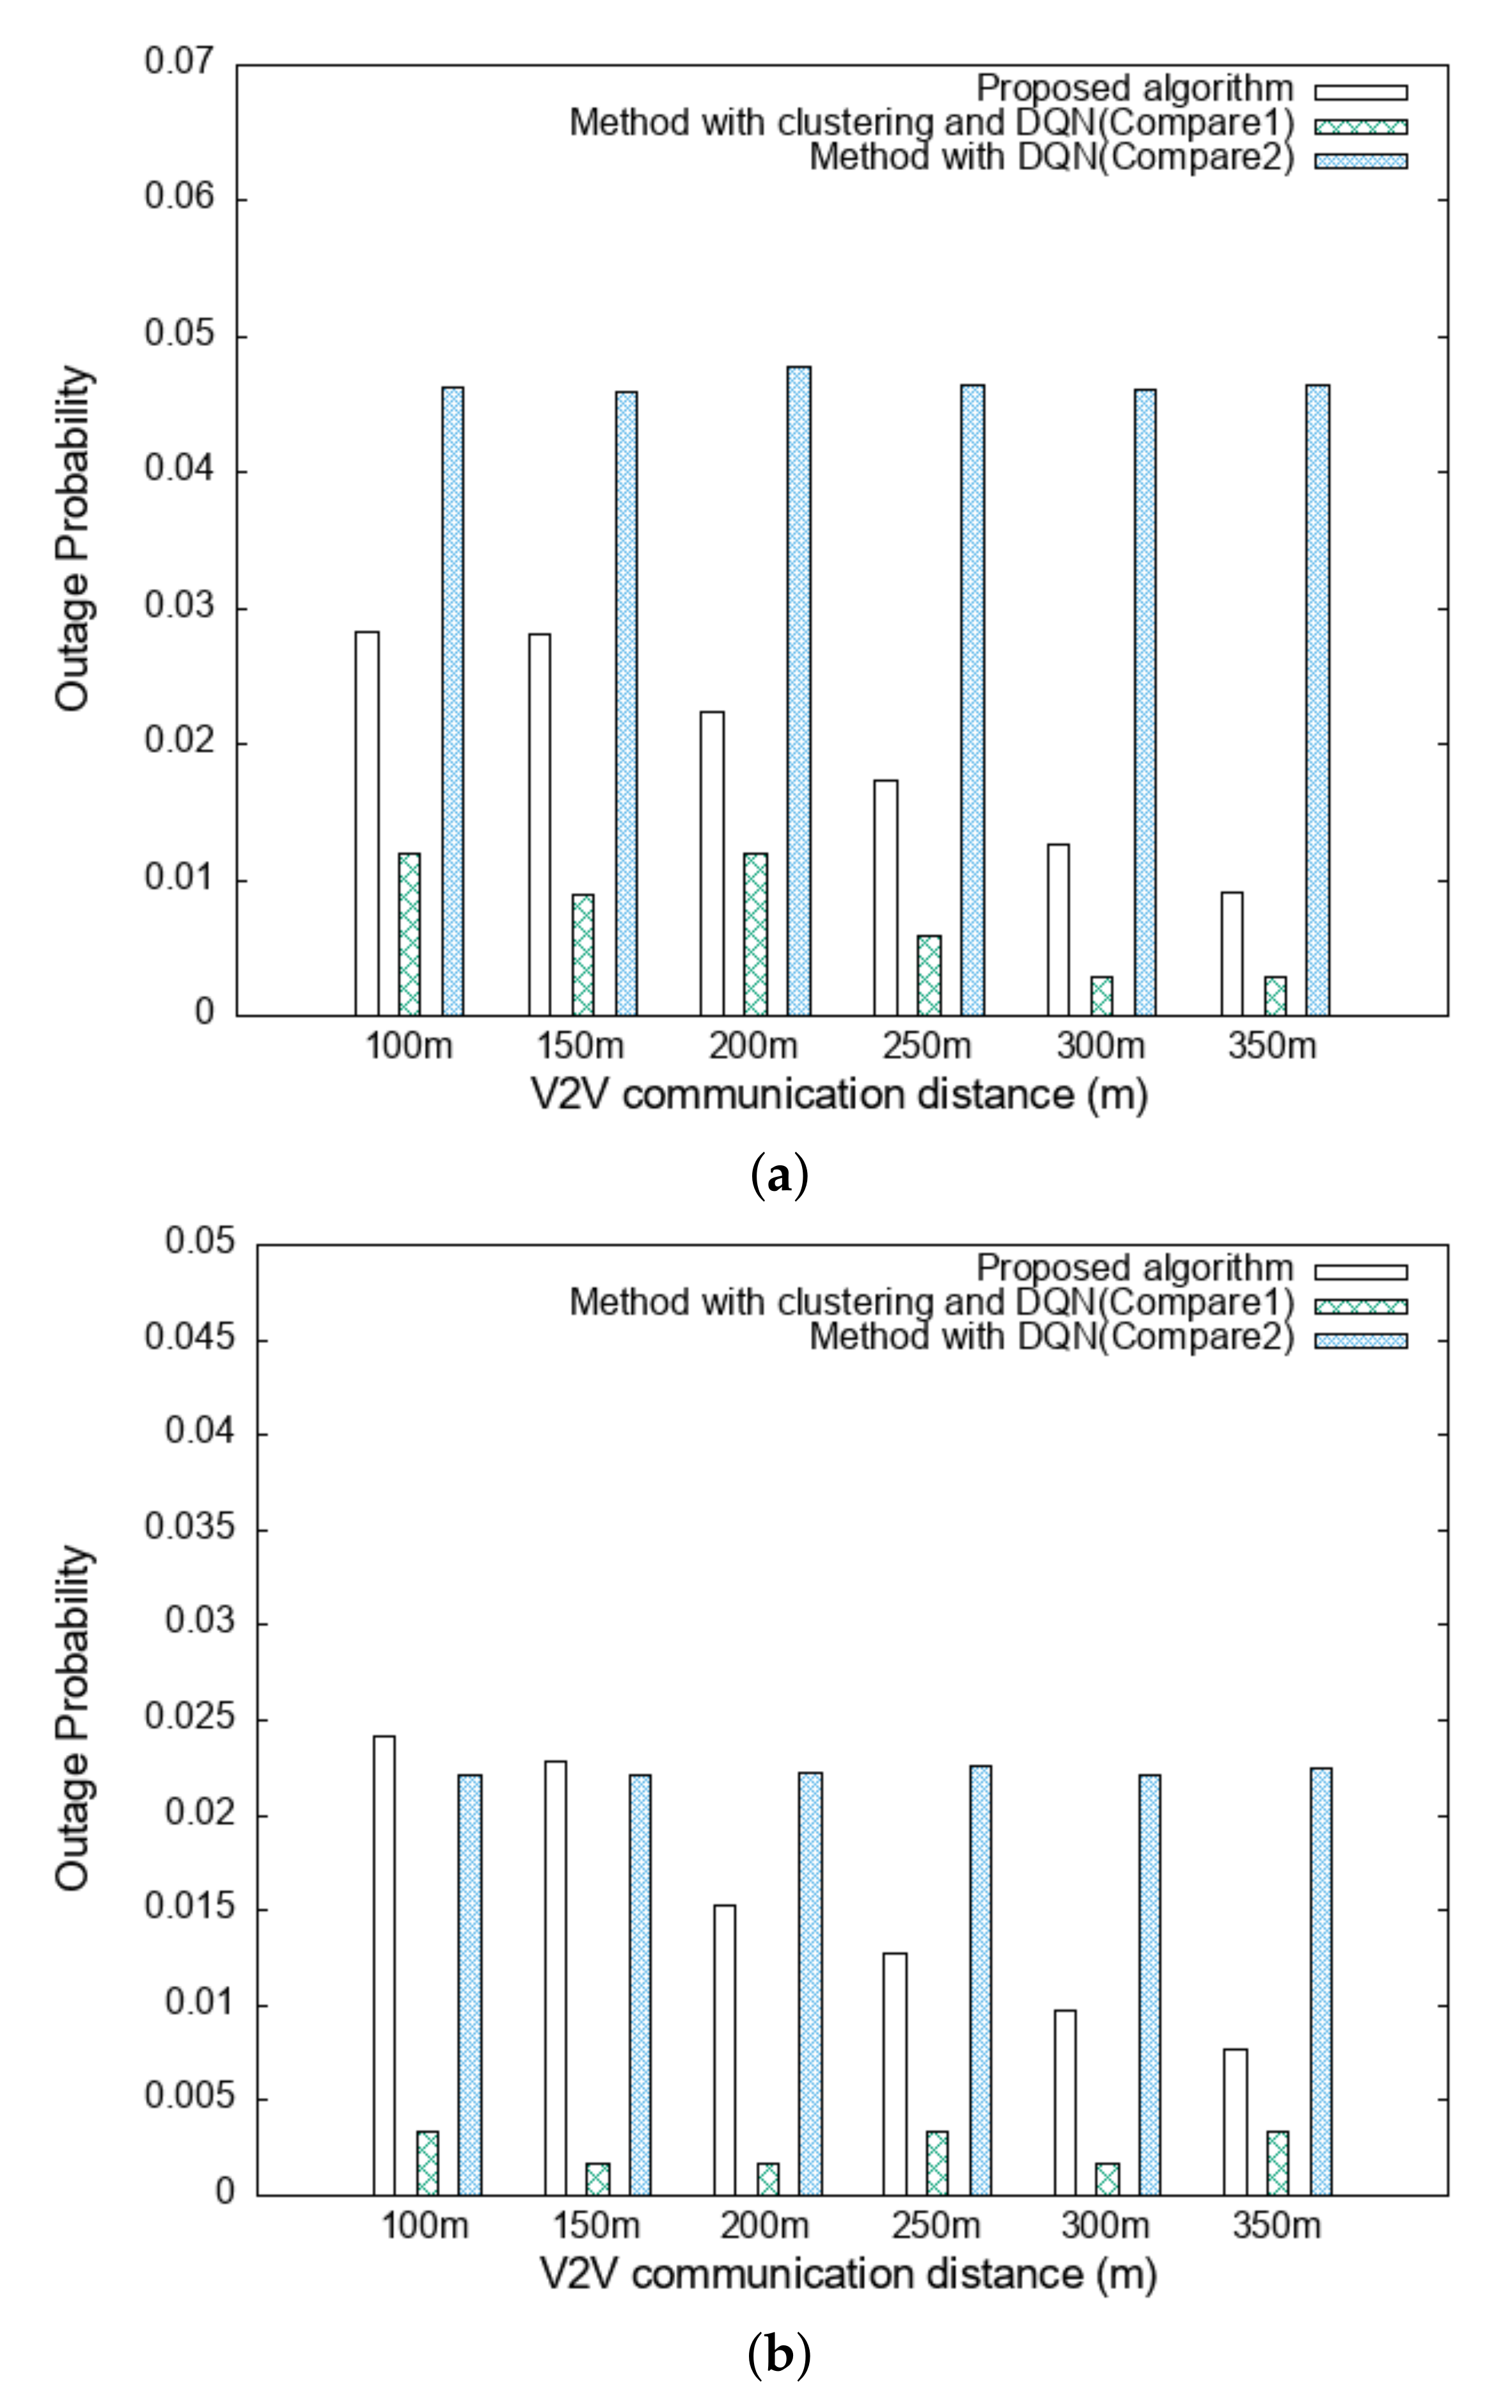
The outage probability for the different traffic scenarios are compared as a function of the V2V communication distance, as shown in
Figure 6. The comparisons included only three algorithms: The proposed algorithm,
Compare1, and
Compare2.
BA was excluded because of its low outage probability as it only communicates with V2I through SINR-based user association. In the case of the proposed algorithm and
Compare1, both methods employed clustering because the V2V communication ratio was high. The outage probability of the proposed method was lower than that of
Compare2 however, due to low interference. When the V2V communication distance is increased, CH is capable of receiving optimal SINR, thus minimizing the interference. In
Figure 6 it is observed that the outage probability is lower for the high scenario case than for the low scenario case. This is because in the high traffic scenario, the vehicles in the environment are more likely to be relatively close to the communication target because of the higher density of VE. The outage probability of the proposed algorithm is higher than that of
Compare1 because there are more V2V mode VEs in the proposed algorithm than in
Compare1, and there are more VEs that have the high variance of SINR. Within 150 m and 200 m, the proposed algorithm has lower outage probability than
Compare2 because the V2V communication rate is reduced as a result of high interference from the short V2V communication distance in high traffic scenarios.
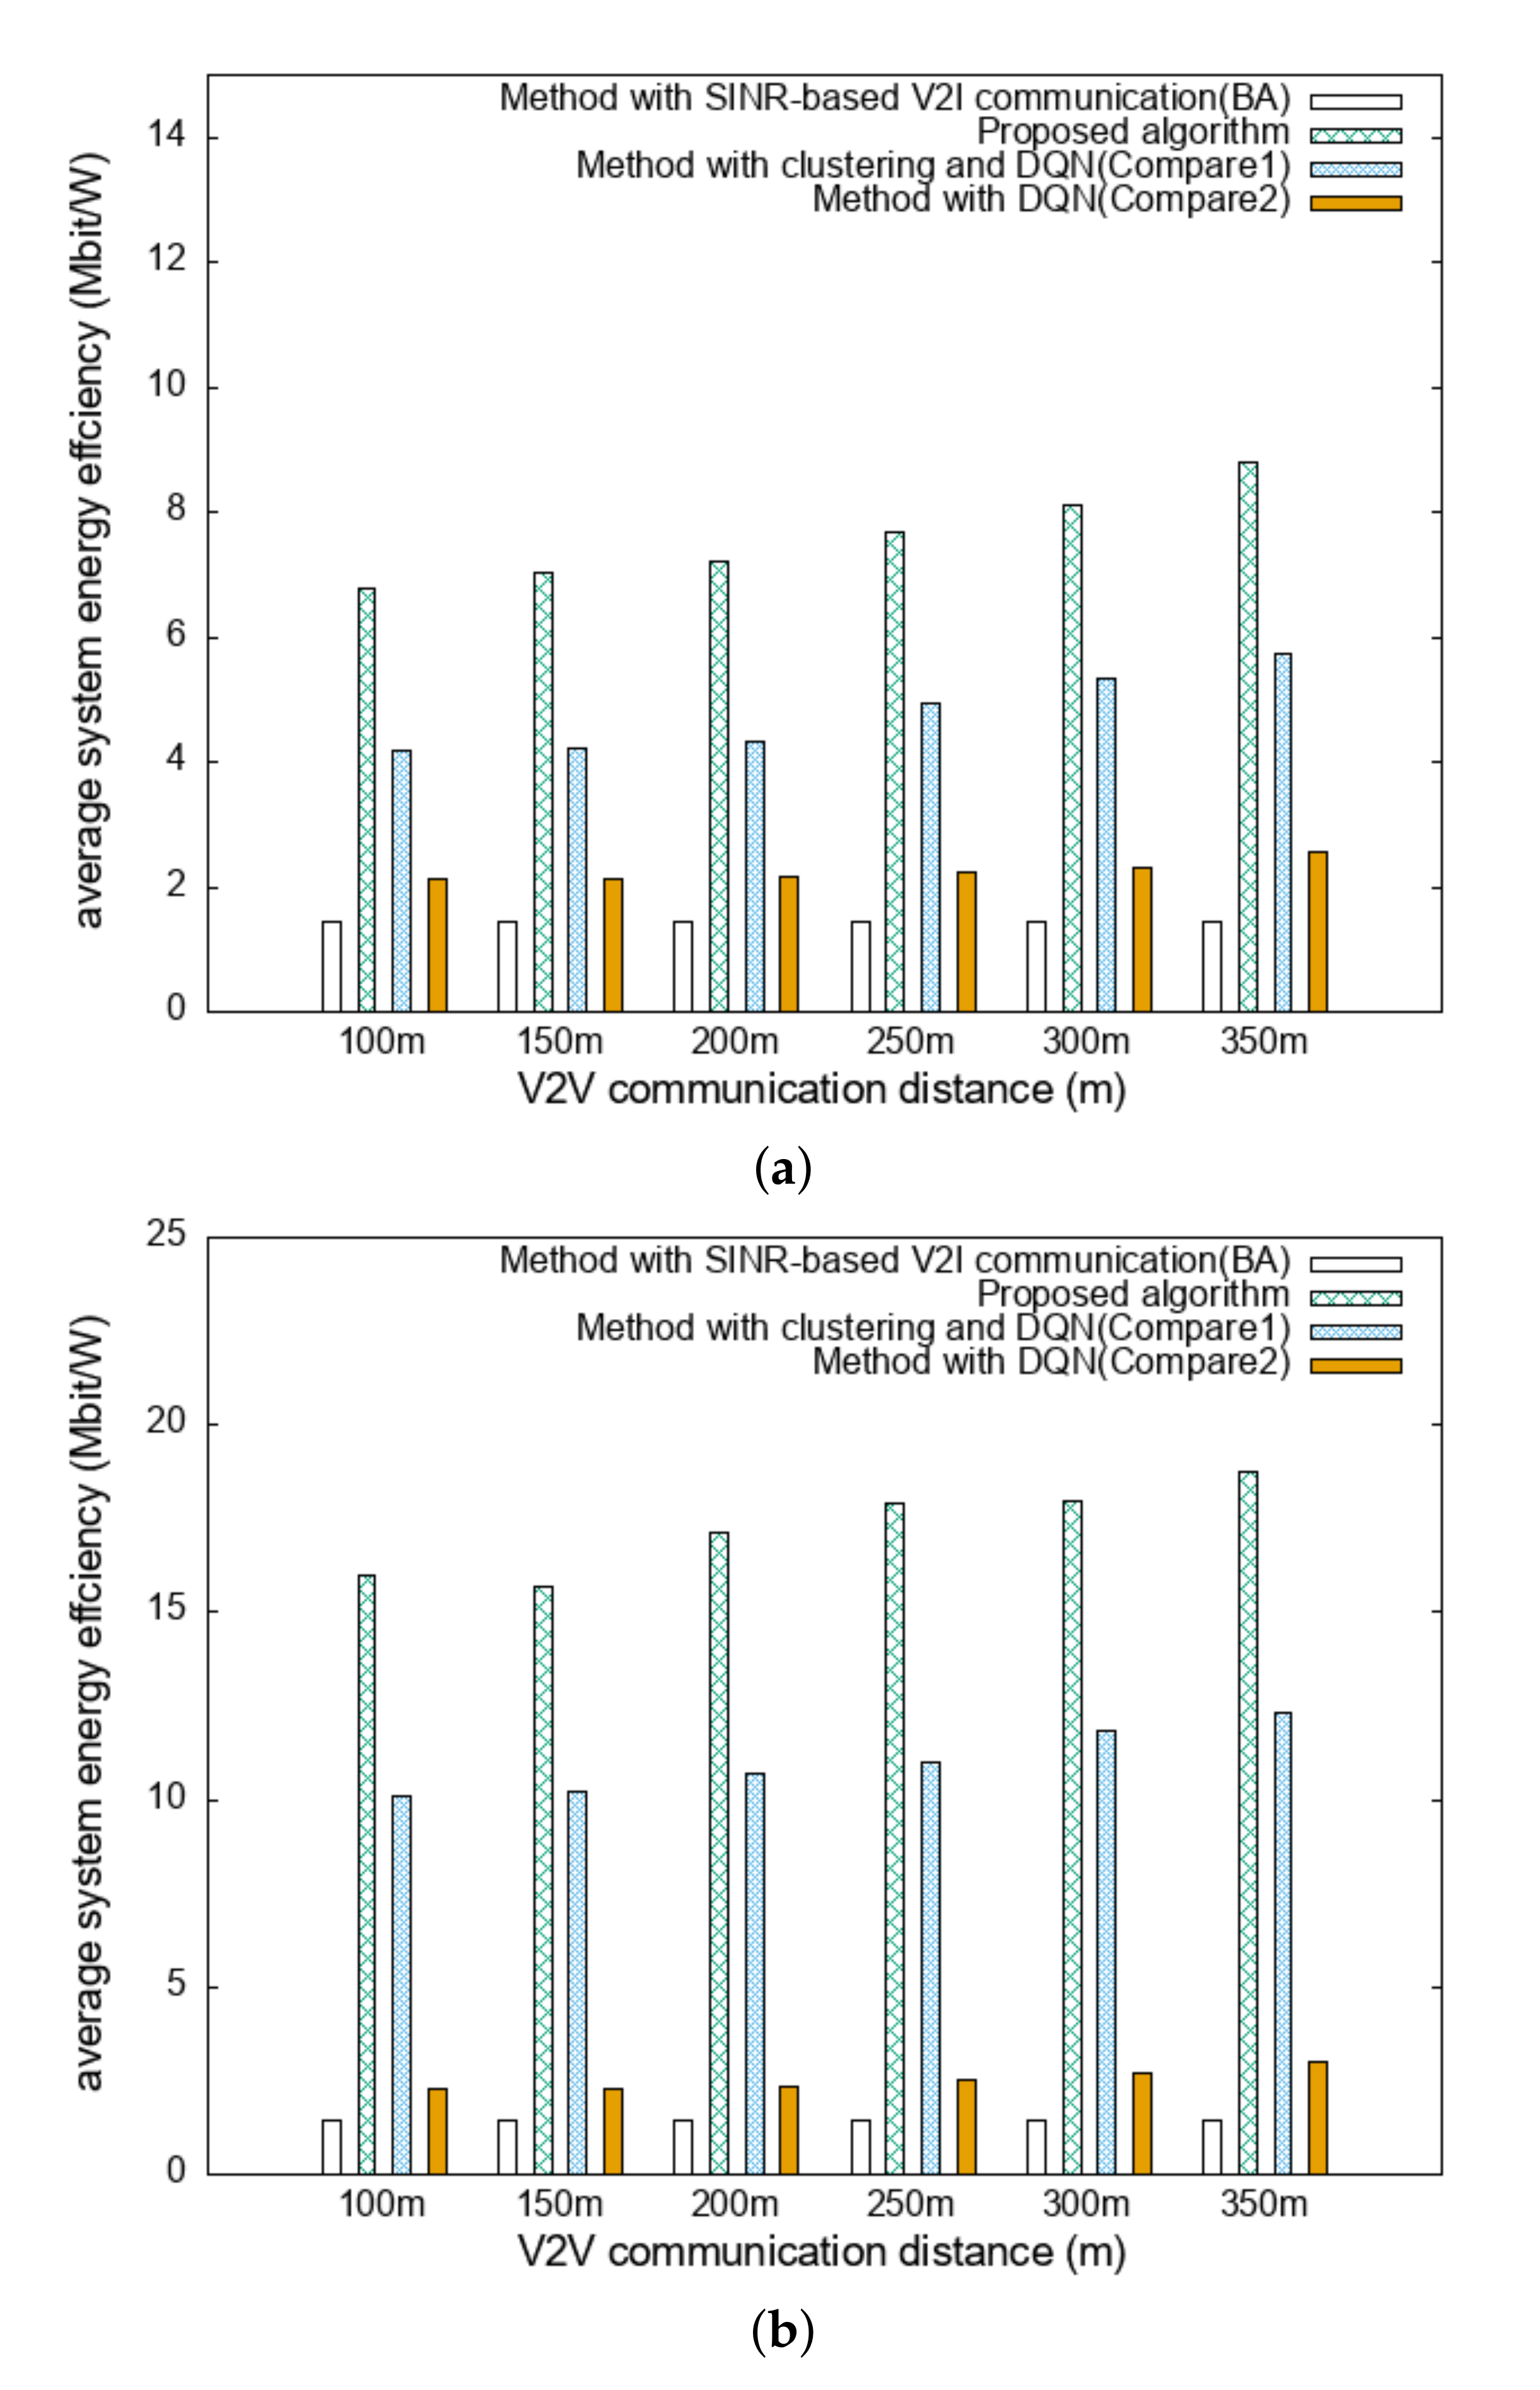
The system energy efficiency for different traffic scenarios are compared as a function of the V2V communication distance, as displayed in
Figure 7. It is observed in
Figure 7 that the system energy efficiency of all algorithms increases as the V2V communication distance increases. This is because when the V2V communication distance increases, the cluster size can increase to the extent that it is close to the limit. That is, as the number of V2V mode VEs increases, system energy consumption of the RRHs decreases and system energy efficiency increases. In the high traffic scenario, the performances of the proposed algorithm and that of
Compare1 are particularly improved because the vehicle density is higher than in the case of the low scenario, allowing more VEs to communicate in the V2V mode, which could reduce system energy consumption. In addition, the proposed algorithm displays the highest energy efficiency by applying the clustering method to reduce system energy consumption and a DQN-based resource allocation to increase the achievable data rate.
In
Figure 8, only the proposed and
Compare1 algorithms are compared as a function of vehicle density change to evaluate the performance of the clustering method. The vehicle density change denotes a change in the average distance between vehicles when the total number of vehicles is fixed, which is different for the low and high scenarios in which the number of vehicles is changed. Unlike low and high scenarios, only the average distance between vehicles changes with interference based on the distance from the communication target.
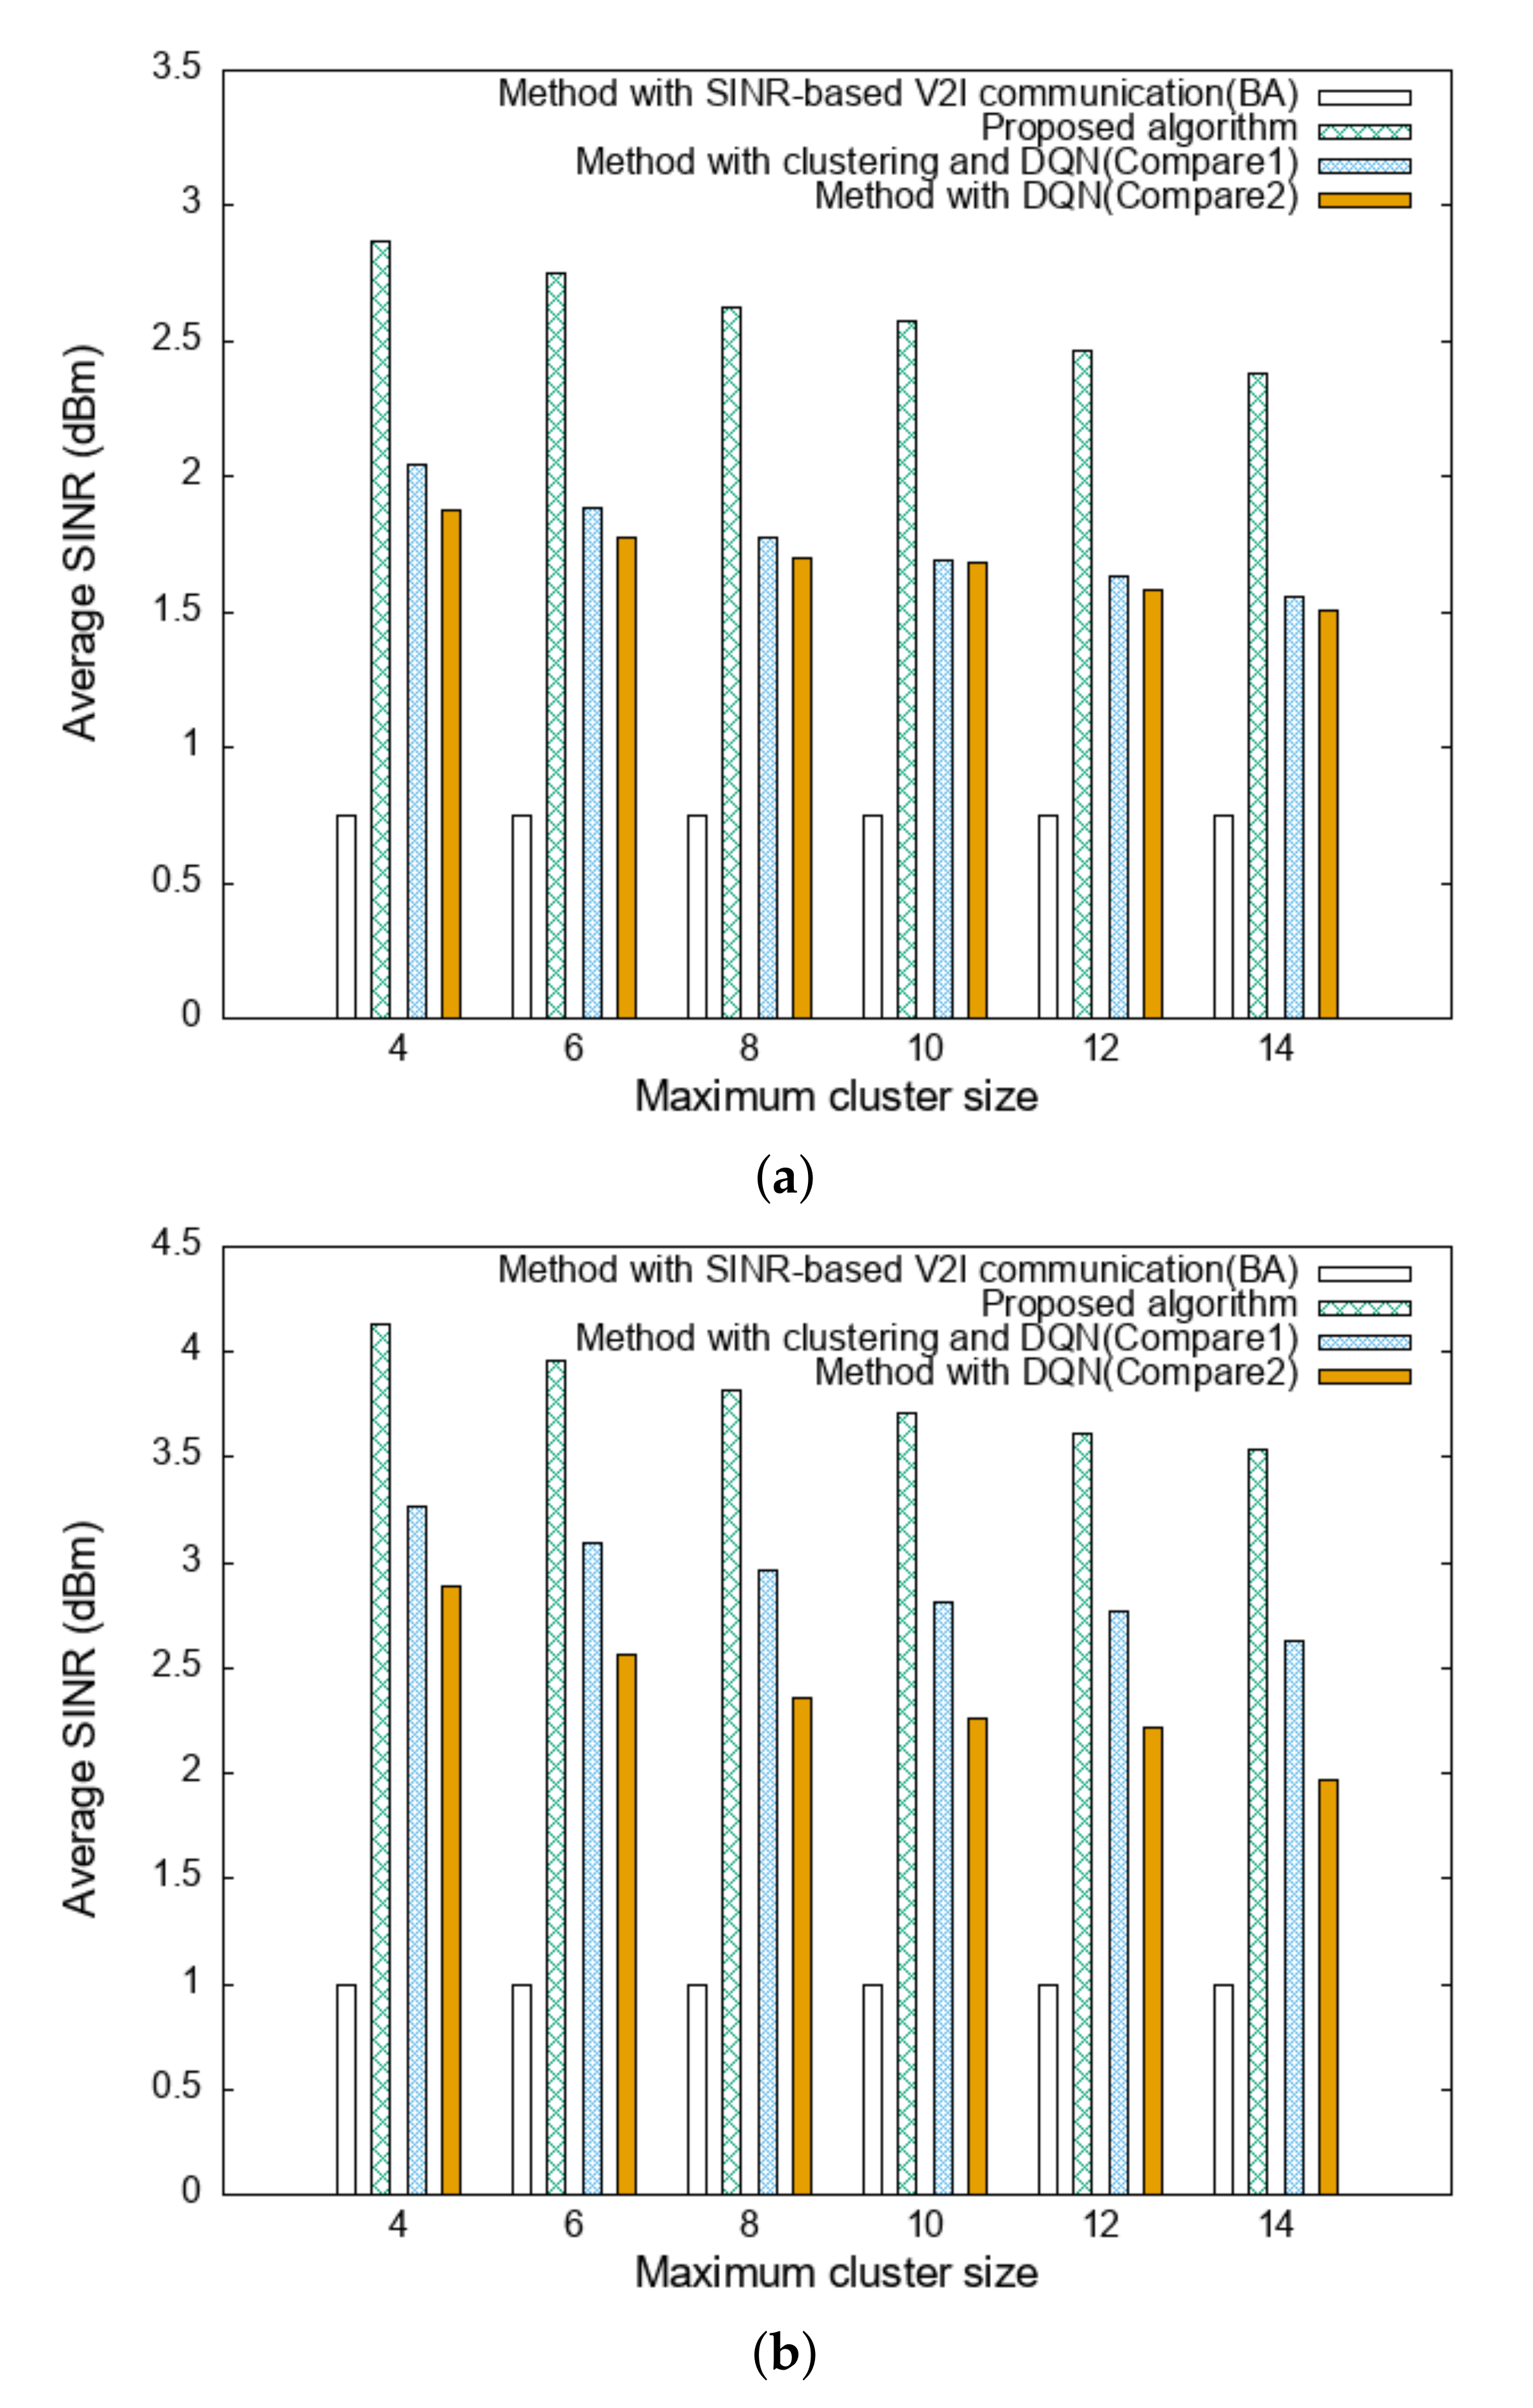
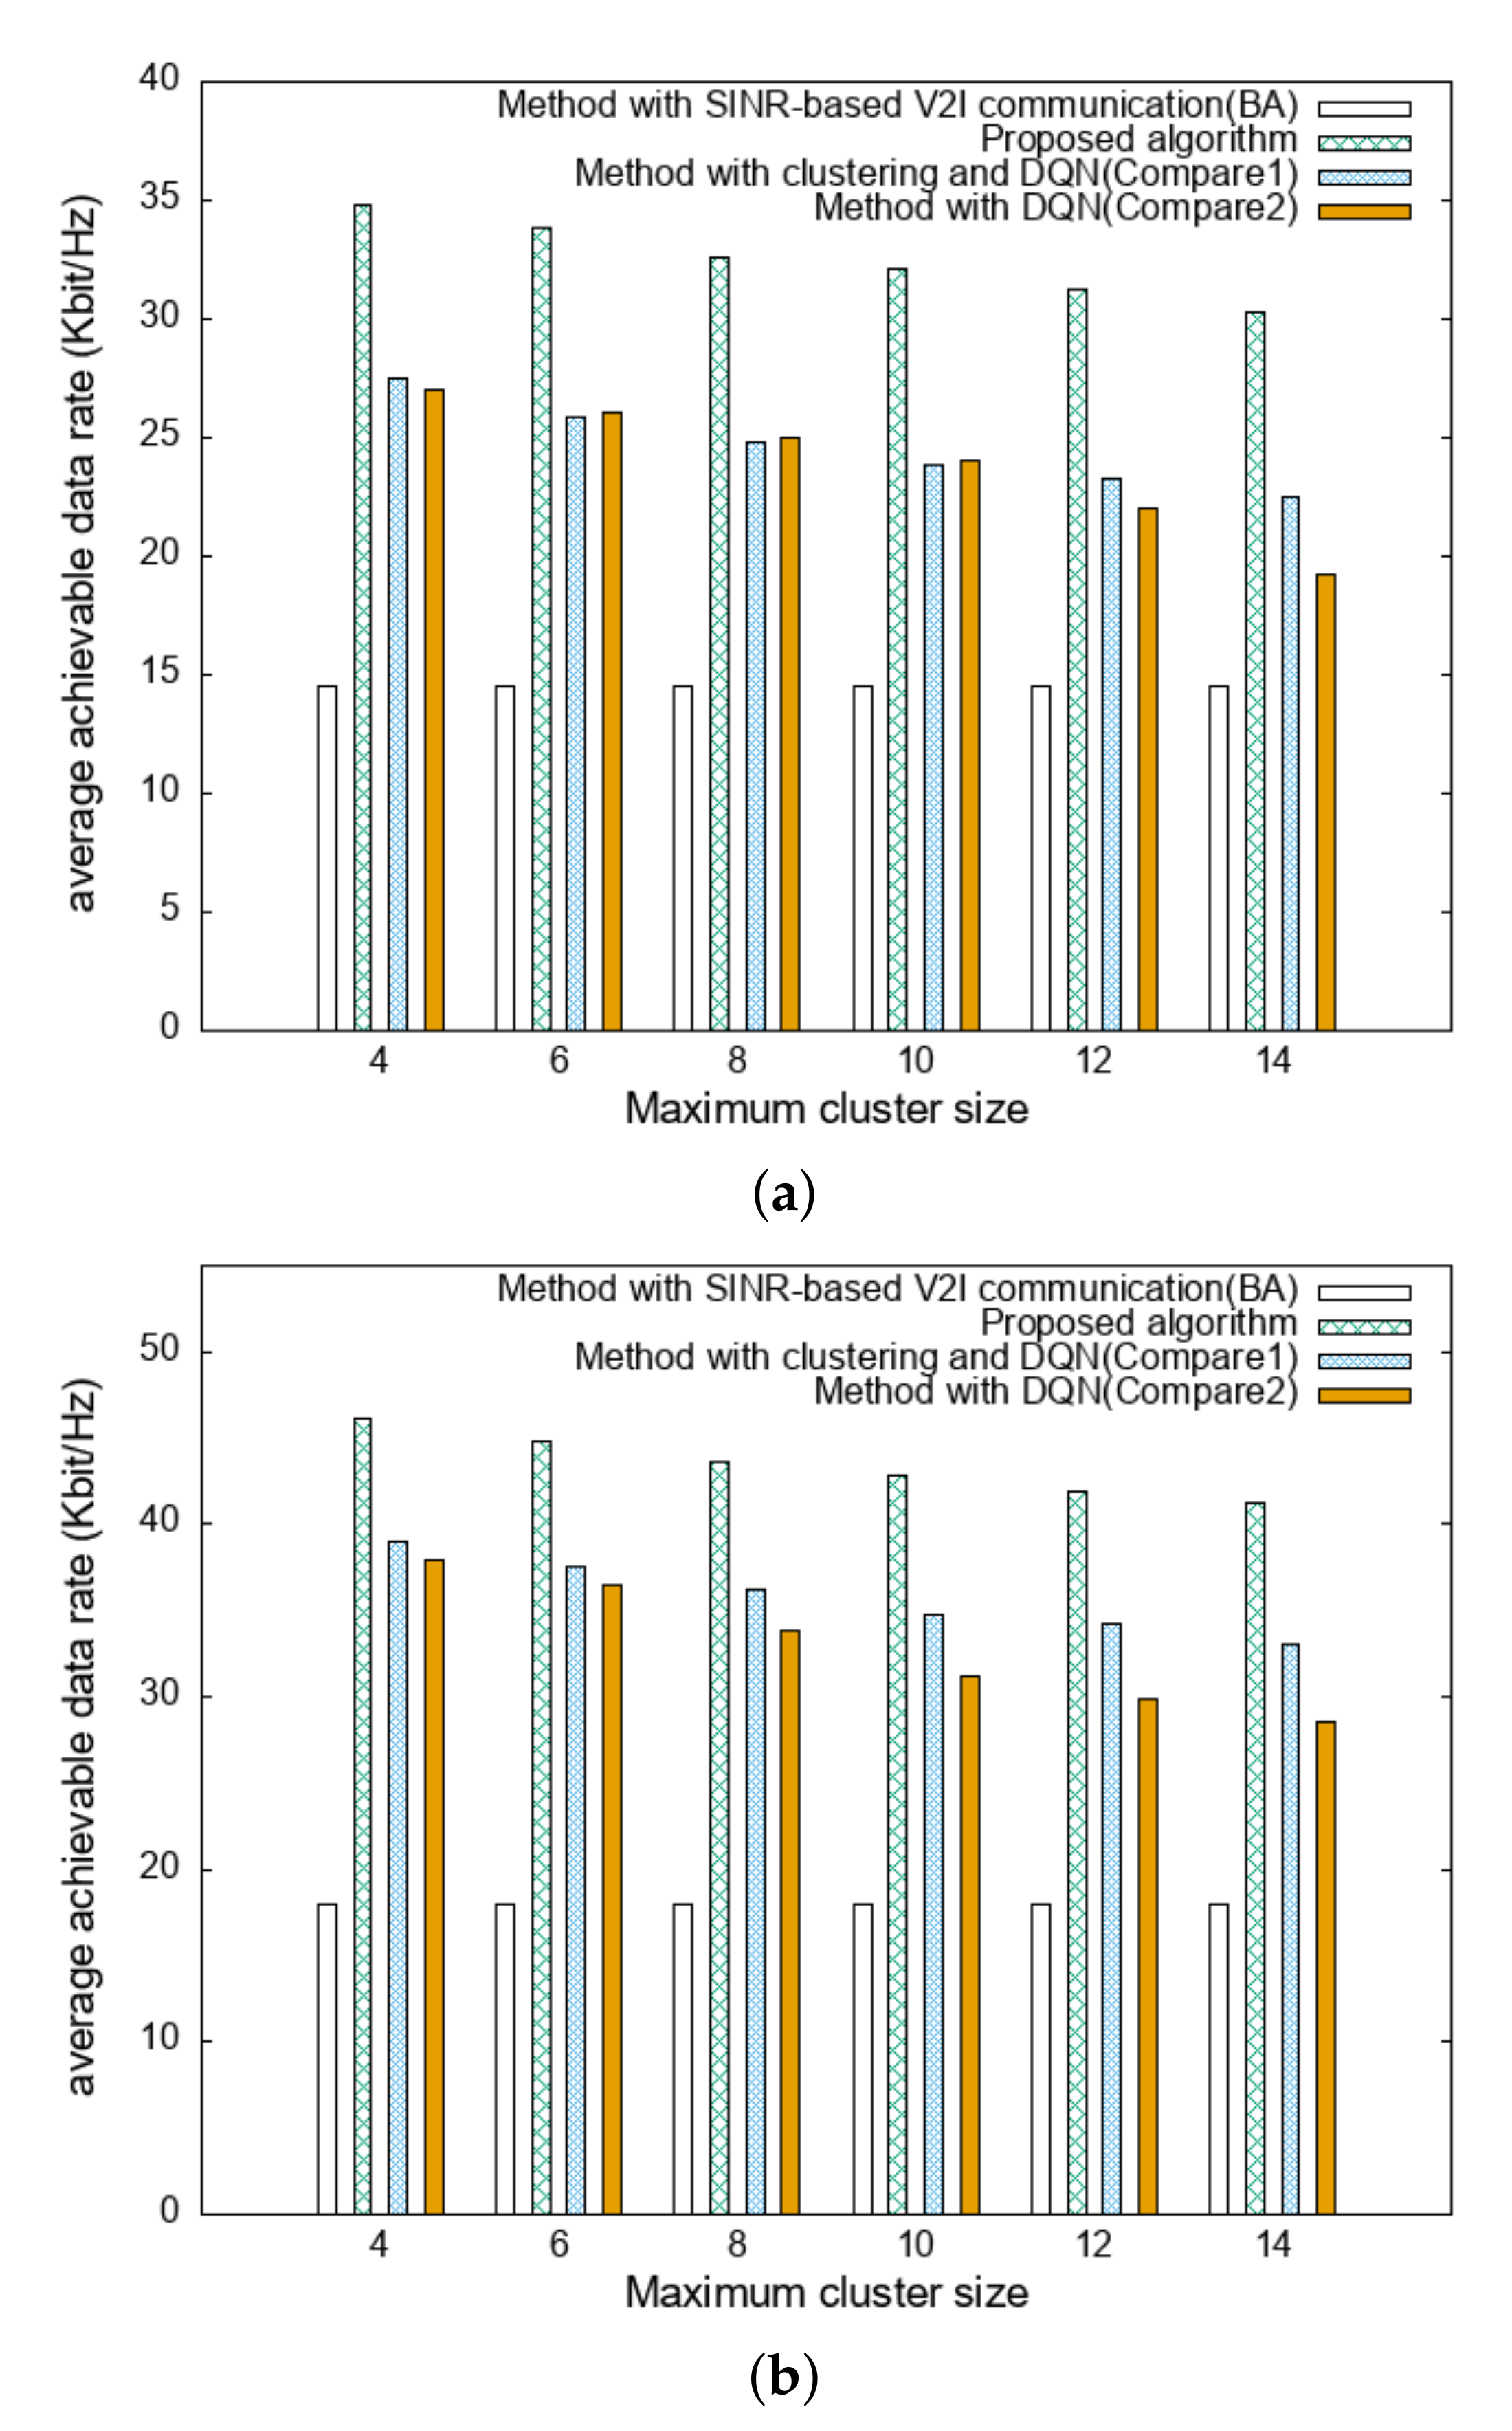
The average SINR and average achievable data rate for difference traffic scenarios are compared as a function of the cluster size, in
Figure 8 and
Figure 9. The cluster size indicates size limit, and VEs can only be clustered up to the cluster size. In
Figure 8 and
Figure 9, when the density is the same, the proposed algorithm displays the highest performance, and
Compare1 displays the next highest performance. This is because the VEs that can receive the highest SINR in the proposed algorithm are selected as CH to configure the clusters. It can be also observed that performances in the case of high traffic scenarios are better than those of the low scenarios because the number of VEs in the high scenario increases as the distance between the vehicles is decreased. Interference also increases, but the performance is still better because the benefits of getting closer to the communication target outweigh other considerations. The increase in density is also a result of the decrease in the average distance between vehicles, increasing the number of clustered vehicles. In each algorithm, the distance between VEs is on average 0.5, which is less than a density of 1. Therefore, as the distance to the communication target becomes closer, the average SINR that is received would increase and thus, the achievable data rate would also increase.
The system energy efficiency for different traffic scenarios is compared as a function of the V2V communication distance, as displayed in
Figure 10. In
Figure 10, it is observed that the system energy efficiency is higher for the high scenario. This is because in the high scenario, the proportion of clustered VEs increases, such that the number of VEs communicating through the RRH decreases. Thus, the system energy efficiency also increases. In addition, it is observed that the system energy efficiency of the proposed algorithm is higher compared to
Compare1 for the same density although
Compare1 is also based on the vehicle clustering method. The number of V2I mode VEs in the proposed algorithm is smaller than that of
Compare1. As a result, system energy consumption is relatively small and interference is reduced, resulting in a higher achievable data rate.
The proposed algorithm exhibited the best performance in terms of system energy efficiency, achievable data rate, and average SINR. The proposed algorithm maximized energy efficiency while ensuring QoS. As mentioned earlier, the system energy efficiency and achievable data rate have a trade-off relationship. The proposed algorithm used vehicle clustering method and DQN based resource allocation method to achieve the highest performance compared to other algorithms.


