
Test-Bench for the Characterization of Flexion Sensors Used in Biomechanics


Abstract
:1. Introduction
2. Materials and Methods
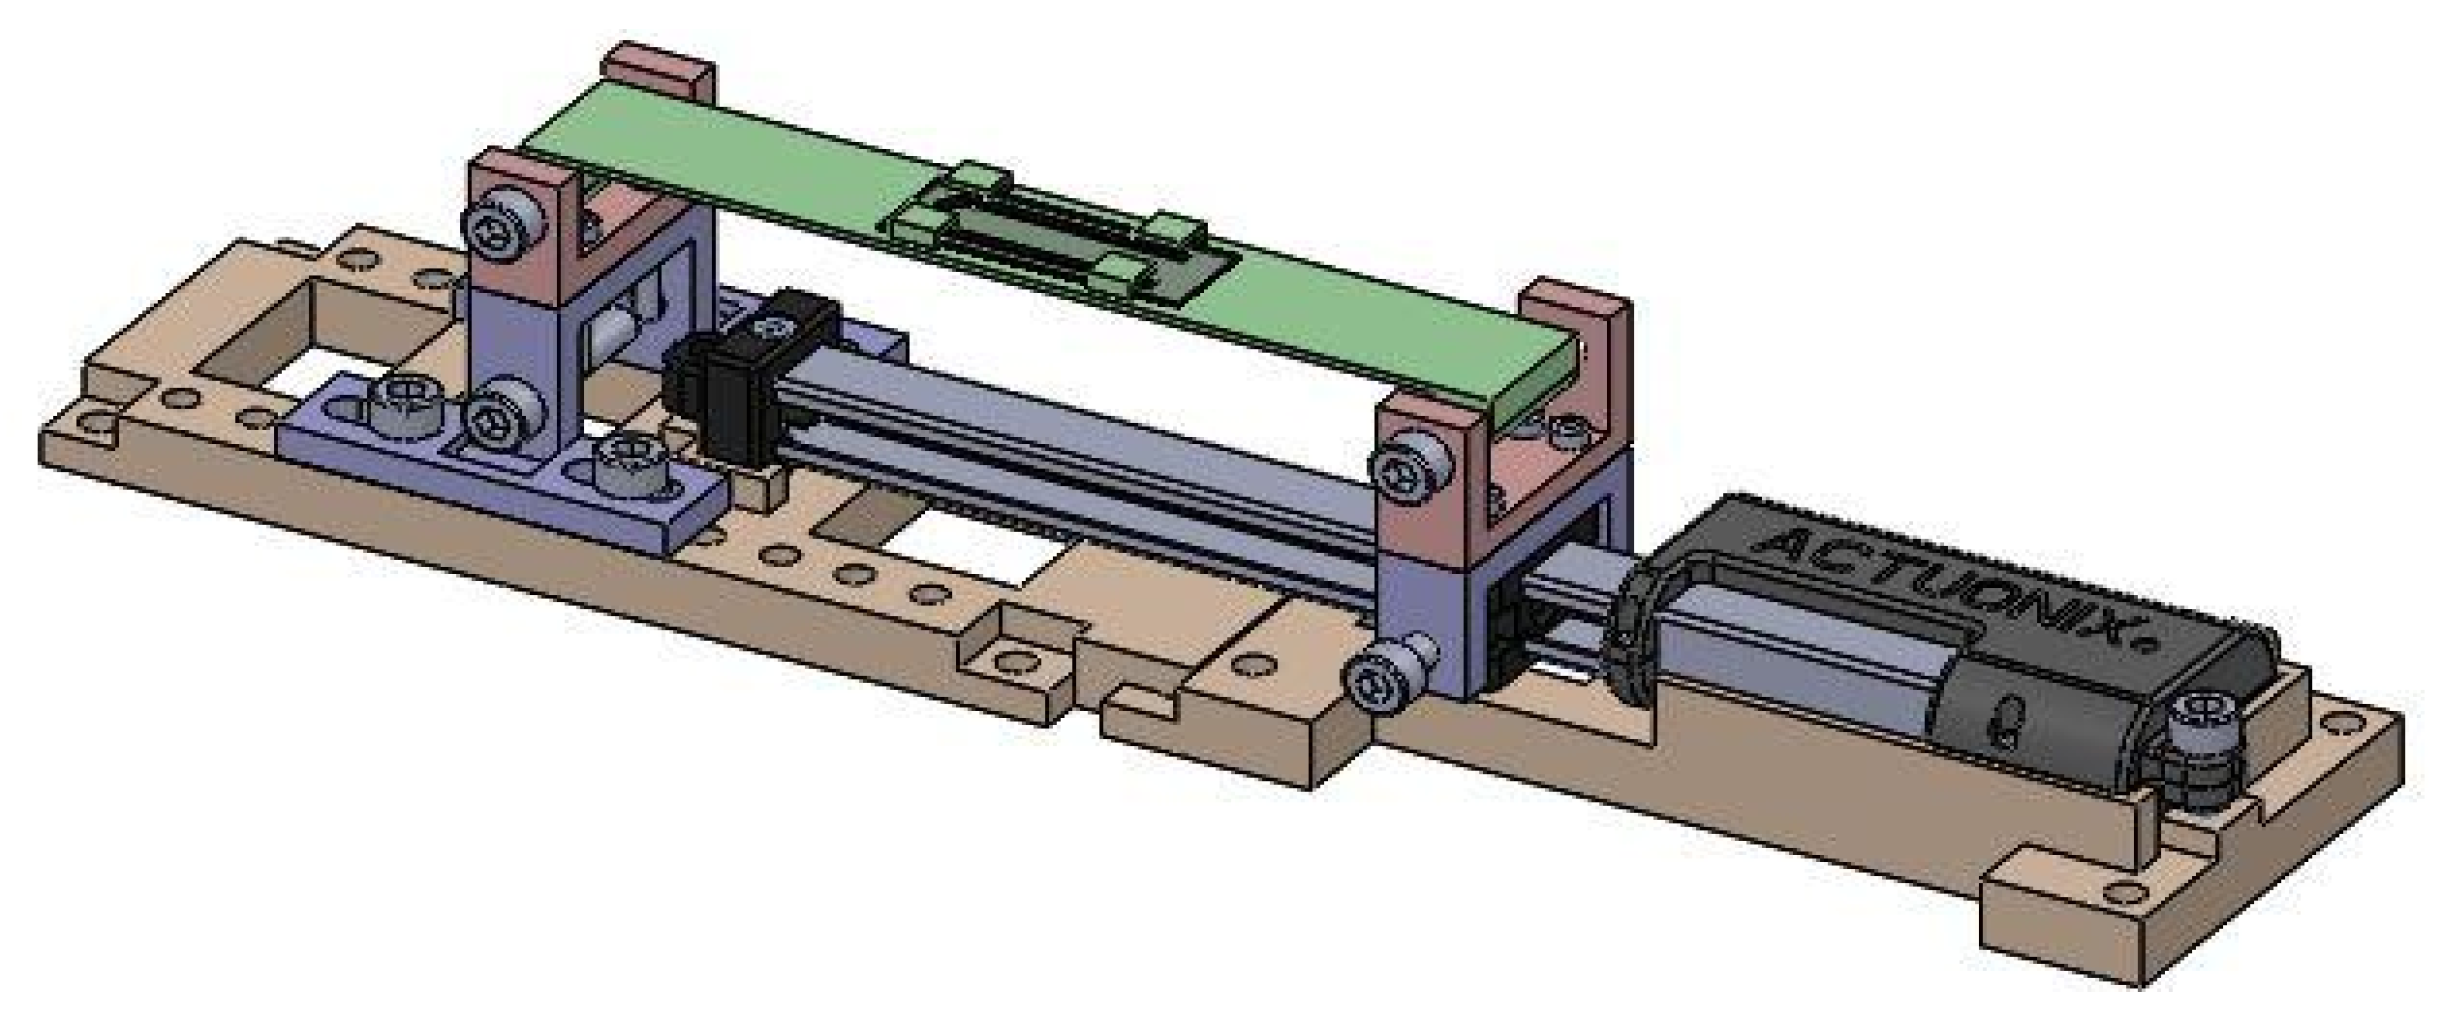
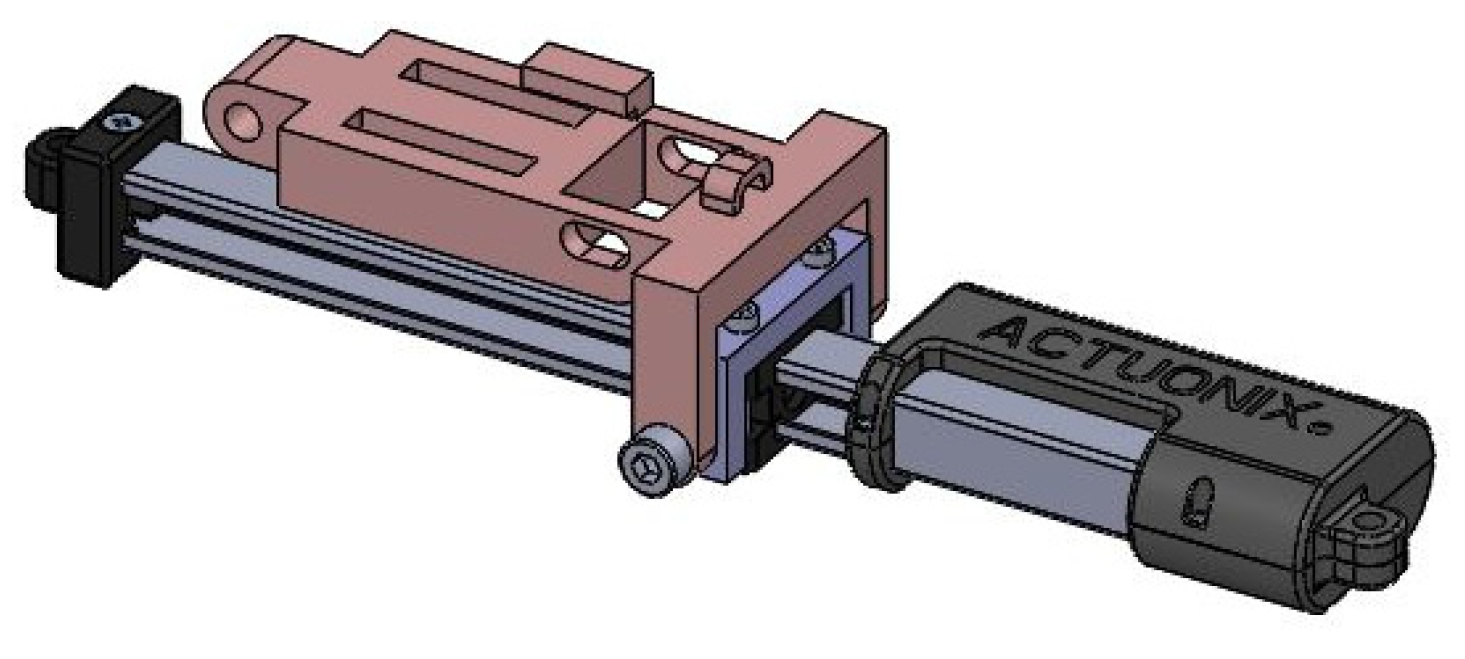
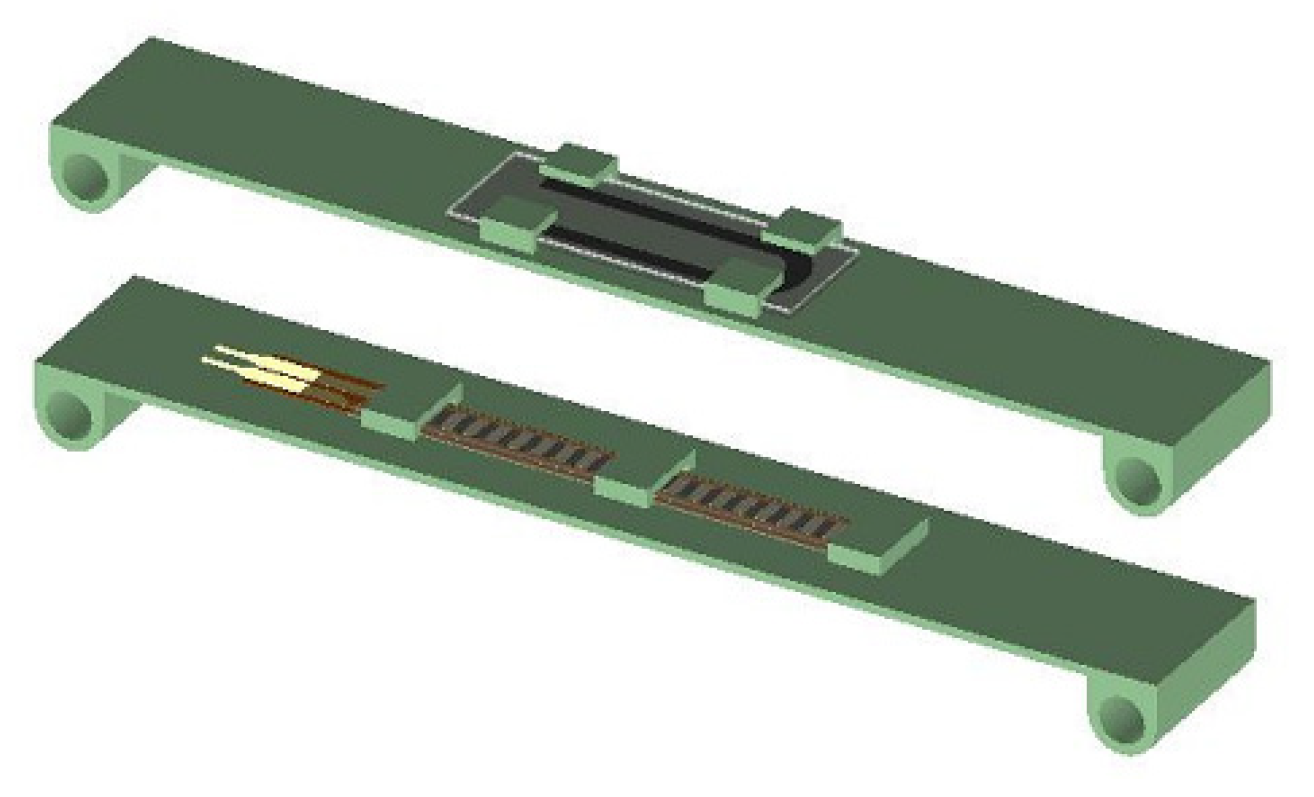
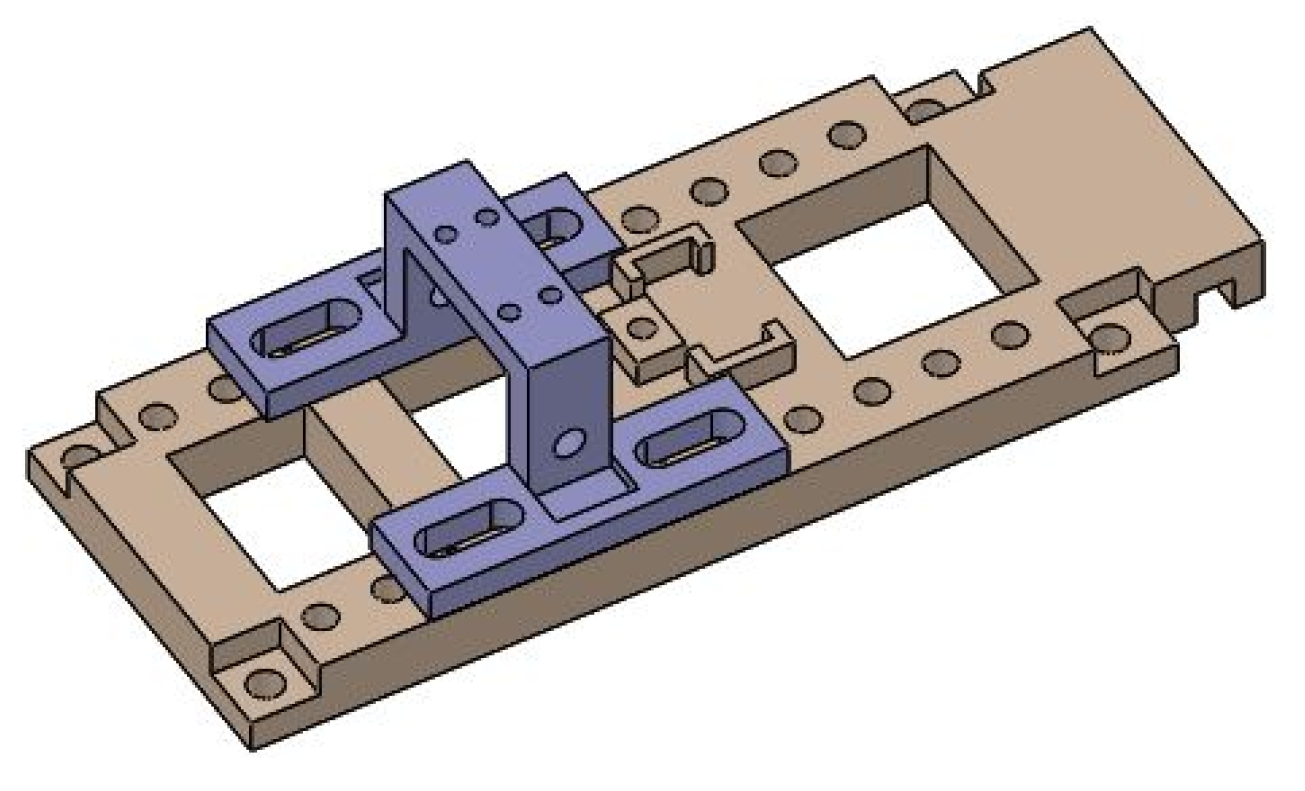
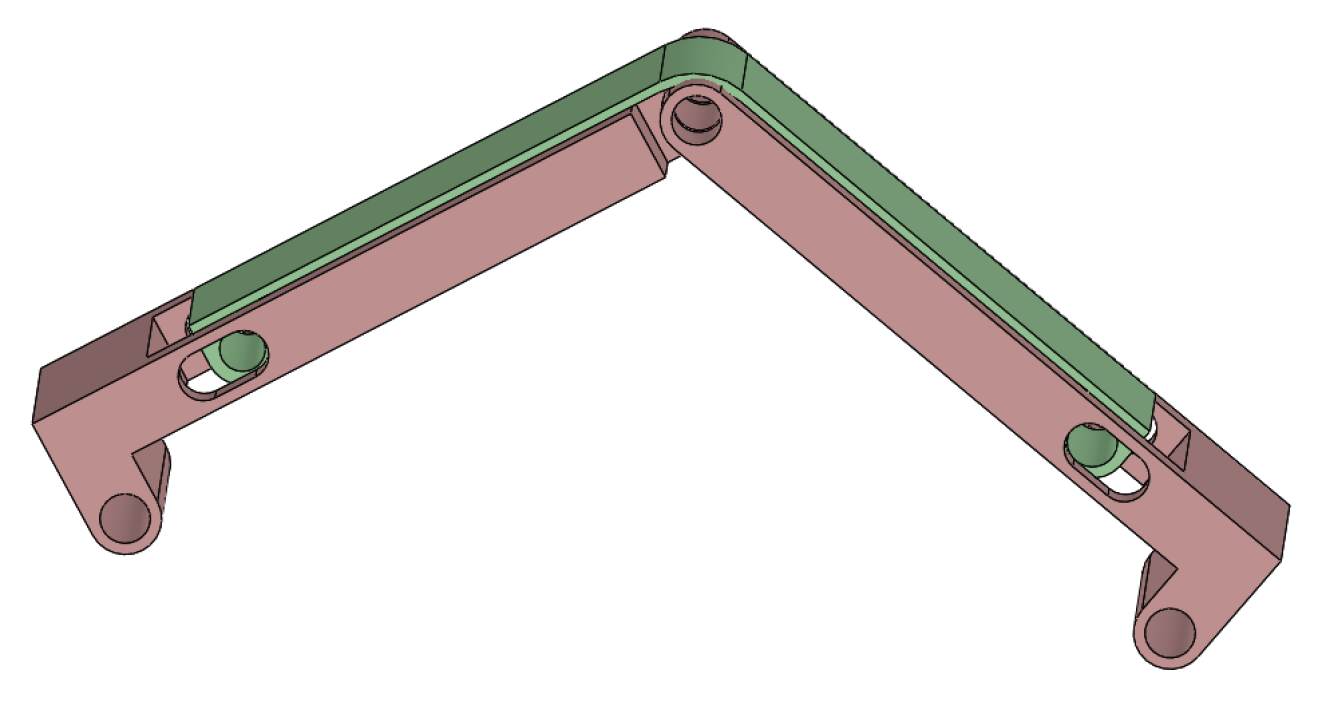
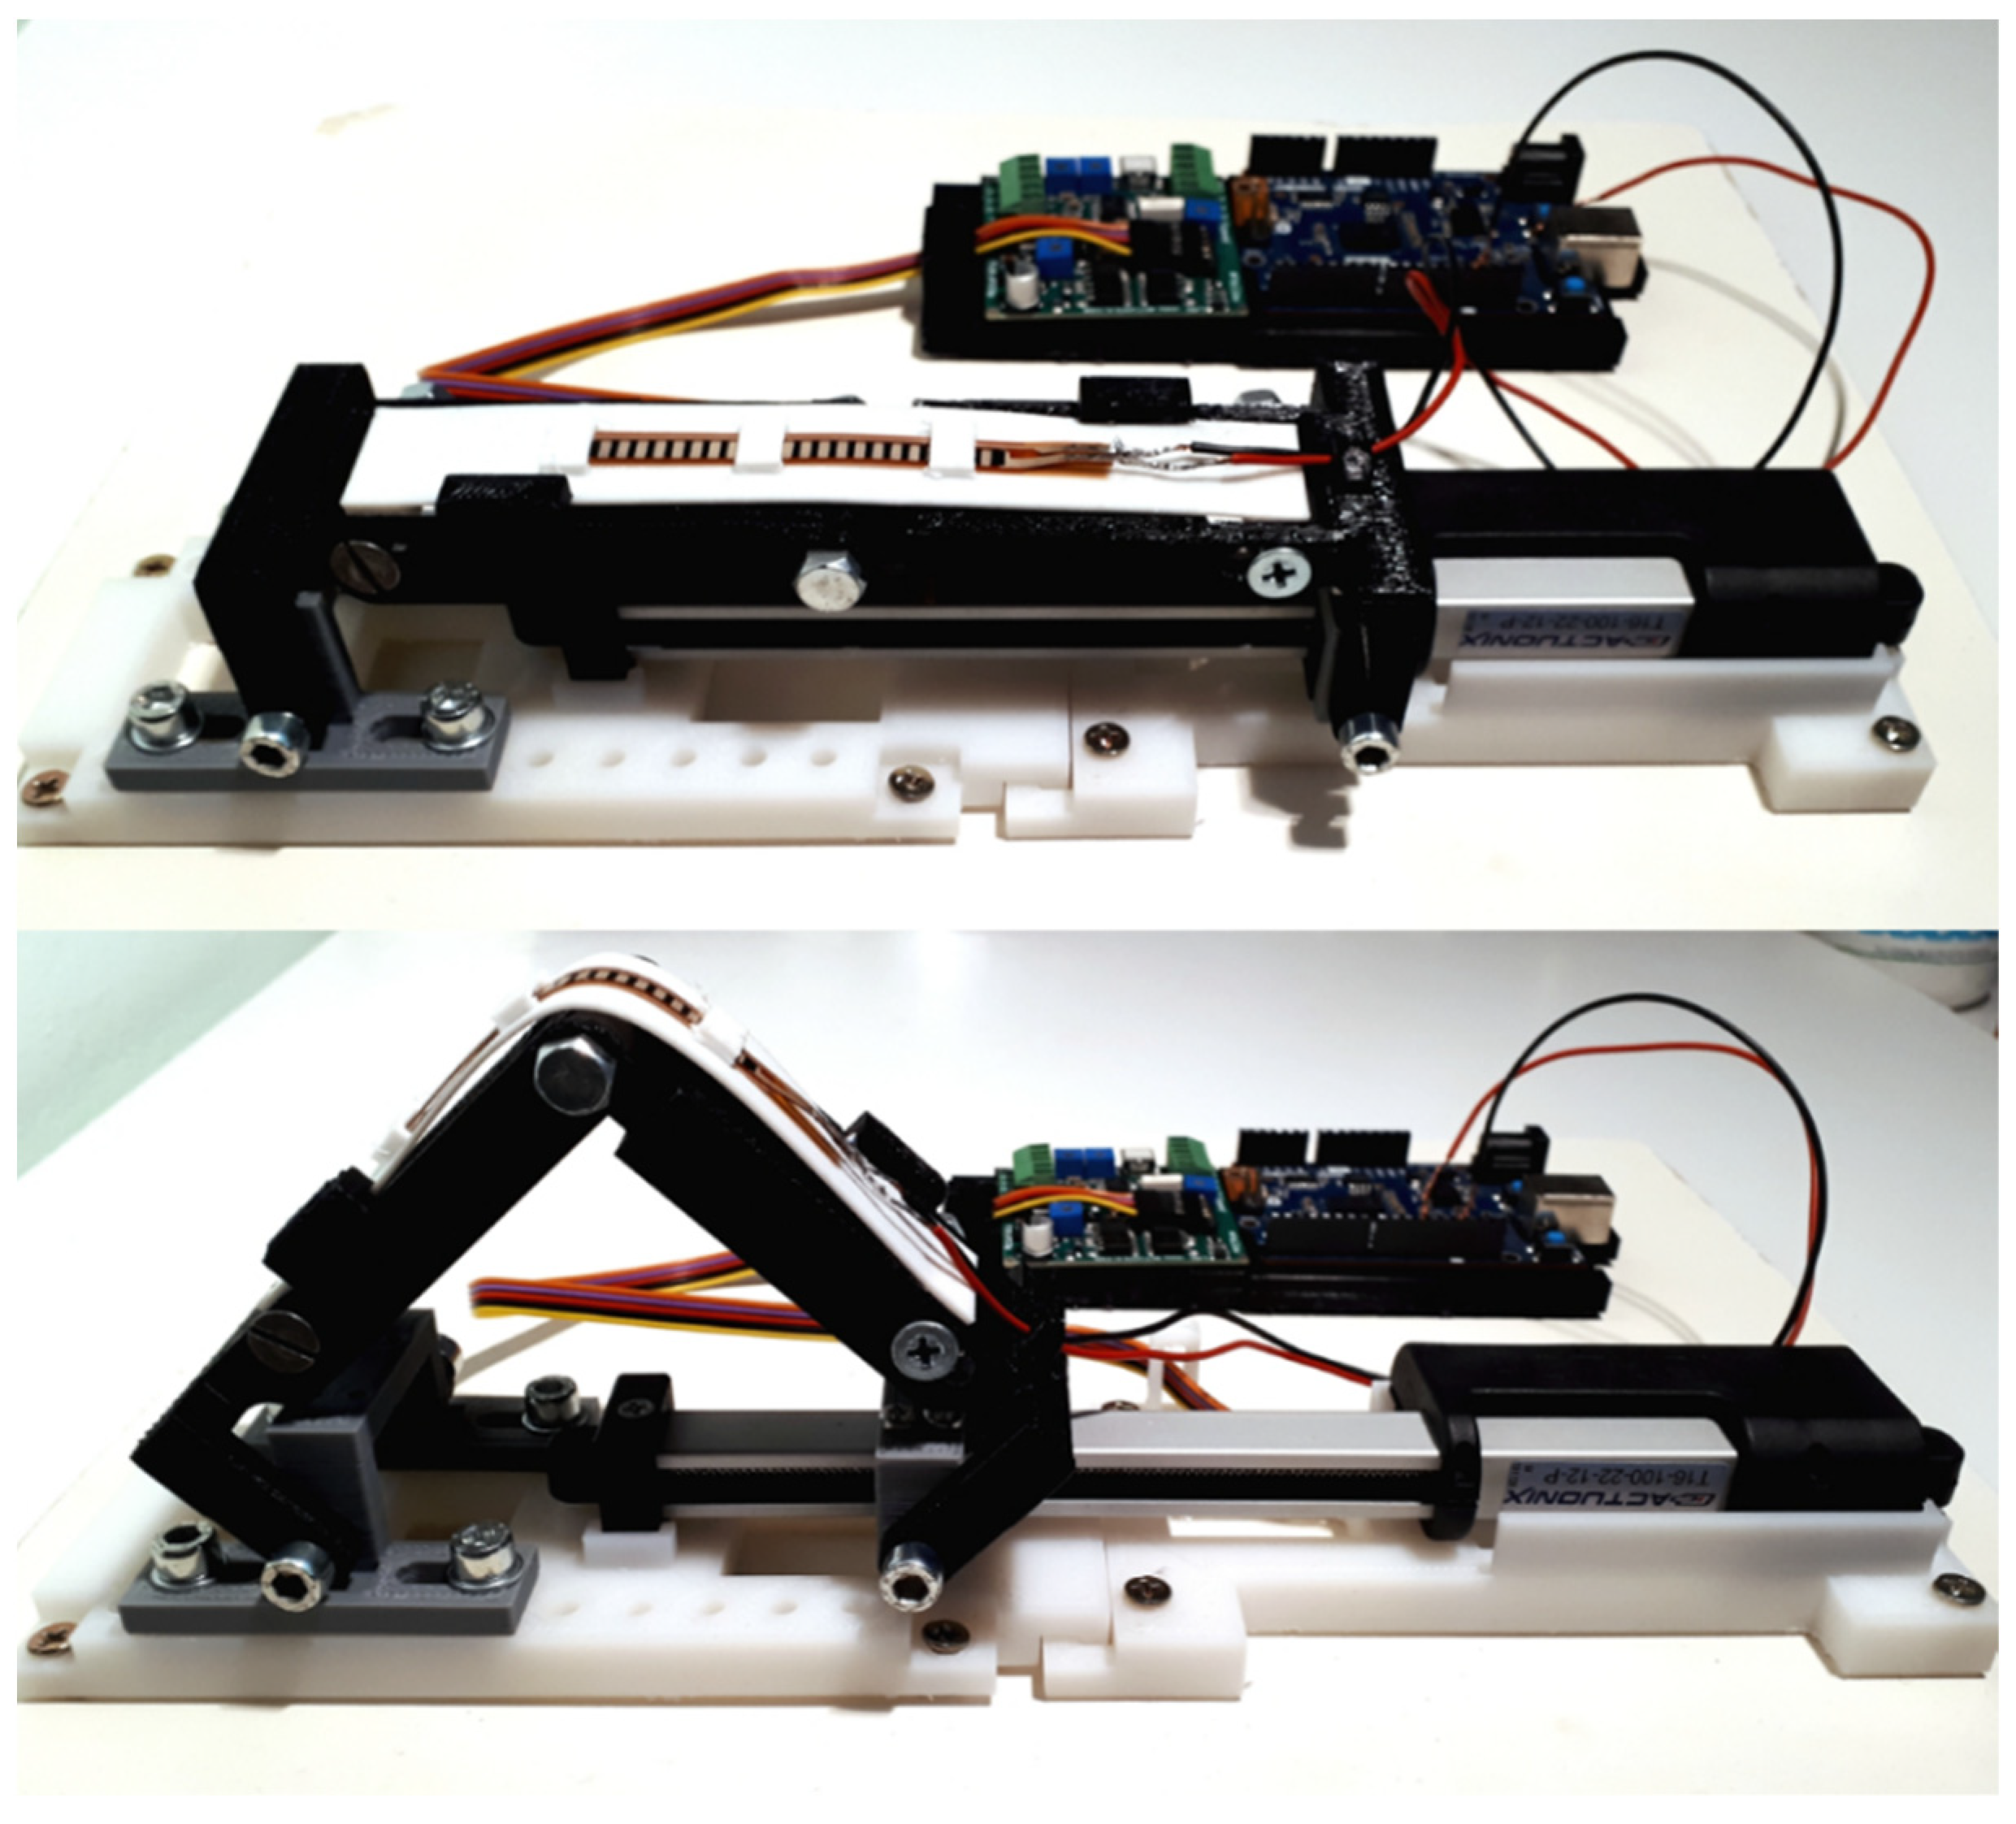
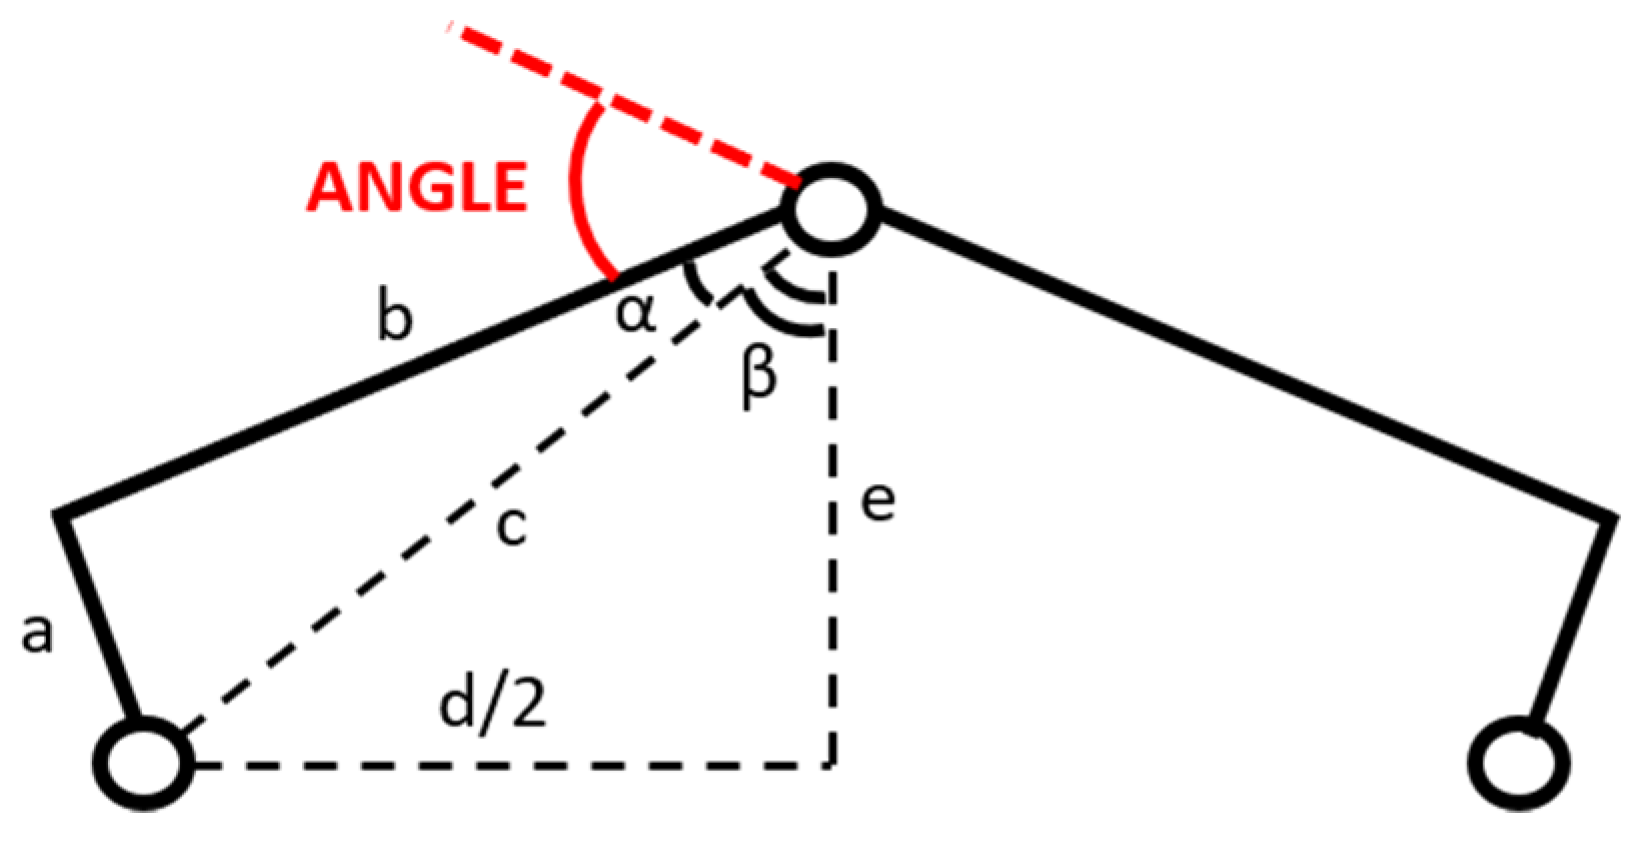
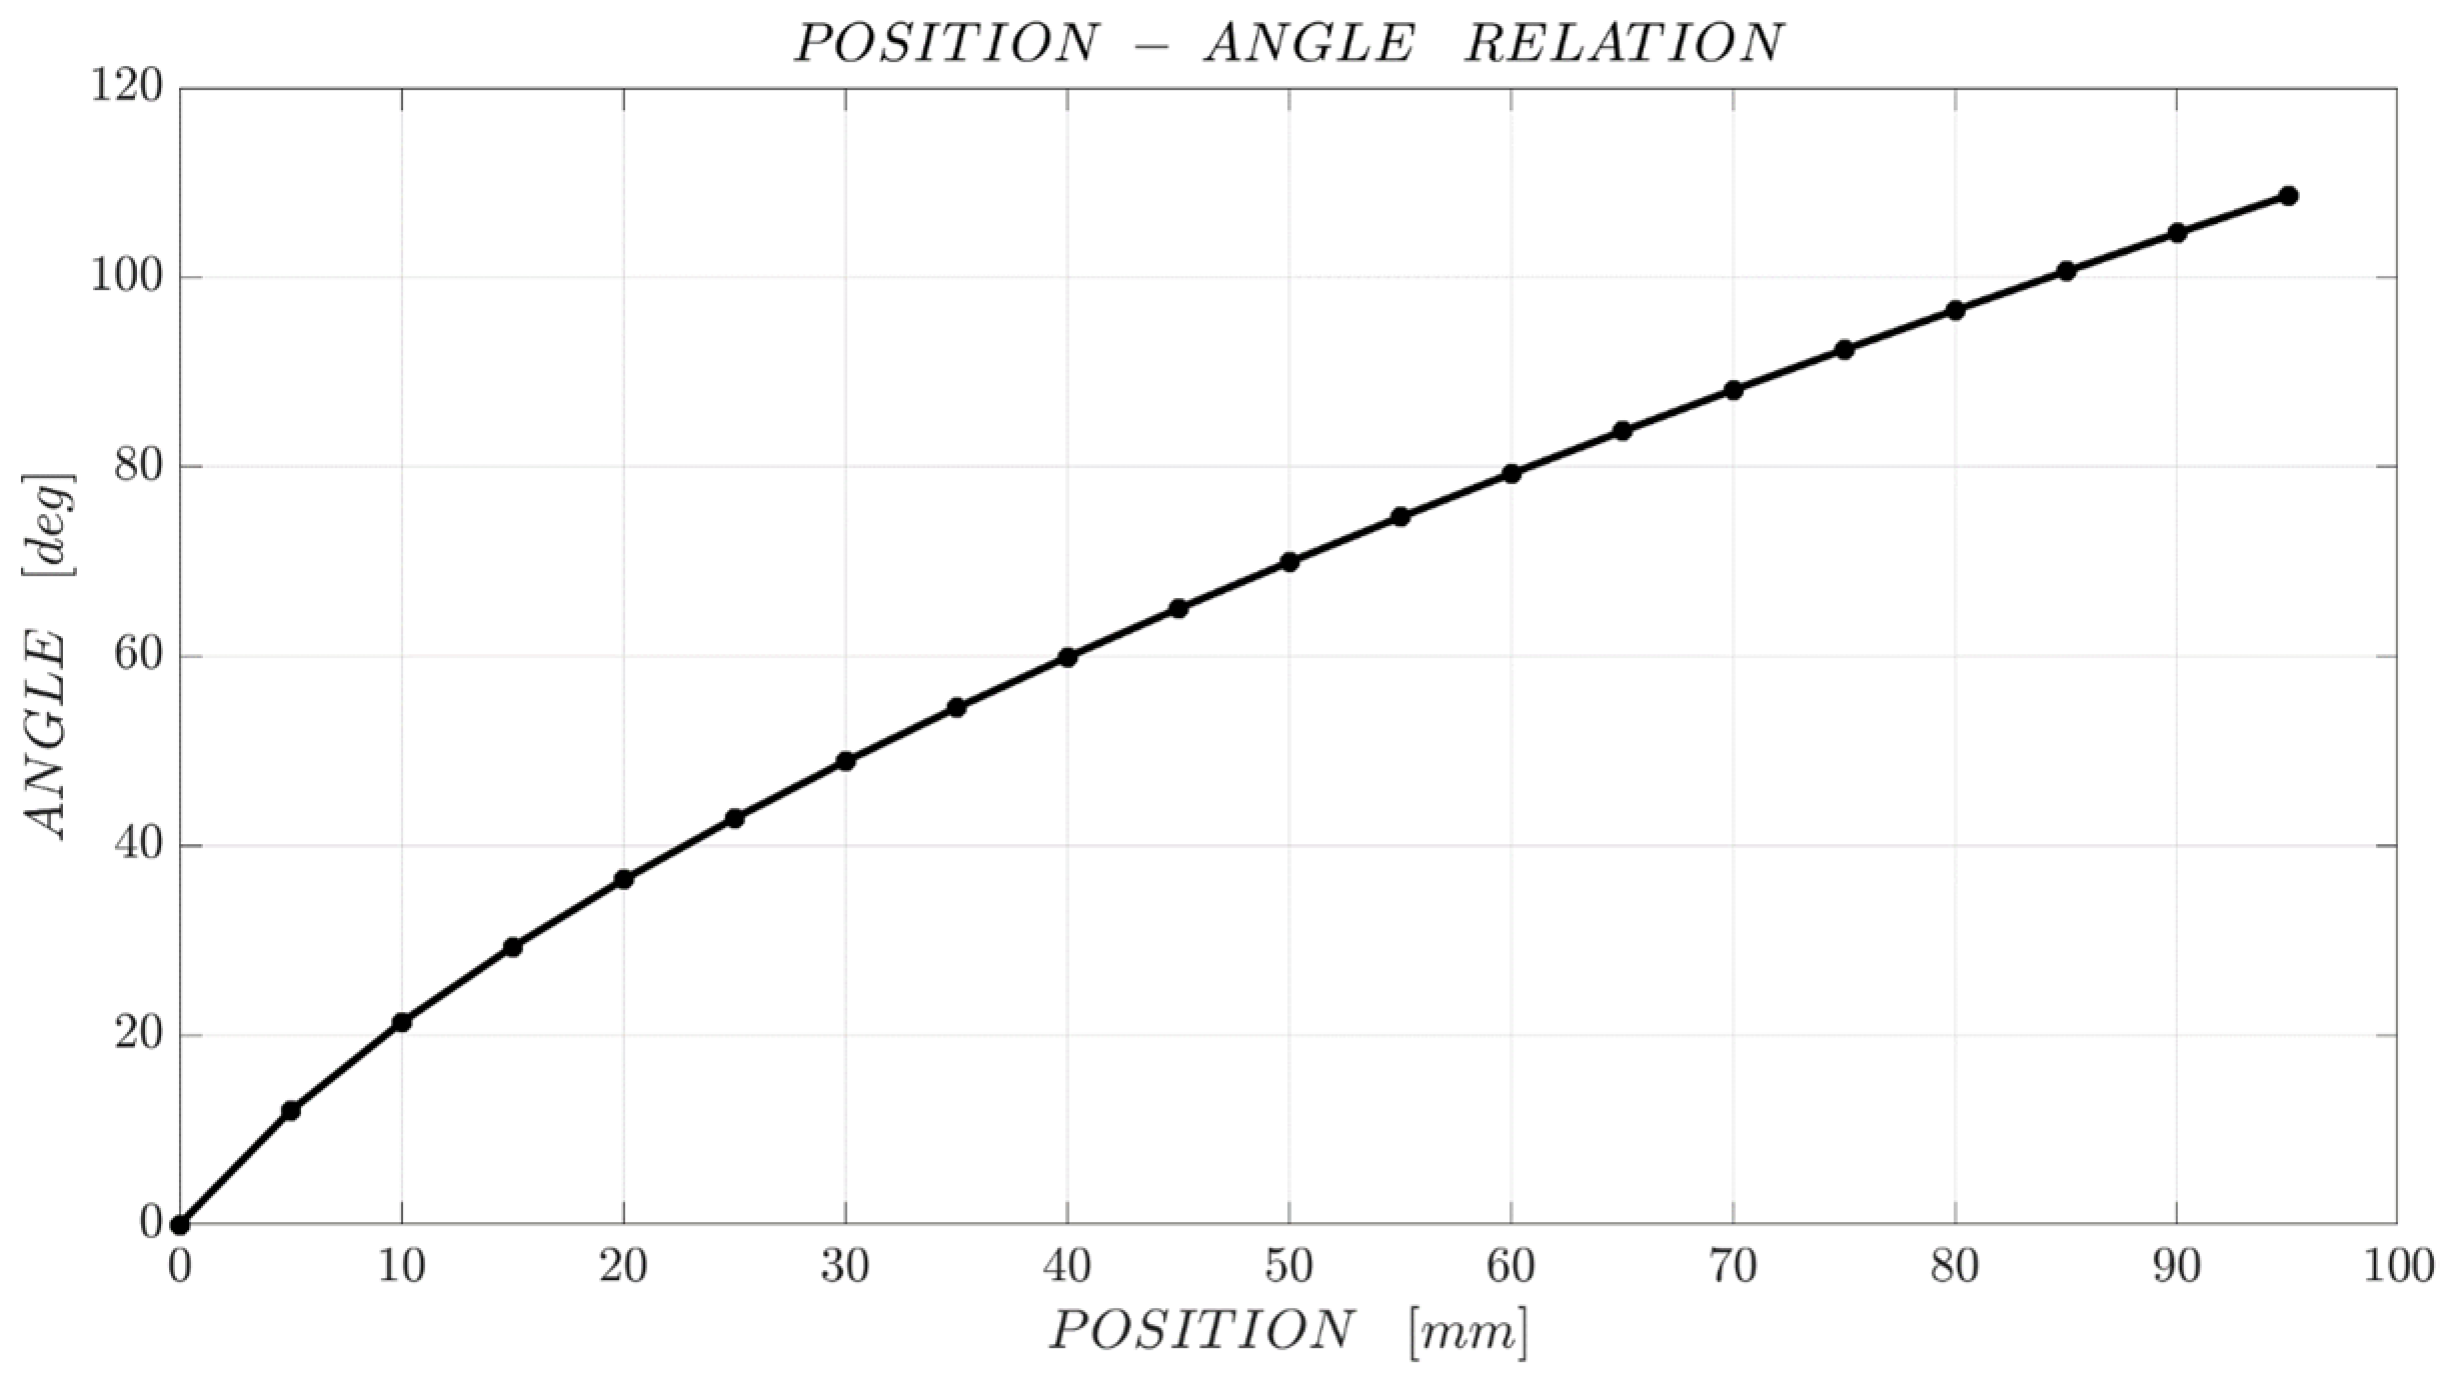
2.1. Mechanical Structure of the Test Bench
- Adaptability of the device to both cases: sensors used with fixed and variable radius of curvature;
- High measurement repeatability;
- Simplicity of use;
- Ease of reproduction;
- Low cost of construction;
- Possibility of using the device for both flexion and strain sensors.
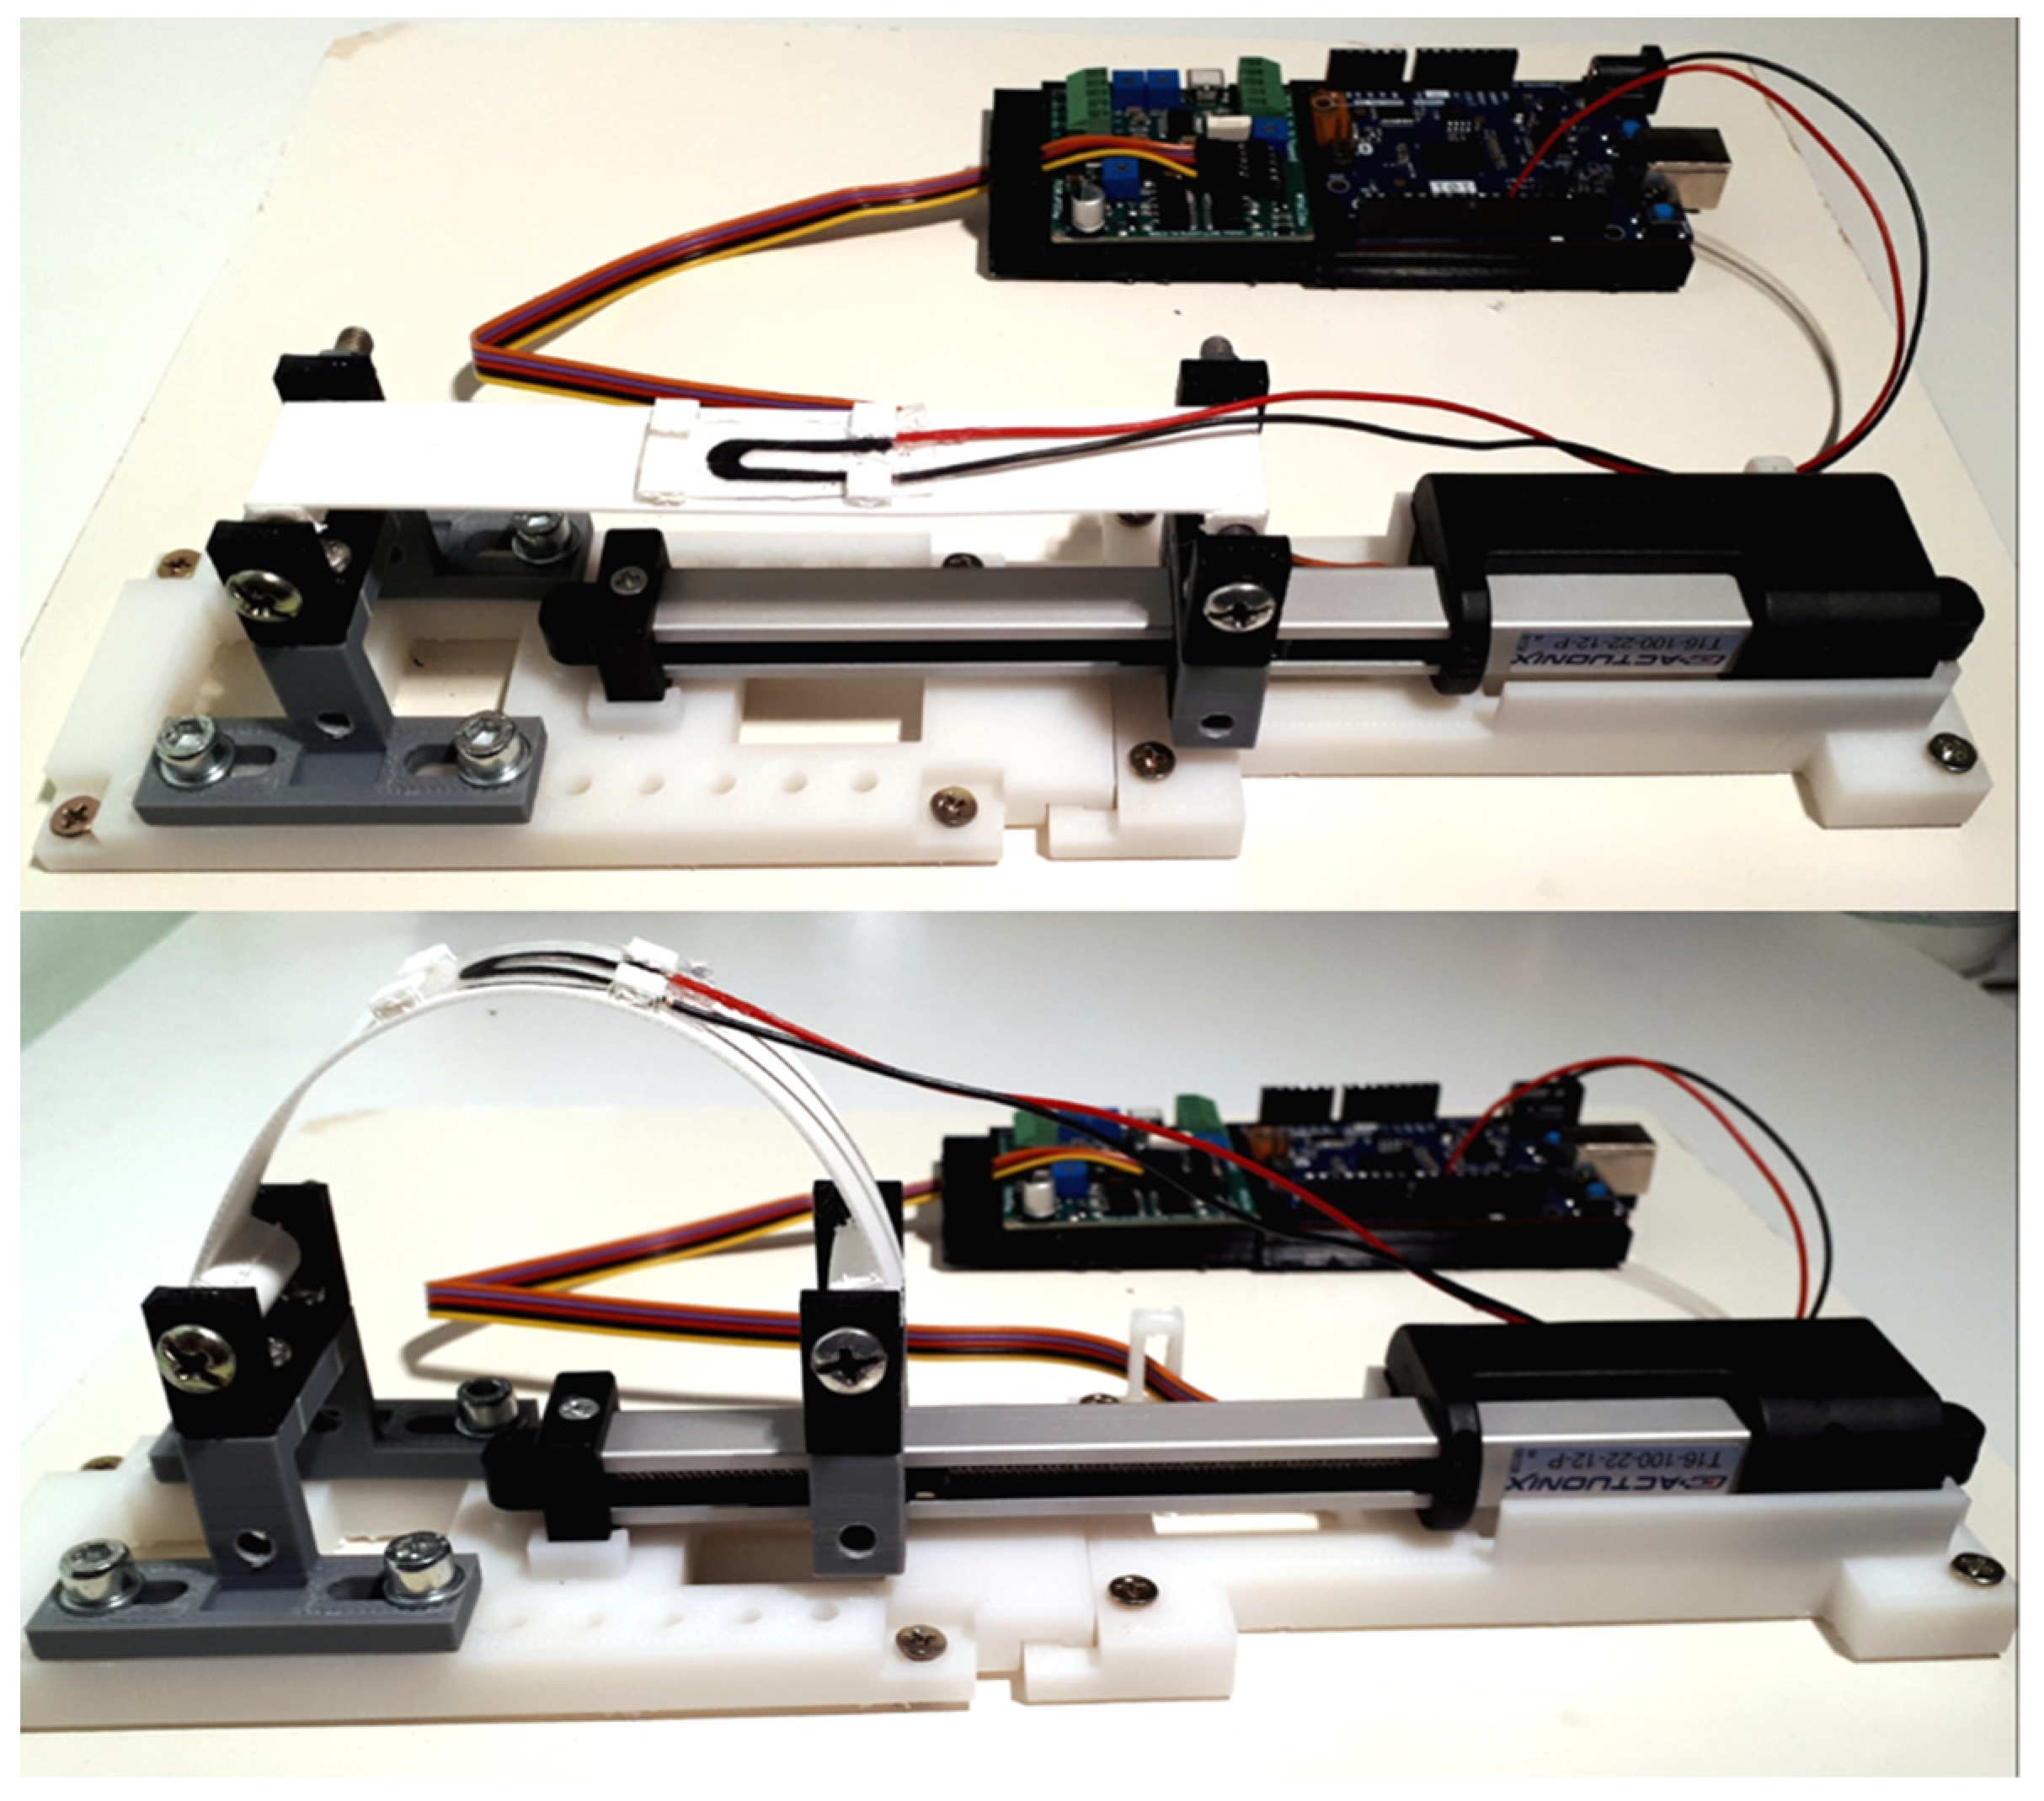
- Linear movement of the element connected to the component on which the sensor is arranged to generate the bending, using a linear motor with high repeatability;
- Realization of two different types of sensor support element to obtain the two different bending modalities required by the two main types of applications as a function of the radius of curvature;
- Design of a significant number of components suitable for 3D printing with additive manufacturing;
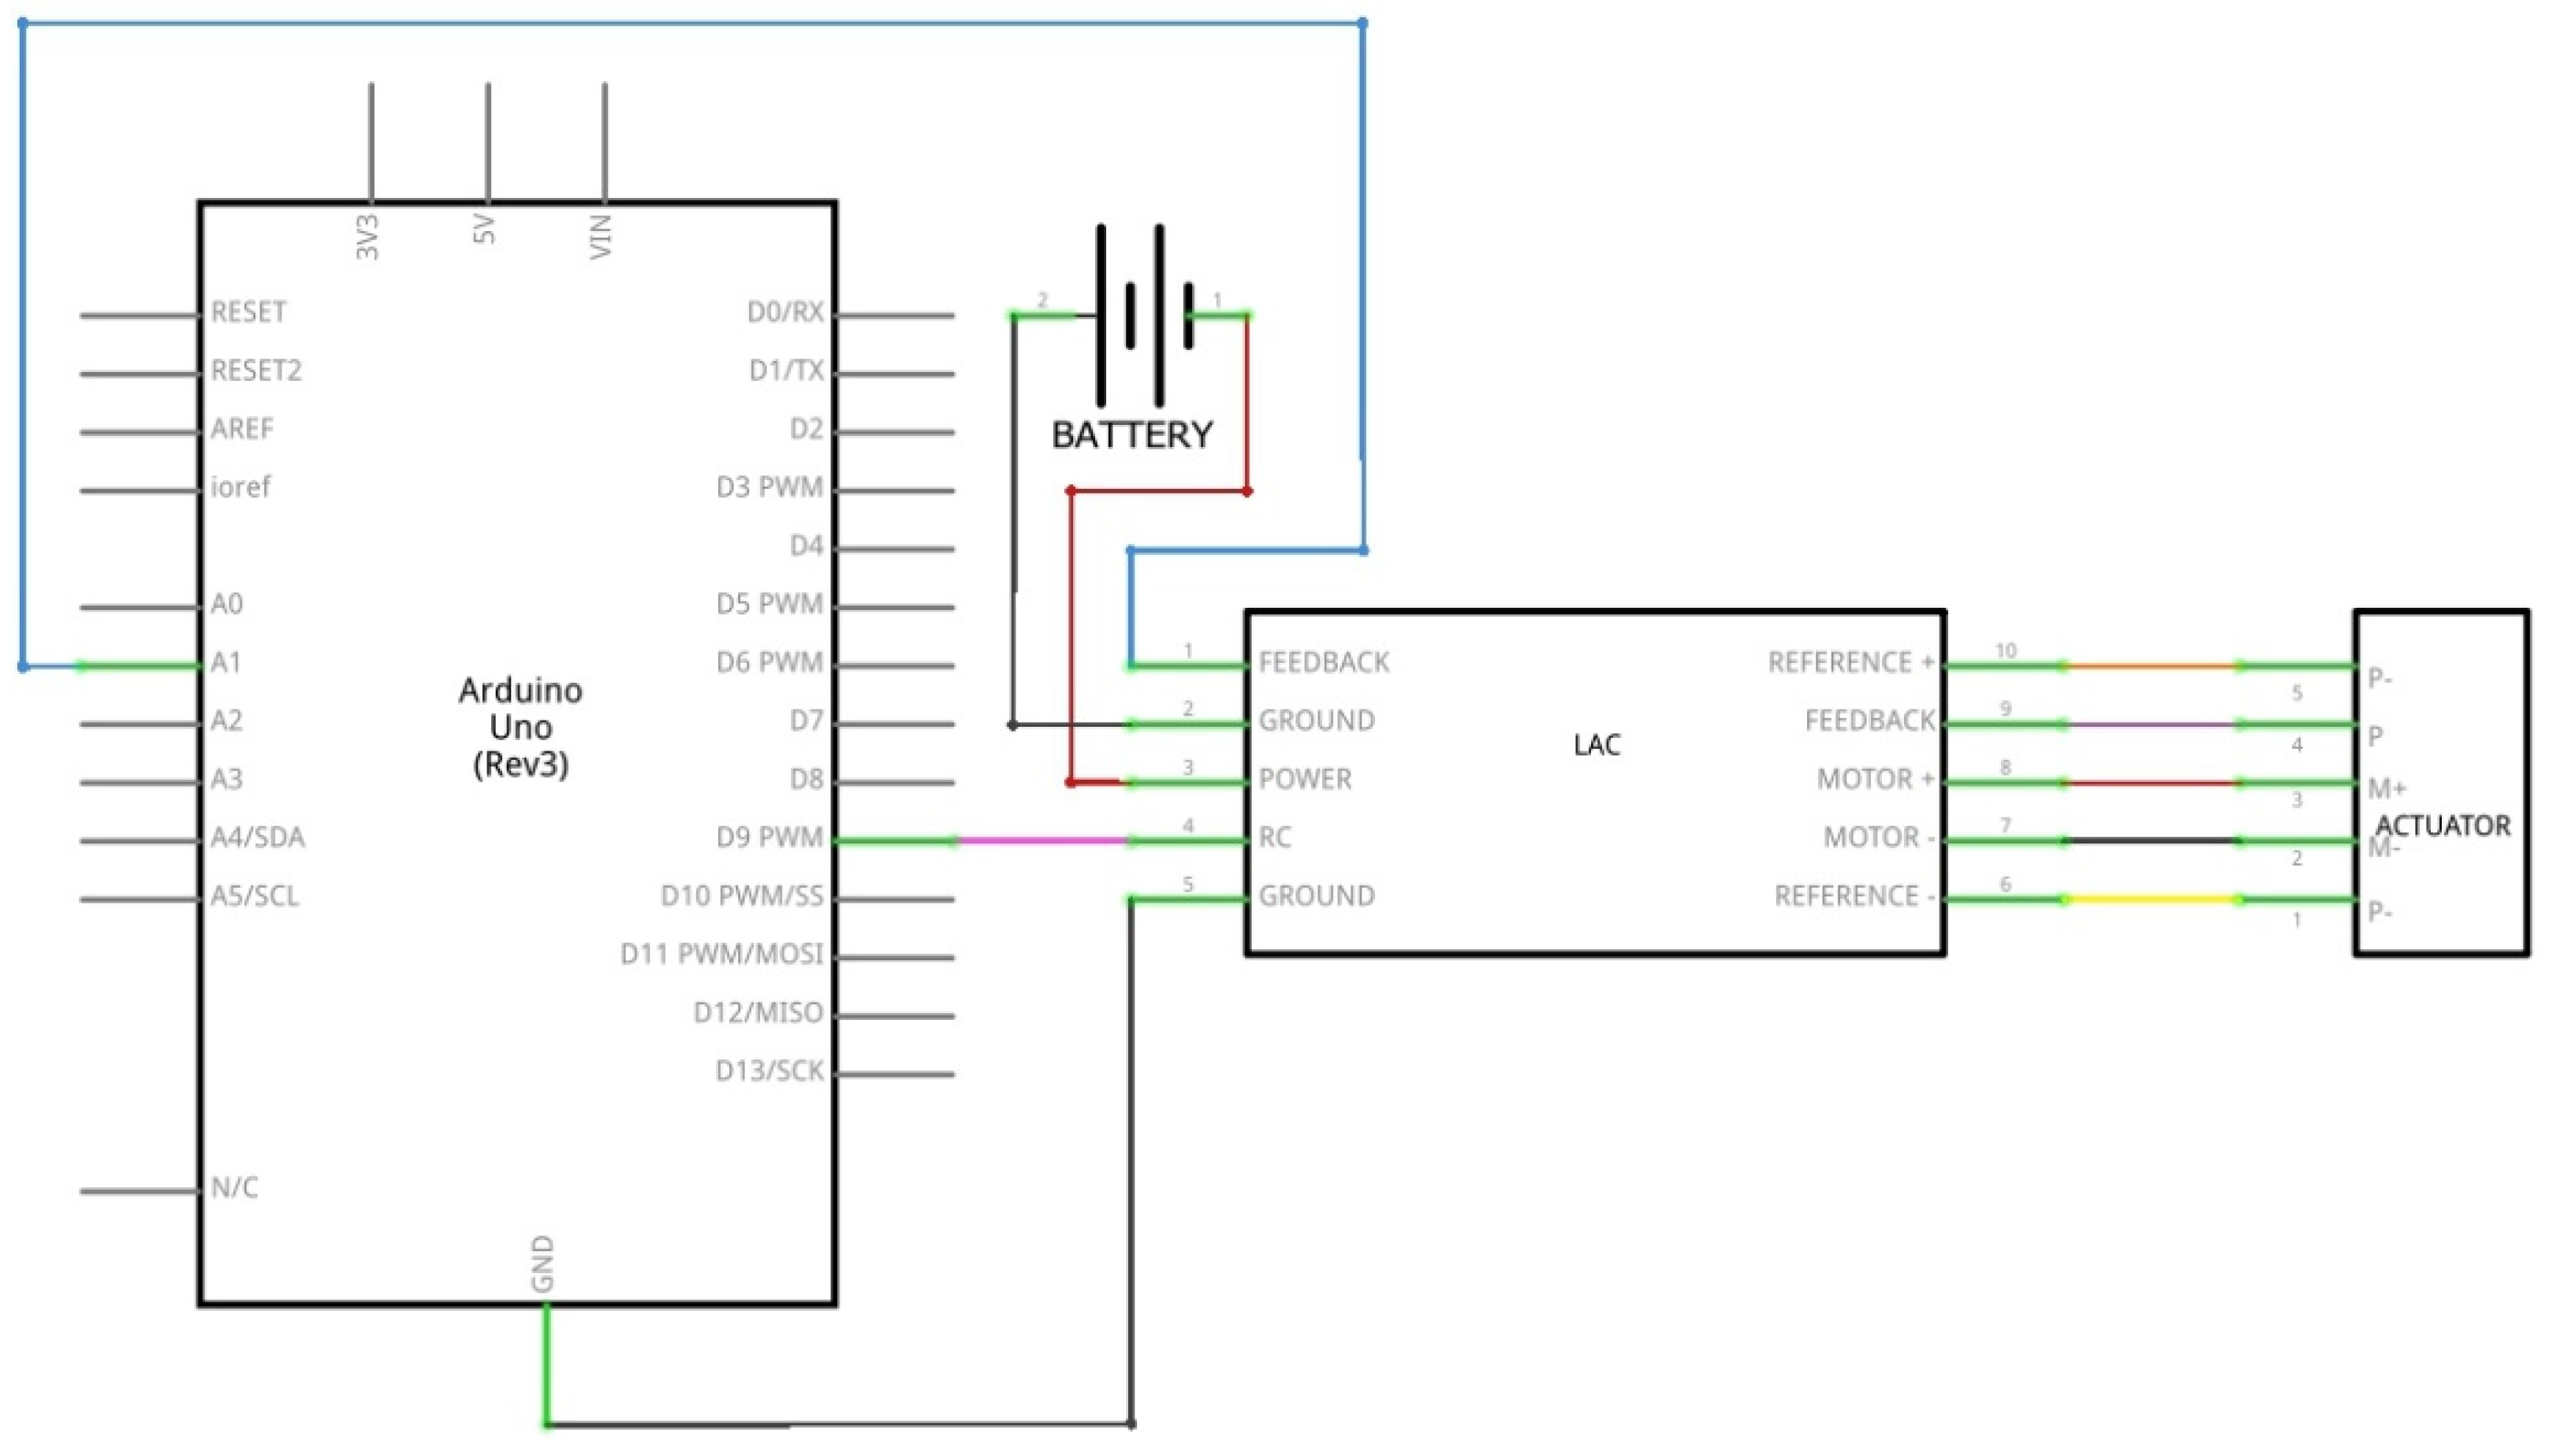
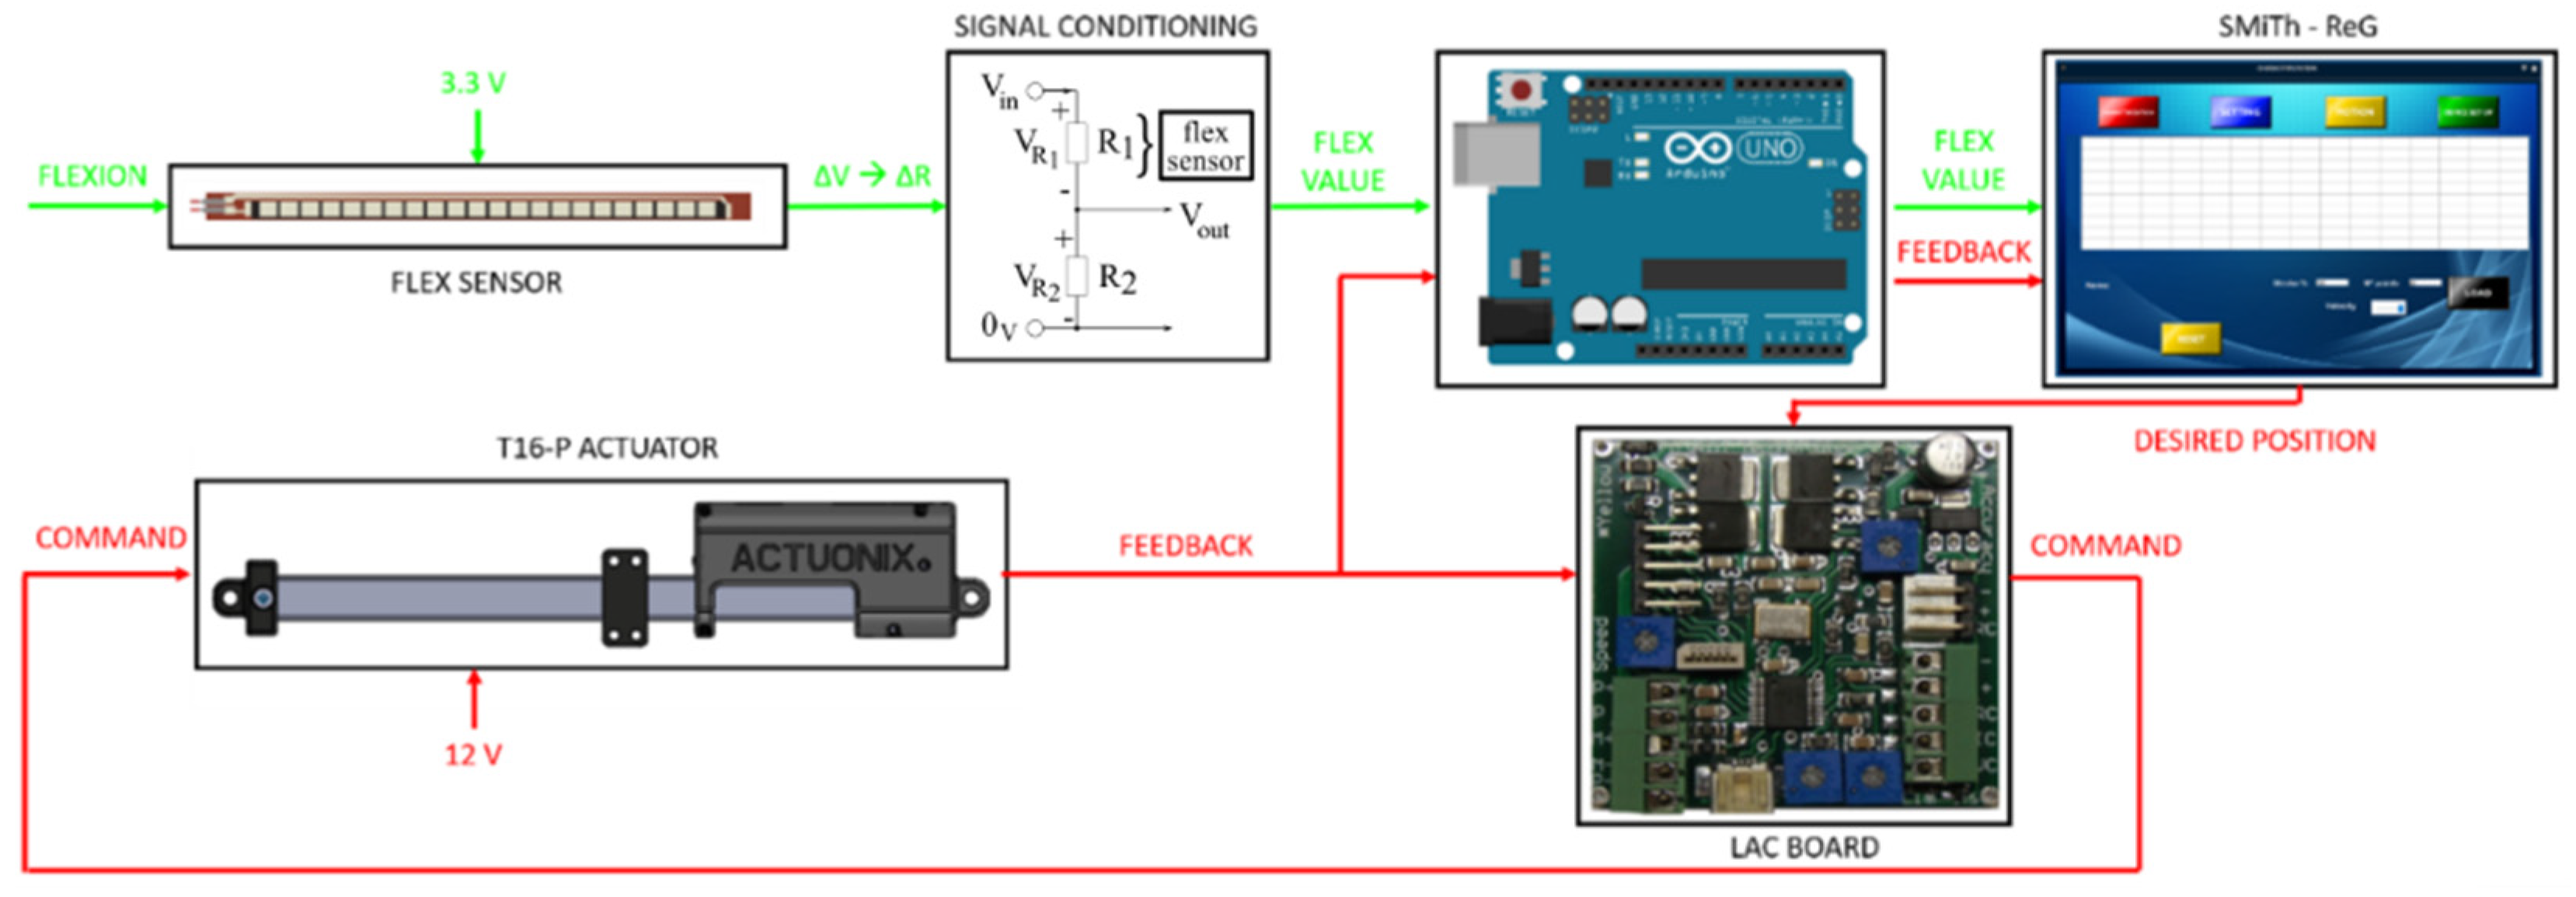
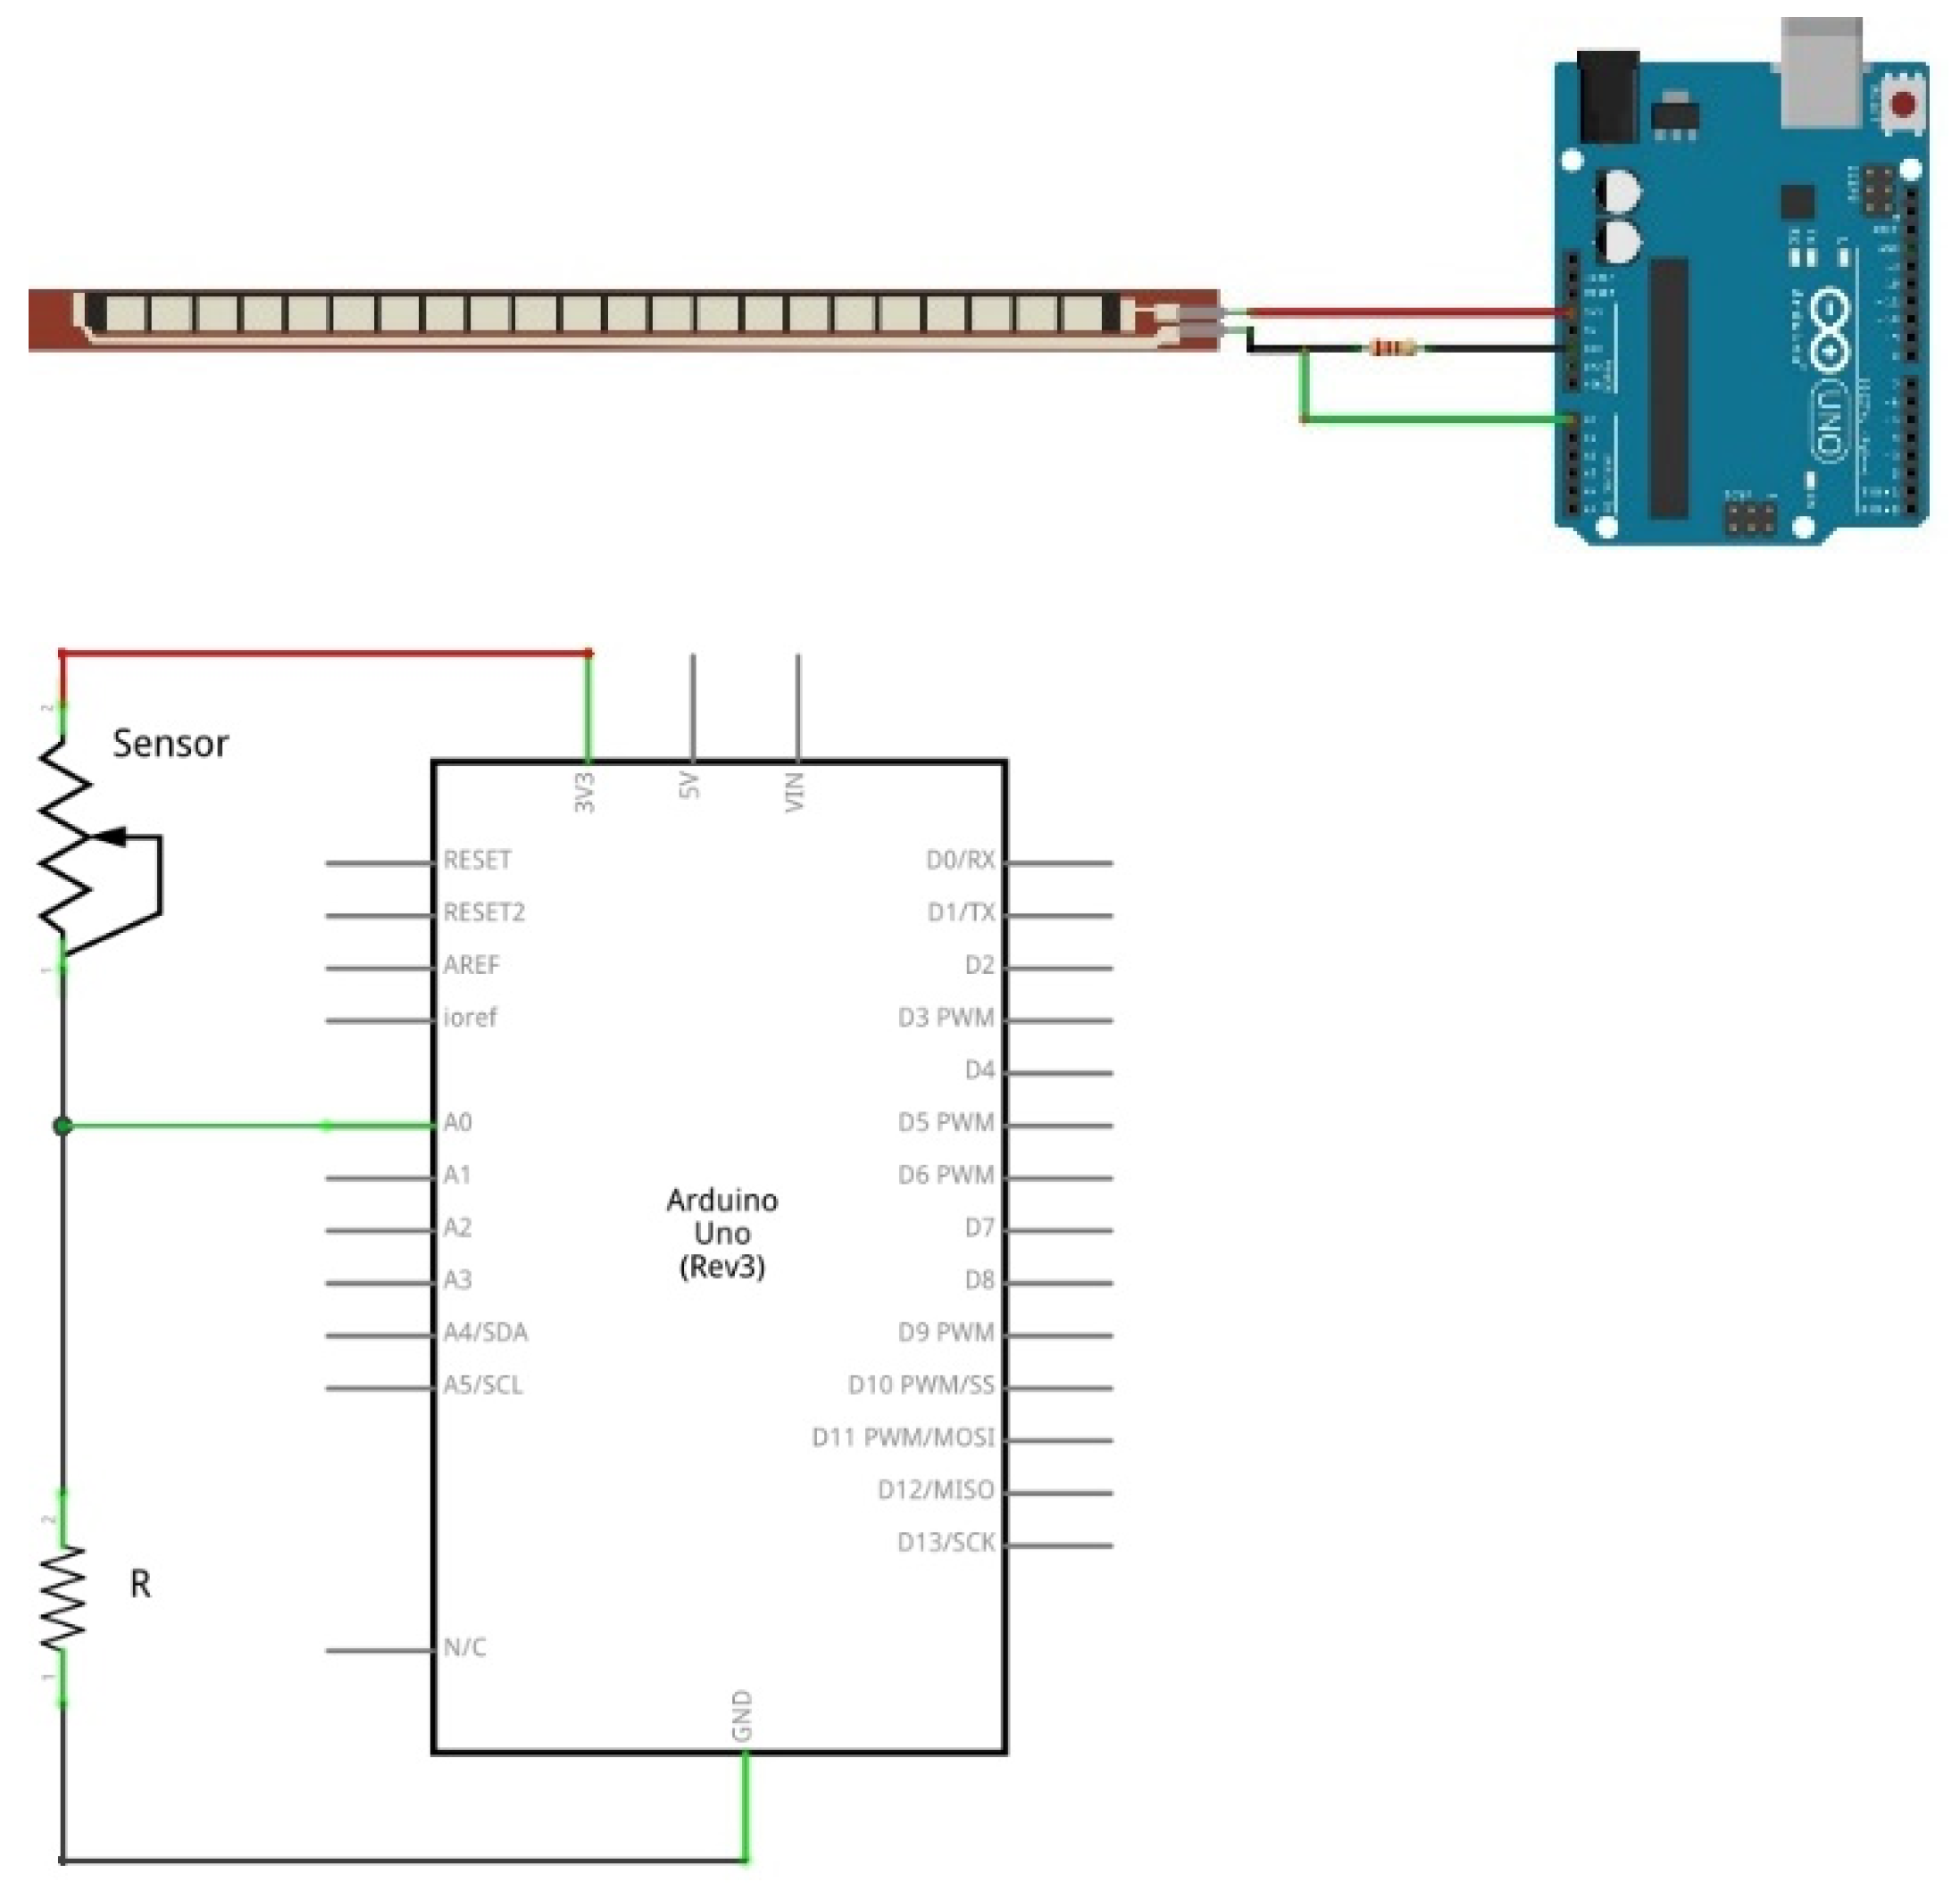
- Design and implementation of the hardware infrastructure for the acquisition of measurements with a low-cost and widely used device of the Arduino family;
- Development of the software for the acquisition of the measurements and the subsequent storage and reprocessing in an advanced environment with an easy-to-use graphic interface to make the characterization operations of a significant number of sensors as efficient as possible.
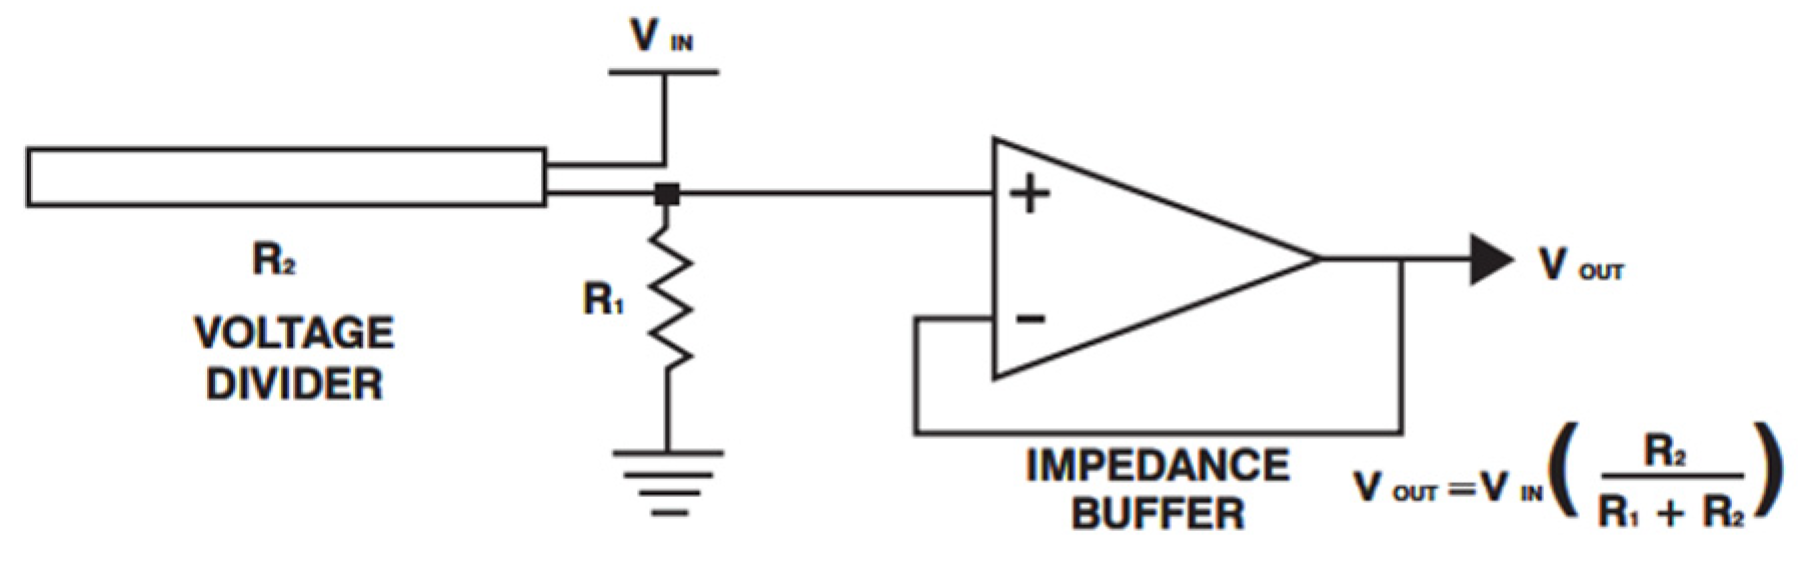
2.2. Hardware Structure of the Test Bench
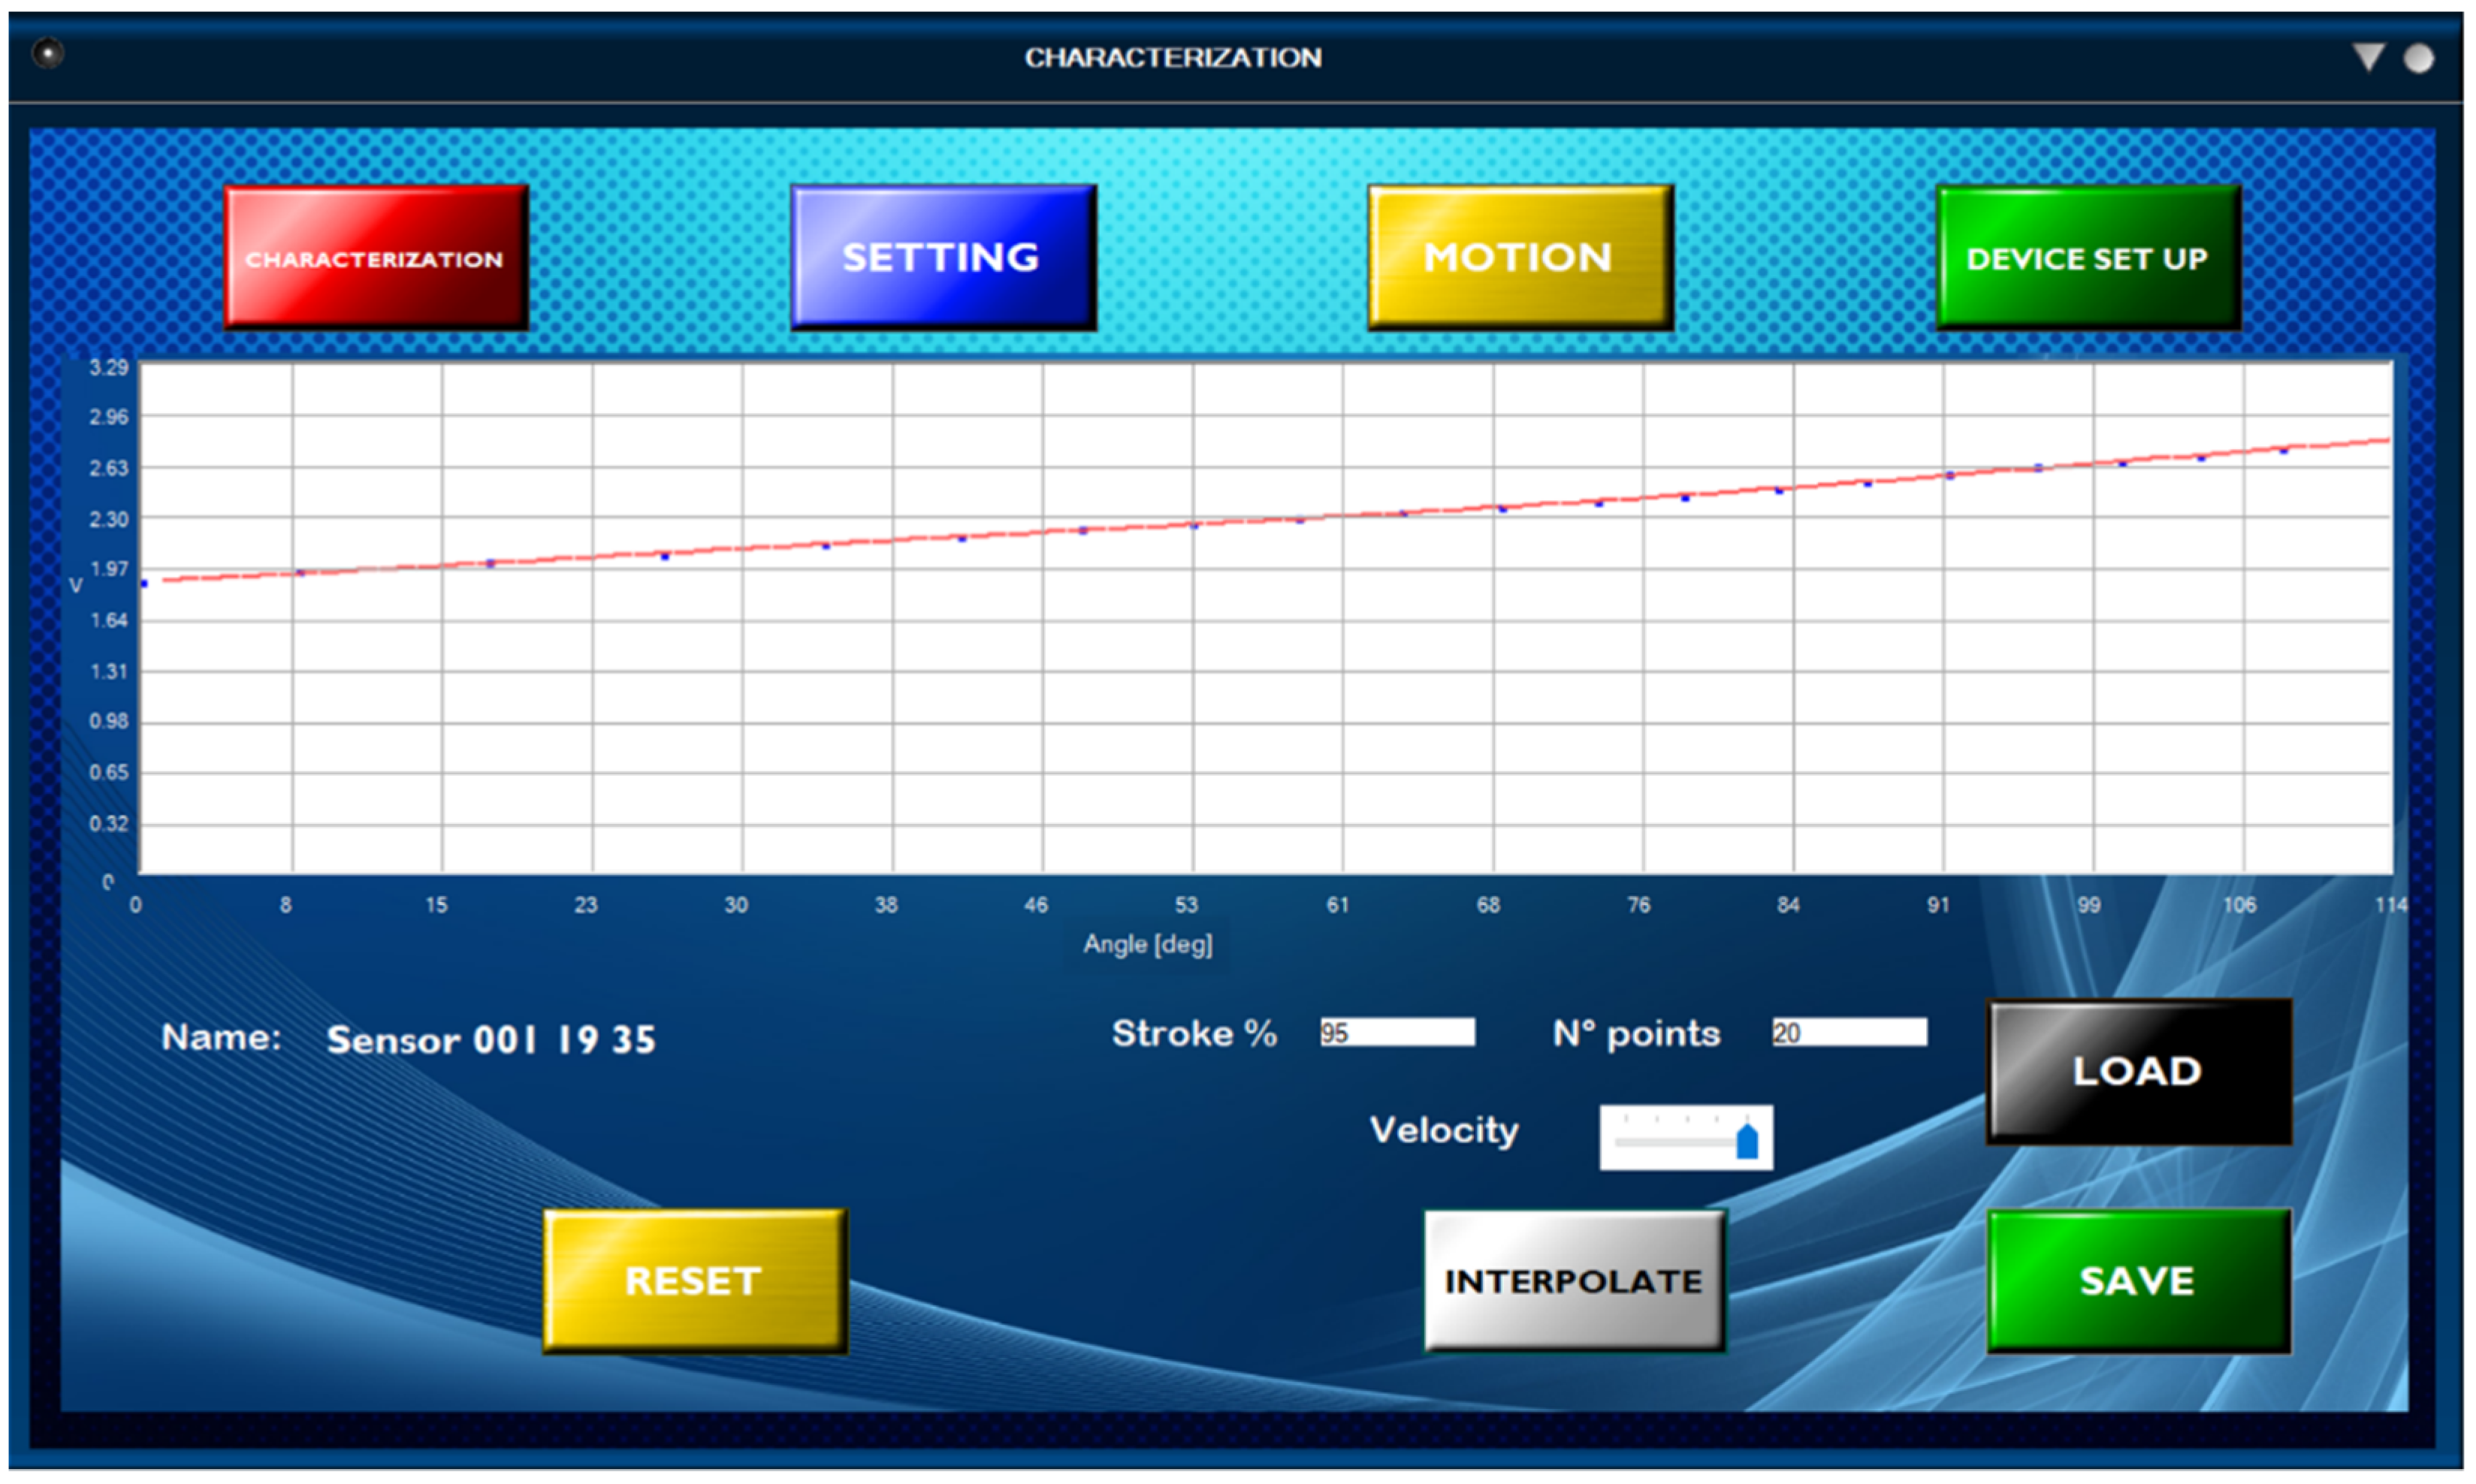
2.3. Software for the Test Bench Functioning and for Data Collection, Storage and Processing
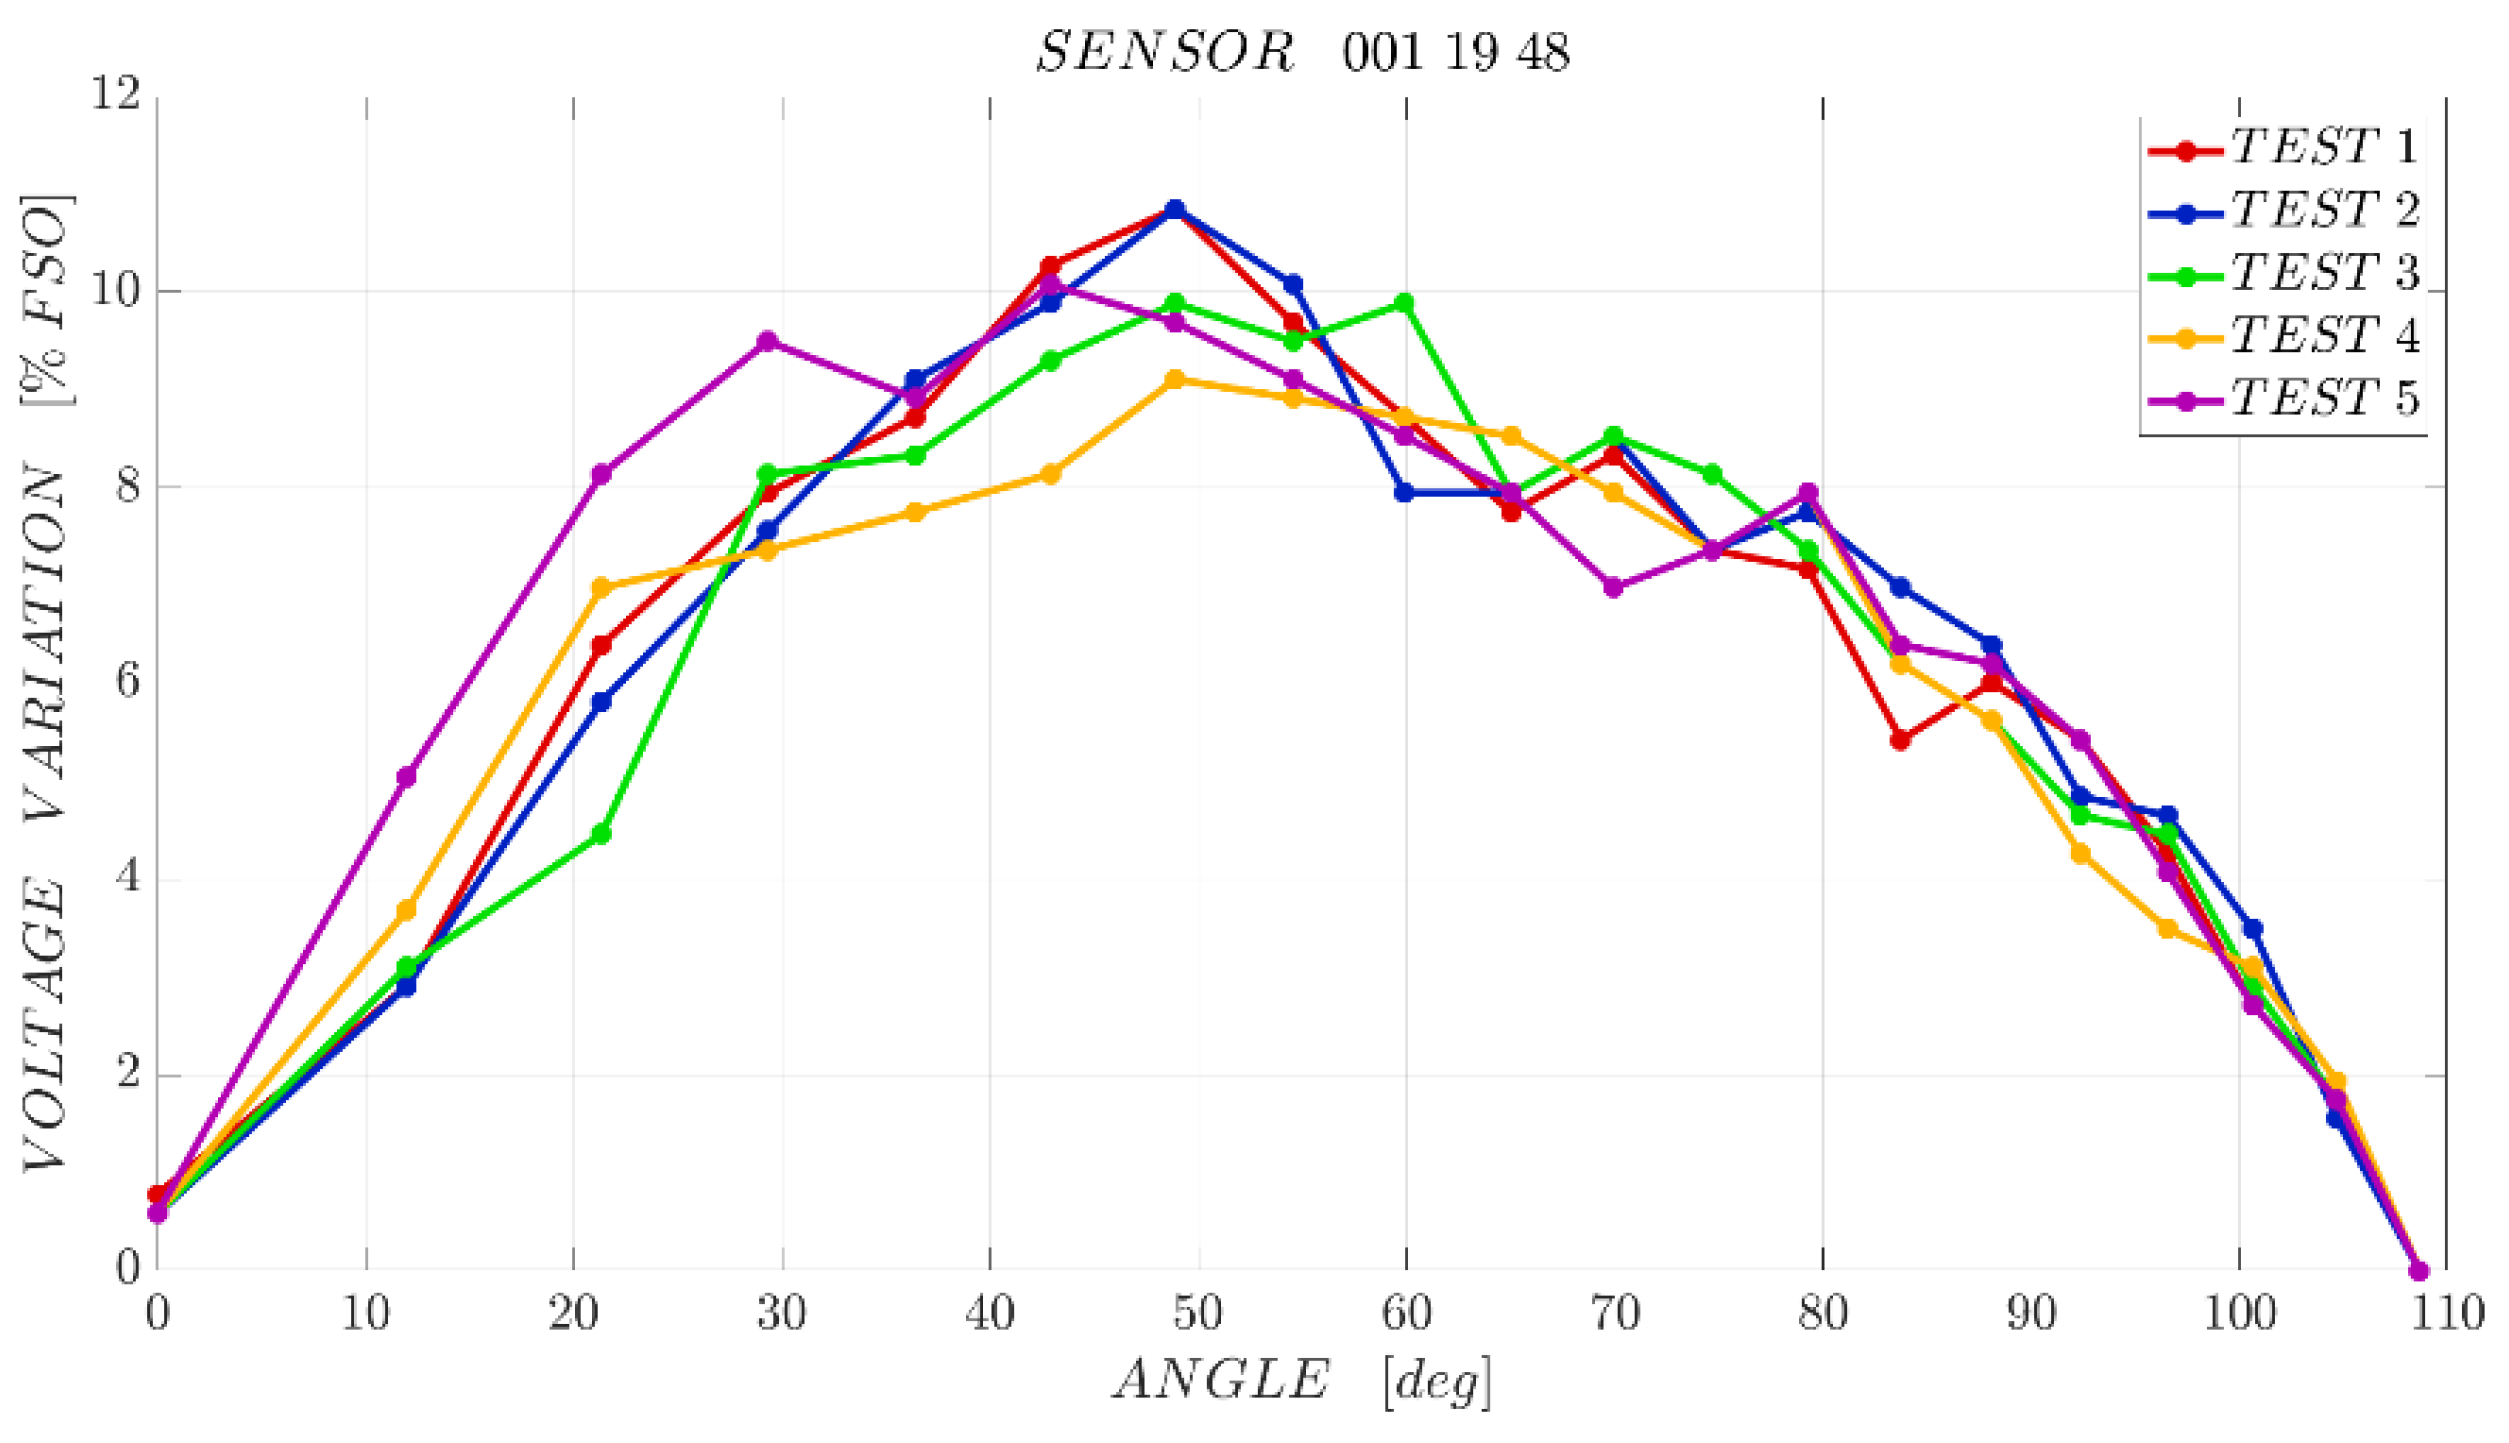
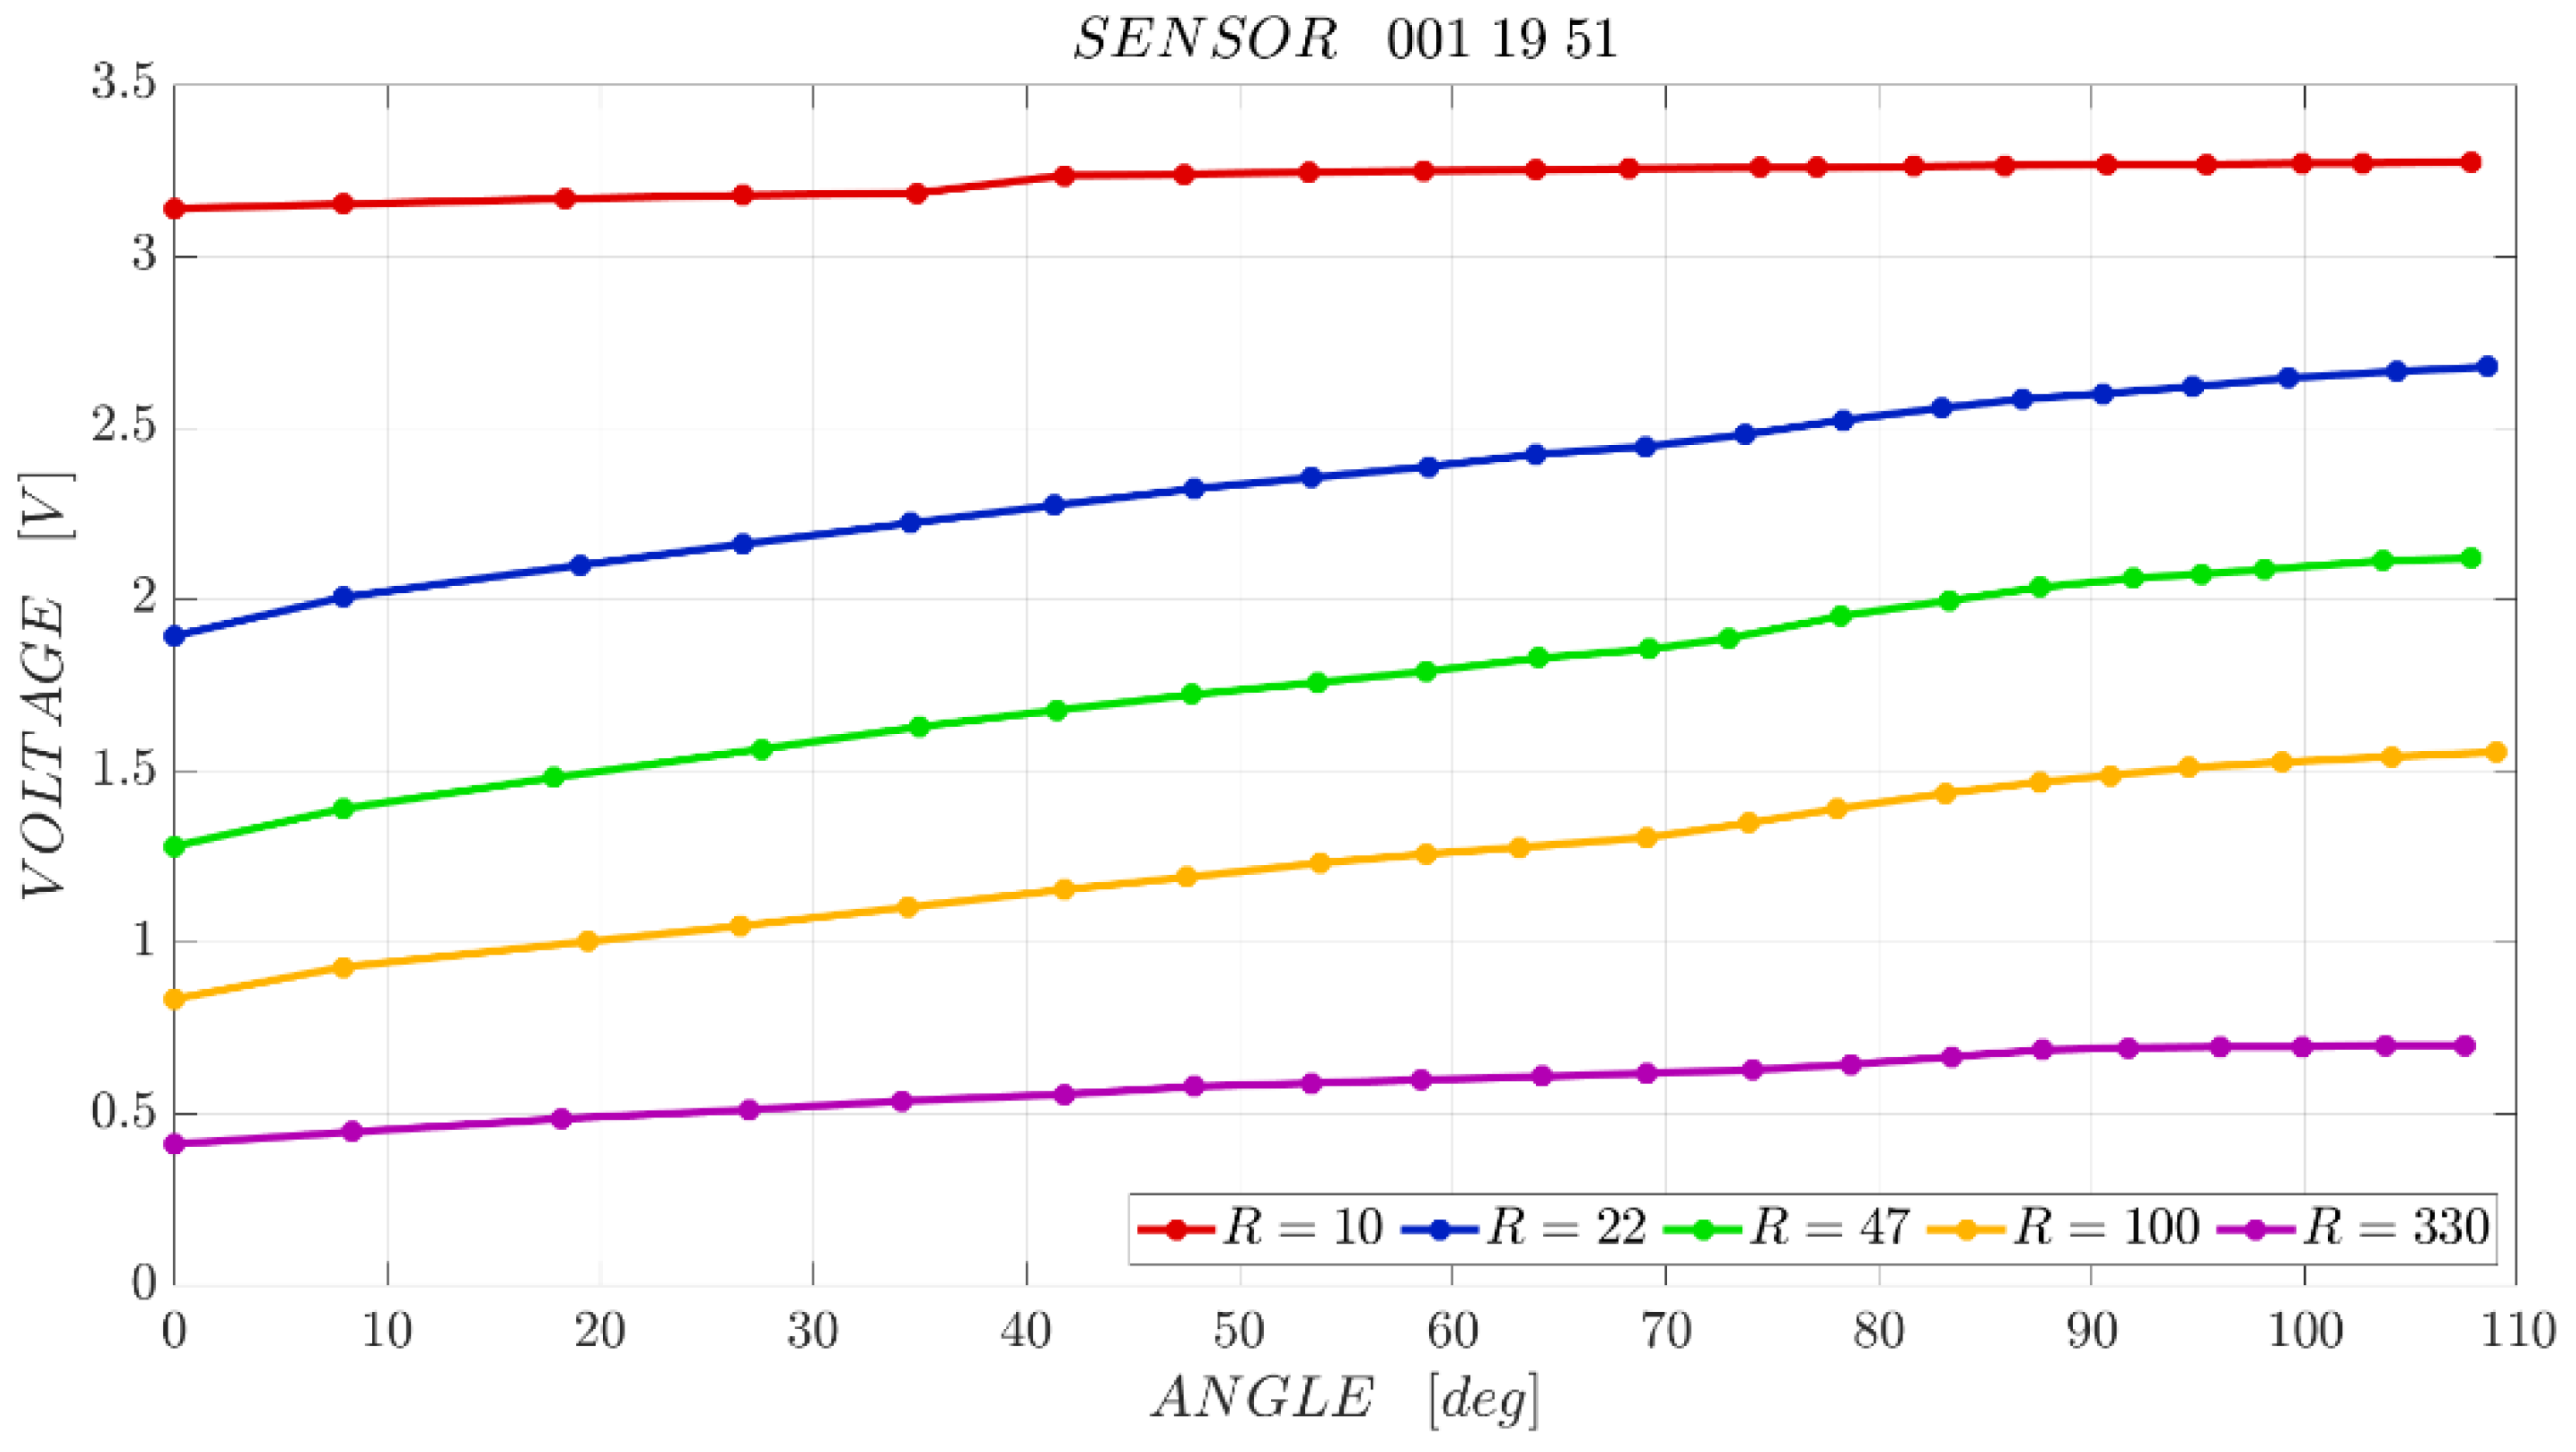
3. Results
4. Discussion
4.1. Literature Overview on Flex Sensors’ Characterization
4.2. Results Analysis
5. Conclusions
Author Contributions
Funding
Institutional Review Board Statement
Informed Consent Statement
Data Availability Statement
Conflicts of Interest
References
- Saggio, G.; Riillo, F.; Sbernini, L.; Quitadamo, L.R. Resistive flex sensors: A survey. Smart Mater. Struct. 2015, 25, 013001. [Google Scholar] [CrossRef]
- Grisbrook, T.; Imms, C.; Walmsley, C.P.; Campbell, A.; Elliott, C.; Williams, S.A. Measurement of Upper Limb Range of Motion Using Wearable Sensors: A Systematic Review. Sport. Med. Open 2018, 4, 53. [Google Scholar]
- Saggio, G.; Quitadamo, L.R.; Albero, L. Development and evaluation of a novel low-cost sensor-based knee flexion angle measurement system. Knee 2014, 21, 896–901. [Google Scholar] [CrossRef] [PubMed]
- Liou, J.-C.; Fang, K.-W. Flex Sensor for Stroke Patients Identify the Specific Behavior with Different Bending Situations. In Proceedings of the 2017 6th International Symposium on Next Generation Electronics, ISNE 2017, Keelung, Taiwan, 23–25 May 2017. [Google Scholar]
- Cafolla, D.; Chen, I.M.; Ceccarelli, M. An experimental characterization of human torso motion. Front. Mech. Eng. 2015, 10, 311–325. [Google Scholar] [CrossRef]
- Garda, Y.R.; Caesarendra, W.; Tjahjowidodo, T.; Turnip, A.; Wahyudati, S.; Nurhasanah, L.; Sutopo, D. Flex Sensor Based Biofeedback Monitoring for Post-Stroke Fingers Myopathy Patients. J. Phys. Conf. Ser. 2018, 1007, 012069. [Google Scholar] [CrossRef]
- Habibi, A.; Nugroho, S.M.S.; Purnama, I.K.E.; Prawitri, Y.D.; Subadi, I. Health Level Classification of Motor Stroke Patients Based on Flex Sensor Using Fuzzy Logic Method. In Proceedings of the 2019 International Conference on Computer Engineering, Network, and Intelligent Multimedia, CENIM 2019, Surabaya, Indonesia, 19–20 November 2019. [Google Scholar]
- Lakshmi, K.J.; Muneshwar, A.; Ratnam, A.V.; Kodali, P. Patient Assistance Using Flex Sensor. In Proceedings of the 2020 IEEE International Conference on Communication and Signal Processing, ICCSP 2020, Chennai, India, 28–30 July 2020; pp. 181–185. [Google Scholar]
- Guo, Y.-R.; Zhang, X.-C.; An, N. Monitoring Neck Posture with Flex Sensors. In Proceedings of the 9th International Conference on Information Science and Technology, ICIST 2019, Hulunbuir, China, 2–5 August 2019; pp. 459–463. [Google Scholar]
- Abro, Z.A.; Yi-Fan, Z.; Nan-Liang, C.; Cheng-Yu, H.; Lakho, R.A.; Halepoto, H. A novel flex sensor-based flexible smart garment for monitoring body postures. J. Ind. Text. 2019, 49, 262–274. [Google Scholar] [CrossRef]
- Oess, N.P.; Wanek, J.; Curt, A. Design and evaluation of a low-cost instrumented glove for hand function assessment. J. Neuroeng. Rehabil. 2012, 9, 2. [Google Scholar] [CrossRef] [PubMed] [Green Version]
- Roy, K.; Idiwal, D.P.; Agrawal, A.; Hazra, B. Flex Sensor Based Wearable Gloves for Robotic Gripper Control. In Proceedings of the ACM International Conference Proceeding Series, Goa, India, 2–4 July 2015. [Google Scholar]
- Dhepekar, P.; Adhav, Y.G. Wireless Robotic Hand for Remote Operations Using Flex Sensor. In Proceedings of the 2016 International Conference on Automatic Control and Dynamic Optimization Techniques (ICACDOT), Pune, India, 9–10 September 2016; pp. 114–118. [Google Scholar]
- Sandesh, R.S.; Venkatesan, N. Novel Approach to Control of Robotic Hand Using Flex Sensors. IAES Int. J. Robot. Autom. 2014, 3, 234–244. [Google Scholar] [CrossRef]
- Suri, A.; Singh, S.K.; Sharma, R.; Sharma, P.; Garg, N.; Upadhyaya, R. Development of Sign Language using Flex Sensors. In Proceedings of the International Conference on Smart Electronics and Communication, ICOSEC 2020, Trichy, India, 10–12 September 2020; pp. 102–106. [Google Scholar]
- Sbernini, L.; Pallotti, A.; Saggio, G. Evaluation of a Stretch Sensor for Its Inedited Application in Tracking Hand Finger Movements. In Proceedings of the 2016 IEEE International Symposium on Medical Measurements and Applications (MeMeA), Benevento, Italy, 15–18 May 2016. [Google Scholar]
- Manoharan, S.; Ragul, R.; Ramanathan, S.K.S.; Vijay, M.; Palanivel, R. Gesture control of home appliances using flex sensor. Ann. Rom. Soc. Cell Biol. 2021, 25, 4442–4448. [Google Scholar]
- Saggio, G.; Lagati, A.; Oreng, G. Wireless Sensory Glove System developed for advanced Human Computer Interface. Int. J. Inf. Sci. 2012, 2, 54–59. [Google Scholar] [CrossRef] [Green Version]
- Thanakodi, S.; Azhar, S.M.H.; Miskon, A. Prosthetic hand controlled by wireless flex sensor on EOD robot. IFMBE Proc. 2016, 56, 163–167. [Google Scholar] [CrossRef]
- Jabin, J.; Adnan, M.E.; Mahmud, S.S.; Chowdhury, A.M.; Islam, M.R. Low cost 3D printed prosthetic for congenital amputation using flex sensor. In Proceedings of the 2019 5th International Conference on Advances in Electrical Engineering, ICAEE 2019, Dhaka, Bangladesh, 26–28 September 2019; pp. 821–825. [Google Scholar]
- Resta, P.; Presti, D.L.; Schena, E.; Massaroni, C.; Formica, D.; Kim, T.; Shin, D. A wearable system for knee flexion/extension monitoring: Design and assessment. In Proceedings of the 2020 IEEE International Workshop on Metrology for Industry 4.0 & IoT, Roma, Italy, 3–5 June 2020; pp. 273–277. [Google Scholar]
- Cochrane, C.; Koncar, V.; Lewandowski, M.; Dufour, C. Design and Development of a Flexible Strain Sensor. Sensors 2007, 7, 473–492. [Google Scholar] [CrossRef] [Green Version]
- Linder, A.; Kircher, A.; Vadeby, A. Intelligent Transport Systems (ITS) in Passenger Cars and Methods for Assessment of Traffic Safety Impact; Statens Väg- och Transportforskningsinstitut: Linköping, Sweden, 2007. [Google Scholar]
- Salman, F.; Cui, Y.; Imran, Z.; Liu, F.; Wang, L.; Wu, W. A Wireless-controlled 3D printed Robotic Hand Motion System with Flex Force Sensors. Sens. Actuators A Phys. 2020, 309, 112004. [Google Scholar] [CrossRef]
- Trung, N.T.; Son, T.H. Using flex sensor to get the angles from master hand to control slave hand. In Proceedings of the ICMSCE 2018: 2018 2nd International Conference on Mechatronics Systems and Control Engineering, Amsterdam, The Netherlands, 21–23 February 2018; pp. 1–4. [Google Scholar]
- Rusydi, M.I.; Opera, M.I.; Rusydi, A.; Sasaki, M. Combination of flex sensor and electromyography for hybrid control robot. Telkomnika Telecommun. Comput. Electron. Control 2018, 16, 2275–2286. [Google Scholar] [CrossRef] [Green Version]
- Elgeneidy, K.; Lohse, N.; Jackson, M. Bending angle prediction and control of soft pneumatic actuators with embedded flex sensors—A data-driven approach. Mechatronics 2018, 50, 234–247. [Google Scholar] [CrossRef] [Green Version]
- Gerboni, G.; Diodato, A.; Ciuti, G.; Cianchetti, M.; Menciassi, A. Feedback Control of Soft Robot Actuators via Commercial Flex Bend Sensors. IEEE/ASME Trans. Mechatron. 2017, 22, 1881–1888. [Google Scholar] [CrossRef]
- Gul, J.Z.; Kim, K.H.; Lim, J.H.; Doh, Y.H.; Choi, K.H. FSI modeling of frog inspired soft robot embedded with ALD encapsulated flex sensor for underwater synchronous swim. In Proceedings of the 2017 IEEE 5th International Symposium on Robotics and Intelligent Sensors (IRIS), Ottawa, ON, Canada, 5–7 October 2017; pp. 255–259. [Google Scholar]
- Mondal, B.; Ali, S.F.; Mandal, N. An Approach to Design a Wireless Air Flow Transmitter Using Flex Sensor. IEEE Sens. J. 2021, 21, 10498–10505. [Google Scholar] [CrossRef]
- Syed, A.; Agasbal, Z.T.H.; Melligeri, T.; Gudur, B. Flex Sensor Based Robotic Arm Controller Using Micro Controller. J. Softw. Eng. Appl. 2012, 5, 364–366. [Google Scholar] [CrossRef] [Green Version]
- Yang, Z.; Pang, Y.; Han, X.L.; Yang, Y.; Yang, Y.; Ling, J.; Jian, M.; Zhang, Y.; Ren, T.L. Graphene Textile Strain Sensor with Negative Resistance Variation for Human Motion Detection. ACS Nano 2018, 12, 9134–9141. [Google Scholar] [CrossRef]
- Wang, J.; Lin, M.F.; Park, S.; Lee, P.S. Deformable conductors for human–machine interface. Mater. Today 2018, 21, 508–526. [Google Scholar] [CrossRef]
- Merilampi, S.; Laine-Ma, T.; Ruuskanen, P. The characterization of electrically conductive silver ink patterns on flexible substrates. Microelectron. Reliab. 2009, 49, 782–790. [Google Scholar] [CrossRef]
- Biddiss, E.; Chau, T. Electroactive polymeric sensors in hand prostheses: Bending response of an ionic polymer metal composite. Med. Eng. Phys. 2006, 28, 568–578. [Google Scholar] [CrossRef] [PubMed]
- Zhang, W.; Liu, Q.; Chen, P. Flexible strain sensor based on carbon black/silver nanoparticles composite for humanmotion detection. Materials 2018, 11, 1836. [Google Scholar] [CrossRef] [PubMed] [Green Version]
- Serpelloni, M.; Tiboni, M.; Lancini, M.; Pasinetti, S.; Vertuan, A.; Gobbo, M. Preliminary Study of aA Robotic Rehabilitation System Driven by EMG for Hand Mirroring. In Proceedings of the 2016 IEEE International Symposium on Medical Measurements and Applications (MeMeA), Benevento, Italy, 15–18 May 2016. [Google Scholar]
- Tiboni, M.; Legnani, G.; Lancini, M.; Serpelloni, M.; Gobbo, M.; Fausti, D. ERRSE: Elbow robotic rehabilitation system with an EMG-based force control. Mech. Mach. Sci. 2018, 49, 892–900. [Google Scholar] [CrossRef]
- Amici, C.; Ghidoni, M.; Ceresoli, F.; Gaffurini, P.; Bissolotti, L.; Mor, M.; Fausti, D.; Antonini, M.; Ragni, F.; Tiboni, M. Preliminary Validation of a Device for the Upper and Lower Limb Robotic Rehabilitation. In Proceedings of the 2019 23rd International Conference on Mechatronics Technology (ICMT), Salerno, Italy, 23–26 October 2019; pp. 1–6. [Google Scholar]
- Amici, C.; Ragni, F.; Ghidoni, M.; Fausti, D.; Bissolotti, L.; Tiboni, M. Multi-sensor validation approach of an end-effector-based robot for the rehabilitation of the upper and lower limb. Electronics 2020, 9, 1751. [Google Scholar] [CrossRef]
- Negrini, S.; Piovanelli, B.; Amici, C.; Cappellini, V.; Bovi, G.; Ferrarin, M.; Zaina, F.; Borboni, A. Trunk motion analysis: A systematic review from a clinical and methodological perspective. Eur. J. Phys. Rehabil. Med. 2016, 52, 583–592. [Google Scholar] [PubMed]
- Saggio, G.; Orengo, G. Flex sensor characterization against shape and curvature changes. Sens. Actuators A Phys. 2018, 273, 221–231. [Google Scholar] [CrossRef]
- Orengo, G.; Sbernini, L.; di Lorenzo, N.; Lagati, A.; Saggio, G. Curvature Characterization of Flex Sensors for Human Posture Recognition. Univers. J. Biomed. Eng. 2013, 1, 10–15. [Google Scholar] [CrossRef]
- Sanca, A.S.; Rocha, J.C.; Eugenio, K.J.S.; Nascimento, L.B.P.; Alsina, P.J. Characterization of Resistive Flex Sensor Applied to Joint Angular Displacement Estimation. In Proceedings of the 15th Latin American Robotics Symposium, 6th Brazilian Robotics Symposium and 9th Workshop on Robotics in Education, LARS/SBR/WRE 2018, João Pessoa, Brazil, 6–10 November 2018; pp. 39–44. [Google Scholar]
- Ash HE, U.A. Proximal Interphalangeal Joint Dimensions for the Design of a Surface Replacement Prosthesis. Proc. Inst. Mech. Eng. Part H J. Eng. Med. 1996, 210, 95–108. [Google Scholar] [CrossRef] [PubMed]
- Tiboni, M.; Aggogeri, F.; Pellegrini, N.; Perani, C.A. Smart modular architecture for supervision and monitoring of a 4.0 production plant. Int. J. Autom. Technol. 2019, 13, 310–318. [Google Scholar] [CrossRef]
- Tiboni, M.; Incerti, G.; Remino, C.; Lancini, M. Comparison of signal processing techniques for condition monitoring based on artificial neural networks. Appl. Cond. Monit. 2019, 15, 179–188. [Google Scholar] [CrossRef]
- Tiboni, M.; Remino, C. Condition Monitoring of a Mechanical Indexing System with Artificial Neural Networks. In Proceedings of the First World Congress on Condition Monitoring 2017 exceeds expectations, London, UK, 13–16 June 2017. [Google Scholar]
- Oess, N.P.; Wanek, J.; van Hedel, H.J. Enhancement of Bend Sensor Properties as Applied in A Glove for Use in Neurorehabilitation Settings. In Proceedings of the 2010 Annual International Conference of the IEEE Engineering in Medicine and Biology, Buenos Aires, Argentina, 31 August–4 September 2010; pp. 5903–5906. [Google Scholar]
- Yao, C.; Hong, C.; Su, D.; Zhang, Y.; Yin, Z. Design and verification of a wireless sensing system for monitoring large-range ground movement. Sens. Actuators A Phys. 2020, 303, 111745. [Google Scholar] [CrossRef]
- Saggio, G. Mechanical model of flex sensors used to sense finger movements. Sens. Actuators A Phys. 2012, 185, 53–58. [Google Scholar] [CrossRef]


| R [kΩ] | Output Range [V] |
|---|---|
| 10 | 0.14 |
| 22 | 0.78 |
| 47 | 0.84 |
| 100 | 0.72 |
| 330 | 0.29 |
| R [kΩ] | Angular Coefficient |
|---|---|
| 22 | 0.0070 |
| 47 | 0.0077 |
| 100 | 0.0066 |
| Sensor | Hysteresis [% FSO] | Repeatability [% FSO] Forward Path | Repeatability [% FSO] Backward Path | Linearity [% FSO] |
|---|---|---|---|---|
| 001 19 22 | 12.8 | 96.3 | 97.1 | 92.7 |
| 001 19 28 | 11.8 | 96.1 | 95.7 | 93.4 |
| 001 19 35 | 8.5 | 95.3 | 96.7 | 94.9 |
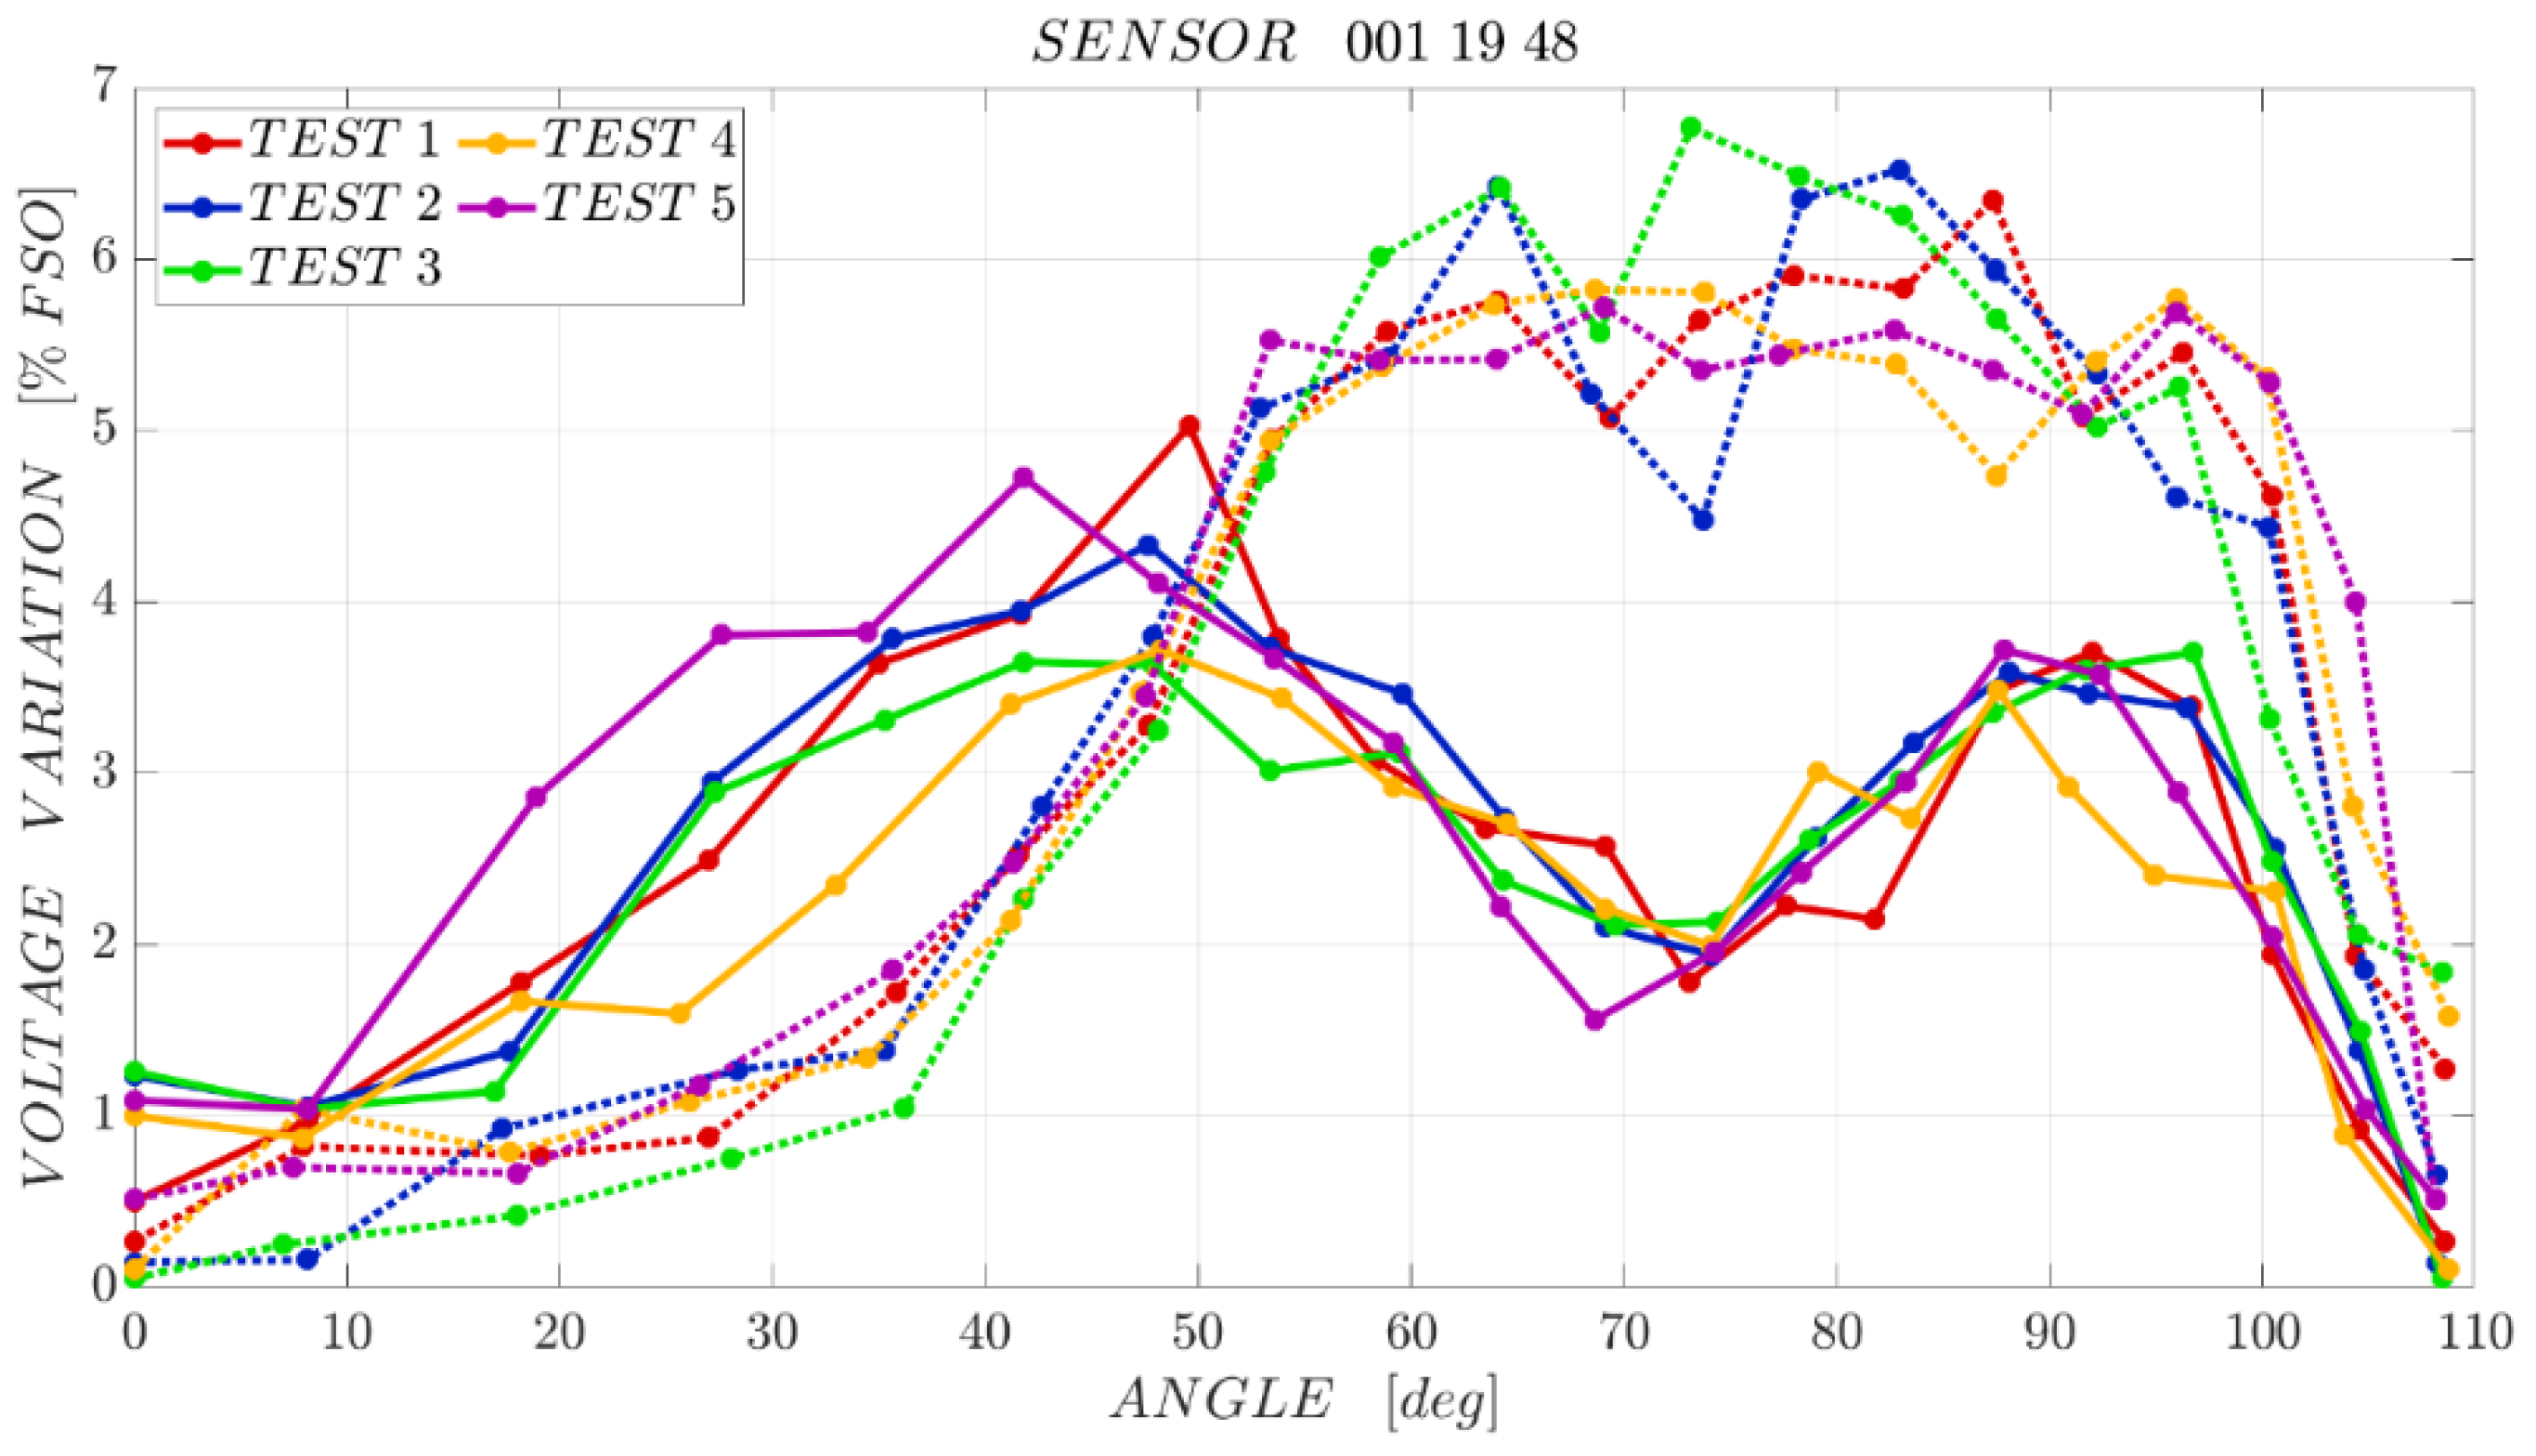
| 001 19 48 | 10.9 | 97.5 | 97.5 | 93.2 |
| 001 19 51 | 12.2 | 92.8 | 92 | 92.2 |
| Sensor | Path | Position | ||||||||||||||||||||
|---|---|---|---|---|---|---|---|---|---|---|---|---|---|---|---|---|---|---|---|---|---|---|
| 1 | 2 | 3 | 4 | 5 | 6 | 7 | 8 | 9 | 10 | 11 | 12 | 13 | 14 | 15 | 16 | 17 | 18 | 19 | 20 | |||
| 001 19 22 | Forw. | mean | 0 | 7.83 | 17.0 | 25.8 | 33.5 | 41.1 | 47.9 | 53.3 | 58.6 | 63.3 | 69.1 | 74.2 | 78.1 | 83.0 | 87.4 | 91.5 | 95.7 | 99.8 | 104.0 | 108.0 |
| std | 0 | 0.89 | 0.98 | 1.24 | 0.79 | 1.12 | 0.31 | 0.11 | 0.49 | 0.77 | 0.23 | 0.69 | 0.60 | 0.44 | 0.19 | 0.38 | 0.81 | 0.77 | 0.86 | 1.32 | ||
| Backw. | mean | 0 | 7.61 | 17.8 | 26.9 | 34.8 | 41.5 | 47.5 | 53.1 | 58.5 | 64.0 | 69.1 | 73.6 | 78.3 | 82.9 | 87.5 | 91.9 | 96.3 | 100.6 | 104.4 | 108.1 | |
| std | 0 | 0.68 | 0.40 | 0.64 | 0.40 | 0.19 | 0.53 | 0.29 | 0.14 | 0.25 | 0.31 | 0.29 | 0.11 | 0.14 | 0.20 | 0.44 | 0.31 | 0.04 | 0.04 | 1.32 | ||
| 001 19 28 | Forw. | mean | 0 | 8.02 | 18.2 | 27.0 | 34.4 | 41.5 | 48.4 | 53.9 | 59.0 | 64.0 | 69.2 | 74.1 | 78.6 | 83.5 | 87.6 | 91.8 | 96.0 | 100.6 | 104.7 | 108.75 |
| std | 0 | 0.37 | 0.54 | 0.55 | 0.79 | 0.30 | 0.68 | 0.61 | 0.47 | 0.12 | 0.34 | 0.22 | 0.35 | 0.24 | 0.21 | 0.10 | 0.23 | 0.29 | 0.23 | 0.29 | ||
| Backw. | mean | 0 | 7.93 | 18.3 | 27.0 | 34.9 | 42.2 | 47.4 | 53.1 | 58.5 | 63.9 | 69.2 | 73.8 | 78.3 | 82.9 | 87.7 | 92.1 | 96.1 | 100.3 | 104.41 | 108.6 | |
| std | 0 | 0.62 | 0.75 | 0.57 | 0.78 | 0.38 | 0.18 | 0.14 | 0.31 | 0.60 | 0.25 | 0.21 | 0.18 | 0.29 | 0.45 | 0.49 | 0.20 | 0.11 | 0.15 | 0.29 | ||
| 001 19 35 | Forw. | mean | 0 | 8.11 | 17.9 | 26.5 | 34.8 | 41.8 | 48.0 | 53.5 | 58.9 | 64.3 | 69.1 | 73.9 | 78.3 | 83.1 | 87.5 | 91.7 | 96.3 | 100.5 | 104.6 | 108.7 |
| std | 0 | 0.39 | 0.78 | 0.86 | 0.24 | 0.36 | 0.26 | 0.28 | 0.23 | 0.41 | 0.14 | 0.36 | 0.39 | 0.24 | 0.12 | 0.21 | 0.17 | 0.24 | 0.93 | 0.19 | ||
| Backw. | mean | 0 | 7.80 | 17.3 | 26.4 | 34.6 | 41.2 | 47.5 | 53.2 | 58.7 | 63.6 | 69.0 | 73.9 | 78.1 | 83.0 | 87.6 | 91.9 | 96.0 | 100.38 | 104.4 | 108.7 | |
| std | 0 | 0.20 | 0.16 | 0.31 | 0.33 | 0.14 | 0.35 | 0.14 | 0.09 | 0.15 | 0.30 | 0.36 | 0.20 | 0.12 | 0.07 | 0.12 | 0.09 | 0.12 | 0.11 | 0.19 | ||
| 001 19 48 | Forw. | mean | 0 | 8.11 | 17.9 | 26.9 | 34.6 | 41.6 | 48.2 | 53.5 | 59.1 | 64.1 | 69.1 | 73.9 | 78.5 | 83.0 | 87.6 | 91.7 | 96.1 | 100.4 | 104.4 | 108.4 |
| std | 0 | 0.09 | 0.72 | 0.76 | 1.05 | 0.25 | 0.75 | 0.24 | 0.48 | 0.39 | 0.33 | 0.52 | 0.61 | 0.73 | 0.28 | 0.55 | 0.76 | 0.087 | 0.38 | 0.25 | ||
| Backw. | mean | 0 | 7.71 | 18.0 | 27.2 | 35.4 | 41.7 | 47.5 | 53.6 | 58.7 | 64.0 | 68.8 | 73.5 | 77.9 | 82.9 | 87.4 | 91.9 | 96.8 | 100.3 | 104.4 | 108.4 | |
| std | 0 | 0.44 | 0.66 | 0.96 | 0.66 | 0.58 | 0.31 | 0.21 | 0.18 | 0.11 | 0.33 | 0.24 | 0.42 | 0.17 | 0.08 | 0.37 | 0.14 | 0.09 | 0.20 | 0.25 | ||
| 001 19 51 | Forw. | mean | 0 | 7.88 | 18.3 | 26.8 | 34.2 | 41.5 | 47.6 | 53.4 | 58.7 | 63.9 | 69.1 | 73.9 | 78.1 | 83.0 | 87.4 | 91.8 | 95.9 | 99.9 | 104.1 | 108.2 |
| std | 0 | 0.66 | 1.08 | 0.91 | 1.01 | 0.43 | 0.15 | 0.20 | 0.38 | 0.12 | 0.18 | 0.58 | 0.50 | 0.22 | 0.22 | 0.06 | 0.49 | 1.06 | 0.44 | 0.62 | ||
| Backw. | mean | 0 | 7.97 | 17.8 | 26.5 | 34.7 | 41.5 | 47.7 | 53.2 | 58.6 | 63.8 | 68.9 | 73.7 | 78.2 | 83.0 | 87.6 | 92.1 | 96.1 | 100.2 | 104.4 | 108.2 | |
| std | 0 | 0.61 | 0.66 | 0.36 | 0.61 | 0.10 | 0.28 | 0.14 | 0.08 | 0.15 | 0.19 | 0.20 | 0.19 | 0.04 | 0.18 | 0.55 | 0.12 | 0.32 | 0.10 | 0.62 | ||
| Sensor | Path | Position | ||||||||||||||||||||
|---|---|---|---|---|---|---|---|---|---|---|---|---|---|---|---|---|---|---|---|---|---|---|
| 1 | 2 | 3 | 4 | 5 | 6 | 7 | 8 | 9 | 10 | 11 | 12 | 13 | 14 | 15 | 16 | 17 | 18 | 19 | 20 | |||
| 001 19 22 | Forw. | mean | 1.44 | 1.59 | 1.71 | 1.80 | 1.88 | 1.95 | 2.01 | 2.04 | 2.07 | 2.10 | 2.13 | 2.17 | 2.19 | 2.23 | 2.27 | 2.29 | 2.31 | 2.33 | 2.34 | 2.35 |
| std | 0.01 | 0.01 | 0.02 | 0.02 | 0.02 | 0.02 | 0.01 | 0.01 | 0.02 | 0.02 | 0.01 | 0.02 | 0.02 | 0.02 | 0.02 | 0.01 | 0.02 | 0.01 | 0.01 | 0.01 | ||
| Backw. | mean | 1.44 | 1.51 | 1.57 | 1.64 | 1.71 | 1.77 | 1.82 | 1.86 | 1.91 | 1.95 | 1.99 | 2.03 | 2.08 | 2.12 | 2.17 | 2.21 | 2.25 | 2.28 | 2.31 | 2.35 | |
| std | 0.02 | 0.01 | 0.02 | 0.02 | 0.01 | 0.02 | 0.01 | 0.01 | 0.01 | 0.01 | 0.01 | 0.01 | 0.02 | 0.01 | 0.02 | 0.02 | 0.01 | 0.01 | 0.02 | 0.01 | ||
| 001 19 28 | Forw. | mean | 1.27 | 1.36 | 1.45 | 1.53 | 1.59 | 1.65 | 1.71 | 1.74 | 1.77 | 1.80 | 1.83 | 1.86 | 1.89 | 1.93 | 1.96 | 1.98 | 2.01 | 2.03 | 2.04 | 2.06 |
| std | 0.00 | 0.01 | 0.01 | 0.01 | 0.01 | 0.02 | 0.02 | 0.02 | 0.02 | 0.01 | 0.01 | 0.01 | 0.01 | 0.02 | 0.02 | 0.02 | 0.02 | 0.02 | 0.02 | 0.02 | ||
| Backw. | mean | 1.28 | 1.31 | 1.34 | 1.39 | 1.44 | 1.49 | 1.53 | 1.57 | 1.61 | 1.65 | 1.69 | 1.73 | 1.77 | 1.81 | 1.86 | 1.90 | 1.94 | 1.98 | 2.01 | 2.06 | |
| std | 0.02 | 0.01 | 0.02 | 0.02 | 0.01 | 0.02 | 0.01 | 0.01 | 0.01 | 0.01 | 0.01 | 0.01 | 0.02 | 0.01 | 0.02 | 0.02 | 0.01 | 0.01 | 0.02 | 0.01 | ||
| 001 19 35 | Forw. | mean | 1.33 | 1.39 | 1.45 | 1.51 | 1.56 | 1.60 | 1.64 | 1.66 | 1.69 | 1.72 | 1.73 | 1.76 | 1.79 | 1.82 | 1.85 | 1.87 | 1.90 | 1.92 | 1.93 | 1.95 |
| std | 0.01 | 0.02 | 0.01 | 0.02 | 0.02 | 0.03 | 0.02 | 0.03 | 0.03 | 0.03 | 0.03 | 0.03 | 0.03 | 0.03 | 0.03 | 0.03 | 0.03 | 0.02 | 0.02 | 0.02 | ||
| Backw. | mean | 1.33 | 1.36 | 1.38 | 1.41 | 1.44 | 1.48 | 1.51 | 1.54 | 1.57 | 1.59 | 1.62 | 1.65 | 1.67 | 1.71 | 1.75 | 1.79 | 1.83 | 1.86 | 1.90 | 1.95 | |
| std | 0.02 | 0.01 | 0.02 | 0.02 | 0.01 | 0.02 | 0.01 | 0.01 | 0.01 | 0.01 | 0.01 | 0.01 | 0.02 | 0.01 | 0.02 | 0.02 | 0.01 | 0.01 | 0.02 | 0.01 | ||
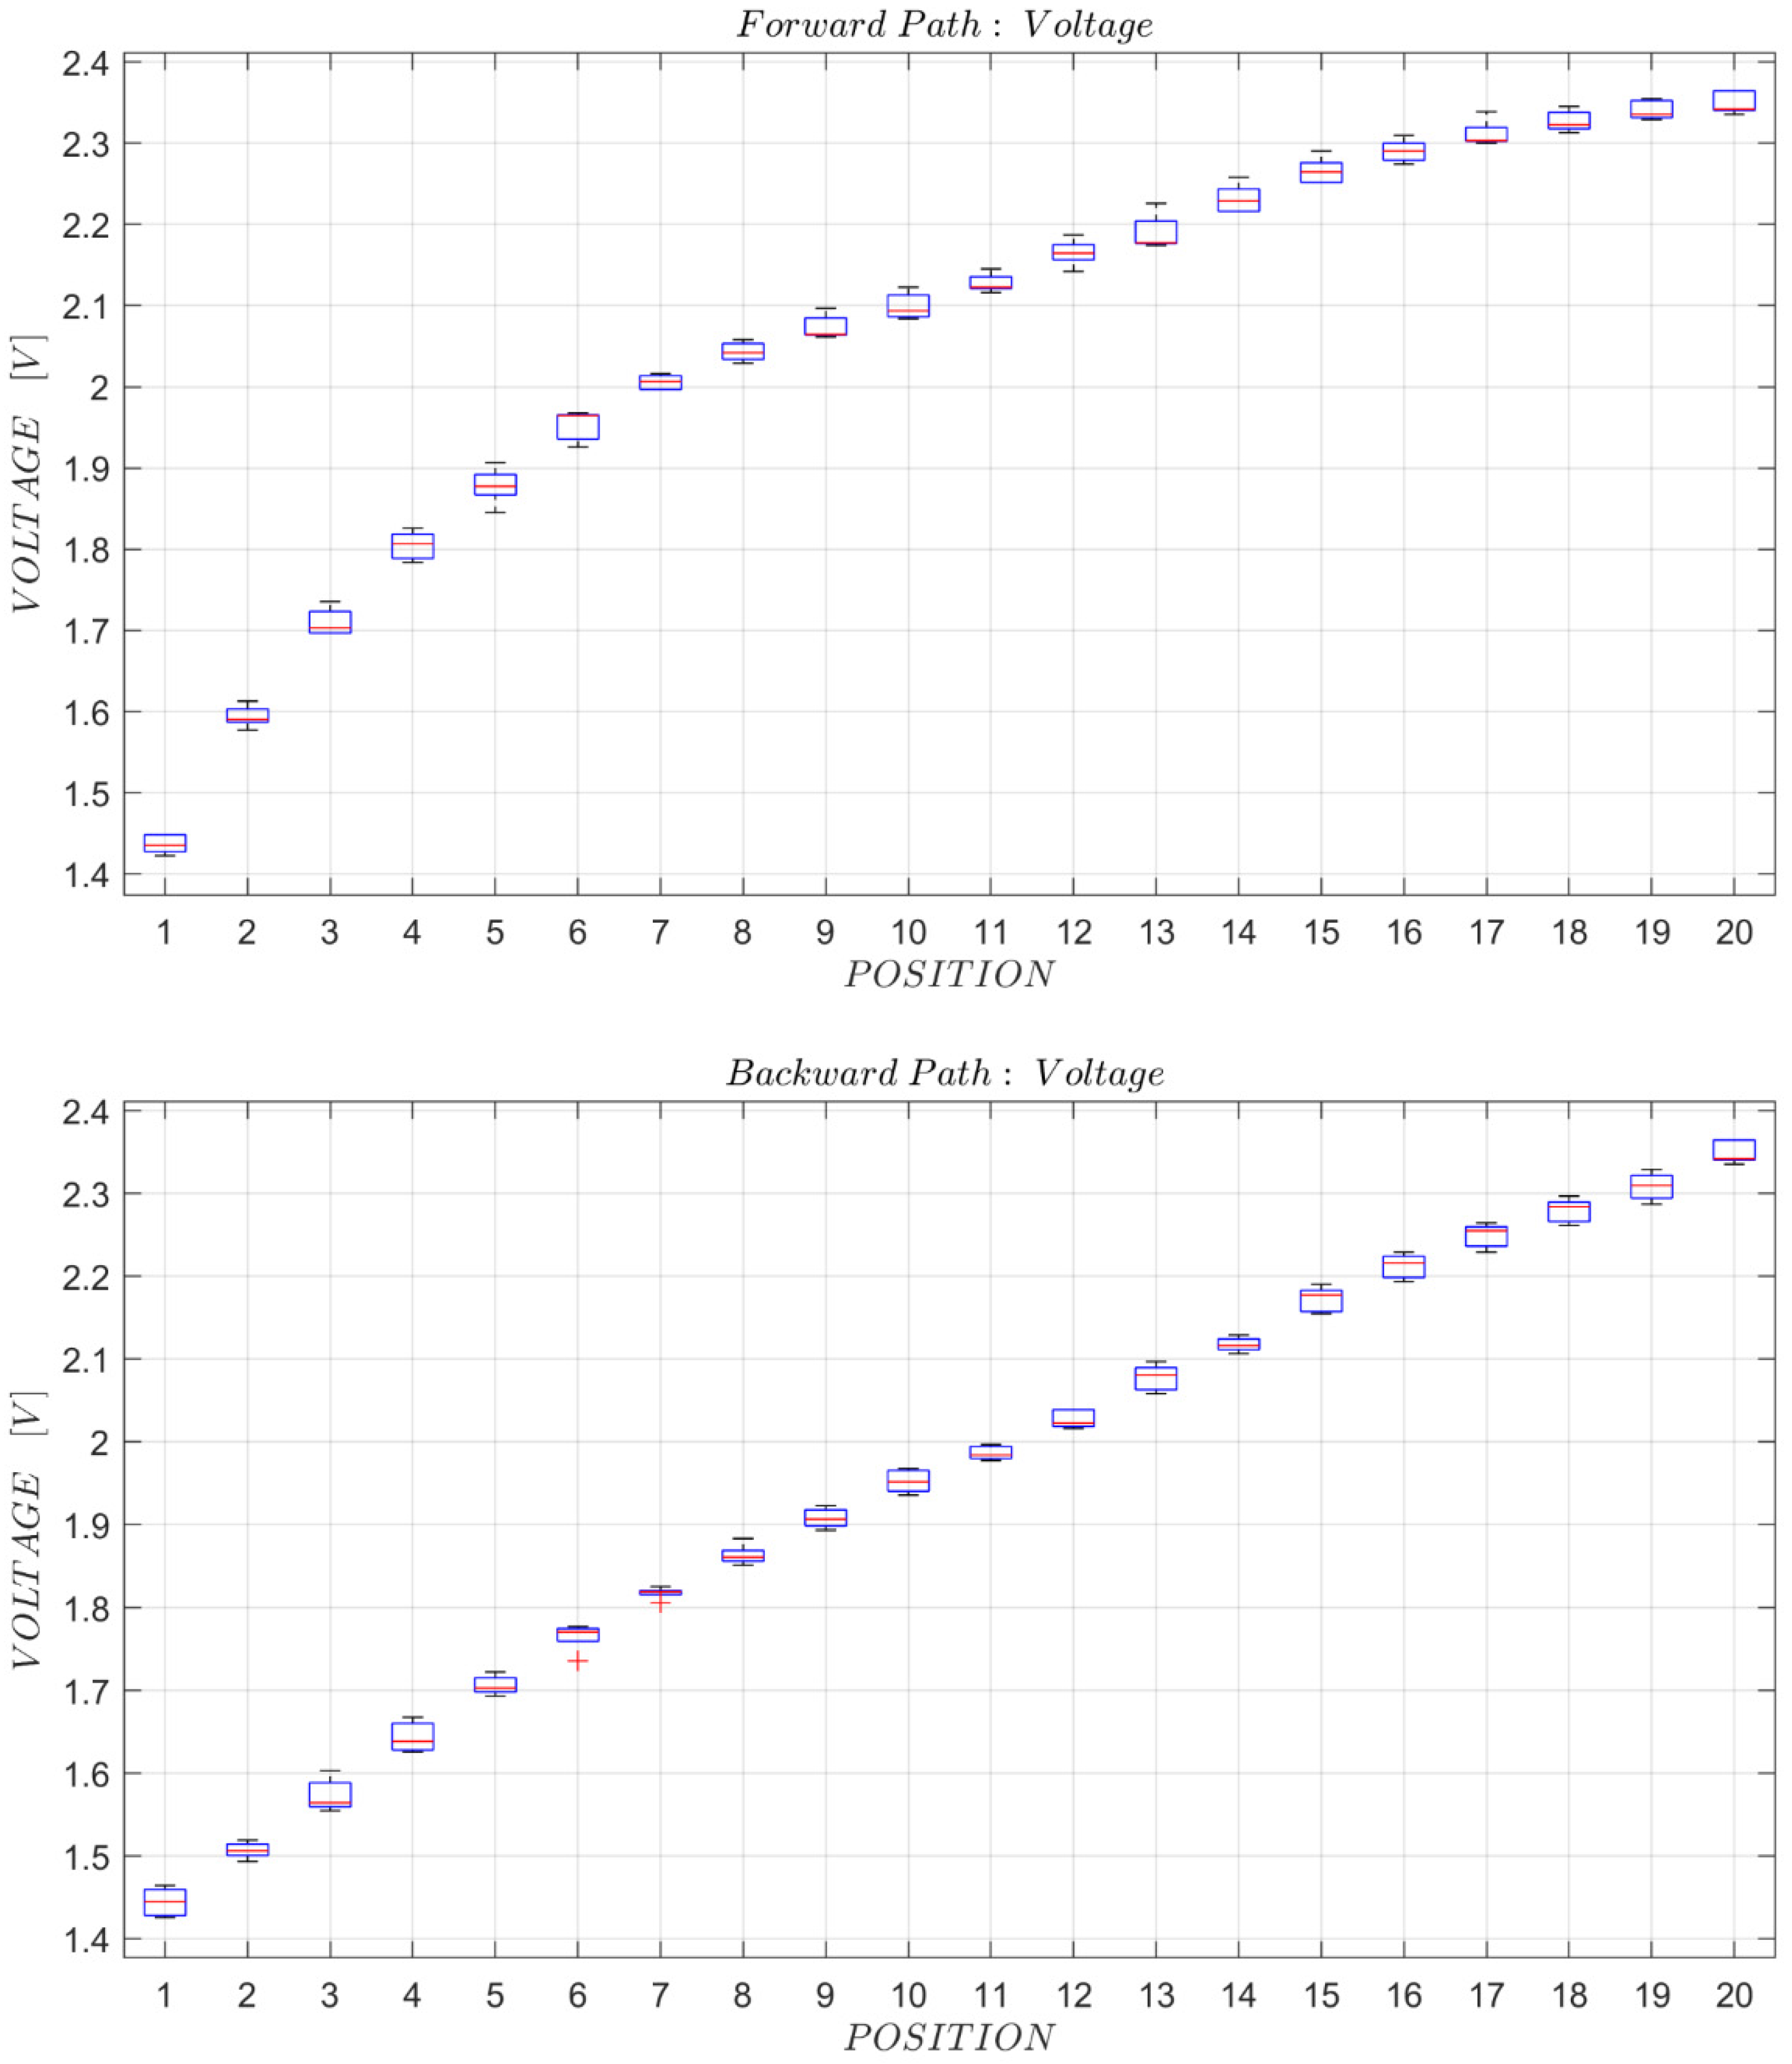
| 001 19 48 | Forw. | mean | 1.33 | 1.43 | 1.52 | 1.60 | 1.67 | 1.73 | 1.78 | 1.82 | 1.86 | 1.89 | 1.92 | 1.96 | 2.01 | 2.05 | 2.09 | 2.13 | 2.16 | 2.17 | 2.19 | 2.20 |
| std | 0.01 | 0.01 | 0.02 | 0.01 | 0.01 | 0.01 | 0.01 | 0.01 | 0.01 | 0.01 | 0.01 | 0.01 | 0.01 | 0.01 | 0.01 | 0.01 | 0.01 | 0.01 | 0.01 | 0.01 | ||
| Backw. | mean | 1.34 | 1.37 | 1.41 | 1.47 | 1.53 | 1.57 | 1.62 | 1.66 | 1.71 | 1.75 | 1.79 | 1.83 | 1.88 | 1.94 | 1.99 | 2.04 | 2.09 | 2.12 | 2.16 | 2.20 | |
| std | 0.02 | 0.01 | 0.02 | 0.02 | 0.01 | 0.02 | 0.01 | 0.01 | 0.01 | 0.01 | 0.01 | 0.01 | 0.02 | 0.01 | 0.02 | 0.02 | 0.01 | 0.01 | 0.02 | 0.01 | ||
| 001 19 51 | Forw. | mean | 1.28 | 1.38 | 1.47 | 1.54 | 1.60 | 1.66 | 1.70 | 1.75 | 1.78 | 1.82 | 1.85 | 1.89 | 1.94 | 1.99 | 2.03 | 2.06 | 2.08 | 2.10 | 2.12 | 2.13 |
| std | 0.02 | 0.02 | 0.03 | 0.04 | 0.03 | 0.03 | 0.04 | 0.04 | 0.04 | 0.04 | 0.04 | 0.04 | 0.04 | 0.04 | 0.04 | 0.03 | 0.03 | 0.03 | 0.04 | 0.04 | ||
| Backw. | mean | 1.30 | 1.33 | 1.36 | 1.40 | 1.45 | 1.49 | 1.53 | 1.57 | 1.61 | 1.65 | 1.69 | 1.74 | 1.80 | 1.86 | 1.92 | 1.97 | 2.01 | 2.04 | 2.08 | 2.13 | |
| std | 0.02 | 0.01 | 0.02 | 0.02 | 0.01 | 0.02 | 0.01 | 0.01 | 0.01 | 0.01 | 0.01 | 0.01 | 0.02 | 0.01 | 0.02 | 0.02 | 0.01 | 0.01 | 0.02 | 0.01 | ||
| Sensor | Position | ||||||||||||||||||||
|---|---|---|---|---|---|---|---|---|---|---|---|---|---|---|---|---|---|---|---|---|---|
| 1 | 2 | 3 | 4 | 5 | 6 | 7 | 8 | 9 | 10 | 11 | 12 | 13 | 14 | 15 | 16 | 17 | 18 | 19 | 20 | ||
| 001 19 22 | h | 0 | 0 | 0 | 0 | 1 | 0 | 0 | 0 | 0 | 0 | 0 | 0 | 0 | 0 | 0 | 0 | 0 | 0 | 0 | 0 |
| p | 1.00 | 0.67 | 0.13 | 0.12 | 0.01 | 0.45 | 0.19 | 0.31 | 0.55 | 0.08 | 0.83 | 0.12 | 0.46 | 0.75 | 0.32 | 0.20 | 0.17 | 0.22 | 0.26 | 1.00 | |
| 001 19 28 | h | 0 | 0 | 0 | 0 | 0 | 1 | 1 | 1 | 0 | 0 | 0 | 0 | 0 | 1 | 0 | 0 | 0 | 0 | 0 | 0 |
| p | 1.00 | 0.79 | 0.87 | 0.87 | 0.33 | 0.02 | 0.01 | 0.03 | 0.07 | 0.78 | 0.92 | 0.16 | 0.15 | 0.01 | 0.57 | 0.20 | 0.66 | 0.08 | 0.07 | 1.00 | |
| 001 19 35 | h | 0 | 0 | 0 | 0 | 0 | 1 | 1 | 1 | 0 | 1 | 0 | 0 | 0 | 0 | 0 | 0 | 1 | 0 | 0 | 0 |
| p | 1.00 | 0.16 | 0.13 | 0.84 | 0.49 | 0.01 | 0.02 | 0.04 | 0.08 | 0.01 | 0.46 | 1.00 | 0.28 | 0.50 | 0.61 | 0.06 | 0.04 | 0.23 | 0.69 | 1.00 | |
| 001 19 48 | h | 0 | 0 | 0 | 0 | 0 | 0 | 0 | 1 | 0 | 0 | 0 | 0 | 0 | 0 | 0 | 0 | 0 | 1 | 0 | 0 |
| p | 1.00 | 0.09 | 0.94 | 0.64 | 0.18 | 0.81 | 0.14 | 0.05 | 0.10 | 0.54 | 0.24 | 0.14 | 0.11 | 0.85 | 0.08 | 0.49 | 0.75 | 0.01 | 0.88 | 1.00 | |
| 001 19 51 | h | 0 | 0 | 0 | 0 | 0 | 0 | 0 | 0 | 0 | 0 | 0 | 0 | 0 | 0 | 0 | 0 | 0 | 0 | 0 | 0 |
| p | 1.00 | 0.83 | 0.45 | 0.60 | 0.43 | 0.90 | 0.55 | 0.16 | 0.57 | 0.83 | 0.09 | 0.61 | 0.72 | 0.75 | 0.39 | 0.29 | 0.42 | 0.54 | 0.14 | 1.00 | |
| Reference | Calibration | Sensors | A | B | C | D | E | F | G | H | |
|---|---|---|---|---|---|---|---|---|---|---|---|
| Type | Method | ||||||||||
| [50] Yao C., 2020 | Manual | Angle gauge | 2,2″ Spectra Symbol | R vs. angle | −30°~+70° | 0.5° | 2.0–2.3 count/° | Angles of −30° and 30° for 100 times | |||
| [49] Oess N.P., 2010 | Manual | Traditional goniometer | Flexpoint Inc. | V vs. angle | 0–135° | Between 0% and 1.3% (one joint closing and opening cycle) | |||||
| [10] Abro Z.A., 2019 | Manual | Different cylinders with fixed diameter | Flex sensor length 110 | V vs. angle | Second-order polynomial | ||||||
| [3] Saggio G., 2014 | Manual | Wooden made frame with a Vicon System and a manual goniometer as a reference | Cylindrical flexible polymer component (Images Scientific Instruments) | R vs. angle | Resistance vs. angle relationship is not linear, but quadratic | 5.82 ± 1.93° | |||||
| [28] Gerboni G., 2017 | Partially automated | External electro magnetic sensing positioning system | Flexpoint Inc. | V vs. angle | 1.8° | 5.8% | |||||
| [44] Sanca A.S., 2018 | Partially automated | 3D printed mechanical testbed is used, with three different diameters, with an IMU and an incremental encoder | Spectra Symbol | R vs. angle | 1.5° | qualitative | |||||
| [51] Saggio G., 2012 | Fully automated | Test bench with stepper motor for characterization with fixed radius of curvature | Flexpoint Inc., 2 and 3 inch | R vs. angle | Linear characteristic beyond 40° | ||||||
| [43] Orengo G. 2013 | Fully automated | Linear guide moved by a stepper motor for variable radius of curvature characterization | Flexpoint Inc., 2 and 3 inch | Sheet resistance vs. curvature radius | |||||||
Publisher’s Note: MDPI stays neutral with regard to jurisdictional claims in published maps and institutional affiliations. |
© 2021 by the authors. Licensee MDPI, Basel, Switzerland. This article is an open access article distributed under the terms and conditions of the Creative Commons Attribution (CC BY) license (https://creativecommons.org/licenses/by/4.0/).
Share and Cite
Tiboni, M.; Filippini, A.; Amici, C.; Vetturi, D. Test-Bench for the Characterization of Flexion Sensors Used in Biomechanics. Electronics 2021, 10, 2994. https://doi.org/10.3390/electronics10232994
Tiboni M, Filippini A, Amici C, Vetturi D. Test-Bench for the Characterization of Flexion Sensors Used in Biomechanics. Electronics. 2021; 10(23):2994. https://doi.org/10.3390/electronics10232994
Chicago/Turabian StyleTiboni, Monica, Azzurra Filippini, Cinzia Amici, and David Vetturi. 2021. "Test-Bench for the Characterization of Flexion Sensors Used in Biomechanics" Electronics 10, no. 23: 2994. https://doi.org/10.3390/electronics10232994
APA StyleTiboni, M., Filippini, A., Amici, C., & Vetturi, D. (2021). Test-Bench for the Characterization of Flexion Sensors Used in Biomechanics. Electronics, 10(23), 2994. https://doi.org/10.3390/electronics10232994