Article

Classifying Emotions in Film Music—A Deep Learning Approach

1
Multimedia Systems Department, Faculty of Electronics, Telecommunications and Informatics, Gdansk University of Technology, 80-233 Gdańsk, Poland
2
Audio Acoustics Laboratory, Faculty of Electronics, Telecommunications and Informatics, Gdansk University of Technology, 80-233 Gdańsk, Poland
*
Author to whom correspondence should be addressed.
Electronics 2021, 10(23), 2955; https://doi.org/10.3390/electronics10232955
Submission received: 15 October 2021 / Revised: 19 November 2021 / Accepted: 20 November 2021 / Published: 27 November 2021
(This article belongs to the Section Computer Science & Engineering)

Abstract

:
The paper presents an application for automatically classifying emotions in film music. A model of emotions is proposed, which is also associated with colors. The model created has nine emotional states, to which colors are assigned according to the color theory in film. Subjective tests are carried out to check the correctness of the assumptions behind the adopted emotion model. For that purpose, a statistical analysis of the subjective test results is performed. The application employs a deep convolutional neural network (CNN), which classifies emotions based on 30 s excerpts of music works presented to the CNN input using mel-spectrograms. Examples of classification results of the selected neural networks used to create the system are shown.

1. Introduction

The problem of classifying emotions in music, initiated in 1936 by Kate Hevner, is a constantly developing field of science. The difficulty of detecting emotions in music is related to the subjective nature of the problem. The development of research on this subject was undoubtedly an inspiration for creating a separate field of science; many studies on this subject show a multitude of possible approaches and solutions by using different classification algorithms, different work databases, and different input data for the algorithms.
Music is an inseparable part of a film. It occurs alongside spoken dialogue and acoustic effects, with which it forms a coherent sound layer. It is also worth mentioning silence, which influences the way we perceive the surrounding sounds. Film music is characterized by its subordination to the content of the film, which makes its character change along with the mood of the scenes. For the same reason, it has a fragmentary character, as is the case with autonomous music. Film music introduces the viewer to the atmosphere of a given film, and it reflects the emotional states and feelings of the characters. At the same time, it comments on and interprets the events, often conveying to us some content that is not clearly apparent from what is viewed on the screen. Music also provides continuity between shots, matching the rhythm of the film editing. So, the main functions of film music are commentary, history supporting, atmosphere creating in a scene, and emotion evoking in viewers. Determining the emotions contained in film music is challenging but worth pursuing, as this may be used as a tool by filmmakers and composers to enhance the created picture with music.
Overall, there is a strong thread related to music emotion retrieval seen in the literature, which is called music emotion recognition (MER) [1], as there is a need for such applications in many areas, including music recommendation, streaming, and music discovery platforms, e.g., last.fm, iTunes, Spotify, etc., and filmmaking. The research studies engage machine learning approaches, employing baseline algorithms [1,2,3,4] and, more recently, deep learning [5,6,7]. They are conducted on excerpts or whole music pieces, parametric or 2D representations; i.e., spectrograms, mel-spectrograms, mel-cepstrograms, and chromagrams [8,9,10]. Different databases for music pieces are used—moreover, the music genre, mood, or culture are taken into account. Overall, the researchers are outdoing each other, proposing new emotion models and derivations of those already proposed. In addition, music streaming portals are attracting users through the ability to match music to one’s interests or emotional state/mood [6,11,12].
As already mentioned, today’s mainstream of MER employs deep learning and various models of neural networks (NNs). The motivation to use NNs lies in their construction; these networks are made of artificial neurons inspired by the action of biological neurons [13]. Such a model is able to simulate the operation of processes in the human brain. Over the decades, many research studies were carried out to understand how music affects humans by enhancing or stimulating specific emotions [13,14,15]. The aspect of its impact on people is well-known, but how it happens is still scientifically unexplored. The issue of automatically classifying emotions in music is visible both in the literature [16,17,18,19] as well as in technology [16]. This provides the background of the research carried out in this area. Therefore, some of the works are summarized in Section 2, showing examples of emotion models and their classification. The consecutive sections focused on our study.
The aim of our study is twofold. The first part of the work presents an Internet-based questionnaire form built for the purpose of assigning emotions and colors to a given film music excerpt (see Section 3). Based on the survey, the model of emotions used in the Epidemic Sound dataset is mapped to the proposed emotion model consisting of nine perceptual labels: energetic, aggressive, sad, scary, depressive, calm, relaxing, joyful, and exciting, which are correlated with colors. These are emotions that are strongly related to the psychology behind filmmaking. In the survey, 15 s excerpts of music tracks are assigned to a specific emotion, and one color label is used in the created model. Then, in Section 4, the results of the survey tests are shown along with a statistical analysis to check the validity of the emotion model proposed. It should be noted that using complementary colors and emotions in film music is highly important, as both are employed by the filmmaker, film producer, and music composer to magnify the message that is contained in the film narration. Film characters, their relations and encounters, the chronology of events, and their durations, the narrative space—all of these are underscored by music.
The second goal is to build a deep model for assigning an appropriate emotion to a particular music excerpt. To achieve this goal, a dataset of film music, including 420 music pieces, is created. Then, a script is prepared to generate mel-spectrograms on the basis of 30 s excerpts and save them in the form of .png files. The next step is to select several convolutional neural network (CNN) models that can accept 2D representations as input. From the various available neural network models proposed by the Keras platform, five are chosen that meet the above condition. The training process is divided into several stages, in which the accuracy of the models is checked. In the end, the CNN characterized by the highest accuracy is selected for the final tests. Section 5 contains deep learning-based details of emotion classification. In addition, an application to classify emotions from a chosen film music track is created, and an example of its working is shown. Finally, conclusions are derived, and future work is outlined.

2. Related Work

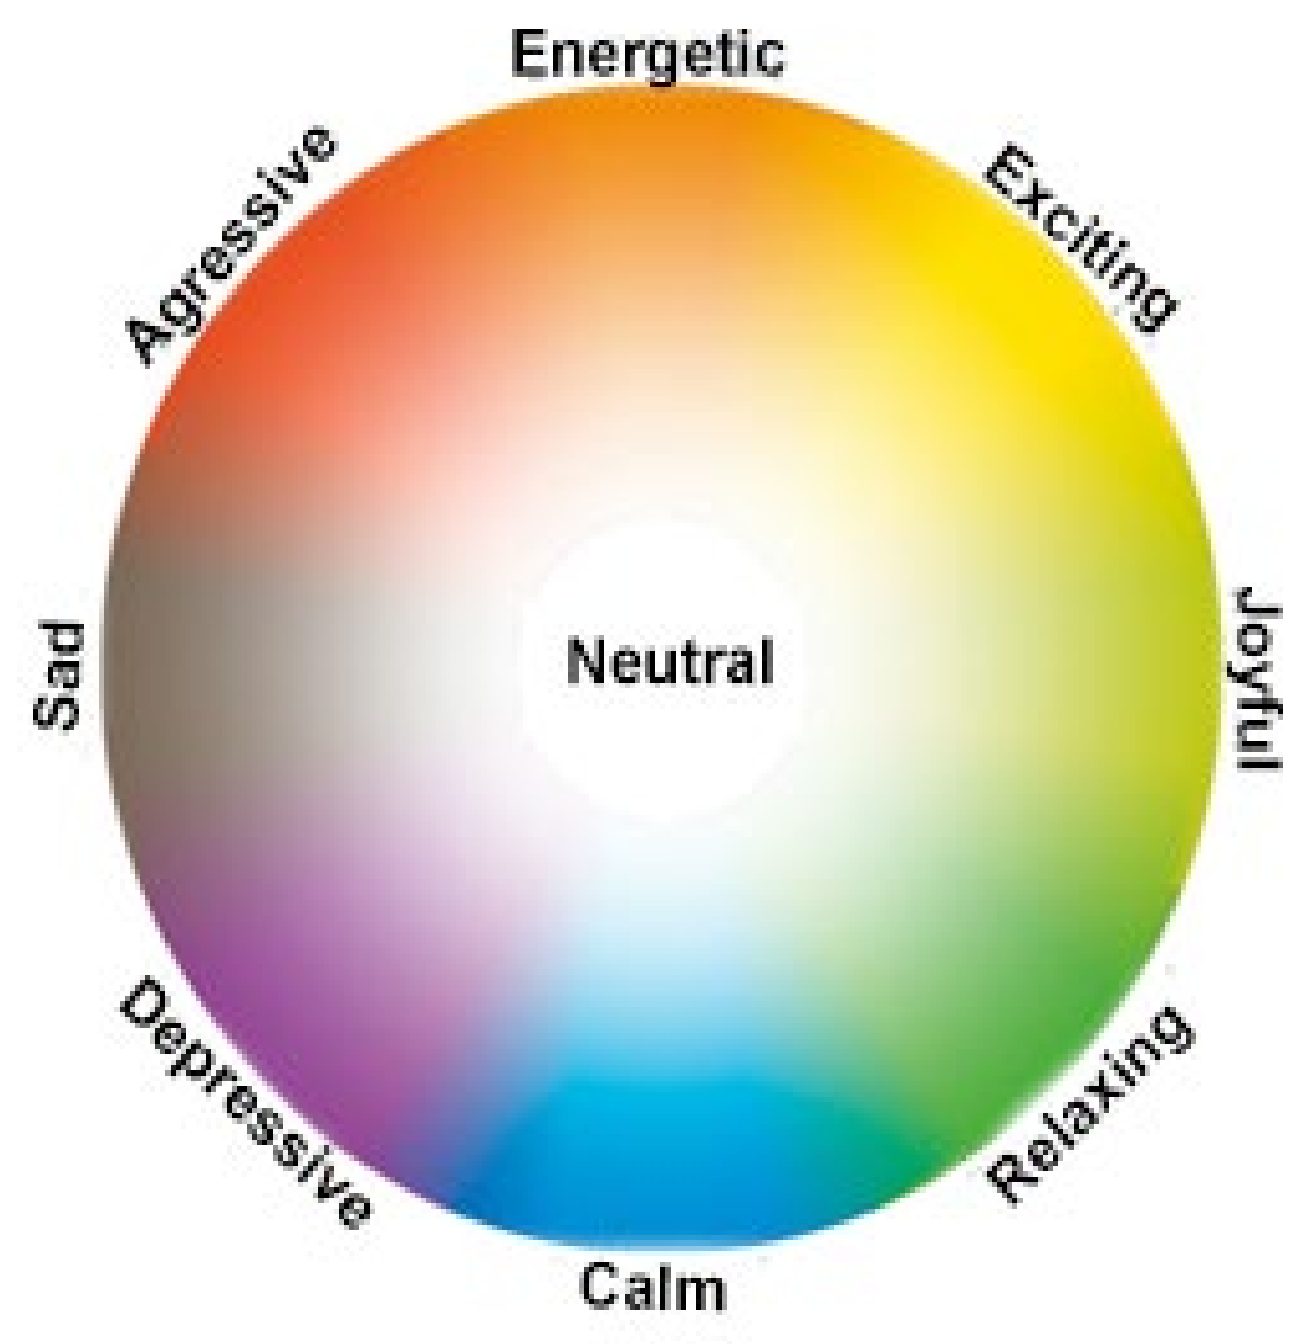
2.1. Emotion/Mood Representation

In the literature concerning the classification of emotions, two main approaches are distinguished [3]:
  • Categorical—emotions in models are described using labels that can be further divided into appropriate classes;
  • Dimensional—emotions are defined on the basis of their location in a designated space.
One of the examples of the representation of emotions in the categorical model is the list of 66 adjectives proposed by Kate Hevner, which are divided into eight groups. The groups are shown in a circle; groups with opposite meanings lie opposite each other [20].
The Thayer model is the most simplified version of the two-dimensional model of emotions. The x and y axes indicate the level of stress and energy, correspondingly. Stress is a variable concerning negative and positive emotions; energy is a variable of calm or more upbuilding emotions. The resulting four regions on the plane can be divided into exuberance, anxiety, depression, and contentment [21,22].
Another one of the dimensional emotion models is the Russell model [23,24]. The x and y axes describe valence and arousal; each of the emotions contained in the model is a separate point with its own specific coordinates. The representation of Russell’s model in the literature is defined by presenting 28 adjectives describing emotions in 2D.
The Tellegen–Watson–Clark model shows high positive affect and high negative affect as two independent dimensions, whereas pleasantness–unpleasantness and engagement–disengagement represent the endpoints of one bipolar dimension [25,26].
Plewa and Kostek introduced a color-shaded model that smoothly passes from one color to another, which is contained in a palette distributed over a circle [27,28]. An important part of this emotion model is a label referring to the cross-section of x and y coordinates, which are called ‘neutral’ (see Figure 1).
Their observations from subjective tests led to the conclusion that it is challenging to determine the intensity of emotion/mood on a fixed, discreet scale. At the same time, test participants pointed out that the transition between emotions should also be blurred. All of these remarks lead to the idea of fuzzifying the boundaries in the proposed model of mood. A model with fuzzified boundaries of emotions and fuzzified intensity of mood is presented in Figure 1.
The users taking part in the experiments described this projection as more intuitive, and this is coherent with the intuitive concept that there are no crisp ranges representing mood and emotions; in contrast, the transition area is rather blurred. This is also closely related to a human’s perception of music and leaves space for interpretation. Due to the fuzzification that occurs in two dimensions—intensity of mood and transition between emotions—the model based on fuzzy logics should also be two-dimensional.
Overall, one can see a plethora of emotion models also used in music emotion recognition (MER) [4,17,18]. However, the authors of the presented study decided to use their own description and assignment of emotions. This is because of the specific relationship between film music, associated color, and the emotions that are evoked by them. The proposed model is employed to develop an application aiming at the automatic assignment of emotions to film music, based on a deep learning model. This is to compare whether the subjects participating in the survey assign a piece of music to emotions similarly as a neural network does.

2.2. Emotion Classification

In the literature, one can come across rich and varied approaches to classifying emotions in music. The differentiation between the works depends mainly on the adopted recognition methods and algorithms, starting from the classification based on a complete piece of music or its excerpt, going through a varied selection of audio signal representations designated for a variety of algorithms. Representation methods can be divided into the preparation of raw sound samples, 2D representations of music (e.g., spectrograms, cepstrograms, chromagrams, etc.) [7,29,30] and musical signal parametric form, i.e., feature vector (e.g., a vector of mel-cepstral coefficients or MPEG-7-based parameters) [14,15,17].
Deep learning models are one of the popular methods used to carry out emotion or affect recognition. This can be a crucial task if recognition of a human emotional state is an integral part of the task being automated by an algorithm. This is a rapidly developing part of machine learning-related research. Usually, a whole set of deep learning paradigms is applied at once in models intended to recognize emotions in audio-visual media. Examples of such are convolutional network models, recurrent long short-term memory deep neural networks, transformers and stacked transformers, etc. [31,32,33,34]. Emotion recognition is often performed on audio-visual recordings, conversational data (both transcribed and recorded ones), facial expressions, and recently employing EEG data [31,35,36,37]. They also often involve multimodal analysis, as such an approach makes it possible to benefit from the information gathered from multiple sources (modalities) [35,38]. Emotion recognition is becoming critical in the context of many technologies employing human–computer interaction [39]. Taking into account the emotional state of a human using such an interface may increase the ease of use and improve the experience of such a system user. This may be especially important if such technologies are used in places requiring assessment of people’s well-being and healthcare—for instance, in a smart monitoring system for patients needing constant attendance [40,41] and techniques used for tracking and maximizing students’ engagement in the learning process [42]. In addition, possible use in the arts is an interesting application, as such a system may be used to recommend songs or movies based on the emotional state of the person using such a system [43].
An approach of training a neural network with data obtained from raw, unprocessed sound was proposed by Orjesek et al. [17]. The algorithm used convolutional network layers connected with layers of a recursive neural network. The authors of the work focused on the classification of emotions based on the valence-arousal dimensional model of emotions. The algorithm of the first layer separated features from its own input audio file using a 5-millisecond time window. In this way, eight feature maps were obtained, which were then processed and prepared from the obtained data for the recursive part of the system. To prevent the network overfitting, the dropout technique was used, which excludes some neurons from selected layers in subsequent learning iterations. Two values were returned from the last layer of the network: valence and arousal [17]. A database of musical excerpts, i.e., MediaEval Emotion, consisting of 431 samples (validation and training set) was used to train the network, each of which lasted 45 s, and the test set consisted of 58 songs with an average duration of 243 s. The capability of the NN was measured by the RMSE (Root Mean Square Error) value (see Table 1 for details).
In Table 1, examples of studies concerning emotion/mood representation and their automatic classification are presented. In addition, it should be noted that various metrics are used in evaluating classifier effectiveness. Typically, accuracy, but also sensitivity, specificity, false-negative rate, and F-measure are also investigated for the models [44].
Table 1. Examples of studies with regard to emotion/mood representation and their automatic classification.
AuthorMethodEmotion ModelInput Data FormResults
Orjesek R.
et al. [17]
CNN-RNN (one-dimensional CNN, time-distributed fully-connected layer and bidirectional gated recurrent unit)V/ARaw audio filesRMSE (Root Mean Square Error):
Valence—0.123 ± 0.003
Arousal—0.116 ± 0.004
Er et al. [18]Two neural networks (VGG-16, AlexNet) and two classifiers (softmax, SVM)Four classesChromatogramsAccuracy approx. 89%
Yang Y.-H.
et al. [19]
FKNN (Fuzzy k-Nearest Neighbor)V/AFeature vectorAccuracy 70.88%
FNM (Fuzzy Neural Network)V/AFeature vectorAccuracy 78.33%
Bargaje M. [45]GA+SVMV/A/LFeature vectorAccuracy 84.57%
Sarkar R. et al. [46]Transfer learningHappy, Anger, Sad, NeutralMel-spectrogramAccuracy 77.82 ± 4.06 %
Pandeya et al. [6]2D/3D convolutionsix distinct classes: excited, fear, neutral, relaxation, sad, tensionMel-spectrogramAccuracy 74%, f1-score of 0.73
Seo and Huh [47]SVM/random forest/deep learning/kNN‘Happy, Glad,’ ‘Excited, Aroused,’ ‘Sad, Angry’ and ‘Calm, Bored.’ mapped on valence and arousal model;Feature vectorAccuracy 73.96%/69.01% 72.90%/70.13% for k = 5
Av. match of 73.96% between the proposed method and the survey participants’ responses
Cuningham et al. [48]ANNValence and arousal modelFeature vectorAccuracy: 64.4% for arousal and 65.4% for valence
Tong, L. et al. [49]CNN/SVMValence and arousal modelSpectrogramsAccuracy for CNN model: 72.4% Accuracy for SVM model: 38.5%
Panda, R. et al. [50]Simple Linear Regression (SLR)/KNN/Support Vector Regression (SVR)Valence and arousal modelFeature vectorAccuracy for SLR: 54.62% for arousal and 3.31% for valence/accuracy for KNN: 61.07% for arousal and 11.97% for valence/accuracy for SVR: 67.39% for arousal and 40.56% for valence
Hizlisoy, S. et al. [51]Long short-term memory deep neural network (CLDNN)Valence and arousal modelFeature vectorAccuracy: 91.93%
Chaudhary, D. et al. [52]CNN/SVMValence and arousal modelSpectogramsAccuracy: 91%
Yang, J. [53]Back propagationValence and arousal modelFeature vectorRMSE (Root Mean Square Error):
Valence—0.1066/Arousal—0.1322
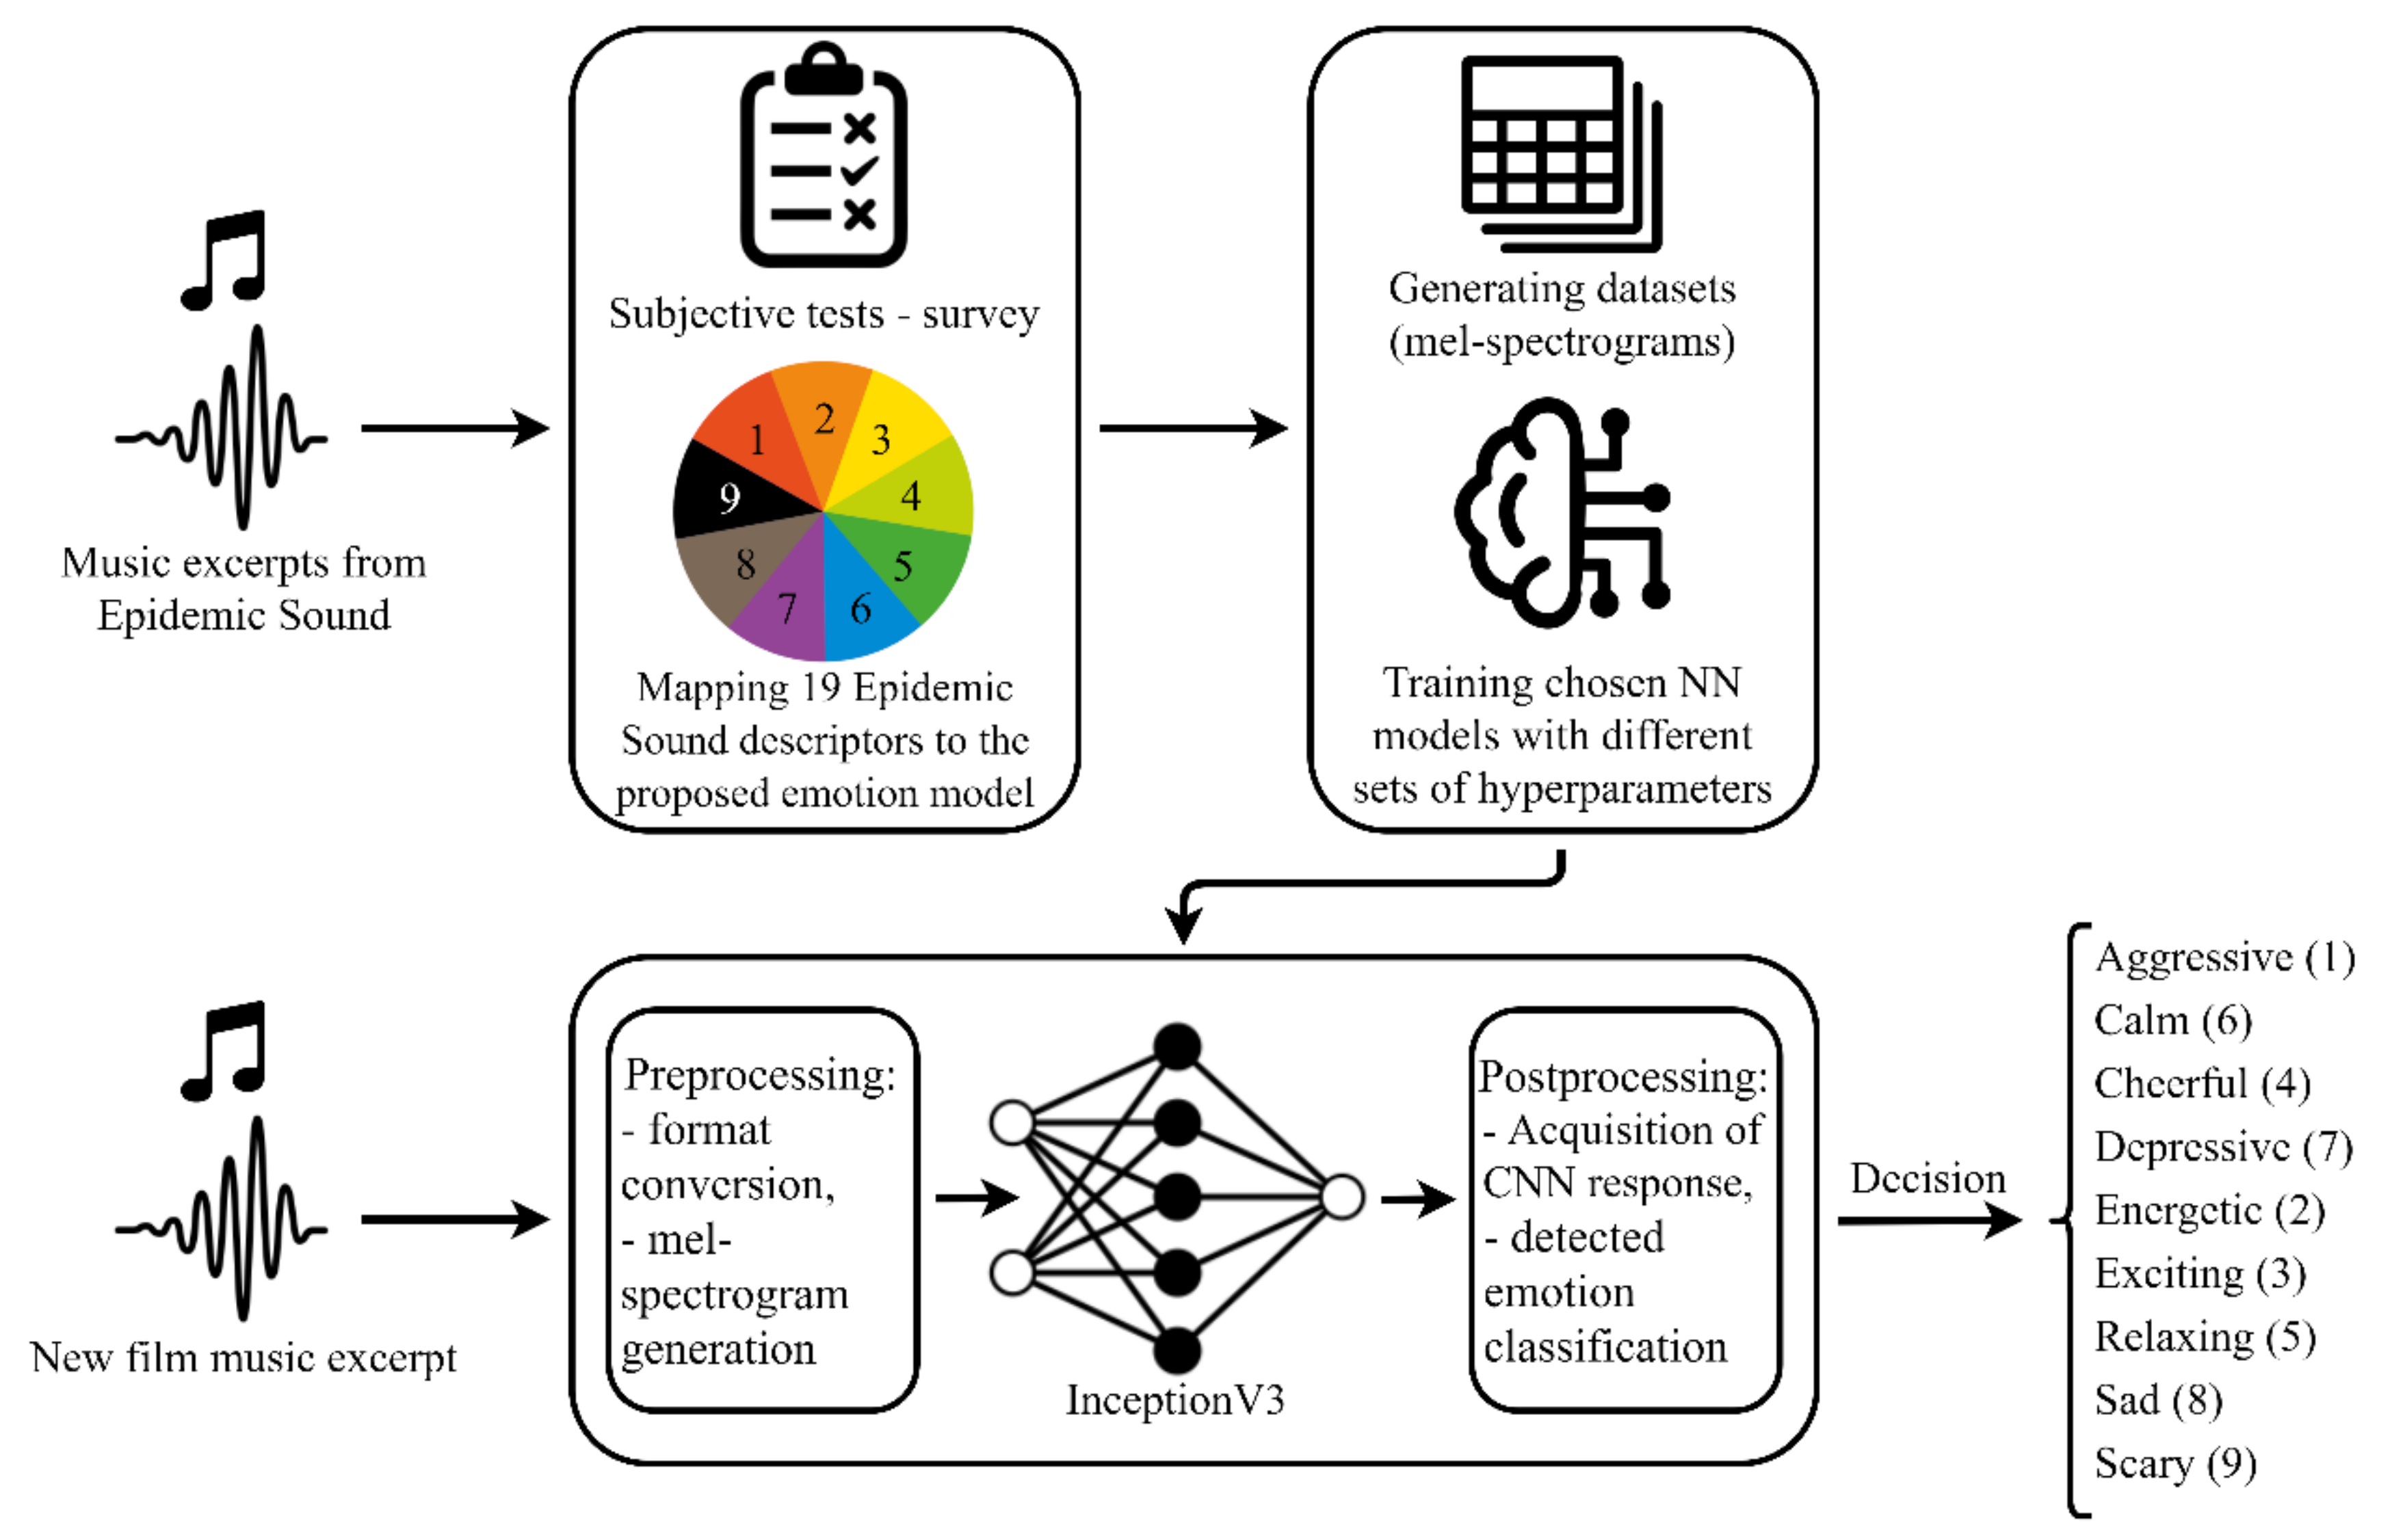
Another method of NN training is by using a 2D representation; this approach was employed by Er et al. [18]. They proposed training the neural networks with chromagrams [18]. The developed algorithm was based on the classification of emotions from only four classes of emotions—joy, sadness, anger, and relaxation. In the experiment, two neural networks (VGG-16, AlexNet) and two classifiers (softmax, SVM) were tested, and the combination that gave the best results in terms of the classification of emotions was selected. For the purpose of training the neural network, two datasets were prepared, the first one consisting of 180 audio samples with a duration from 18 to 30 s available in the Soundtracks database and the database prepared by the authors, which consisted of 400 samples, to which 13 respondents were asked to assign labels associated with one of the four classes of emotions. The next step was to train the neural network with a set of 30 s sets of chromatograms and to extract four features, which were classified using two tested classifiers. The accuracy of the classification of emotions was measured and resulted in approximately 89% [18].
Yang’s work focused on the use of the Thayer model of emotions, but the network was trained based on the parameterization of an audio dataset (195 songs), which was converted to 22.05 kHz, 16 bit, as well as mono PCM WAV encoding and normalized in terms of the volume level [19]. Subjective tests were also prepared, in which 253 volunteers took part. Their task was to assign an appropriate emotion to a given musical excerpt [19]. The training and testing processes were carried out on 114 parameters contained in the feature vector. The conducted subjective tests allowed for the division of the set into a test set and a training set on a 9:1 scale. Then, various combinations of algorithms, data spaces, and feature spaces subjected to the inputs of the system responsible for regression for a given dimension of the valence–arousal plane were compared [19].
Lastly, Amiriparian et al. [28] presented a study based on a fusion system of end-to-end convolutional recurrent neural networks (CRNN) and pre-trained convolutional feature extractors for music emotion and theme recognition. Especially interesting is the concept of the deep spectrum [28]. This study outperformed the challenge of MediEval 2019 Emotion & Themes in the Music task [28].
This short background overview certainly does not exhaust the research carried out in the area; however, it was directed at showing that all “ingredients” of the emotion classification differ between studies. Therefore, emotion models, audio representations, methods, presentation of results, as well as application goals diverge within the research related to emotion classification.

3. Methodology

The experiment consisted of two parts. In the first one, we designed an Internet-based survey to perform mapping of emotions from the Epidemic Sound dataset in the model proposed. The second part introduced a machine learning approach to the classification of emotions contained in film music. A detailed flowchart of the experiment is depicted in Figure 2.

3.1. Subjective Tests

The primary purpose of the survey was to map the emotion model from the selected music database to the proposed model of emotions. In addition, subjective tests were conducted to support data labeling from the set used for training and testing the neural network.
The main assumptions of the conducted online survey concerned its duration (maximum 20 min), duration of an audio sample (15 s was assumed), and the number of responses (the survey should contain more than 40 responses). Constructing the questionnaire form was divided into three main steps, the first of which involved the selection of an emotion model to accompany the classification.

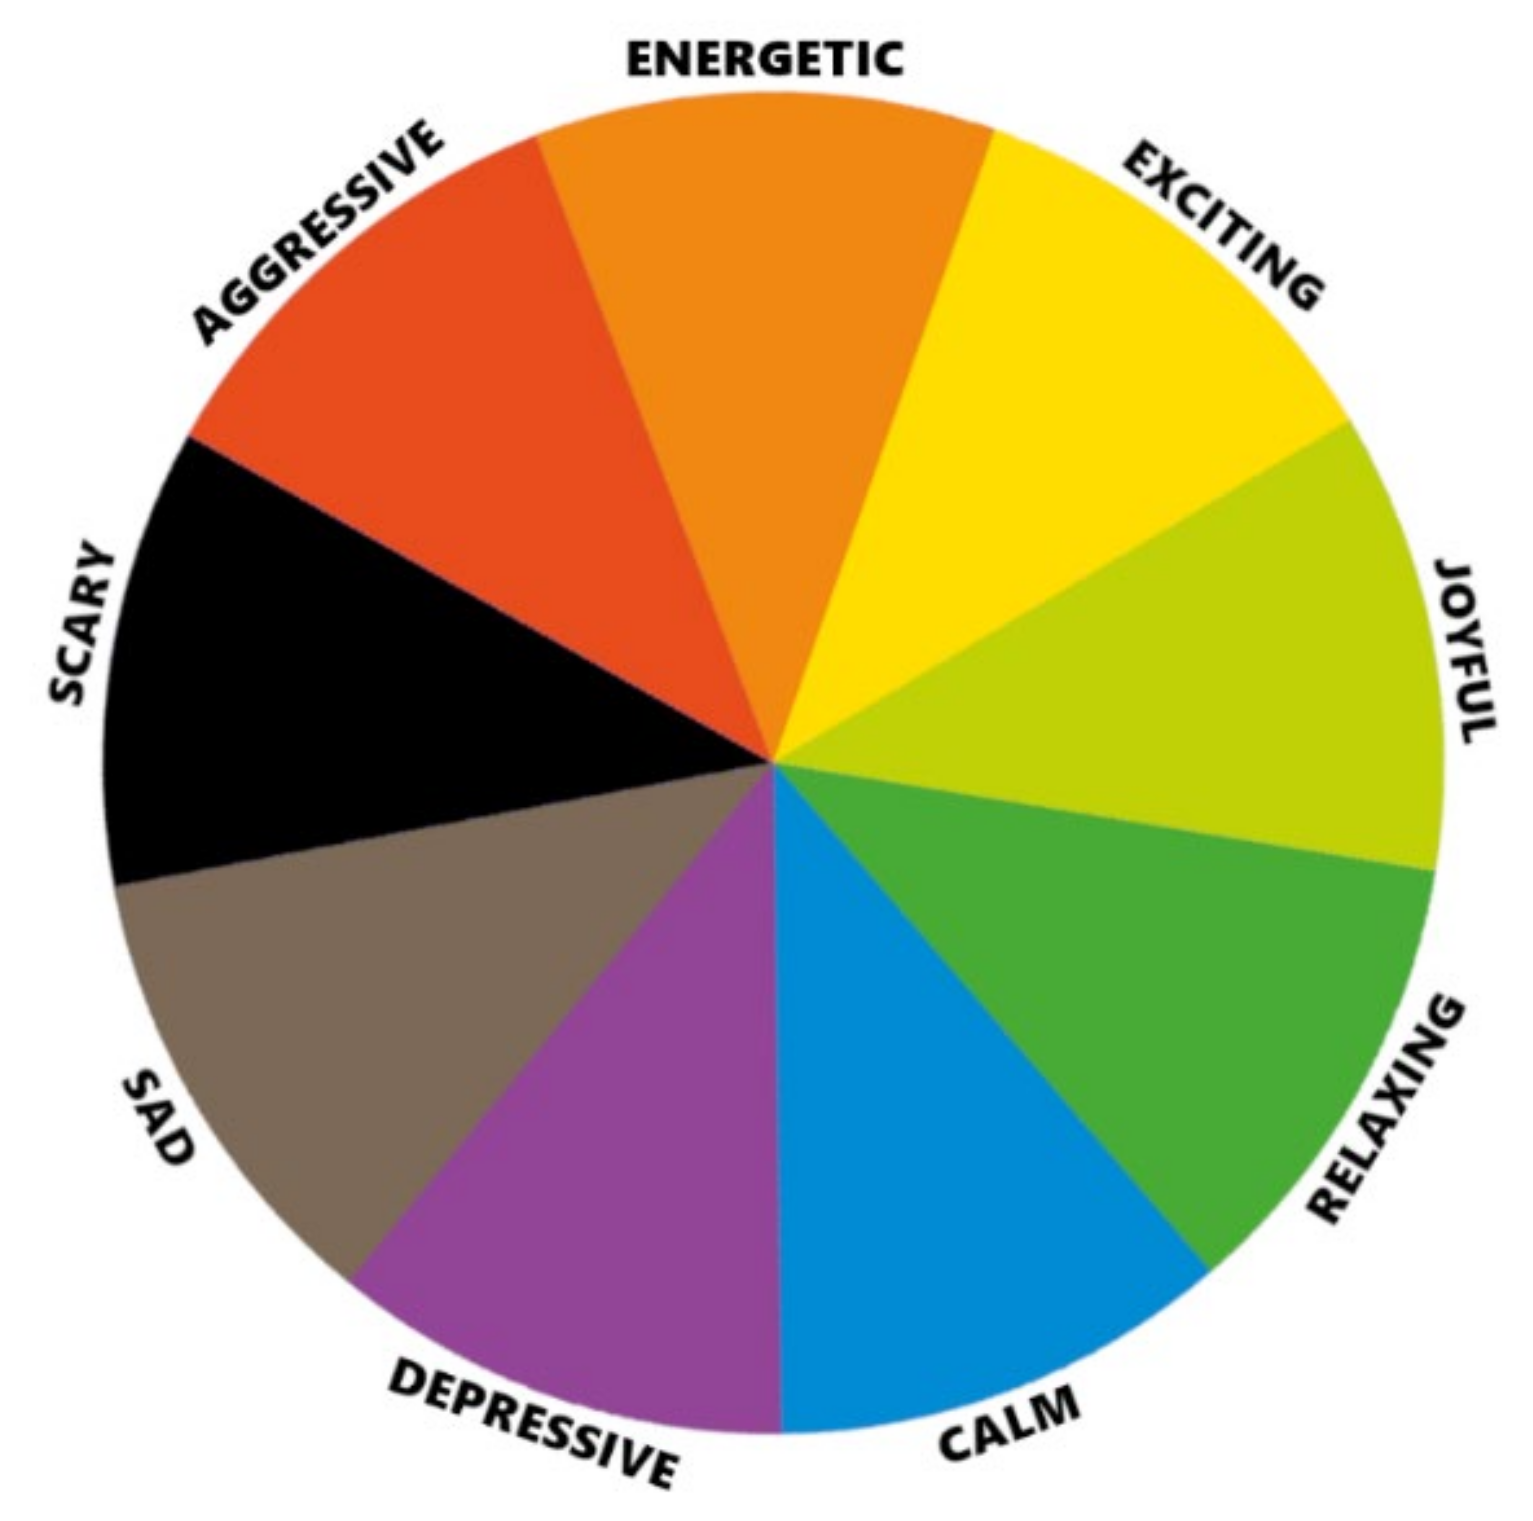
3.1.1. Emotion Model Proposal

The psychology of color in film production is used to evoke emotions and impressions in viewers, hence the essence of including the color meaning in the model of emotions. The models mentioned above, even if commonly used in the literature, were not suitable for this research study due to the lack of emotion representation evoked by film music and its correlation with the film genre.
In preparing the model of emotion, two assumptions were taken into account: the model should not be complicated and, at the same time, it should be adapted to the subject of a film. The literature review enabled us to select a model that would reflect the nature of the problem and allowed emotions to also be correlated with color [28].
As mentioned earlier, the model proposed by Plewa and Kostek is based on a model of eight emotions correlated with eight colors in four different quadrants. On its basis, it was decided to construct a model that would meet the criteria of the conducted research. However, this model was extended by one additional emotion label—the emotion of fear was assigned to the color black [28] (see Figure 3).

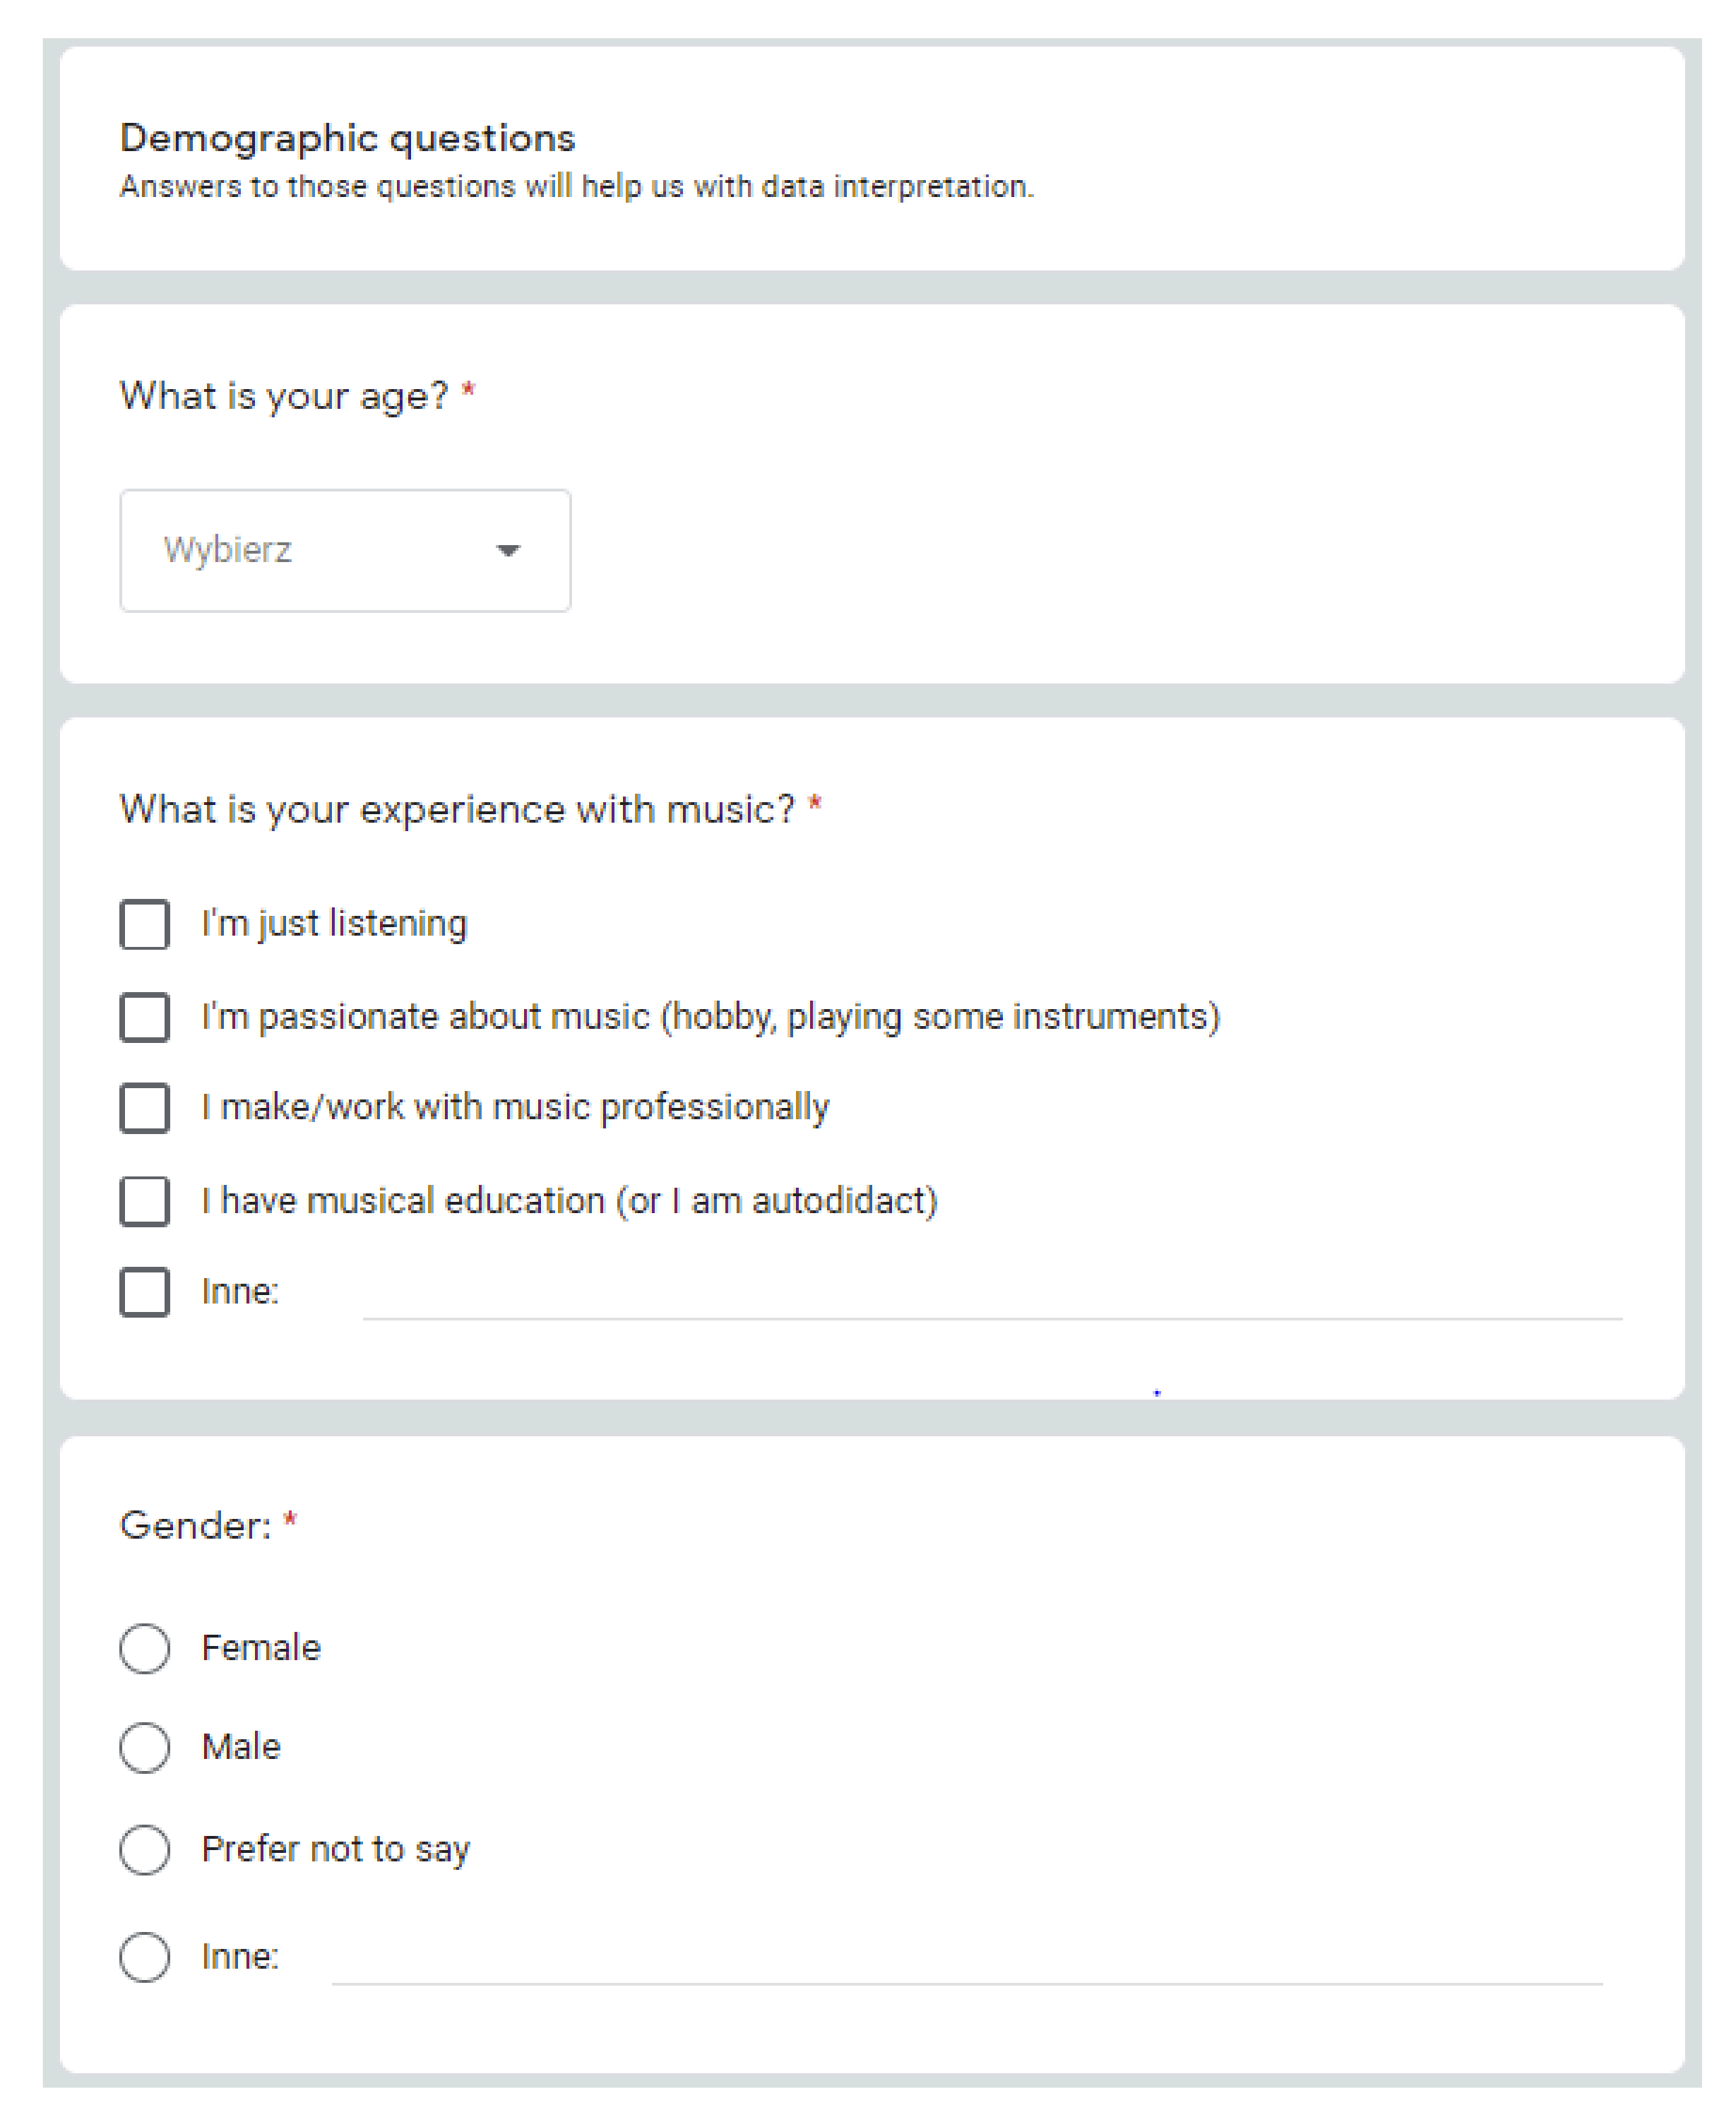
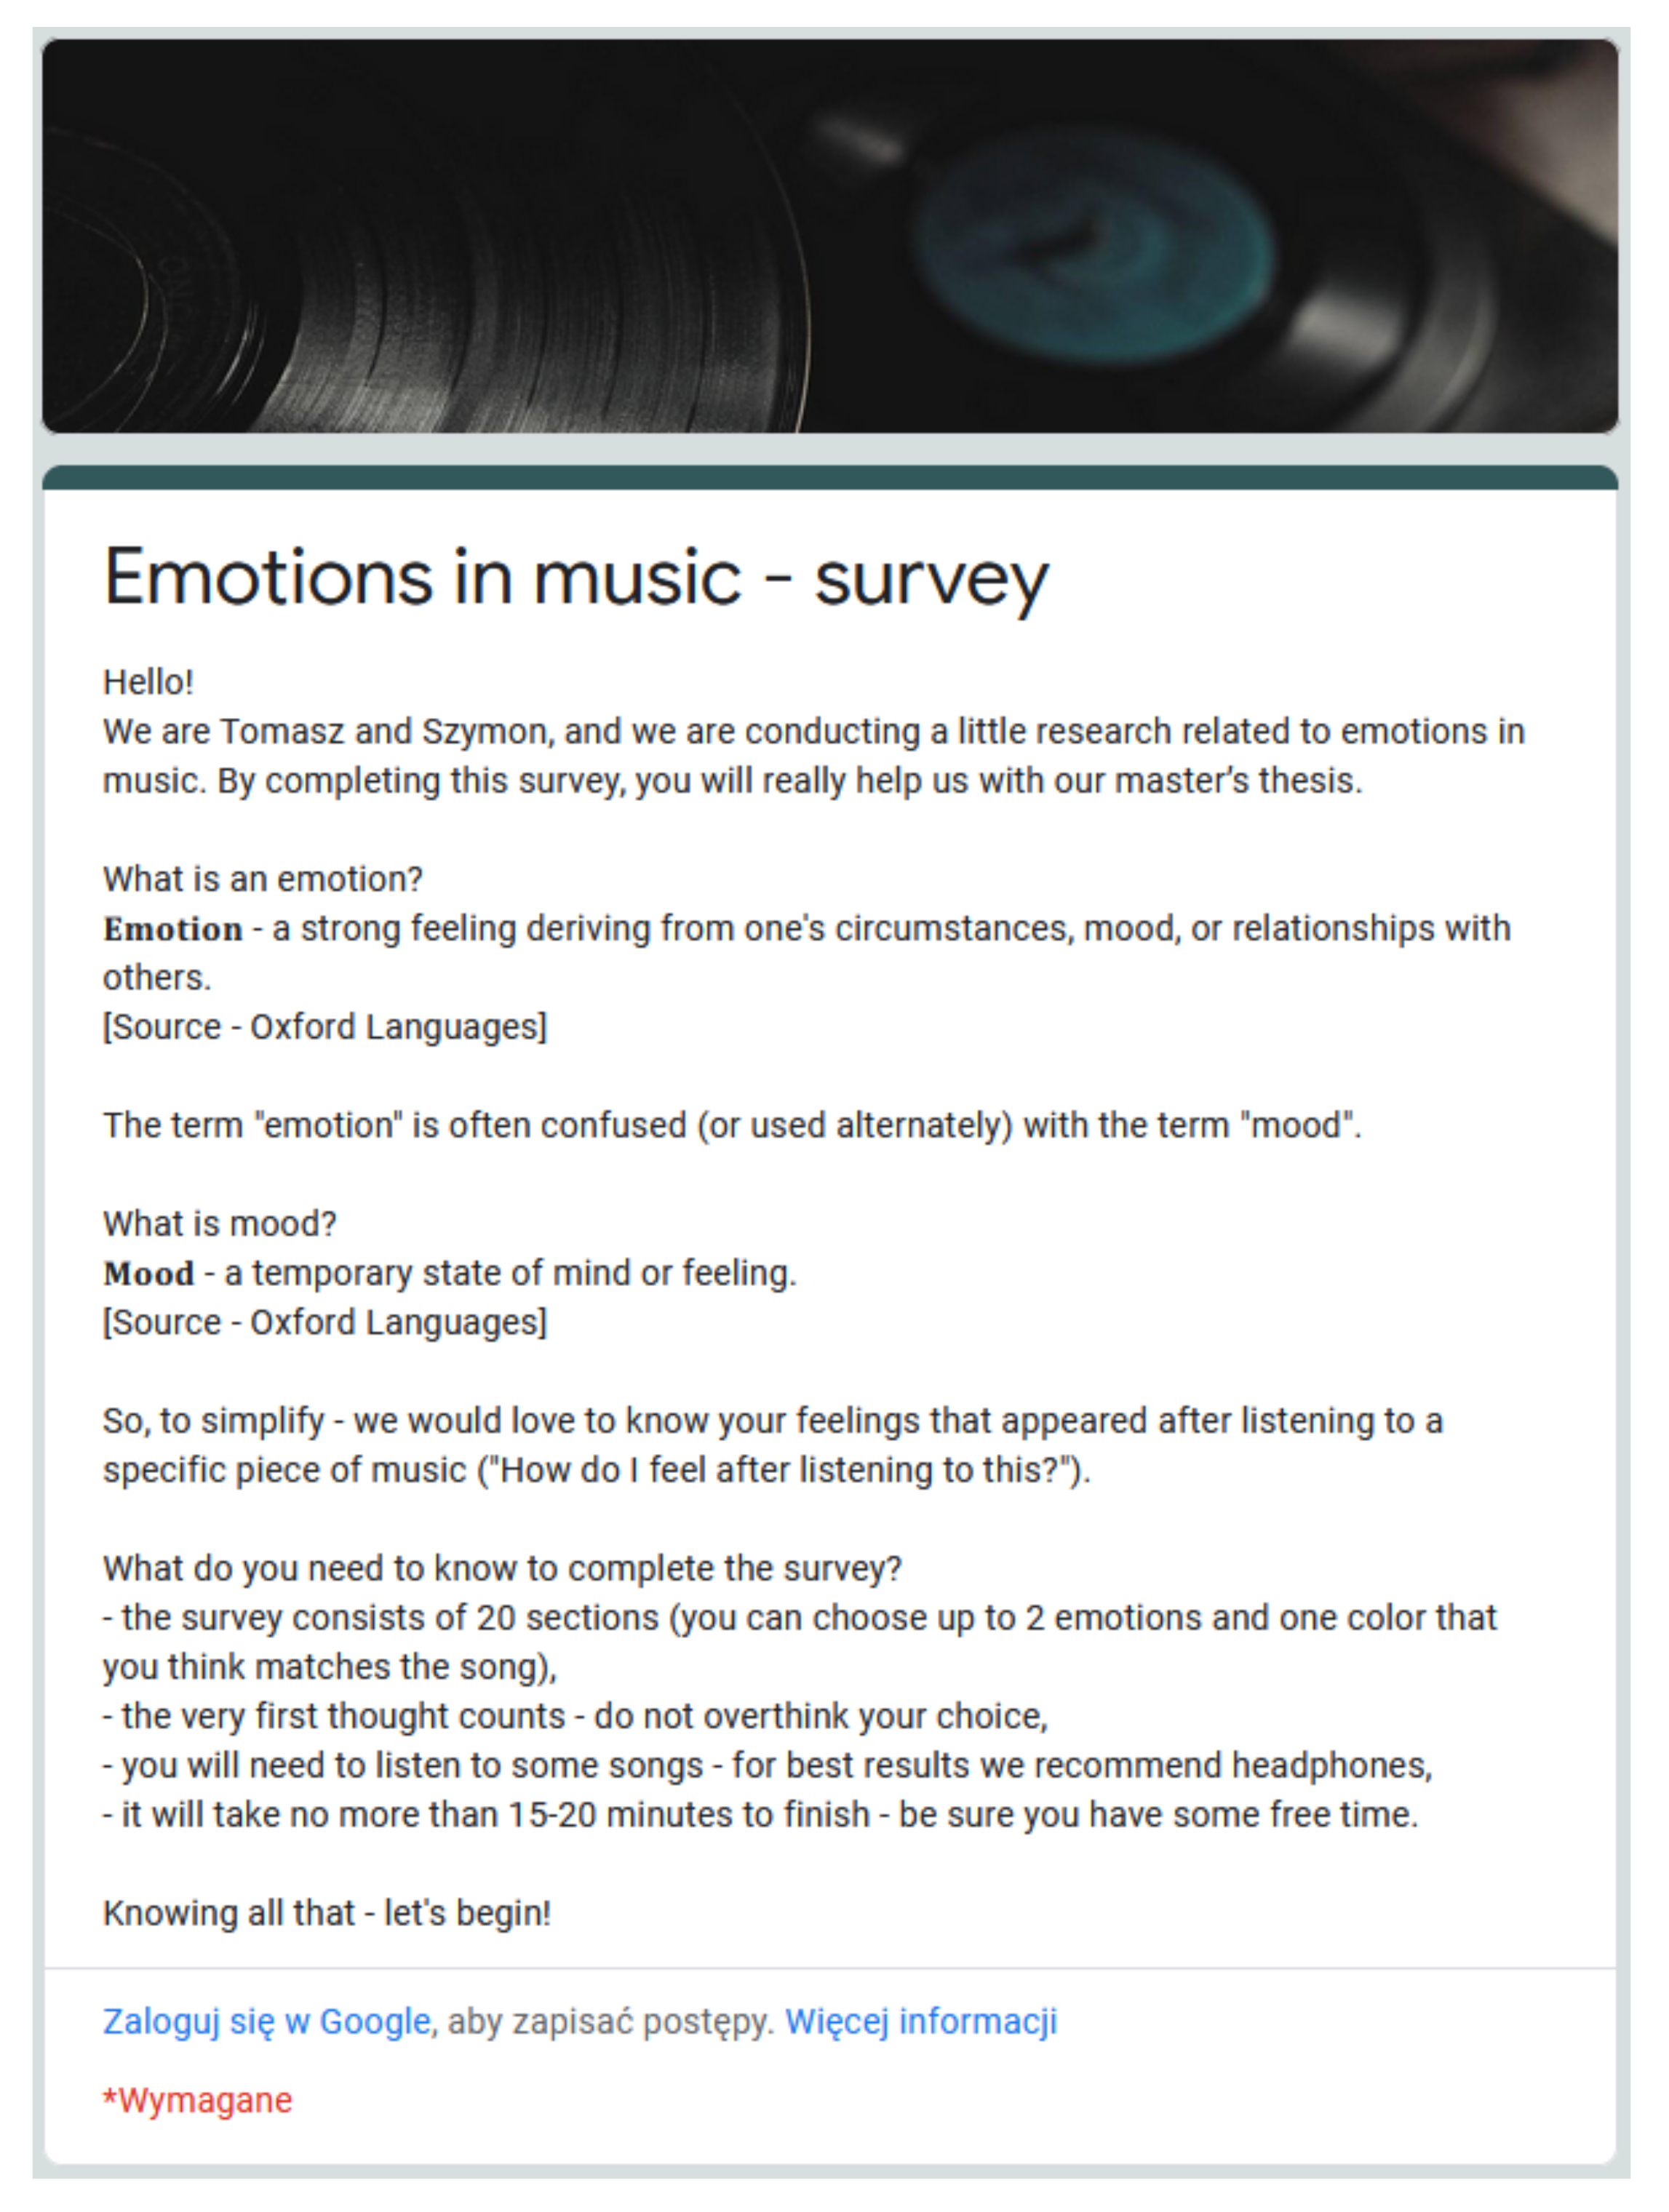
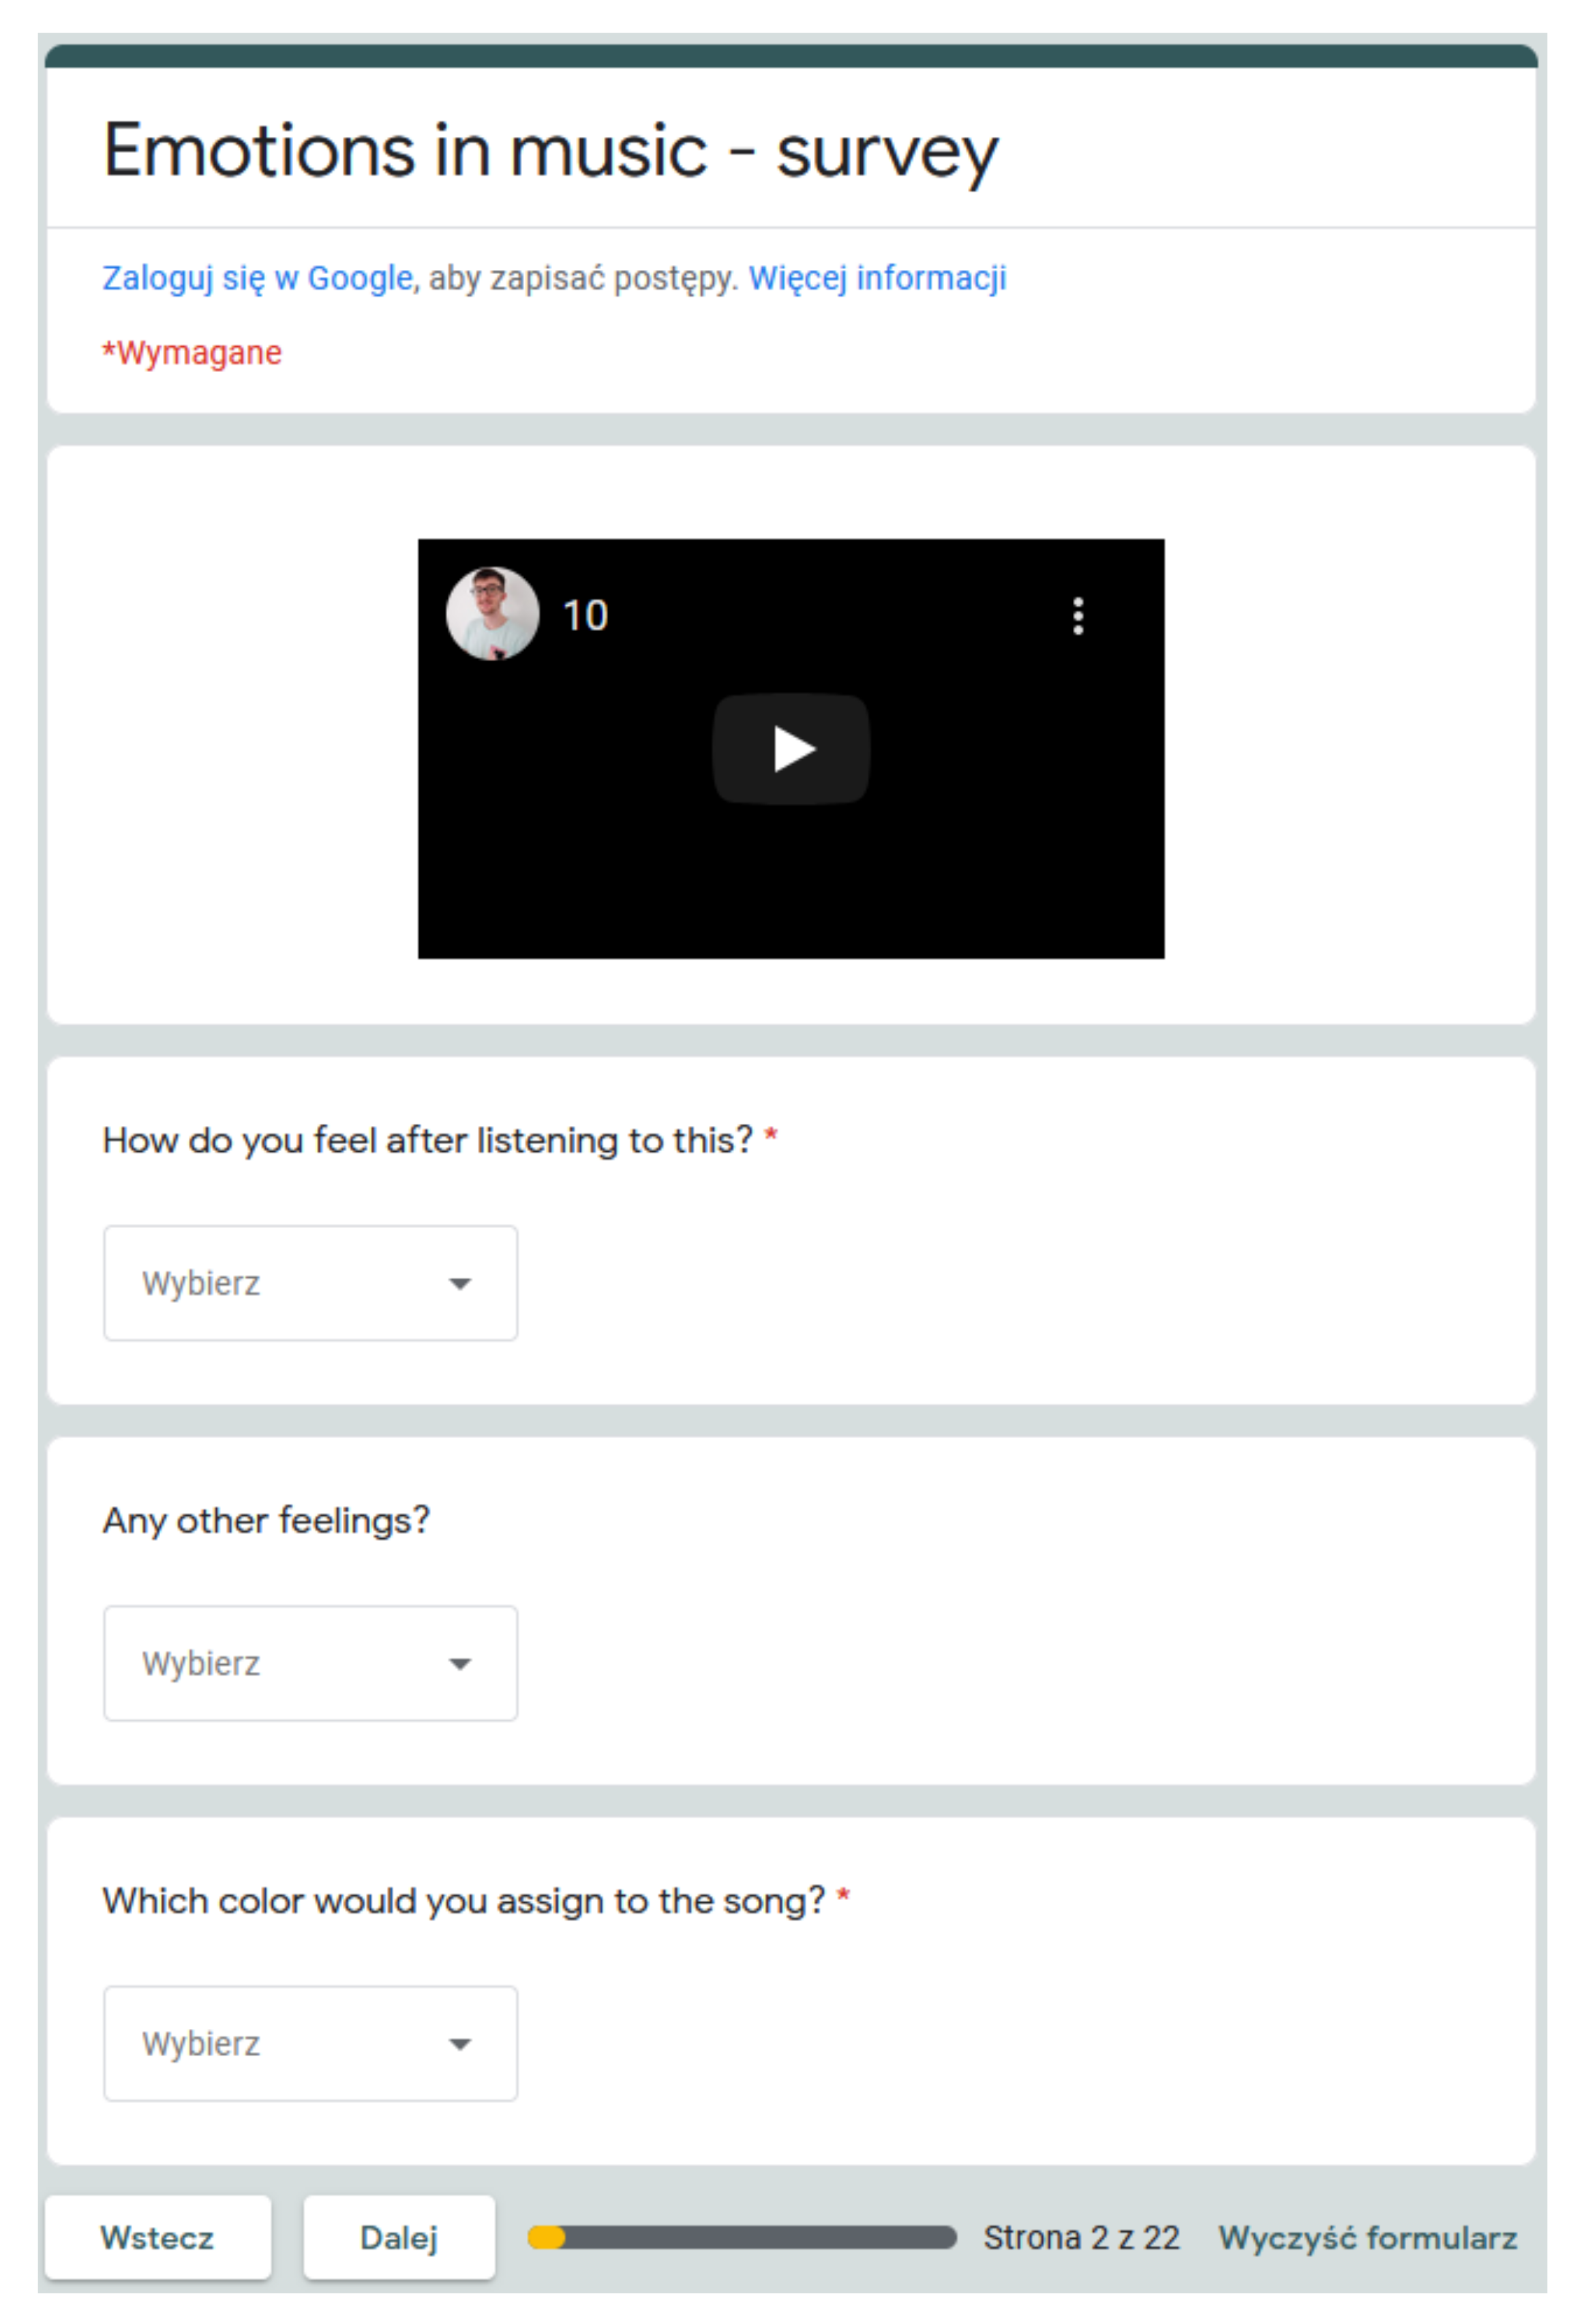
3.1.2. Survey Preparation: Music Dataset and Questionnaire Form

The main criterion for selecting music film tracks was getting music tracks of high quality (.wav file). For the experiment, music pieces were selected from the Epidemic Sound online database [51]. This dataset allows for searching music based on the class of emotions/mood. Music pieces from the Epidemic Sound database were selected subjectively based on listening to dozens of songs from each class and selecting the best representations of mood data, qualifying them for the creation of the survey and the dataset needed for training the algorithms. Music pieces from 19 different moods were chosen from the database, and then, the adjectives describing the songs were remapped using the created online survey [54].
The questionnaire form was constructed with the use of Google Forms in two variants (hereinafter referred to as A and B); each variant contained 21 sections, which allows the respondents to complete the survey within 20 min. All survey participants gave their consent to include their responses in the study. In Figure 4, Figure 5 and Figure 6, the constructed web survey user interfaces are shown.
In the first part of the questionnaire, the respondents specified their age, experience with music, and gender. In the following 20 sections, the respondents answered the question related to listening to the 15 s fragment of the studied piece:
  • How do you feel after hearing this?—possibility to choose: one of the nine emotions from the assumed model;
  • Any other feelings?—optional answer, also one of nine emotions from the assumed model to choose from;
  • What color would you assign to the song?—possibility to choose: one of the nine colors of the assumed model.
The respondents received random variants of the questionnaires (A or B). These variants were generated in order to collect a greater variety of responses. In addition, so-called anchors were included in the questionnaires, i.e., pre-defined answers in line with the theoretical approach; if for two of the four anchors, the respondents’ answers were contradictory, such a record was not taken into account.

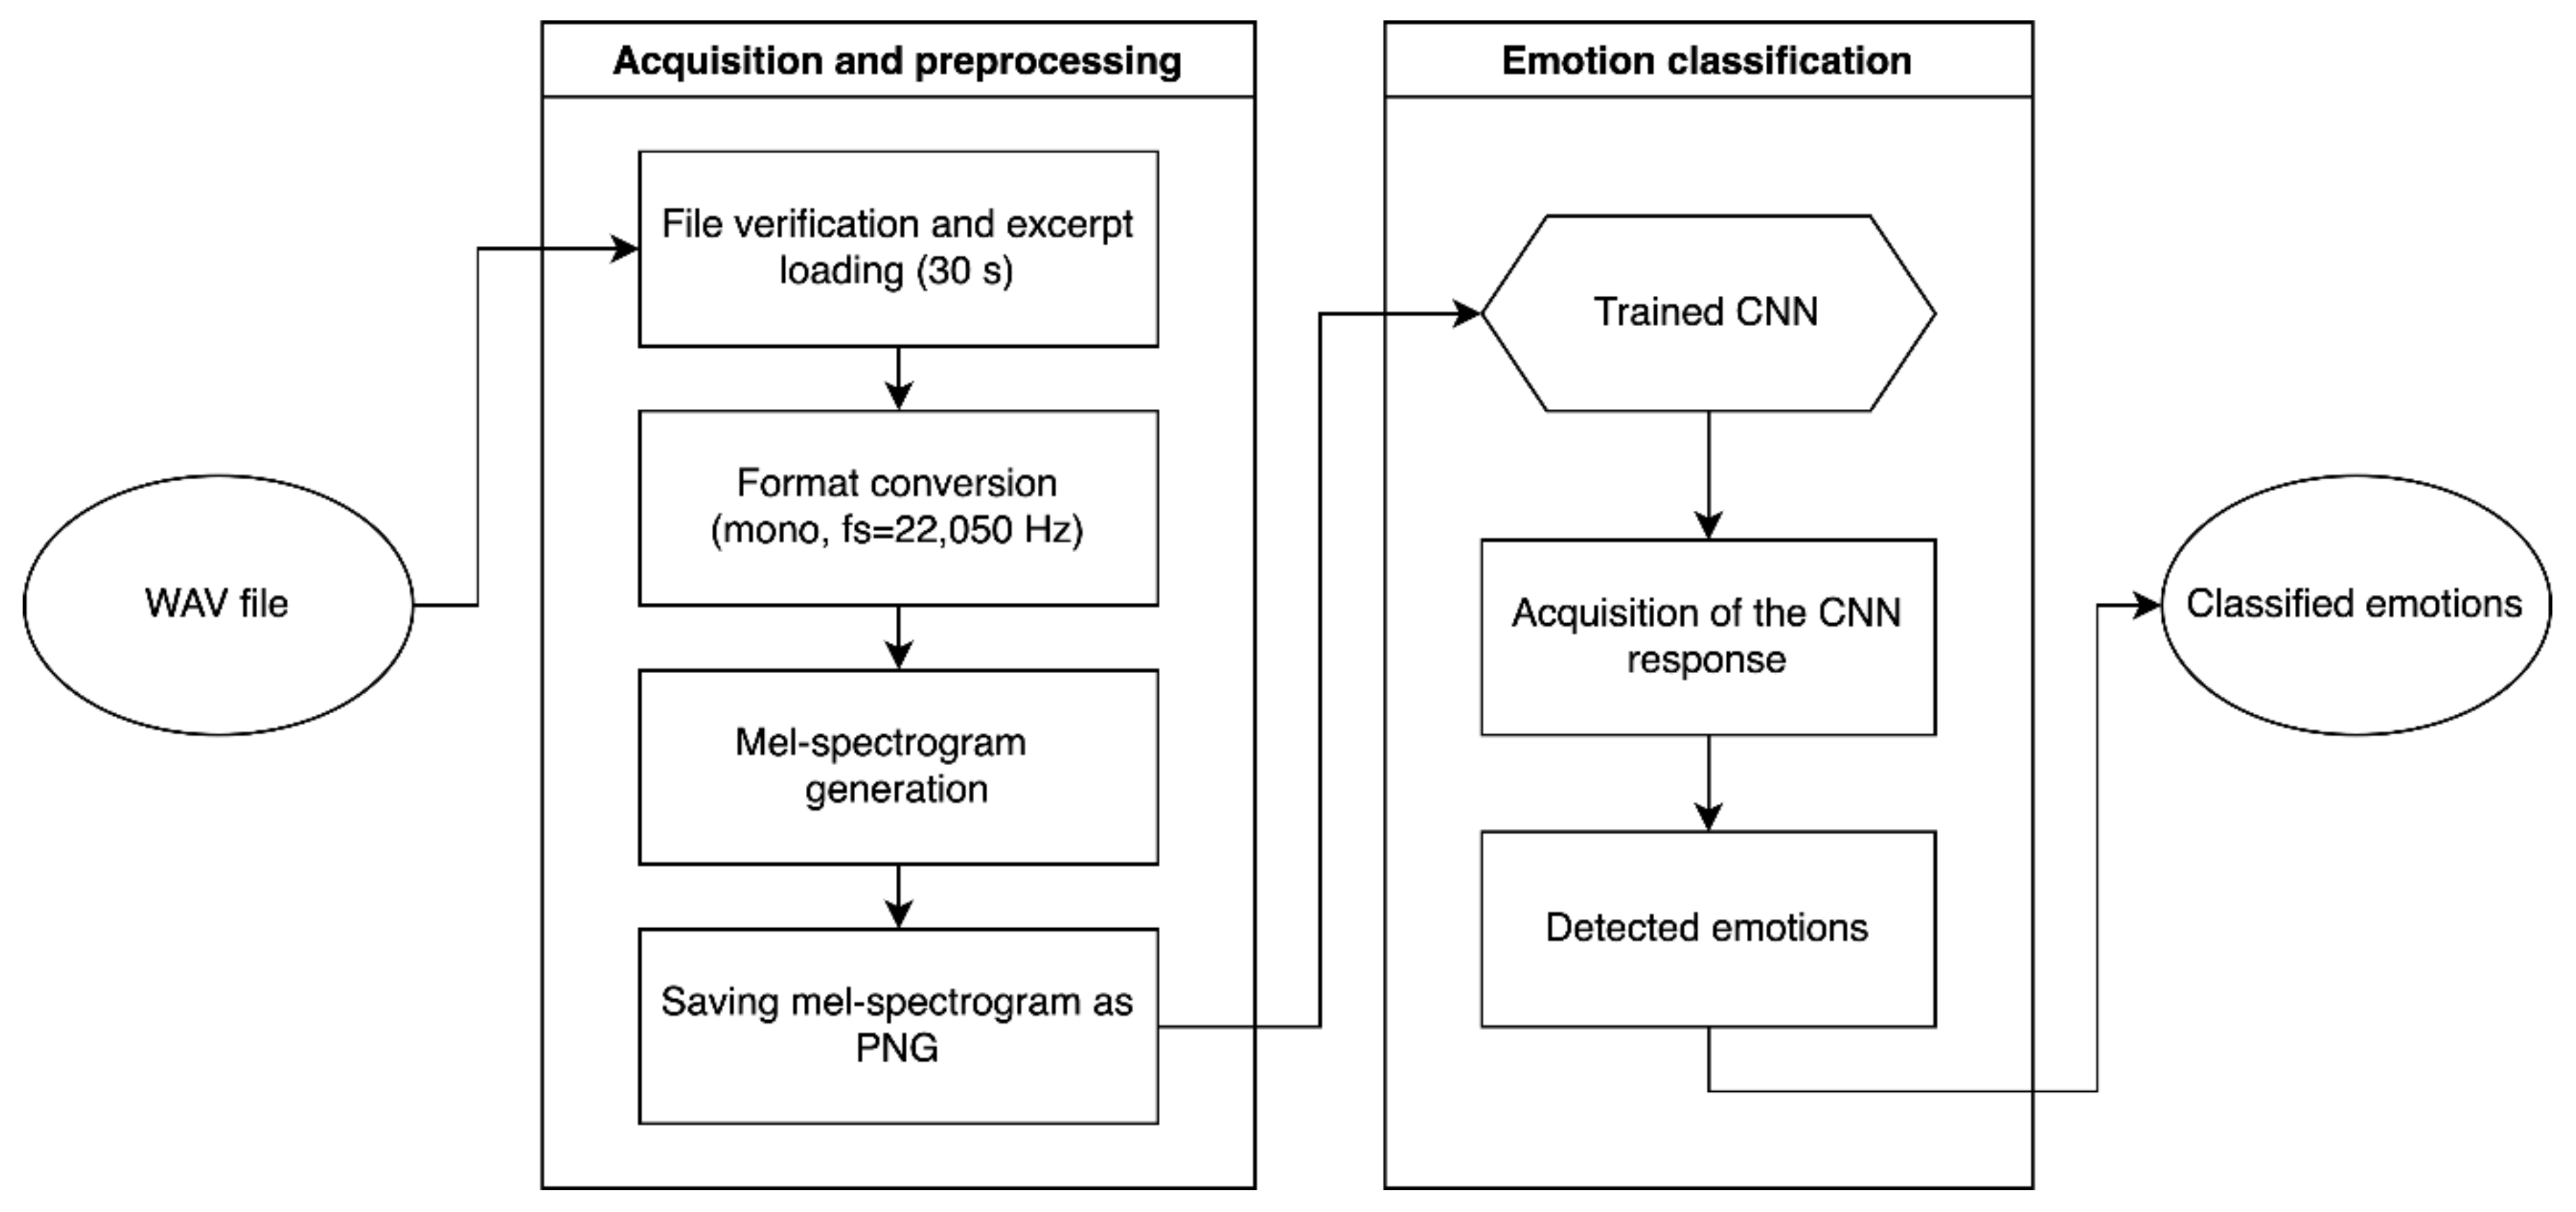
3.2. Automatic Emotion Classification in Film Music

The implementation of the emotion classification algorithm in film music was divided into several stages. The first one was the preparation of data gathered from the results of the survey—it allowed the selection of tracks used to generate a set of 2D representations, i.e., mel-spectrograms, for the process of training and testing the network. In the next step, several neural networks were tested to select the most suitable deep learning model for the emotion classification task. The last step describes the process of constructing an application to use the implemented classification system.

3.2.1. Choosing Data and Programming Language Environment

The Python language was chosen as the programming environment with which the Keras and Tensorflow platforms integrate. After selecting music pieces from the music database, pairs of emotion descriptors were assigned to them, as seen in Table 2.
Among the available music pieces from the Epidemic Sound database, 420 were selected; they were the basis for the construction of the dataset. It was decided to employ mel-spectograms with a logarithmic amplitude scale as a representation of the audio signals. This form of sound representation combines a perceptual frequency scale and a logarithmic scale of the sound intensity level, thus reflecting the subjective way that humans perceive sound.
Then, a script that generates mel-spectograms was prepared. The script allows for setting the width and height of the 2D representation in pixels, the length of the signal window to be analyzed in seconds, and the analysis window shift step in seconds. Each track is uploaded with the sampling frequency Fs = 22.05 kHz. The next step was to assign labels to the generated mel-spectograms. The labels contain information about the degree of membership of each class in the proposed model to the 19 emotions from the Epidemic Sound mood model (see Table 2). Table 3 shows the set size for all generated datasets with different parameters.
Each of the sets was prepared for three sizes of 2D representations: 224 × 224, 299 × 299, and 331 × 331. Six of the seven datasets contained mel-spectrograms representing 30 s of music fragments.

3.2.2. Choosing Neural Network

The motivation behind using CNNs was three-fold. First, CNNs can lead to improved performance by allowing a parallel computation of results. CNNs have sparse interactions, which are accomplished by making the kernel smaller than the input, so we rely on the architecture and characteristics of CNNs. However, more important was employing mel-spectograms with a logarithmic amplitude scale because such a representation can reflect the subjective way that humans perceive sound. CNNs are mainly used in image-related problems, where the data can be represented as a 2D matrix, so such neural networks use convolutions where the result is a map of features—features that may be imperceptible to the human senses and difficult to extract but that can provide critical information about the musical excerpt being analyzed. Furthermore, the third aspect considered was the size of the training, validation, and test sets, i.e., raw audio samples require significantly more space than images.
As already mentioned, the main criterion for selecting a neural network was the possibility of assigning a 2D representation to the input. Moreover, the already existing network model had to be modifiable to detect nine classes of emotions—this assumption was especially true for the last layer of the dense architecture. From the networks available on the Keras platform, five were selected [55]:
  • Xception—the size of the input image 299 × 299;
  • VGG19—the size of the input image 224 × 224;
  • ResNet50V2—the size of the input image 224 × 224;
  • NASNetLarge—the size of the input image 331 × 331;
  • Inception V3—the size of the input image 299 × 299.

4. Results and Discussion
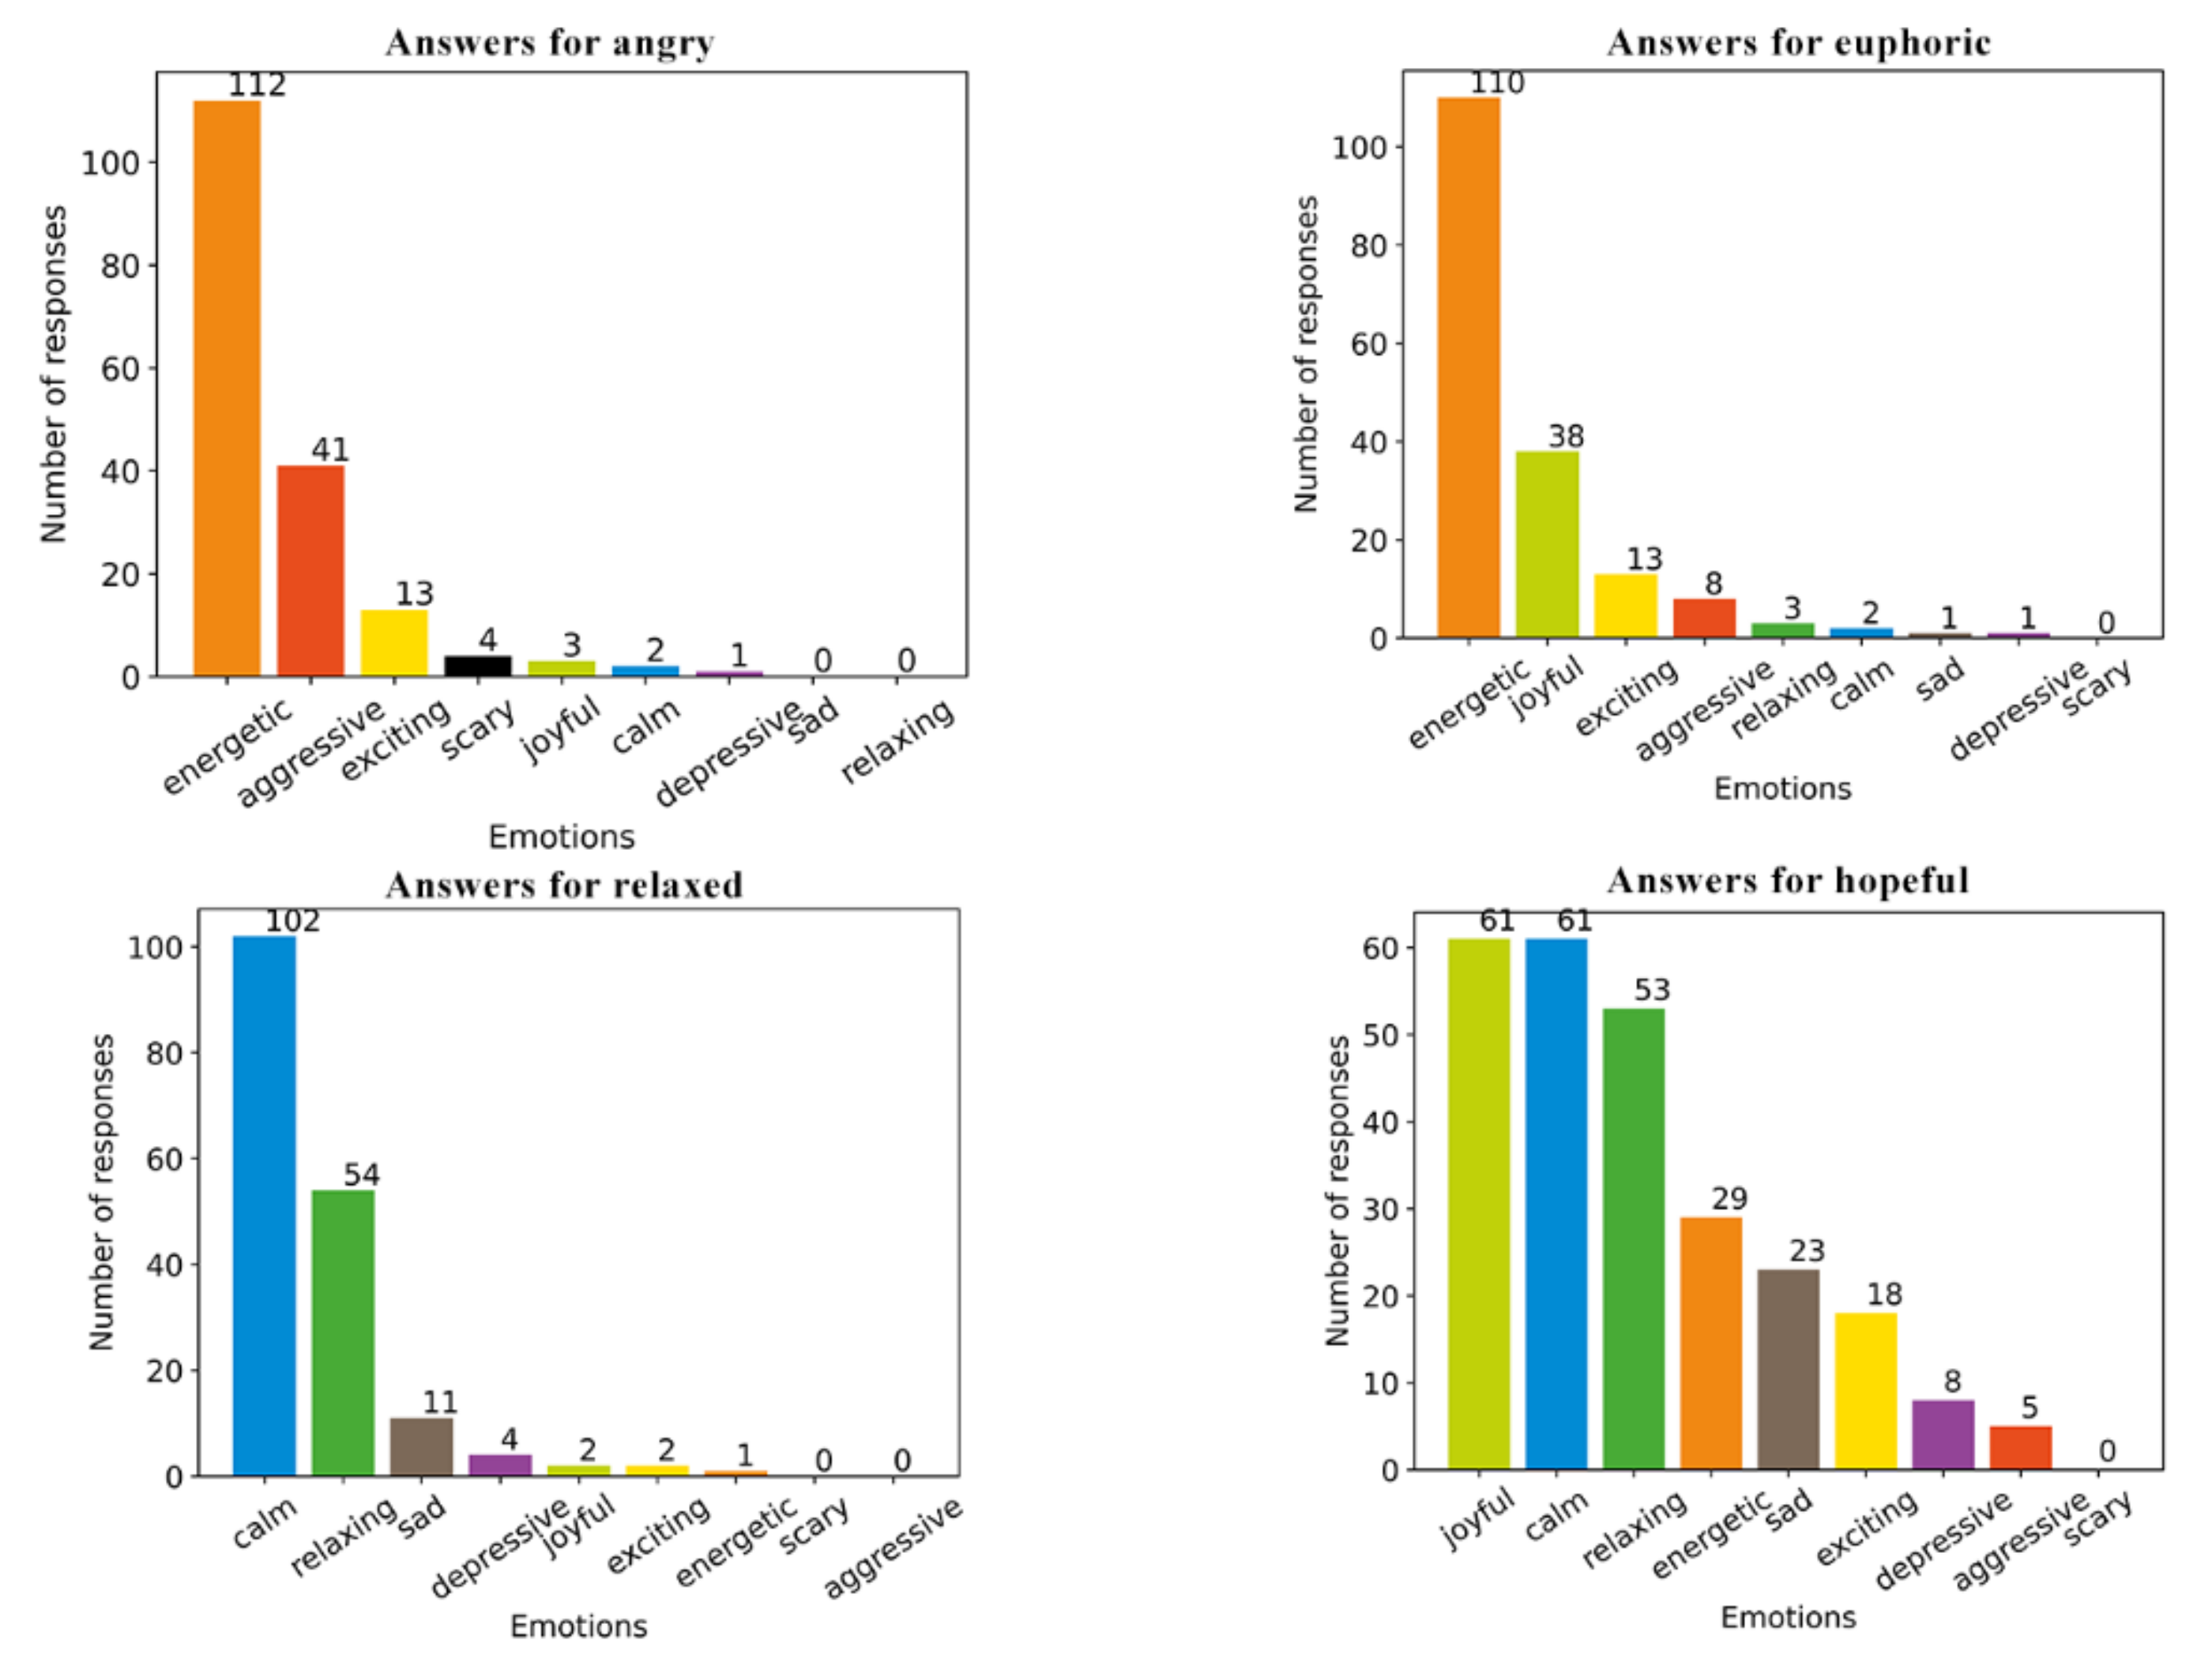
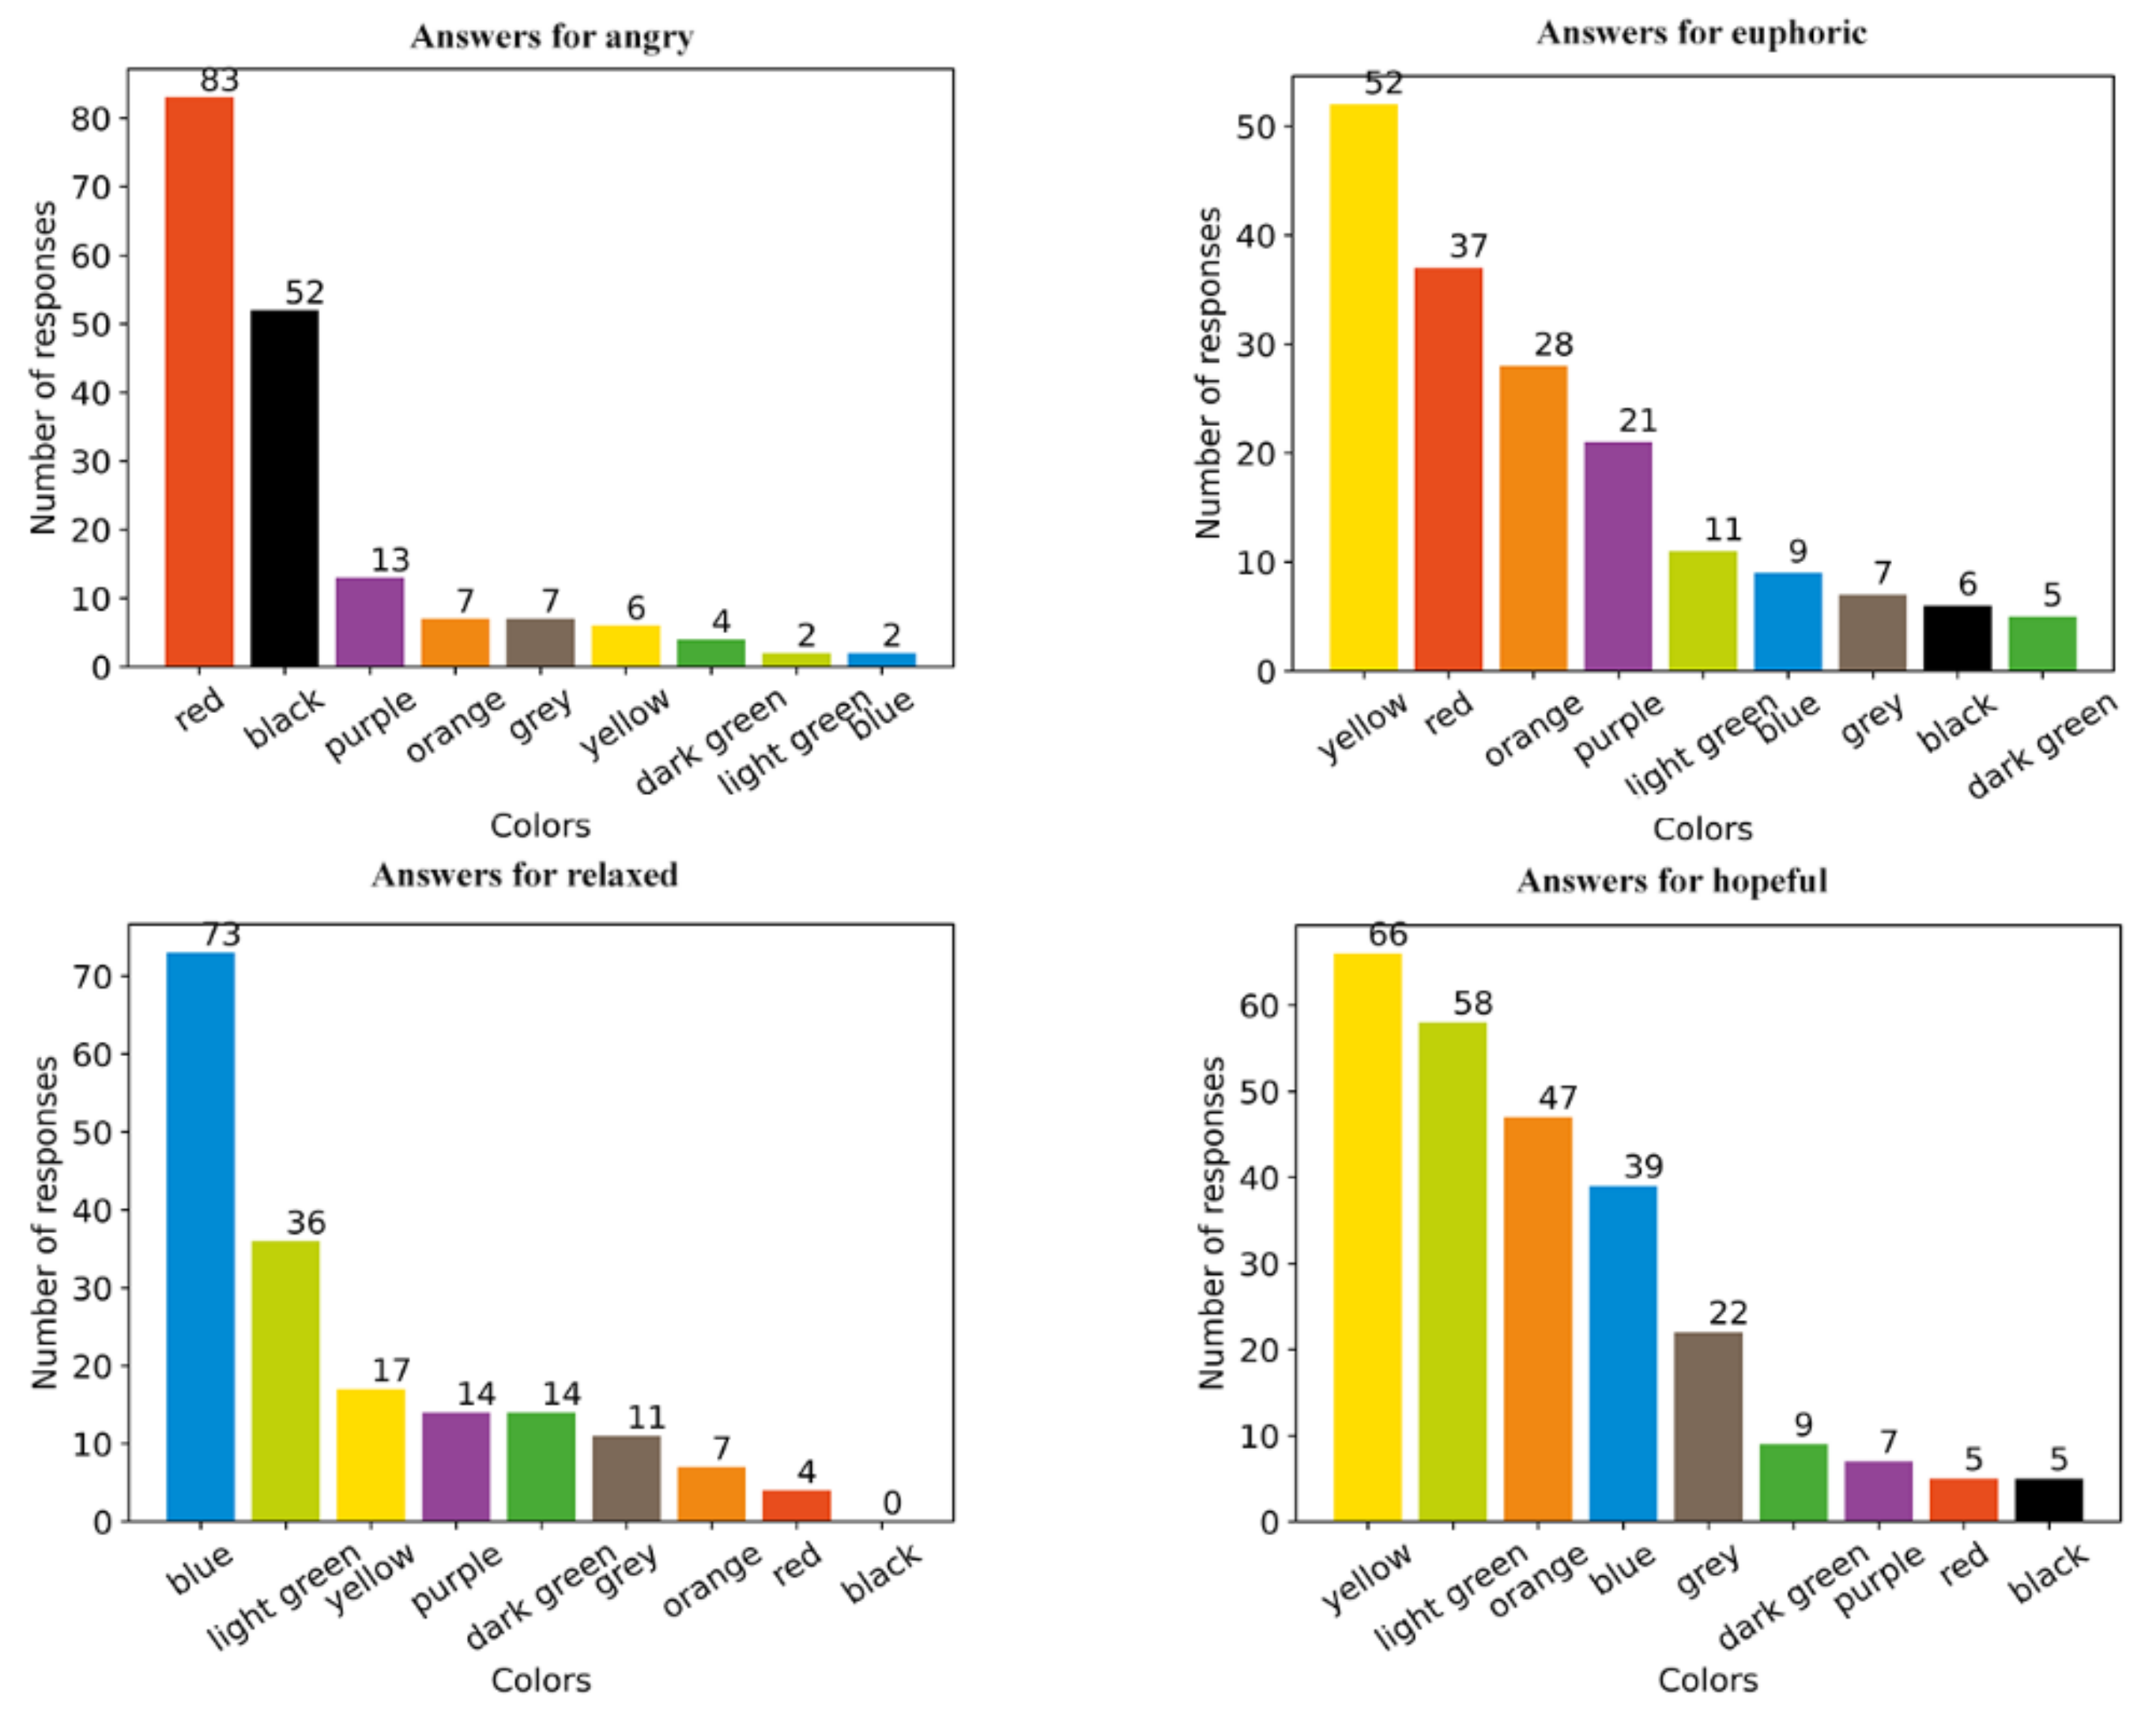
4.1. Survey Results

In total, 180 respondents participated in the subjective tests, of which four records were eliminated due to anchor failures. The analysis was performed for the total of questionnaires A and B. In the first step of the investigation, answers to the question “How do you feel after listening to this?” were summed for each of the 19 emotions studied. Similarly, summing was also performed for the question about colors. The participants’ answers for several emotions are shown below, i.e., in Figure 7—histograms of the responses for matching emotions with Epidemic Sound, and in Figure 8—histograms of the responses for matching emotions with colors.
Emotions from the Epidemic Sound database were gathered and normalized to the range [0, 1] in matrix form, thus obtaining the labels used for training, validation, and test sets.
In Table 4, the mapping of the emotions from the Epidemic Sound database to the proposed mood model is shown. The labels correspond to those contained in the Epidemic Sound dataset. This table should be read through the values contained in the rows as they signify the relationship between both emotions models. The rows represent the emotions from the Epidemic Sound dataset; the columns represent the emotions from the color model. The emotion (shortened) labels contained in Table 4 are given in Table 5.
The chi-square test was used to indicate statistically significant differences in emotion–emotion pairs from the 19 selected emotions from the Epidemic Sound database. The test result aided in the later selection of songs in the training and testing processes. The results of the chi-square independence test were presented in a triangular matrix (see Table 6); the first three letters of the emotion name are the same as in Table 5. Pairs of emotions marked with “X” denote no statistically significant differences between them. The significance level α was assumed to be 0.001 because we decided that the standard value of 0.05 was not discriminating enough. That means, e.g., that mysterious may be identified as sneaking and dark, and floating as laid back and sexy.
Pearson’s r correlation coefficient was used to test the correctness of the color-emotion connection in the proposed model. This test checked the strength and direction of the correlation between the studied variables. In order to carry out the emotion–color comparison, the occurrences of emotions from the proposed model were counted for each of the mapped emotions from the Epidemic Sound database [51], as well as for the colors. Both groups of counts (emotions and colors) were compared in pairs on a peer-to-peer basis, thus checking both the correctness of assigning the colors to the emotions in the proposed model as well as the correct emotion–color connections. The test results are shown in Table 7; the values in the table correspond to the Pearson’s correlation coefficient r. The diagonal of Table 7 shows the values of the r coefficient for the combination of emotions and the color used in the model.
The r value is interpreted as follows:
  • [0; 0.3]—weak correlation;
  • [0.3; 0.5]—moderate correlation;
  • [0.5; 0.7]—strong correlation;
  • [0.7; 1]—very strong correlation;
  • If r is positive, then the x and y values are directly proportional;
  • If r is negative, then the x and y values are inversely proportional.
Therefore, one can observe that joyful is strongly correlated with yellow, sad is strongly correlated with grey, and there is a weak correlation between calm and yellow.
The results of the statistical analysis of the survey responses indicate the acceptability of the proposed emotion model consisting of the classes energetic, exciting, joyful, relaxing, calm, depressive, sad, scary, and aggressive. They also confirmed a strong correlation between the selected emotions and the colors assigned to them. The selection of the emotion model was a significant and fundamental step for the entire workflow. In fact, the nature of the chosen model dictated the work methodology for the next steps in implementing the classification system. The results also demonstrate that the number of the emotions taken into account could be reduced by discarding the classes depressive (expressed by the sad and calm emotions) and aggressive (included between the exciting and energetic emotions). The addition of the scary feeling and the assignment of the color black turned out to be a proper modification of the prototype of the proposed emotion model.

4.2. CNN Model Training

The accuracy of the trained models was assessed using a test set. The measure of accuracy proposed by the Keras module—binary class comparison for maximum values on the output and label—turned out to be insufficient. Therefore, we proposed our own test based on sorting the values returned by the model in descending order, sorting the label values for the test object in descending order, and checking whether the first three emotions for the values from step 1 are among the first three emotions for the values from step 2. For example: for the list [a, b, c] from step 1 and the list [c, a, b] from step 2, it is 100%, while for the comparison of lists [d, e, a] and [a, c, b], the accuracy was 33%. The test results were supposed to help select the most promising models in the subsequent stages of learning. Thus, some models and hyperparameters were discarded or changed due to poor performance in all training stages.
In the first stage of training and testing of the neural networks (NNs), some models were found to exceed the hardware capabilities available. Thus, VGG19 was discarded, NASNetLarged was swapped for InceptionResNetV2, and the Xceprion input image size was reduced to 224 × 224. After successful training, it was found that for a learning rate of 10−5 and 10−6, it is not possible to minimize the error, and overfitting can be observed for the learning rate 10−6. For these reasons, the vector of the learning rate values was limited to [10−3 10−4]. The assumed patience value turned out to be too small—the neural networks ended the training process too early. Reducing the value of the learning coefficient saved time in the training processes as part of a task with a greater value of patience. In the second stage, it was checked how the change of this value affects the number of epochs achieved by each of the neural networks. Examples of the training outcomes for the second stage are presented in Table 8. Preliminary analysis of the results allowed the learning rate of 10−3 to be dropped.
In the third stage of the training process, the coefficient of 10−4 was selected for each of the networks. In addition, it was decided to check the accuracy of the trained convolutional networks with the use of a different training set. For this purpose, the existing training set was modified—a set consisting of 30 s fragments and a 10 s step was generated (so far, with a step of 5 s), and additional training and testing sets were generated consisting of 15 s musical fragments (with steps of 10 s). Each of the models was trained twice; examples of comparisons of the results of the training processes carried out are presented in Table 9.
In the final stage of training, an additional training set was generated, consisting of 30 s fragments with an 8 s step. The training was performed twice for each of the models:
  • The first time with the patience value of 20, fragment lengths of 30 s, and a step of 10 s—the maximum number of epochs was set to 150;
  • The second time with the patience value equal to 15, the training set with a length of 30 s, and a step of 8 s—the maximum number of epochs was set to 150.
The achieved accuracy values of the algorithms did not increase from stage to stage. Therefore, it was decided to complete the training process after stage four. The network accuracy after stage four is presented in Table 10. Comparison of accuracy measures for the four best models after the fourth stage of the NN training is contained in Table 11.
The model with the greatest similarity to the expected values is the InceptionV3 network architecture.

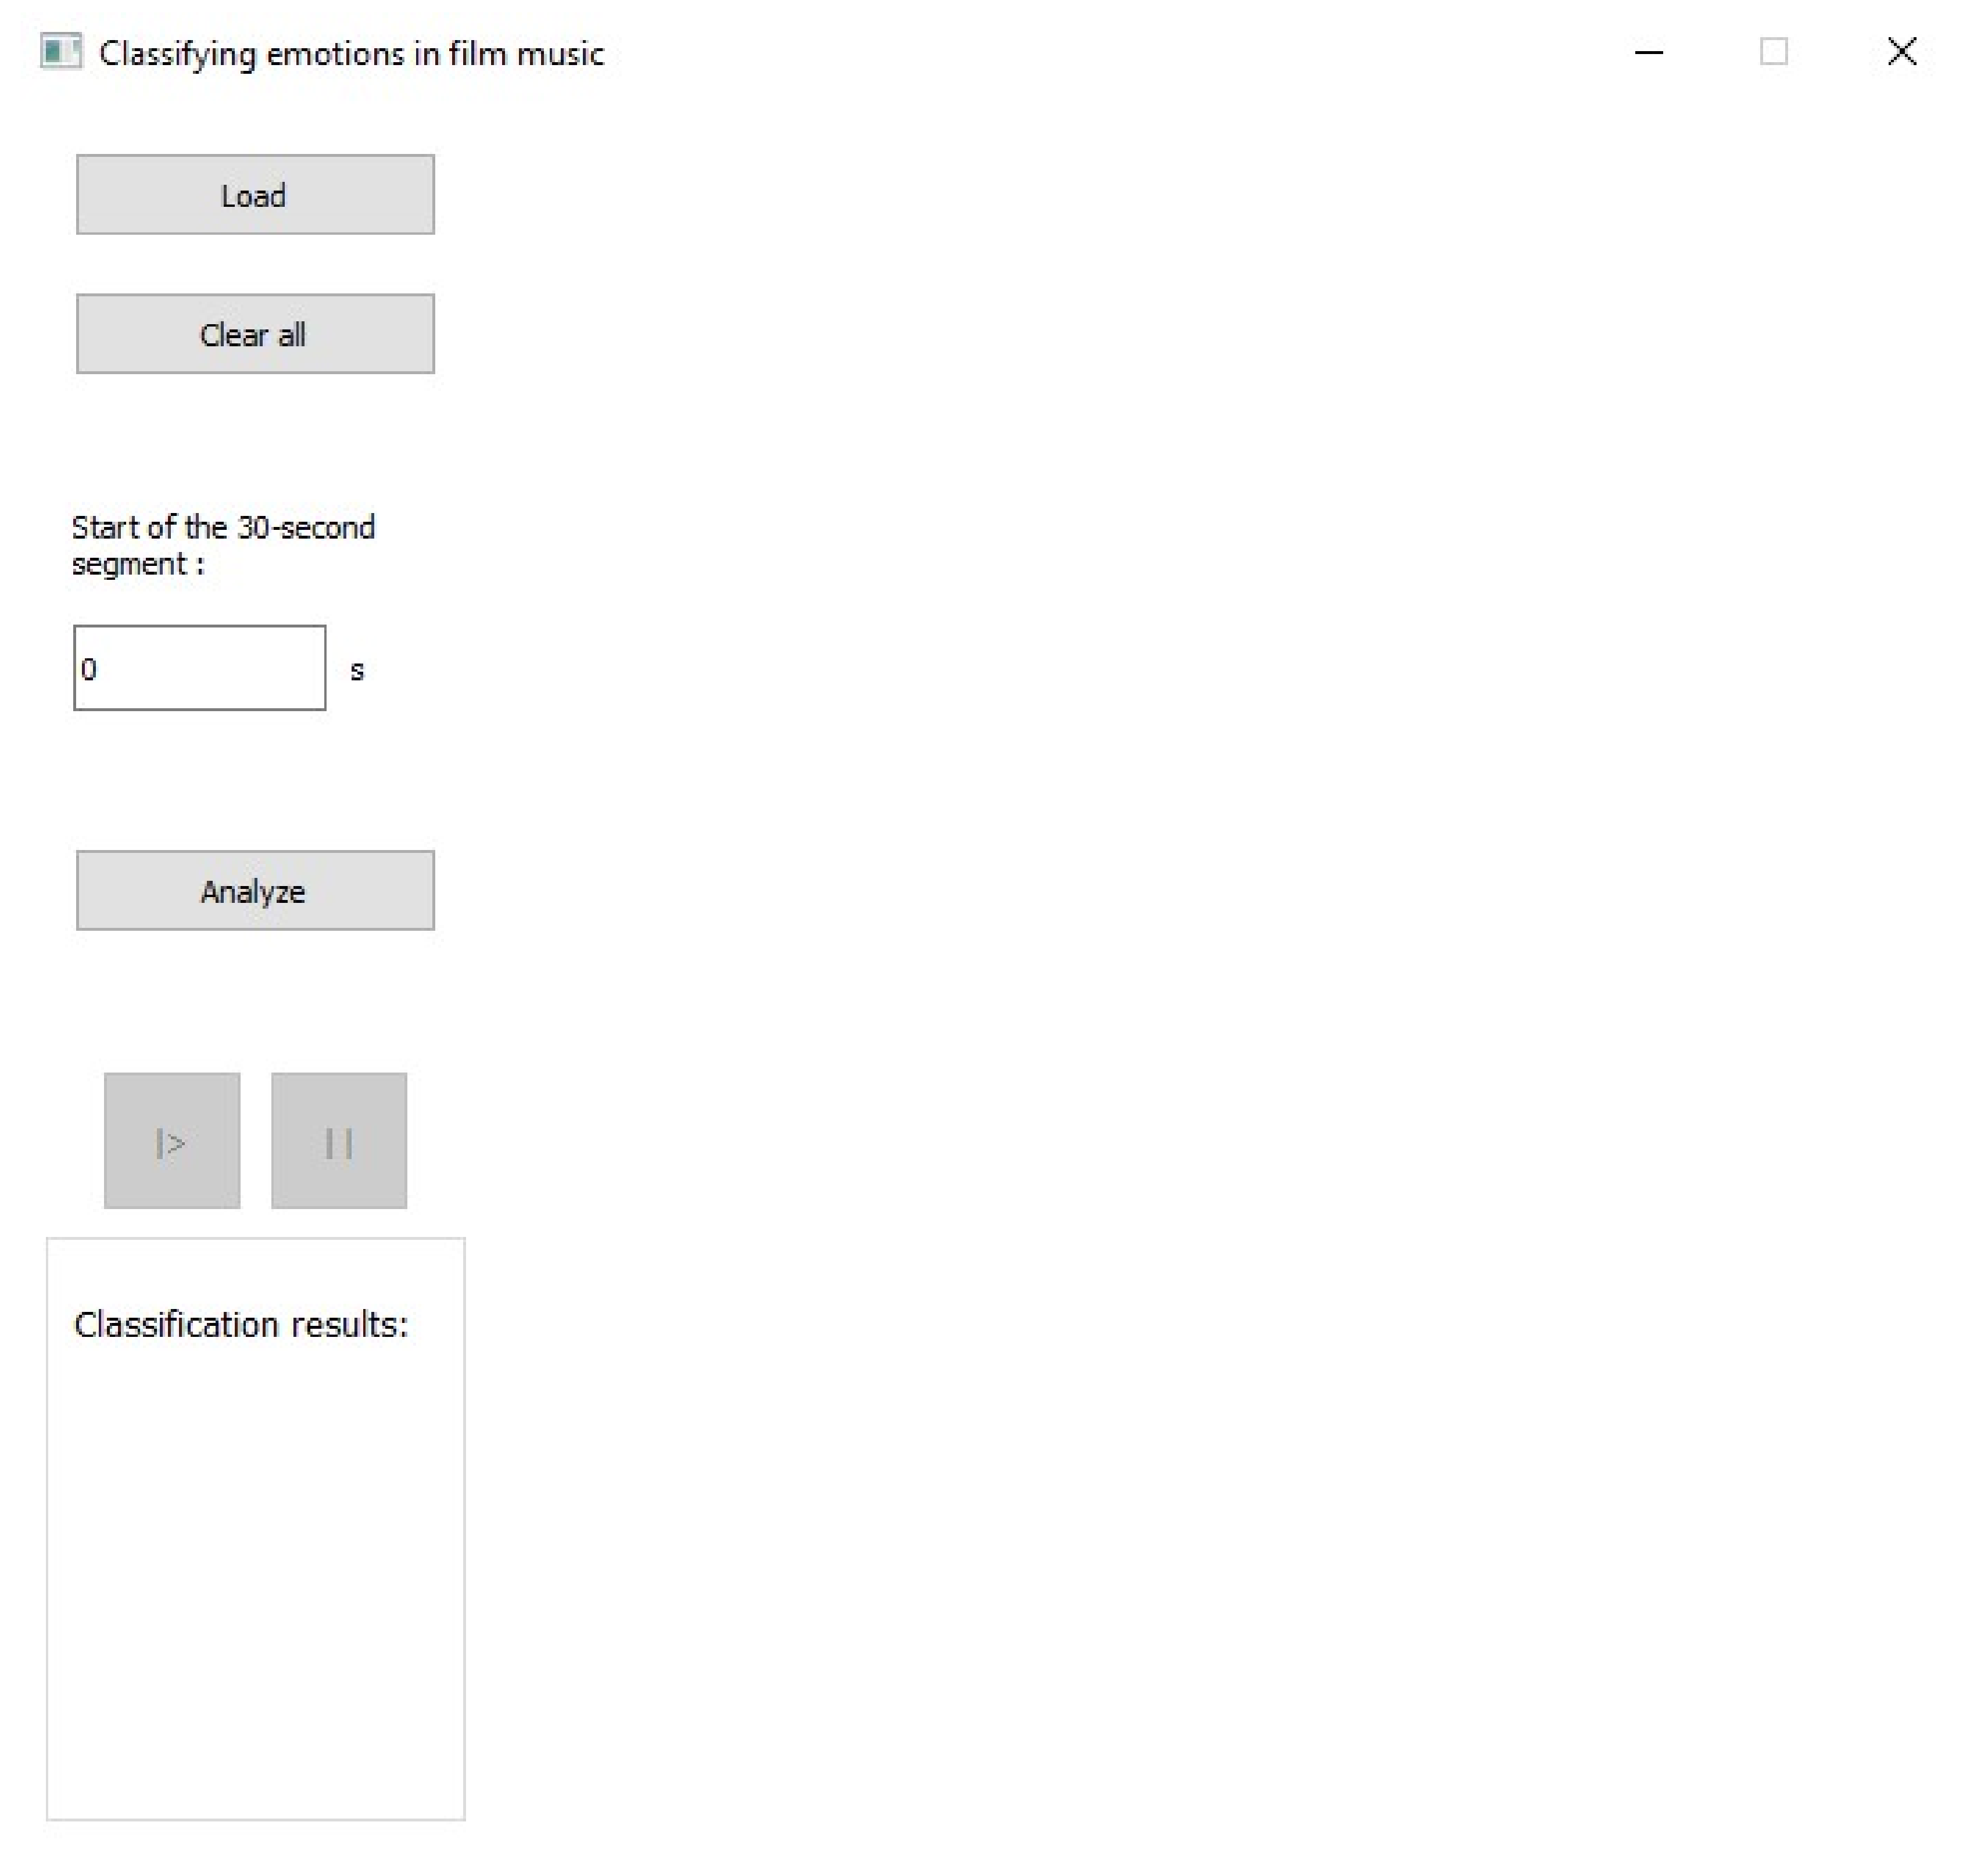
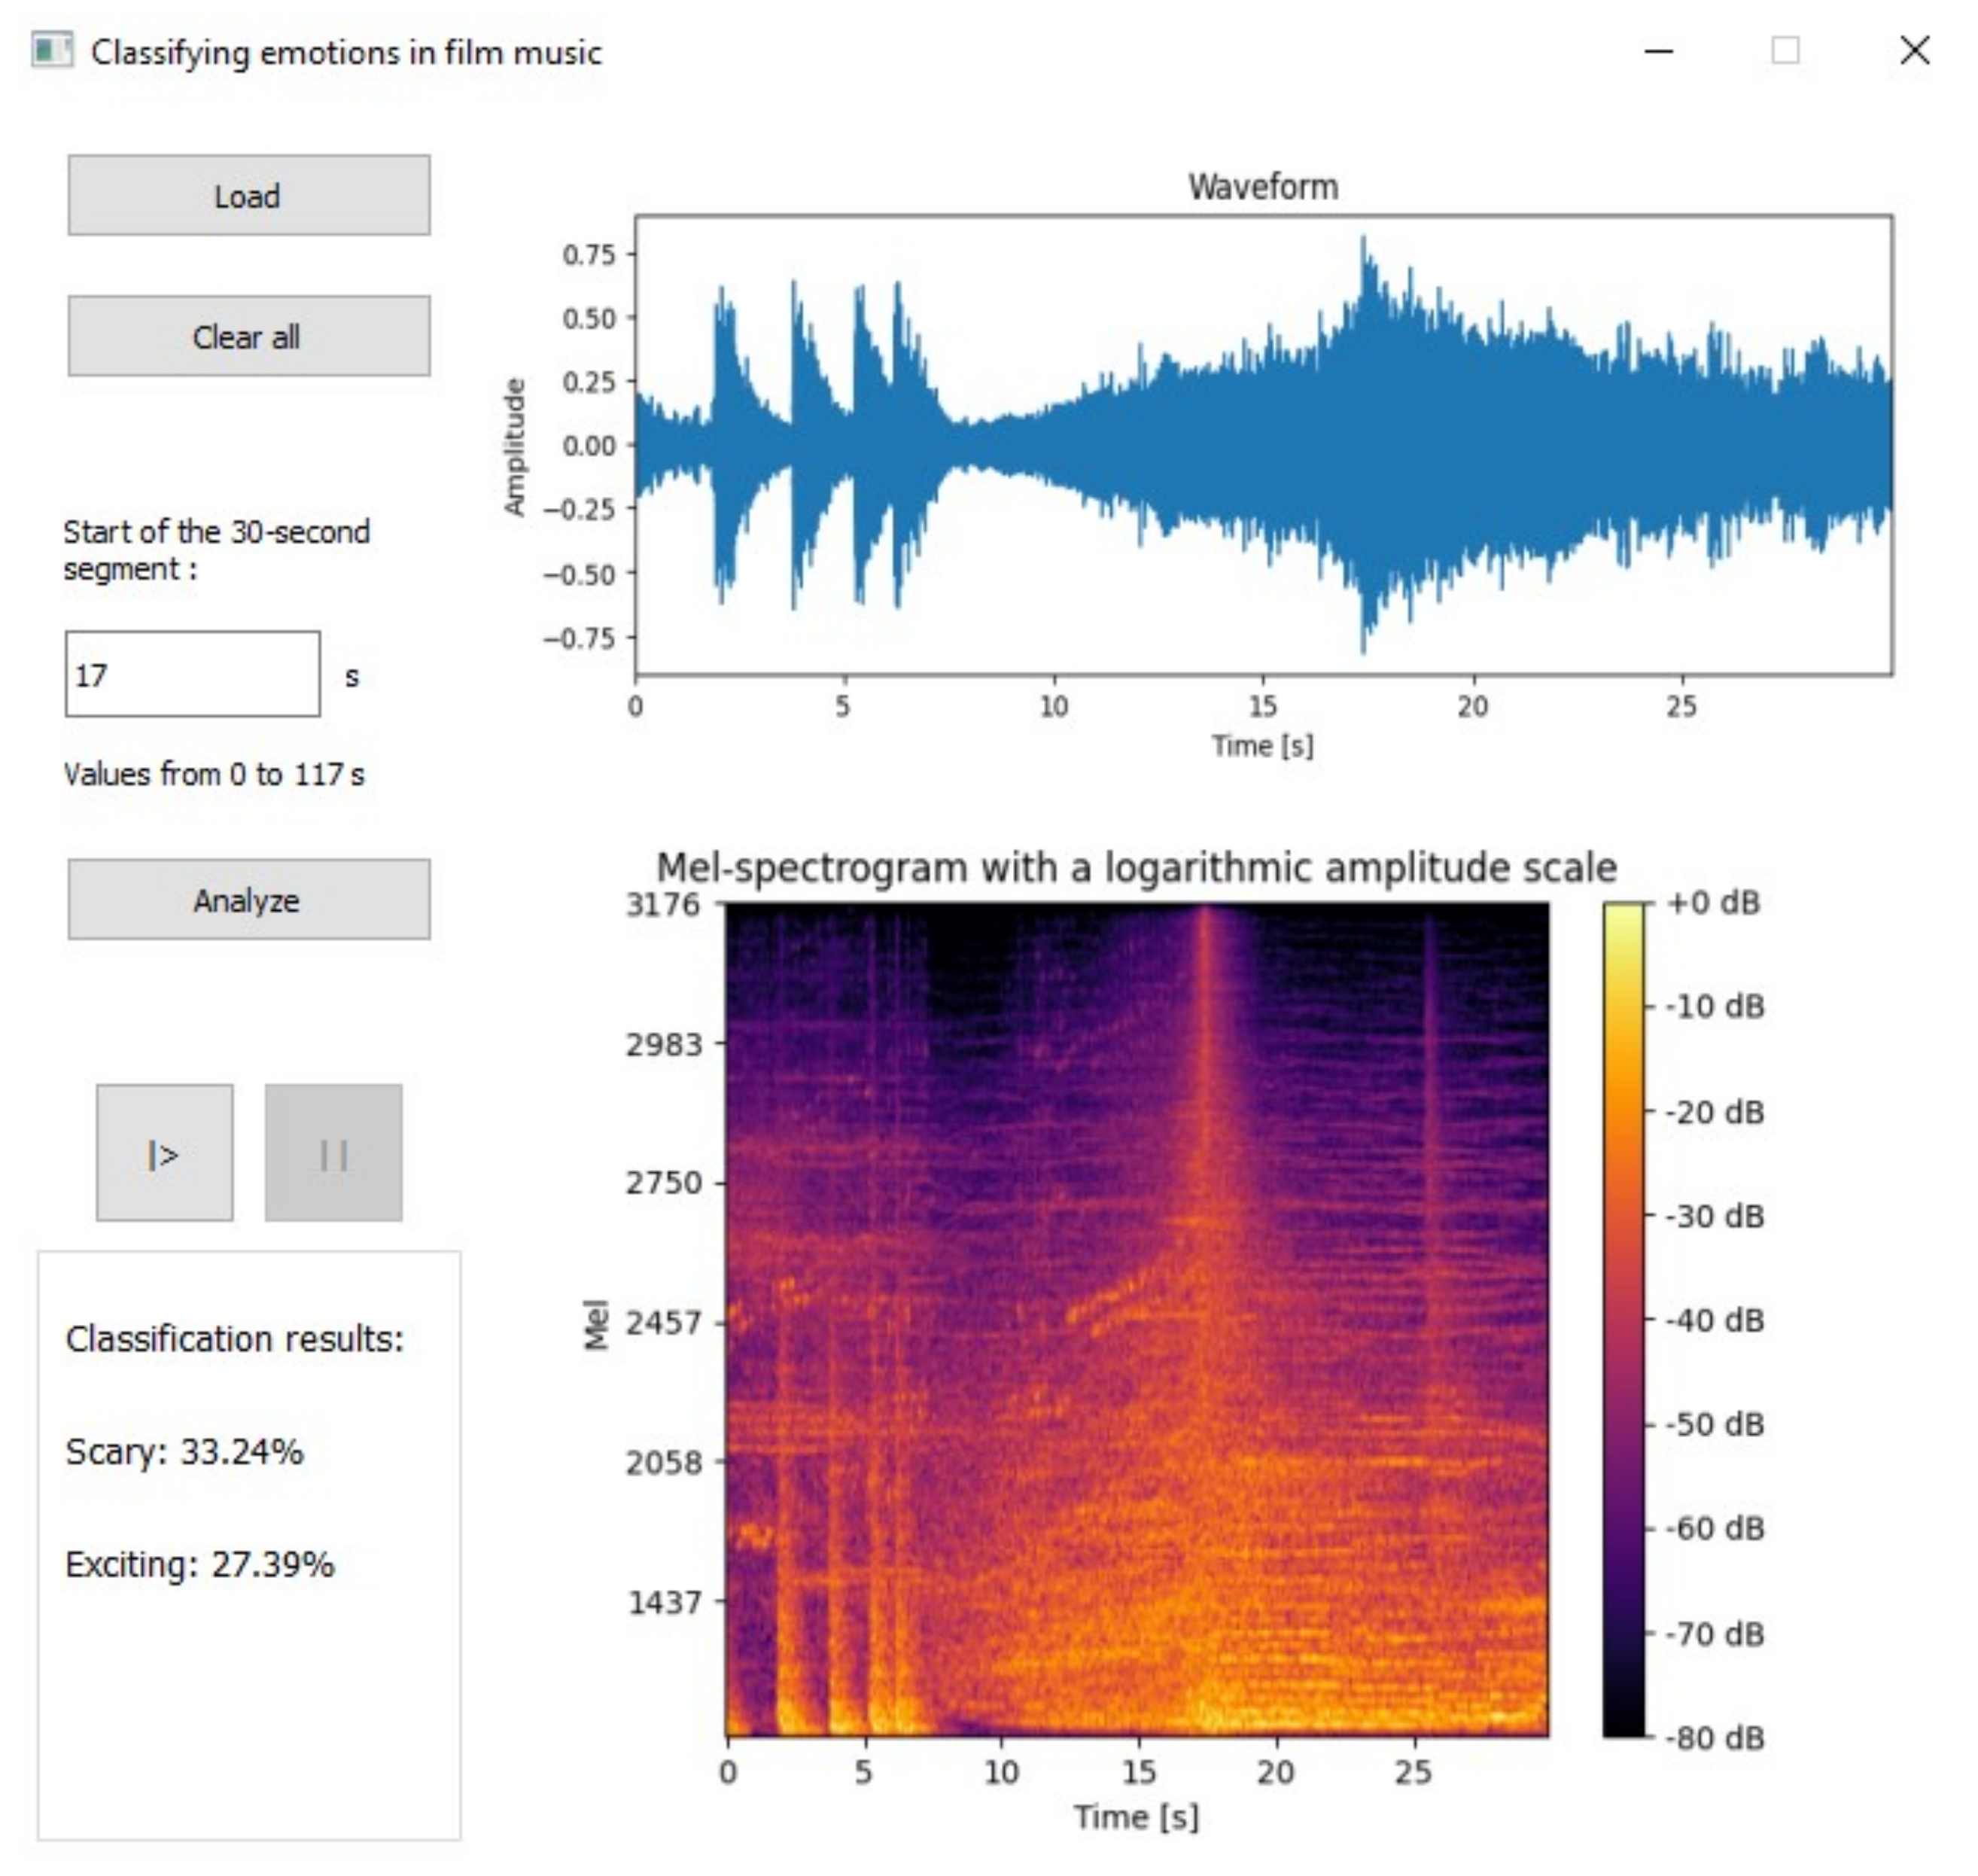
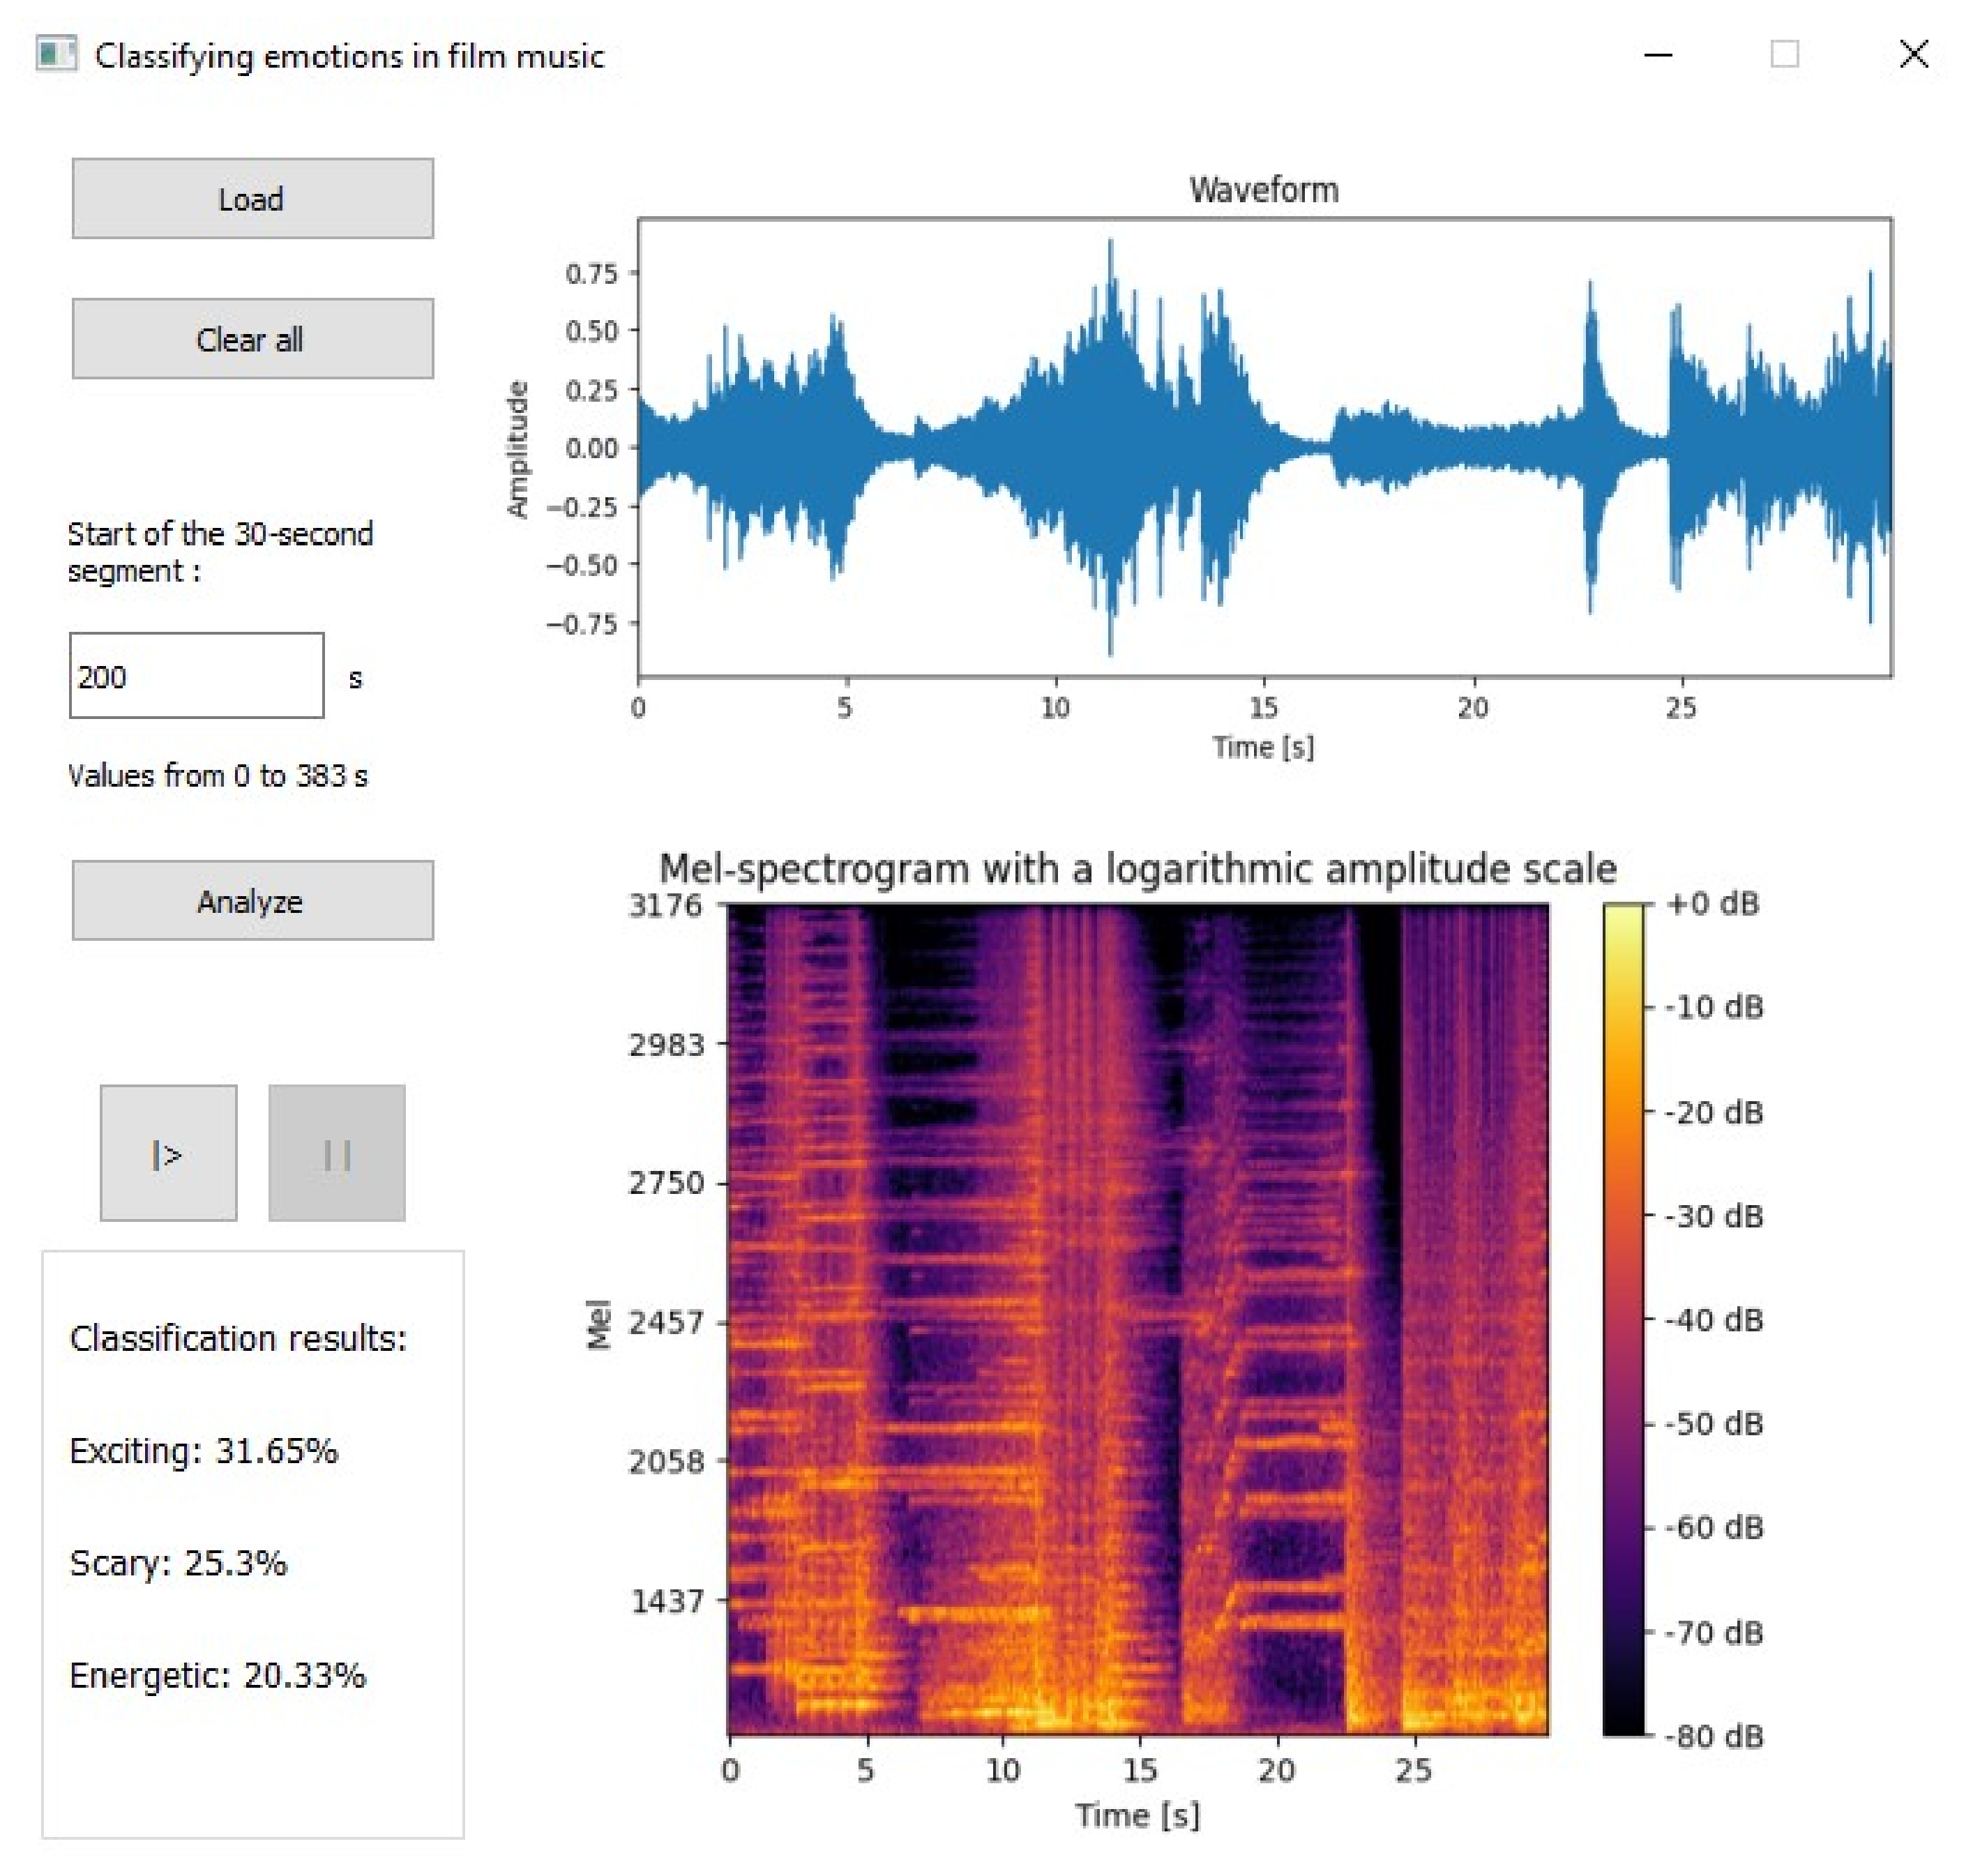
5. Application Construction

The proposed application consists of two main parts: the acquisition and pre-processing stage, and the classification of emotions stage (shown in Figure 9). The entire algorithmic engine is contained in a simple graphical interface. The first step of the system is to verify the uploaded file. The correctness of the file is checked (minimum length 30 s and a .wav file), the file is converted to mono format, and the sampling frequency is set to 22,050 Hz. Then, using the Librosa library, a mel-spectogram with amplitude on a logarithmic scale is generated. The input of the trained InceptionV3 network model is a 299 × 299 PNG image. After its processing, nine values appear in the softmax layer, which represents the degree of assignment of the processed music excerpt to each emotion from the proposed model. Then, the output values are clustered to isolate the three emotions best suited to the song. In Figure 10, Figure 11, Figure 12 and Figure 13, interfaces of the engineered application are presented showing the working principles, i.e., the start window after clearing all data entered (Figure 10), an example of the application window in which a file is open and loaded (see Figure 11), and two mel-spectral signal analyses along with an example of the classification results for two chosen film music excerpts (Figure 12 and Figure 13).
Below, in Table 12, the results of system classification for ten different film music pieces are presented. Informal subjective tests provided emotion assignment as a ground truth.
The system predictions are satisfying regarding its results of classifying emotions from film music compared to the subjective emotions assigned for music pieces. These results should be read as follows, e.g., “African Rundown,” “adrenaline-pumping track” [56] of the Casino Royale movie with the music score by David Arnold, an English composer, contains action cues based on “African rhythm, staccato brass, and tense strings” [56]. So, in such a case, we can easily say that the overall outcome is the sum of partial results assigned by CNN to energetic, exciting, and scary, giving 80.41% accuracy. Analyzing the exploratory results of the application, it can be seen that further work should concentrate on creating a new questionnaire to verify a larger number of musical excerpts through their subjective assessment in terms of the emotions evoked in the respondents and comparing them with the results obtained by the application. Moreover, subjective tests may also be processed employing non-statistical (soft computing) methods as assigning emotion to a given music track should not typically be crisp, referring to only one label [57].

6. Conclusions

In this work, a database of musical works was created, which was used in the process of training and testing a neural network model. This was related to the preparation of an application for automatically assigning emotions to a given film music excerpt. A model of emotions suitable for film music was proposed. Labeling musical pieces was carried out on the basis of subjective tests and a statistical analysis of the survey results. Employing a survey helped to map emotions between our model and emotions from the Epidemic dataset. The results of the statistical analysis of the answers obtained in the survey process proved the acceptability of the proposed model of emotions for film music, consisting of nine classes: energetic, exciting, joyful, relaxing, calm, depressive, sad, scary, and aggressive. We consider this an achievement, as most known emotion models cannot be transferred directly to film music as they lack some of the labels related to film genres.
Several convolutional neural network-based models were tested toward automatic emotion assignment for an excerpt of the film music. The best-tested model—InceptionV3—solves the problem of classification of emotions in film music very well, and the obtained prediction accuracy after four tuning steps can be considered satisfactory, so the second goal to create an application that automatically assigns emotions was also fulfilled.
As previously stated, the application prepared for film music emotion classification should be further checked by creating a new questionnaire to verify a larger number of musical excerpts through their subjective assessment to check whether there is a stable relationship between the emotions evoked in the respondents and the results obtained by the application.
Finally, the whole project has an experimental character—at each stage of work, changes could be made that may affect the classification accuracy of the algorithm. Future plans include adjustment of the emotion model and replacement of the used neural network with a custom one. In addition, it is expected that other methods of selecting the hyperparameters used in the training process will be used. It is also planned to use different neural network architectures (along with a diverse data representation) and to compare the results with those obtained by using a convolutional neural network.

Author Contributions

Conceptualization, T.C., S.R. and B.K.; methodology, T.C., S.R., A.K., D.W. and B.K.; software, T.C. and S.R.; validation, T.C., S.R., A.K. and B.K.; formal analysis, A.K., T.C. and S.R.; investigation, T.C., S.R. and A.K.; resources, T.C., S.R. and D.W.; data curation, T.C., S.R. and A.K.; writing—original draft preparation, T.C., S.R., D.W. and B.K.; writing—review and editing, B.K.; supervision, B.K. All authors have read and agreed to the published version of the manuscript.

Funding

This research received no external funding.

Informed Consent Statement

Informed consent was obtained from all subjects involved in the study.

Conflicts of Interest

The authors declare no conflict of interest.

References

  1. Barthet, M.; Fazekas, G.; Sandler, M. Emotion Music Recognition: From Content-to Context-Based Models. In CMMR 2012: From Sounds to Music and Emotions; Aramaki, M., Brathet, M., Kronland-Martinet, R., Ystad, S., Eds.; Lecture Notes in Computer Science; Springer: Berlin/Heidelberg, Germany, 2013; Volume 7900. [Google Scholar] [CrossRef]
  2. Kostek, B.; Piotrowska, M. Rough Sets Applied to Mood of Music Recognition. In Proceedings of the 2016 Federated Conference on Computer Science and Information Systems (FedCSIS), Gdansk, Poland, 11–14 September 2016; Ganzha, M., Maciaszek, L., Paprzycki, M., Eds.; Volume 8, pp. 73–80. [Google Scholar] [CrossRef] [Green Version]
  3. Grekow, J. From Content-Based Music Emotion Recognition to Emotion Maps of Musical Pieces; Springer: Cham, Switzerland, 2017. [Google Scholar]
  4. Dwivedi, P. Using CNNs and RNNs for Music Genre Recognition. Towards Data Science. Available online: https://towardsdatascience.com/using-cnns-and-rnns-for-music-genre-recognition-2435fb2ed6af (accessed on 12 October 2021).
  5. Xiao, Z.; Wu, D.; Zhang, X.; Tao, Z. Music mood tracking based in HCS. In Proceedings of the IEEE International Conference on Signal Processing, Bejing, China, 21–25 October 2012; pp. 1171–1175. [Google Scholar]
  6. Pandeya, Y.R.; Bhattarai, B.; Lee, J. Deep-Learning Multimodal Emotion Classification for Music Videos. Sensors 2021, 21, 4927. [Google Scholar] [CrossRef]
  7. Malik, M.; Adavanne, S.; Drossos, K.; Virtanen, T.; Jarina, R. Stacked convolutional and recurrent neural networks for music emotion recognition. In Proceedings of the 14th Sound and Music Computing Conference, Espoo, Finland, 5–8 July 2017; pp. 208–213. [Google Scholar]
  8. Yu, X.; Zhang, J.; Liu, J.; Wan, W.; Yang, W. An audio retrieval method based on chromogram and distance metrics. In Proceedings of the 2010 International Conference on Audio, Language and Image Processing, Shanghai, China, 23–25 November 2010; pp. 425–428. [Google Scholar]
  9. Grzywczak, D.; Gwardys, G. Audio features in music information retrieval. In Active Media Technology; Springer International Publishing: Cham, Switzerland, 2014; Volume 8610, pp. 187–199. [Google Scholar]
  10. Grzywczak, D.; Gwardys, G. Deep image features in music information retrieval. Int. J. Electron. Telecommun. 2014, 60, 321–326. [Google Scholar]
  11. Novet, J. Google, Spotify & Pandora Bet a Computer Could Generate a Better Playlist Than You Can; VenturaBeat: San Francisco, CA, USA, 2014. [Google Scholar]
  12. Payne, C. MuseNet, OpenAI. 2019. Available online: https://openai.com/blog/musenet/ (accessed on 12 October 2021).
  13. McCoulloch, W.; Pitts, W. A logical calculus of the ideas immanent in nervous activity. Bull. Math. Biophys. 1943, 5, 115–133. [Google Scholar] [CrossRef]
  14. Robinson, J. Deeper Than Reason: Emotion and Its Role in Literature, Music and Art; Oxford University Press: Oxford, UK, 2005; pp. 310–313. [Google Scholar]
  15. Sherer, K.; Zentener, M. Emotional effects of music: Production rules. In Music and Emotion: Theory and Research; Oxford University Press: Oxford, UK, 1989; pp. 361–387. [Google Scholar]
  16. Spitify. Just the Way You Are: Music Listening and Personality. 2020. Available online: https://research.atspotify.com/just-the-way-you-are-music-listening-and-personality/ (accessed on 14 September 2021).
  17. Orjesek, R.; Jarina, R.; Chmulik, M.; Kuba, M. DNN Based Music Emotion Recognition from Raw Audio Signal. In Proceedings of the 29th International Conference Radioelektronika (RADIOELEKTRONIKA), Pardubice, Czech Republic, 16–18 April 2019; pp. 1–4. [Google Scholar]
  18. Bial Er, M.; Berkan Aydliek, I. Music Emotion Recognition by Using Chroma Spectrogram and Deep Visual Features. Int. J. Comput. Intell. Syst. 2019, 12, 1622–1634. [Google Scholar] [CrossRef]
  19. Yang, Y.H.; Lin, Y.C.; Su, Y.F.; Chen, H.H. A regression approach to music emotion recognition. IEEE Trans. Audio Speech Lang. Process. 2008, 16, 448–457. [Google Scholar] [CrossRef]
  20. Hevner, K. Experimental Studies of the Elements of Expression in Music. Am. J. Psychol. 1936, 48, 246–268. [Google Scholar] [CrossRef] [Green Version]
  21. Thayer, R.E. The Biopsychology of Mood and Arousal; Oxford University Press: Oxford, UK, 1989. [Google Scholar]
  22. Thayer, R.E.; McNally, R.J. The biopsychology of mood and arousal. Cogn. Behav. Neurol. 1992, 5, 65–74. [Google Scholar]
  23. Russel, J.A. A circumflex model of affect. J. Personal. Soc. Psychol. 1980, 39, 1161–1178. [Google Scholar] [CrossRef]
  24. Olson, D.; Russell, C.S.; Sprenke, D.H. Circumplex Model: Systemic Assessment and Treatment of Families; Routledge: New York, NY, USA, 2014; pp. 7–40. [Google Scholar]
  25. Watson, D.; Tellegen, A. Toward a consensual structure of mood. Psychol. Bull. 1985, 98, 219–235. [Google Scholar] [CrossRef] [PubMed]
  26. Tellegen, A.; Watson, D.; Clark, L.A. On the dimensional and hierarchical structure of affect. Psychol. Sci. 1999, 10, 297–303. [Google Scholar] [CrossRef]
  27. Plewa, M.; Kostek, B. Music Mood Visualization Using Self-Organizing Maps. Arch. Acoust. 2015, 40, 513–525. [Google Scholar] [CrossRef]
  28. Plewa, M. Automatic Mood Indexing of Music Excerpts Based on Correlation between Subjective Evaluation and Feature Vector. Ph.D. Thesis, Gdańsk University of Technology, Gdańsk, Poland, 2015. Supervisor: Kostek, B. [Google Scholar]
  29. Lin, C.; Liu, M.; Hsiung, W.; Jhang, J. Music emotion recognition based on two-level support vector classification. In Proceedings of the 2016 International Conference on Machine Learning and Cybernetics, Jeju, Korea, 10–13 July 2016; pp. 375–389. [Google Scholar]
  30. Amiriparian, S.; Gerczuk, M.; Coutinho, E.; Baird, A.; Ottl, S.; Milling, M.; Schuller, B. Emotion and Themes Recognition in Music Utilizing Convolutional and Recurrent Neural Networks. In Proceedings of the MediaEval’19, Sophia Antipolis, France, 27–29 October 2019. [Google Scholar]
  31. Wang, X.; Wang, M.; Qi, W.; Su, W.; Wang, X.; Zhou, H. A Novel End-to-End Speech Emotion Recognition Network with Stacked Transformer Layers. In Proceedings of the ICASSP 2021 IEEE International Conference on Acoustic, Speech and Signal Processing on Acoustic, Speech and Signal Processing (ICASSP), Toronto, ON, Canada, 6–11 June 2021; pp. 6289–6293. [Google Scholar]
  32. Song, Y.; Cai, Y.; Tan, L. Video-Audio Emotion Recognition Based on Feature Fusion Deep Learning Method. In Proceedings of the 2021 IEEE International Midwest Symposium on Circuits and Systems (MWSCAS), Lansing, MI, USA, 9–11 August 2021; pp. 611–616. [Google Scholar]
  33. Xie, B.; Sidulova, M.; Park, C.H. Robust Multimodal Emotion Recognition from Conversation with Transformer-Based Crossmodality Fusion. Sensors 2021, 21, 4913. [Google Scholar] [CrossRef] [PubMed]
  34. Behzad, M.; Vo, N.; Li, X.; Zhao, G. Towards Reading Beyond Faces for Sparsity-Aware 3D/4D Affect Recognition. Neurocomputing 2021, 485, 297–307. [Google Scholar] [CrossRef]
  35. Lian, Z.; Liu, B.; Tao, J. CTNet: Conversational Transformer Network for Emotion Recognition. IEEE/ACM Trans. Audio Speech Lang. Process. 2021, 29, 985–1000. [Google Scholar] [CrossRef]
  36. Chowdary, M.K.; Nguyen, T.N.; Hemanth, D.J. Deep Learning-Based Facial Emotion Recognition for Human Computer Interaction Applications. Neural Comput. Appl. 2021, 2021, 1–18. [Google Scholar] [CrossRef]
  37. Topic, A.; Russo, M. Emotion Recognition based on EEG Feature Maps trough Deep Learning Network. Eng. Sci. Technol. Int. J. 2021, 24, 1442–1454. [Google Scholar] [CrossRef]
  38. Tzirakis, P.; Chen, J.; Zafeiriou, S.; Schuller, B. End-to-End Multimodal Affect Recognition in Real-World Environments. Inf. Fusion 2021, 68, 46–53. [Google Scholar] [CrossRef]
  39. Abbaschain, B.J.; Sierra-Sosa, D.; Elmaghraby, A. Deep Learning Techniques for Speech Emotion Recognition, from Databases to Models. Sensors 2021, 21, 1249. [Google Scholar] [CrossRef]
  40. Zainuddin, A.A.; Superamaniam, S.; Andrew, A.C.; Muraleedharan, R.; Rakshys, J.; Miriam, J.; Bostomi, M.A.S.M.; Rais, A.M.A.; Khalidin, Z.; Mansor, A.F.; et al. Patient Monitoring System Using Computer Vision for Emotional Recognition and Vital Signs Detection. In Proceedings of the 2020 IEEE Student Conference on Research and Development, Batu Pahat, Malaysia, 27–29 September 2020; pp. 22–27. [Google Scholar]
  41. Shamshirband, S.; Fathi, M.; Dehzangi, A.; Chronopoulos, A.T.; Alinejad-Rokny, H. A review on deep learning approaches in healthcare systems. Taxonomies, challenges and open issues. J. Biomed. Inform. 2021, 113, 103627. [Google Scholar] [CrossRef]
  42. Thomas, C.; Jayagopi, D.B. Predicting Student Engagement in Classrooms Using Facial Behavioural Cues. In Proceedings of the 1st ACM SIGCHI International Workshop on Multimodal Interaction for Education, Glasgow, UK, 13 November 2017; Association for Computing Machinery: New York, NY, USA, 2017; pp. 33–40. [Google Scholar]
  43. Zhang, J. Movies and Pop Songs Recommendation System by Emotion Detection through Facial Recognition. In Proceedings of the International Conference on Applied Physics and Computing, Ottawa, ON, Canada, 12–13 September 2020. [Google Scholar]
  44. Joloudari, J.H.; Haderbadi, M.; Mashmool, A.; Ghasemigol, M.; Band, S.S.; Mosavi, A. Early Detection of the Advanced Persistent Threat Attack Using Performance Analysis of Deep Learning. IEEE Access 2020, 8, 186125–186137. [Google Scholar] [CrossRef]
  45. Bargaje, M. Emotion recognition and emotion based classification of audio using genetic algorithm—An optimized approach. In Proceedings of the 2015 International Conference on Industrial Instrumentation and Control (ICIC), Pune, India, 28–30 May 2015; pp. 562–567. [Google Scholar]
  46. Sarkar, R.; Choudhurry, S.; Dutta, S.; Roy, A.; Saha, S.K. Recognition of emotion in music based on deep convolutional neural network. Multimed. Tools Appl. 2020, 79, 765–783. [Google Scholar] [CrossRef]
  47. Seo, Y.-S.; Huh, J.-H. Automatic Emotion-Based Music Classification for Supporting Intelligent IoT Applications. Electronics 2019, 8, 164. [Google Scholar] [CrossRef] [Green Version]
  48. Cunningham, S.; Ridley, H.; Weinel, J.; Picking, R. Supervised machine learning for audio emotion recognition. Pers. Ubiquitous Comput. 2021, 25, 637–650. [Google Scholar] [CrossRef] [Green Version]
  49. Tong, L.; Li, H.; Liangaki, M. Audio-based deep music emotion recognition. AIP Conf. Proc. 2018, 1967, 040021. [Google Scholar]
  50. Panda, R.; Rocha, B.; Pavia, R.P. Dimensional Music Emotions Recognition: Combining Standard and Melodic Features. In Proceedings of the 10th International Symposium on Computer Music Multidisciplinary Research—CMMR’2013, Marseille, France, 15–18 October 2013. [Google Scholar]
  51. Hizlisoy, S.; Yildirim, S.; Tufekci, Z. Music emotion recognition using convolutional long short term memory deep neural networks. Eng. Sci. Technol. Int. J. 2021, 24, 760–767. [Google Scholar] [CrossRef]
  52. Chaudhary, D.; Singh, N.P.; Singh, S. Development of music emotion classification system using convolutional neural network. Eng. Sci. Technol. Int. J. Speech Technol. 2021, 24, 571–580. [Google Scholar] [CrossRef]
  53. Yang, J. A Novel Music Emotion Recognition Model Using Neural Network Technology. Front. Psychol. 2021, 12, 760060. [Google Scholar] [CrossRef] [PubMed]
  54. Epidemic Sound. Epidemic Sound: Royalty Free Music and Sound Effects. Available online: www.epidemicsound.com (accessed on 14 June 2021).
  55. Keras. Keras Applications, Keras API Reference. Available online: https://keras.io/api/applications (accessed on 14 September 2021).
  56. Soundtrack.Net. Available online: https://www.soundtrack.net/content/article/?id=208 (accessed on 7 November 2021).
  57. Kostek, B. Soft set approach to the subjective assessment of sound quality. In Proceedings of the IEEE International Conference on Fuzzy Systems at the World Congress on Computational Intelligence (WCCI 98), Anchorage, AK, USA, 4–9 May 1998; Volume 1–2, pp. 669–674. [Google Scholar]
Figure 1. Modified model of mood with fuzzified boundaries of emotions by Plewa and Kostek [25,26].
Electronics 10 02955 g001
Figure 2. Flowchart of the experiment performed.
Electronics 10 02955 g002
Figure 3. Proposed emotion model.
Electronics 10 02955 g003
Figure 4. Introduction page of the constructed web survey (description in Polish says: Sign in with Google to save your progress).
Electronics 10 02955 g004
Figure 5. Demographic questions contained in the constructed online survey.
Electronics 10 02955 g005
Figure 6. Questions with regard to the piece of film music the person is listening to. There is also a possibility to clear the form (description in Polish).
Electronics 10 02955 g006
Figure 7. Histograms of the responses for emotions matching with Epidemic Sound.
Electronics 10 02955 g007
Figure 8. Histograms of the responses for emotions matching with colors.
Electronics 10 02955 g008
Figure 9. Block diagram of the constructed system.
Electronics 10 02955 g009
Figure 10. The start window after clearing all data entered.
Electronics 10 02955 g010
Figure 11. An example of the application interface showing the audio file loading. Its description (in Polish) denotes opening and loading a music file.
Electronics 10 02955 g011
Figure 12. An example of the signal analysis and the classification results performed by the constructed system. Classification results show an assignment of scary and exciting emotions to a particular film music excerpt.
Electronics 10 02955 g012
Figure 13. An example of the signal analysis and the classification results performed by the constructed system. Results show that three similar classes of emotions, i.e., exciting, scary, and energetic, were assigned by the application to a particular film music excerpt.
Electronics 10 02955 g013
Table 2. Mood/emotion descriptors.
• angry
• angry–dark
• angry–epic
• dark–mysterious
• dark–suspense
• dreamy–floating
• epic–hopeful
• epic–mysterious
• euphoric–dreamy
• happy–euphoric
• happy–glamorous
• happy–hopeful
• happy–relaxing
• hopeful–euphoric
• hopeful–sentimental
• hopeful–smooth
• laid back–glamorous
• laid back–sentimental
• mysterious–floating
• mysterious
• mysterious–sneaking
• mysterious–suspense
• relaxing–laid back
• relaxing
• romantic–sad
• romantic–sentimental
• romantic–sexy
• sad–dreamy
• sad–relaxing
• sad
• sad–sentimental
• sentimental–floating
• sexy–laid back
• smooth–laid back
• sneaking–suspense
Table 3. Parameters of the generated datasets.
The Length of the Window Analysis [s]Length of Analysis Windows [s]Number of Images in the Set
30229,495
415,011
512,045
610,191
87801
106336
15107007
Table 4. Mapping emotions from the Epidemic Sound database to the proposed mood model.
agrcaldepeneexchaprelsadsca
ang0.2330.01140.00570.63630.07390.017000.0227
dar0.02270.17050.01140.05680.28980.00570.08520.05110.3068
dre0.0170.37510.0170.07390.136400.30110.0170.0625
epi0.04550.0170.01140.50560.3693000.00570.0455
eup0.04550.01140.00570.62490.07390.21590.0170.00570
flo0.00570.43760.0170.03980.1420.00570.2670.08520
gla0.02270.153400.38080.0170.15910.250.0170
hap0.03410.090900.35220.20450.26140.03980.01140.0057
hop0.01940.23650.0310.11240.06980.23640.20540.08910
lai0.02270.36360.0170.07950.03410.06250.40350.01140.0057
mys0.01140.11930.028400.2330.02270.03980.09660.4488
rel00.57950.02270.00570.01140.01140.30680.06250
rom0.02840.35810.05680.15340.02840.07950.21590.07950
sad0.00570.2670.15910.01140.01140.01140.11360.4090.0114
sen0.01850.2370.10.01110.02220.04070.16670.37050.0333
sex0.02270.38070.0170.04550.03980.02840.43750.02840
smo0.03980.33520.0170.01140.03410.06820.47720.01140.0057
sne0.0170.09660.03410.07950.45460.0170.04550.03980.2159
sus0.07390.02840.00570.1080.36930.005700.02840.3806
Table 5. Short names for labels used in Table 2.
angangry
agraggressive
calcalm
dardark
depdepressive
dredreamy
eneenergized
epiepic
eupeuphoric
excexcited
flofloating
glaglamorous
haphappy
hophopeful
lailaid back
mysmysterious
relrelaxed
romromantic
sadsad
scascary
sensentimental
sexsexy
smosmooth
snesneaking
sussuspense
Table 6. Results of the chi-square test for 19 emotions from the Epidemic Sound database (labels are the same as shown in Table 5).
dar-
dre--
epi---
eup----
flo--X--
gla------
hap-------
hop--------
lai--X------
mys-X--------
rel-----X-----
rom--------XX--
sad-------------
sen-------------X
sex--X--X---X-X---
smo---------X-----X
sne-X---------------
sus------------------
angdardreepieupfloglahaphoplaimysrelromsadsensexsmosne
Table 7. Pearson’s correlation coefficient r for emotions from the proposed model and color assignment.
RedBluePurpleOrangeYellowLight GreenDark GreenGrayBlack
Aggressive0.84−0.529−0.169−0.073−0.127−0.345−0.275−0.2970.483
Calm−0.6160.833−0.012−0.0520.010.490.2920.182−0.504
Depressive−0.2460.366−0.228−0.17−0.1460.0140.4690.8450.127
Energetic0.754−0.663−0.2080.370.382−0.142−0.641−0.581−0.004
Exciting0.192−0.3220.179−0.25−0.273−0.3070.0840.0590.396
Joyful−0.161−0.252−0.2220.7110.9450.654−0.435−0.291−0.388
Relaxing−0.5010.5210.2480.1990.1090.4410.196−0.023−0.571
Sad−0.2350.391−0.255−0.186−0.1050.0570.5020.8640.182
Scary−0.002−0.210.135−0.422−0.49−0.5060.3690.3240.76
Table 8. Results of the second stage of the NN training.
Name of ModelXceptionResNet50V2InceptionResNetV2InceptionV3
Batch size32163264
Learning rate10−4
Accuracy—training dataset [%]99.8298.3298.3396.89
Accuracy—validation dataset [%]96.6696.3794.4894.63
Accuracy [%]59.4959.960.3862.95
Own test [%]77.2676.775.7777.3
Number of epochs10010010083
Table 9. Results of the third stage of the NN training.
Name of ModelXceptionResNet50V2InceptionResNetV2InceptionV3
Batch size32166464
Learning rate10−4
Length of excerpt in learning dataset [s]3015301530153015
Accuracy—training dataset [%]97.4797.8591.1695.5798.9597.4296.5293.25
Accuracy—validation dataset [%]82.4979.2964.1572.2676.4373.1387.859.96
Accuracy [%]58.1855.6153.657.8463.4761.9861.0459.96
Own test [%]76.5874.5273.4573.1476.2474.5275.6374.55
Number of epochs10099194069489729
Table 10. Results of the fourth stage of the NN training.
Name of ModelXceptionResNet50V2InceptionResNetV2InceptionV3
Batch size64166416
Learning rate10−4
Learning datasetLength of excerpt = 30 s
Shift = 10 s
Length of excerpt = 30 s
Shift = 8 s
Accuracy—training dataset [%]98.4399.6398.6497.25
Accuracy—validation dataset [%]90.5487.6389.1793.16
Accuracy [%]60.8659.961.1161.66
Own test [%]76.5875.5777.978.71
Number of epochs15015014168
Table 11. Comparison of accuracy measures for the four best models after the fourth stage of the NN training.
Model NameXceptionResNet50V2InceptionResNetV2InceptionV3
Cosine similarity0.86950.87200.87170.8892
Mean absolute error0.47350.47560.45730.4299
Mean squared error0.06490.06320.06300.0542
Table 12. Results of the application and subjective responses.
Beginning of the FragmentChoose 1Choose 2Choose 3
Emotion[%]Emotion[%]Emotion[%]
Main Theme0Energetic36.59Exciting17.26Joyful15.29
African Rundown0Energetic35.32Exciting29.05Scary16.04
Dumbledore’s Farewell15Calm29.64Relaxing23.2Sad18.39
Time10Exciting27.0Scary20.68Calm17.46
Who is She42Energetic30.77Joyful18.53Exciting17.19
Seizure of Power20Energetic48.18Aggressive16.46Exciting15.29
Flesh-163740Scary40.16Exciting28.09Calm11.11
Auschwitz_Birkenau0Calm30.39Sad18.38Relaxing17.31
Discombobulate20Energetic48.29Exciting22.32Aggressive12.69
Ragnar Says Goodby to Gyda0Calm25.32Sad20.08Relaxing16.96
Publisher’s Note: MDPI stays neutral with regard to jurisdictional claims in published maps and institutional affiliations.

