Article

Sentimental Knowledge Graph Analysis of the COVID-19 Pandemic Based on the Official Account of Chinese Universities

1
School of Economics and Management, South China Normal University, Guangzhou 510006, China
2
Faculty of Information Technology, Macau University of Science and Technology, Macau 999078, China
3
School of Cyber Science and Engineering, Southeast University, Nanjing 210096, China
*
Author to whom correspondence should be addressed.
Electronics 2021, 10(23), 2921; https://doi.org/10.3390/electronics10232921
Submission received: 26 September 2021 / Revised: 16 November 2021 / Accepted: 18 November 2021 / Published: 25 November 2021
(This article belongs to the Section Computer Science & Engineering)

Abstract

:
With the advent of the new media mobile Internet era, the network public opinion in colleges and universities, as an extension of social network public opinion, is also facing a crisis in the prevention, control, and governance system. In this paper, the Fiddler was used to collect the comments and other relevant data of the COVID-19 topic articles on the WeChat Official Accounts of China’s top ten universities in 2020. The BILSTM_LSTM sentiment analysis model was used to analyze the sentiment tendency of the comments, and the LDA topic model was used to mine the topics of the comments with different emotional attributes at different stages of COVID-19. Based on sentiment analysis and text mining, entities and relationships in the theme graph of public opinion events in colleges and universities were identified, and the Neo4j graph database was established to construct the sentimental knowledge graph of the pandemic theme of university public accounts. People’s attitudes in university public opinion are easily influenced by a variety of factors, and the degree of emotional disposition changes over time, with the stage the pandemic is in, and with different commentators; official account opinion topics change with the development of the time stage of the pandemic, and students’ positive and negative comment topics show a diverse trend. By incorporating topic mining into the sentimental knowledge graph, the graph can realize functions such as the emotion retrieval of comments on university public numbers, a source search of security threats in university social networks, and monitoring of comments on public opinion under the theme of the pandemic, which provides new ideas for further exploring the research and governance system of university network public opinion and is conducive to preventing and resolving campus public opinion crises.

1. Introduction

WeChat Official Accounts [1] is a social media for WeChat to provide users with information and services. Since its official launch on 23 August 2013, it has quickly become the most popular Internet speech platform, with its advantages of high communication efficiency and strong interactivity. Additionally, as an important position in campus new media, the influence of university official accounts cannot be underestimated. In recent years, the number of unexpected events of university network public opinion has increased, and the occurrence and spread of some events are closely related to the new media public opinion represented by WeChat public numbers, which brings serious challenges to the construction of university public opinion [2,3]. In the face of the sudden global pandemic of COVID-19, social media paid great attention to it, while the student community was greatly affected during this period, which, to a certain extent, affected students’ lives and physical and mental health [4].
The content of comments on official university accounts articles during the pandemic can reflect the attitudes, tendencies, and micro-behaviors of university students during the pandemic, providing a highly present and time-sensitive text corpus for campus opinion research [5]. On the other hand, as the COVID-19 continues to spread, it makes it an important research topic for data analysts and scholars, in general, to use sentiment analysis algorithms [6] and knowledge graph techniques [7] to accurately identify hot comments and pandemic themes, analyze the emotional dynamics of the masses, uncover topics of public concern, and show the spatio-temporal evolution of network public opinion during this pandemic event.
Scholars have conducted extensive research on university student populations in the context of COVID-19, focusing on “education” and “psychology”, such as studying student satisfaction with the quality of videoconferencing during the pandemic [8] and exploring the impact of the pandemic on college students’ academic performance and social mood [9]. Fewer studies have been conducted from the perspective of public opinion analysis. Secondly, in China, scholars have mostly conducted qualitative analysis on public opinion in universities during the pandemic [10], and there are few quantitative research results. Again, analysis of university public opinion through sentimental knowledge graphs, which is an innovative study in the current period of the pandemic explosion, is studied even less by scholars.
In this paper, starting from the time stage of pandemic events, a topic–sentiment knowledge graph model of university public opinion events is constructed, and the topic text information with time attribute and massive public opinion data are analyzed. The main contributions of the university pandemic sentimental knowledge graph proposed in this paper are as follows.
(1)
In this paper, the sentiment analysis model BiLSTM_LSTM (bi-directional LSTM (Long Short-Term Memory)) is constructed to improve the correct rate of sentiment tendency recognition, accurately identify the positive and negative sentiment of public comments in universities, and quantitatively determine the degree of sentiment tendency presented by students at a specific time period.
(2)
In this paper, the LDA (Latent Dirichlet Allocation) topic mining experimental corpus is segmented according to positive and negative sentiment as well as the development stage of the pandemic and achieves a fine-grained division of the pandemic topic comments on university official accounts to identify the hidden topic information in the positive and negative comments made by students during the pandemic and to achieve the comment topic posture measurement.
(3)
In this paper, we use Sankey diagrams, which can show the flow of data, to visualize the themes of the pandemic generated by the LDA topic model, to show the evolution of the themes of comment texts at different stages of COVID-19 in a time-series image, and to observe the overall dynamics of university public opinion.
(4)
In this paper, the flexible and efficient Neo4j graph database to achieve the knowledge storage of the official university account COVID-19 sentimental knowledge graph, organizing knowledge in the form of a graph structure.
(5)
The Neo4j knowledge graph built in this article uses the Cypher query language, which allows the graph databases to be efficiently queried.
The remainder of this paper is as follows: “Related Works” briefly introduces the research work related to the sentimental knowledge graph of COVID-19 in official accounts of colleges and universities; “Models and Methods” constructs a theoretical model of the sentimental knowledge graph of COVID-19 in official accounts of colleges and universities, introduces the research framework of this paper and conducts experiments and analysis on the techniques and methods involved in a sentimental knowledge graph; “Graphs and Discussion” builds a Neo4j-based knowledge graph of university public opinion; and “Conclusions” gives a summary and the prospects of this paper.

2. Related Works

2.1. Sentimental Knowledge Graph

As smart technology and mobile Internet continue to develop, making the interconnection of everything possible, the data generated by the interconnection is exploding. Finding a way to make use of the data and the connections between it has become an urgent need for all industries. In the past, intelligent analysis tended to focus on each individual, but in the mobile Internet era, in addition to the individual, the relationship between individuals is also an important part of the analysis. Knowledge graphs are dedicated to dealing with relational analysis. A knowledge graph is a multi-relational graph consisting of entities and relations. Each edge is represented as a triple form (head entity, relation, tail entity), also called a fact, indicating that two entities are connected by a specific relation [11]. As a fusion of a knowledge graph and sentiment analysis, a sentimental knowledge graph not only visualizes the research content but also portrays the subjective sentiment of the research subject. Emotion-based knowledge graphs identify user intent using retrieval, matching, or inference within the constructed structured graphs and enable efficient query and retrieval with the information stored in the contextual information. In terms of research on lexicon-based sentimental knowledge graphs, You et al. [12] establish a fine-grained sentimental classification lexicon and semantic role analysis model based on frame semantic theory, construct a sentimental knowledge graph through the semantic annotation of emotions in online reviews, and apply ontology query tools to realize personalized and intelligent queries of emotional knowledge. Xu et al. [13] used movie reviews and emotion words to build a knowledge extraction lexicon using the Stanford Natural Language Processing (NLP) toolkit to annotate the movie review data, clustered the text to form structured knowledge, and finally fused the movie ontology knowledge to generate a knowledge graph of movie reviews containing user sentiment factors. Using a machine learning model, Li [14] used the text of user comments on the topic of “anti-academic misconduct” on Weibo as data and used the Naive Bayesian Model to classify the data to obtain the users’ sentiment tendency, and combined this with the influence of user nodes to build a sentiment map of university opinion on social media. Again, using Weibo as the research platform but using a deep learning model, Xie et al. [15] used a Skip-gram model to obtain a word embedding matrix, a BiLSTM model for sentiment classification, and Neo4j to construct a knowledge graph of user comments by identifying the relationships between different users.
A sentimental knowledge graph presents complex knowledge domains through data mining, information processing, knowledge measurement, sentiment value calculation, and graphical drawing to reveal the dynamic development of emotion in a specific knowledge domain. Theoretical research and practical applications are expanding and achieving good results, and scholars are constantly optimizing the results of sentiment analysis to improve the accuracy of the sentimental knowledge graph. However, there are still few studies focusing on the ontology of the sentimental knowledge graph. Most scholars take sentiment analysis as an experimental method and only apply the knowledge graph to the visualization of experimental results or apply part of the technology extraction in the knowledge graph to the sentimental analysis model [16,17], without innovatively integrating the two.

2.2. COVID-19 Analysis in Colleges and Universities

With COVID-19 spreading fiercely around the world in the first half of 2020, universities faced unprecedented challenges as public places where people gather. Scholars have also paid attention to the impact of the pandemic on colleges and universities and published relevant research papers. In general, the research on the topic of the pandemic in colleges and universities mainly focuses on the psychological and mental health of students, online education, and public opinion in colleges and universities. Tasso et al. [9] noted a positive correlation between students’ academic frustration and mental health symptoms as a result of the significant educational and psychological impact received by university students in the pandemic. Han et al. [18] collected questionnaires from 17,876 university students and used chi-square tests and multivariate logistic tests to determine the association between pandemic experience and anxiety detection, showing a detection rate of 18.2% for university students with anxiety disorders. On the other hand, students’ irrational cognition and legal awareness are weak, while the network society is full of false rumors and the lack of an all-round monitoring mechanism for network public opinion makes it easy for students to immerse themselves in the network world and be influenced by various negative comments and ideas [19]. Online education is particularly important as a link between schools and students, and Mukhtar et al. [20] conducted a study with a sample of staff and students in the form of group interviews to explore the advantages and disadvantages of online learning for both teachers and students. Sorour et al. [21] investigated the effectiveness of a hybrid modelling approach using cloud computing services (CCS) and virtual reality (VR) in a virtual cloud learning environment (VCLE) system in a closed educational context to try to help and address the key challenges and factors affecting e-learning systems for computer maintenance courses during the pandemic. In addition, the development and response to public opinion in universities during the pandemic has also become a focus of attention [22]. Yao et al. [23] conducted social network and semantic network analysis and sentiment analysis for online teaching topics by selecting educational online opinion data from social media sites such as WeChat and Weibo.
In summary, scholars have conducted many studies and achieved many results in the fields of the sentimental knowledge graph and topic analysis of university pandemics, but few scholars have applied the above two analysis methods to the study of university pandemic public opinion. In addition, the analysis of public opinion in universities lacks a comprehensive consideration of the characteristics of various aspects of university public opinion groups. In this paper, we use the sentiment analysis model BiLSTM_LSTM and the LDA topic model to experiment with public comment data from representative, official university WeChat accounts and import the experimental results into the Neo4j graph database to build a topic–sentiment knowledge graph. The integration application of university public opinion and knowledge graph is realized, making the sentimental knowledge graph an effective means of data mining and knowledge discovery in university knowledge management. It provides certain guidelines for the public opinion supervisory department to understand the control points, evolutionary trend analysis, emotion guidance, and monitoring tools of public opinion in colleges and universities events; it has certain theoretical and practical guidance significance to promote the construction of a university network public opinion monitoring platform.

3. Models and Methods

Through the theoretical elaboration above, this chapter first constructs a theoretical model of a topic–sentiment knowledge graph of public opinion events in colleges and universities, and then elaborates on the data collection, sentiment analysis, and topic mining methods and techniques in the model; through the methods and technical experiments, it provides data sources for the construction of sentimental knowledge graph in the next chapter and also provides multiple perspectives for thinking about university public opinion analysis.

3.1. Theoretical Model Construction

To analyze the overall tendency of university students and the topic and sentiment posture of public opinion in colleges and universities during COVID-19, a public opinion in colleges and universities topic–sentiment knowledge graph model was built. The structure of the model is shown in Figure 1, which includes the following four parts: data collection and pre-processing, BiLSTM sentiment analysis, LDA topic text mining, and Neo4j knowledge graph construction.
The steps are as follows: (1) Obtain the article information and students’ comment data through the packet-crawling tool Fiddler and clean the duplicate and wrong data. (2) Use the “Chinese-word-vectors” [24] pre-trained by researchers from the Institute of Chinese Information Processing of Beijing Normal University and the DBIIR (Database and Intelligence Information Retrieval Lab) Laboratory of Renmin University of China, and the GitHub Chinese sentiment analysis corpus “online_shopping_10_cats” [25]. The BILSTM_LSTM deep learning model was selected to train the sentiment analysis model based on the sentiment corpus, and the sentiment value of the comment content was calculated by using the model. (3) Use the word list extended by the deactivated thesaurus of the Machine Intelligence Laboratory of Sichuan University and the thesaurus of Baidu [26], use the jab word splitting tool to split all comments, remove deactivated words, build a topic matrix by LDA model, determine the number of topics according to the confusion curve to extract topic content, and calculate the topic relevance, extract topic labels according to the topic word weights and pleasing visualization results. (4) Identify entities based on the article and student comment data, further identify inter-entity relationships based on entities, import entity nodes and relationship edges to the Neo4j graphical database, store and map the knowledge graph of public opinion in colleges and universities, and query the experimental results through the cypher language.
To achieve the refined event evolution analysis described in this paper, the study phase was divided into four key periods based on Fighting covid-19 China in action [27] (T1: “Initial containment period of the pandemic” from 21 January to 20 February 2020; T2: “Important effectiveness period for pandemic prevention and control” from 21 February to 17 March; T3: “Consolidate the effective period of the pandemic” from 18 March to 28 April; T4: “Normalization period for pandemic prevention and control” from 29 April to 31 December), as shown in Figure 2.

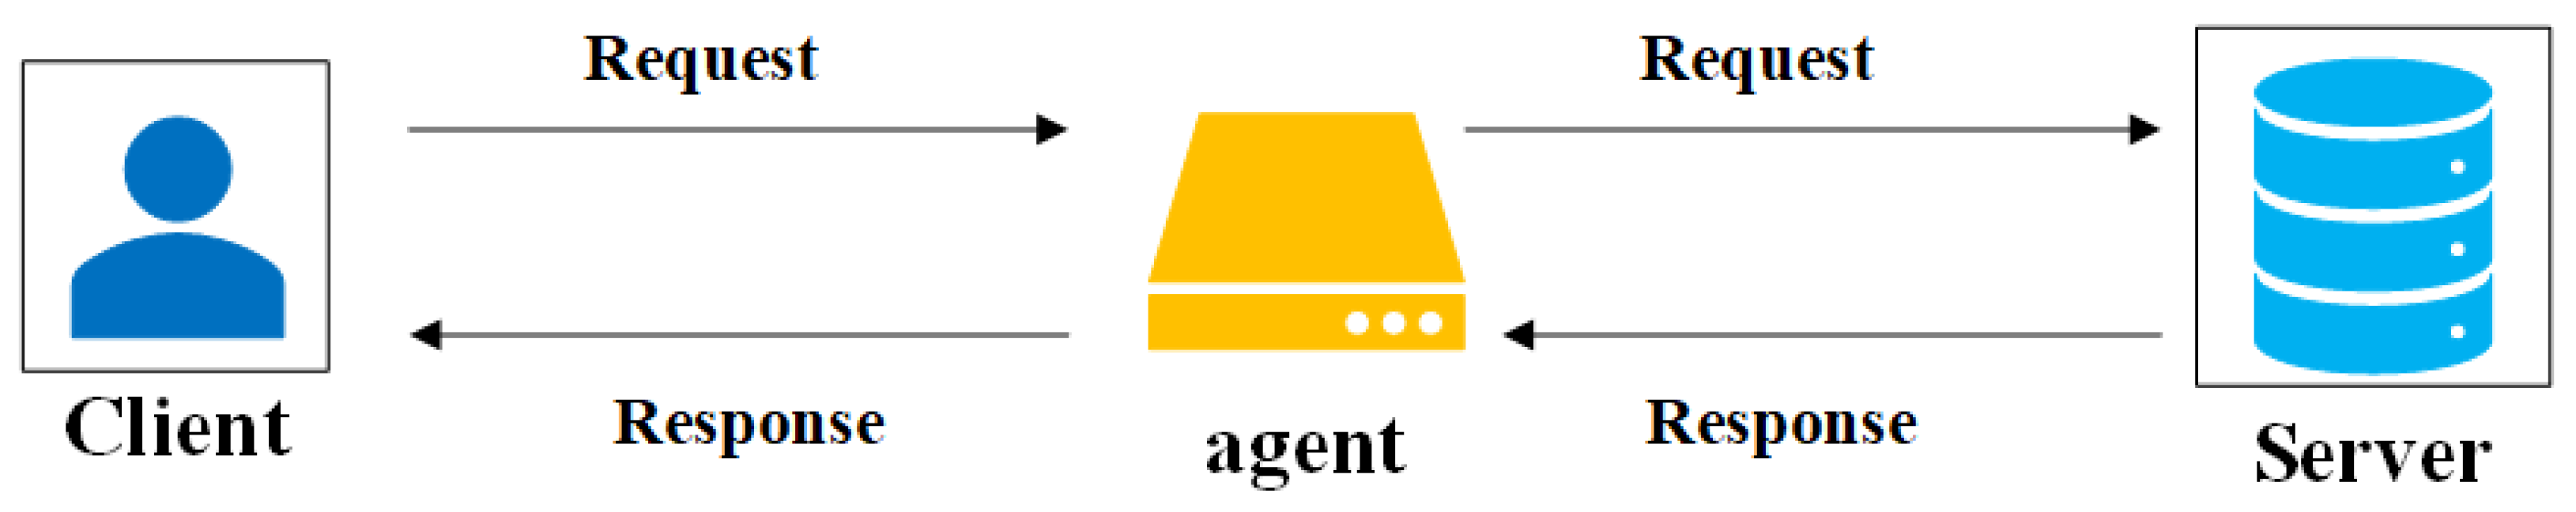
3.2. Data Collection and Pre-Processing Based on Fiddler

Fiddler [28] is an HTTP protocol debugging proxy tool that inspects HyperText Transfer Protocol over SecureSocket Layer (HTTP/HTTPS) traffic to and from browsers and desktop applications. As a commonly used man-in-the-middle packet capture tool, it can access everything needed to create a new request, communicating with the web server precisely so that only the required resources are invoked. Its working schematic is shown in Figure 3.
In this paper, according to the watermelon data “2020 first half-year Chinese universities public number influence ranking”, the Chinese universities ranked in the top 10 were selected as the subject of the study, the search was conducted in the public number history message with “pandemic” as the keyword, the articles with the time interval from 1 January 2020 to 31 December 2020 were selected, and the list of pandemic-themed articles was obtained, and the data were collected by using Fiddler to grab the HTML pages. First, the attributes of the original HTML data set, such as title, publication time, and comment content, were collected; then, we screened and eliminated user blank comment data; finally, through browsing, screening and repeated checking, 1163 articles were published on the official account of 10 universities with the pandemic as the theme and 22,134 comments were obtained. The format of the experimental data is shown in Appendix A: Table A1.

3.3. Sentiment Analysis of Official Account Commentary in Time Context Based on BiLSTM_LSTM

3.3.1. BiLSTM_LSTM

RNN has achieved remarkable results in processing continuous data for sentiment analysis, but its gradient disappearance problem makes it extremely problematic in several aspects similar to efficient learning and tuning hyperparameters. The LSTM, on the other hand, is a special recurrent neural network designed to address the long-term dependence of RNNs by adding memory units to each unit of the hidden layer making the memory information in the time series controllable and better able to predict sentiment through the neural network [29]. On the other hand, BiLSTM is useful in scenarios where input context is required, especially for tasks such as sentiment classification. In BiLSTM, information flows not only from back to front, but also from front to back using two hidden states. This allows the learning capability of the LSTM to be further improved to better understand contextual information [30,31]. Considering that the advantage of LSTM is that long-term memory functions can be achieved by connecting previous and present contexts, the advantage of BiLSTM is that past and future contexts can be extracted by considering both directions of the information flow [32]. Based on this, this paper proposes to add a bidirectional LSTM network to the LSTM network and use the BiLSTM_LSTM model for training and the prediction of sentiment analysis. The parameter information of the model is shown in Table 1 and the architecture is shown in Figure 4: It consists of a word embedding layer, a BiLSTM layer, an LSTM layer, a fully connected layer, and an output layer. The following is described in detail.
  • Word embedding layer. The embedding layer converts each unique index into n-dimensional real-valued vectors, which are stacked together to form the embedding matrix, namely the word vector matrix [33]. The word vector matrix representation of input comment information is as follows:
R = [ r 11 r 12 r 21 r 22 r 1 m r 2 m r n 1 r n 2 r n m ]
  • BiLSTM layer. The BiLSTM model consists of two LSTM networks capable of reading input comments from both forward and backward directions [34]. The forward LSTM processes information from left to right, while the backward LSTM processes information from right to left. The model takes into account both previous and future information, thus processing contextual information efficiently.
  • LSTM layer. Unlike the BiLSTM layer, the LSTM layer does not return sequences, only the final result.
  • Fully connected layer and output layer. The feature information extracted by the above process is used in the fully connected layer to generate feature values for sentiment classification. The fully connected layer acts as a classifier in the overall neural network model. The results are output in the output layer using a sigmoid activation function, which translates the output of the fully connected layer into approximate probability values for each sentiment polarity category.

3.3.2. Analysis of Students’ Emotional Evolution in Time Context

Through repeated experiments and tests, the BiLSTM_LSTM model constructed in this paper uses the “Chinese-word-vectors” Baidu Encyclopedia Word and Ngram pre-trained word vector [24], and the GitHub sentiment corpus collection “online_shopping_10_cats” with 62,774 entries to train the sentiment model [25]. Some of the core code for sentence feature extraction and model construction is given as Algorithms 1:
Algorithms 1. Sentence feature extraction and model construction.
  • num_tokens = [len(tokens) for tokens in train_tokens]
  • num_tokens = np.array(num_tokens)
  • max_tokens = np.mean(num_tokens) + 2 * np.std(num_tokens)
  • max_tokens = int(max_tokens)
  • np.sum(num_tokens < max_tokens)/len(num_tokens)
  • def reverse_tokens(tokens):
  •  text = ‘‘
  • for i in tokens:
  •   if i != 0:
  •    text = text + cn_model. index2word[i]
  •   else:
  •    text = text + ‘ ’
  • return text
  • num_words = 50,000
  • embedding_matrix = np.zeros((num_words, embedding_dim))
  • for i in range(num_words):
  •  embedding_matrix[i,:] = cn_model[cn_model.index2word[i]]
  • embedding_matrix = embedding_matrix.astype(‘float32′)
  • np.sum(cn_model[cn_model. index2word [333] == embedding_matrix [333])
  • embedding_matrix.shape
  • train_pad = pad_sequences(train_tokens, maxlen = max_tokens, padding = ‘pre’, truncating = ‘pre’)
  • train_pad[train_pad >= num_words] = 0
  • train_target = np.array(train_target)
  • from sklearn.model_selection import train_test_split
  • X_train, X_test, y_train, y_test = train_test_split(train_pad, train_target, test_size = 0.1, random_state = 12)
  • model = Sequential ()
  • model.add(Embedding(num_words, embedding_dim, weights = [embedding_matrix], input_length = max_tokens, trainable = False))
  • model.add(Bidirectional(LSTM(units = 64, return_sequences = True)))
  • model.add(LSTM(units = 16, return_sequences = False))
To ensure the accuracy of sentiment recognition, the model divided the data set into 90% training set and 10% test set and then extracted 10% of the data from the 90% training set as cross-validation samples. After training the model for 10 iterations, the final training set accuracy value was 98.3% and the val_accuracy value was 90.8%; the test set accuracy was 89.6%. Therefore, the sentiment classification model constructed using the BiLSTM network in this paper works well. Some of the results are shown in Table 2:
The distribution of sentiment tendency based on sentiment values is shown in Figure 5. The vertical coordinate is the sentiment tendency of each comment, with larger values closer to 1 indicating positive sentiment and closer to positive sentiment, and smaller values closer to 0 indicating negative sentiment, where a sentiment tendency of <0.5 is judged as negative by the model. The horizontal coordinate indicates the month when the comment was published. The density of data points indicates the number of comments.
According to Figure 5, the degree of emotional tendency changes with time, with the stage of the pandemic and with different commentators, indicating that people’s attitudes in university public opinion are easily influenced by various factors, and their emotional tendency is variable. It is also evident that during the early months of the pandemic, January–March, there was a major outbreak of commentary, a sharp divergence of emotional tendencies as people were restricted from travelling and isolated at home during the Chinese New Year period, there was a high level of interest in news about the pandemic-related reports, and students made their comments widely available under public university articles. The end of February/beginning of March is the start of the academic year for students, and due to the pandemic, the opening of many universities had been postponed. In March–April, a period after the Chinese New Year but before the start of the academic year, when universities and colleges were unable to start their regular classes in the form of online classes, the attention of public articles on the topic of the pandemic remained high. This was followed by the start of the academic year in late April and early May, and with the guidance of social media, the level of concern and worry about the outbreak among students was less than before. However, during the July college graduation season, graduates were worried about employment, with extremely negative sentiment outweighing extreme positive sentiment. Additionally, then under the influence of relevant national policies and social regulation, as well as after the new school season in September, graduates had mostly embarked on their normal work or study paths, while new students were more concerned about school news articles, and overall, the attention to pandemic-themed articles had declined, with a balance of positive and negative comments. However, after November, the number of confirmed indigenous cases was on the rise again with the re-emergence of indigenous outbreaks in Tianjin, Shanghai, and Anhui Province in China; on the other hand, the global outbreak had seen wave after wave of climaxes, with the total number of cases reaching record highs. On 18 December, the world saw the biggest spike in confirmed cases thus far in this year, with 731,264 new cases in a single day. This also heightened concern among university students about the outbreak, but the overall sentiment was steady, with slightly more negative than positive sentiment among students during the global outbreak in December.

3.4. Analysis of Topic Content Evolution in Time Context Based on the LDA Topic Model

3.4.1. LDA Topic Model

The LDA topic model is a representative model in text mining, which can identify topics in documents and mine the hidden information in the corpus to extract potential topics and has been widely used in text corpus topic discovery [35,36]. Applying the topic model method to the topic mining of the university network opinion text corpus can help to understand the main ideas among the huge number of opinions at the text level according to the idea of topics [37,38]. Based on this, this paper uses the LDA topic model for topic mining of university public comment data.
The LDA model’s topic generation process: selecting a topic with a certain probability and selecting a word from a topic with a certain probability:
p ( w o r d | d o c ) = t o p i c p ( t o p i c | d o c ) p ( w o r d | t o p i c )
The structure of the LDA model is shown in Figure 6.
In Figure 6, M represents the number of documents, N represents the number of N M words per document, and k represents the number of potential topics. There are V non-repeatable terms in the vocabulary; there are M documents d 1 , d 2 , …, d M in the corpus, which is composed of N i repeatable words; there are k topics T 1 , T 2 ,…, T k in the corpus. α and η are the parameters of the prior distribution; θ is the topic distribution for each document; for the i th document d i , under the topic distribution θ i , the topic z i j = k can be determined; β is the word distribution for each topic; the selection of β z i j from z i j indicates that the term is determined from the word distribution β z i j , resulting in the observation w i j .

3.4.2. Analysis of the Evolution of Topic Content in Time Context

In general, the smaller the study granularity setting is, the more accurate the research results are. Firstly, all the review data were divided into positive comments and negative comments according to the results of sentiment analysis; secondly, the paper further divided the positive and negative comment data into four periods, respectively. Eight datasets divided by pandemic stage and positive and negative sentiment were imported, and a thesaurus and a deactivated thesaurus [26] were introduced for Chinese word separation using the jieba word separation tool. As the merit of the topic representation result is affected by the number of topics, to determine the optimal number of topics, this paper introduced a confusion index. The lower the degree of confusion is, the better the clustering results are. The perplexity is calculated as follows:
p e r p l e x i t y = e log ( p ( w ) ) N
where p ( w ) is the frequency of each word that appears in the text and N refers to all words that appear in the text.
The LDA topic model perplexity was calculated via python and a perplexity trend graph was generated as shown in Figure 7.
After determining the optimal number of topics through the perplexity indicator, the weights of the topic terms and subject terms were output and the results of some of the runs are shown in Table 3.
To more accurately and objectively determine the names of topic categories, topics were visualized using the LDA topic model visual pyLDAvis library, as shown in Figure 8. The combination of topic word weights and the visualization of interactive topics was tested on eight datasets to determine the final topic labels for positive and negative comments at different stages of the pandemic.
After acquiring the topics discussed at different stages of COVID-19 with positive and negative tendencies, further clarifying the information flow of public opinion topics at different time stages helped university staff to grasp the dynamic situation of public opinion development. Sankey diagrams can visualize the flow of information between subjects, and the amount of information flow in the diagram is positively related to the frequency of co-occurrence and similarity of different topics. A Sankey diagram showing the evolution of topics is drawn using PowerBI, where the width of the line represents the similarity value and the size of the word block represents the closeness of association with other topics, as shown in Figure 9 and Figure 10.
Figure 9 shows the topic evolution diagram of positive comments on pandemic topic articles on public accounts of universities. During the T1 period, students paid attention to the following topics: first, cheer for Wuhan, Hubei, and Cheer for China; second, paying high tribute to the brave medical staff on the front line of COVID-19 and hoping for their safe and healthy return; third, COVID-19 is coming, and the people are united. During the T2 period, students were proud of their Alma mater for volunteering to be on the front line of the pandemic. For example, the medical team of Peking University rushed to Wuhan to help, and the research institute of Tsinghua University helped to defeat the pandemic with science and technology. Students taking online classes at home also received warm comfort from the school and tips on pandemic prevention and control. During the cherry blossom season, students looked forward to the revival of Wuhan and the blooming cherry blossoms at Wuhan University. During the T3 period, China’s remarkable achievements in fighting the pandemic made the people proud. The medical workers who helped Hubei returned home one after another, and the students were very excited about the hero’s safe return. Some colleges and universities announced the opening of the semester in April, and students expressed their anticipation. Those who were still taking online classes also enjoyed the fun of online classes. The graduation season had also become a hot issue for students amid the pandemic. As the T4 period was normalized for a long time, many topics were discussed. Thanks and respect were extended to the heroes who fought against the pandemic. Wishes were also expressed on the warm Mother’s Day and for the graduation season to send their own blessings. The new term also saw a keen interest in their own studies, the dedication of their teachers, and the development of the school. At the end of the year, they expressed a rosy vision of leaving the past behind and embracing a brighter future.
The evolution of topics for negative comments on pandemic-themed articles on university official accounts is shown in Figure 10. The T1 period was frightened by online rumors, and students were both concerned but clear about their attitude of “do not spread rumors or believe them”. In the early stages of the COVID-19, there were reports of frontline workers infected with the virus and students prayed and hoped for the triumphant return of the health care workers fighting the pandemic. Many students also volunteered for work related to the pandemic, showing their responsibility as college students. On the other hand, college students come from all over the world, and the opening of the semester inevitably affected the development of the pandemic; therefore, the overall planning of the school was particularly important. During the T2 period, some students contributed to the pandemic on the front line, while others actively responded to the country’s call to stay at home and not attend parties. The words about cheering for teachers and the school were mostly neutral comments, expressing their close concern for the Alma mater. On the other hand, China made progress in fighting the pandemic, but students were informed to postpone the start of school. Students facing graduation also worried about employment and further studies. During the T3 period, there was an active response to the arrangements of schools, and active cooperation with the pandemic prevention work of schools. Despite the anxiety of opening and graduation, students firmly said their Alma mater stood with Wuhan, Hubei. At the same time, students expressed their condolences for those who lost their lives in the fight against the pandemic and hoped that the country would be well. During the T4 period, students expressed their strong concern for their classmates and school and maintained a neutral attitude toward returning to school and graduation. They had worries about the future but also dared to meet the challenges in the future.

4. Graphs and Discussion

4.1. Neo4j Graph Database Design

Neo4j [39] is a local graphical database that stores structured data on the web rather than in tables, with a flexible structure for storing data. The data model of the Neo4j graph database consists of the following four main components: nodes, attributes, labels, and relationships. Relationships are used to describe node-to-node relationships and are what sets graph databases apart from traditional databases, allowing them to describe net-like relationships that are difficult to represent in a normal row database. Neo4j provides Cypher, a graph database query language, which is a powerful, graph-optimized query language that understands and makes use of the data stored in Neo4j. This also allows graph database nodes to be added, deleted, and changed at any time with great flexibility and scalability, and is several orders of magnitude faster at performing complex join queries than other traditional databases.
Neo4j graph databases represent the connections between entities as they would in the real world, without the logical transformations that relational databases require. How the database structure is built depends on business requirements and performance testing, and there is no standard schema; therefore, its data modelling approach is very flexible. The graph database structure diagram used in this paper is shown in Figure 11. The graph database design consists of five entities and seven types of relationships between the entities. A table of specific node and relationship definitions can be found in Appendix A: Table A2 and Table A3.

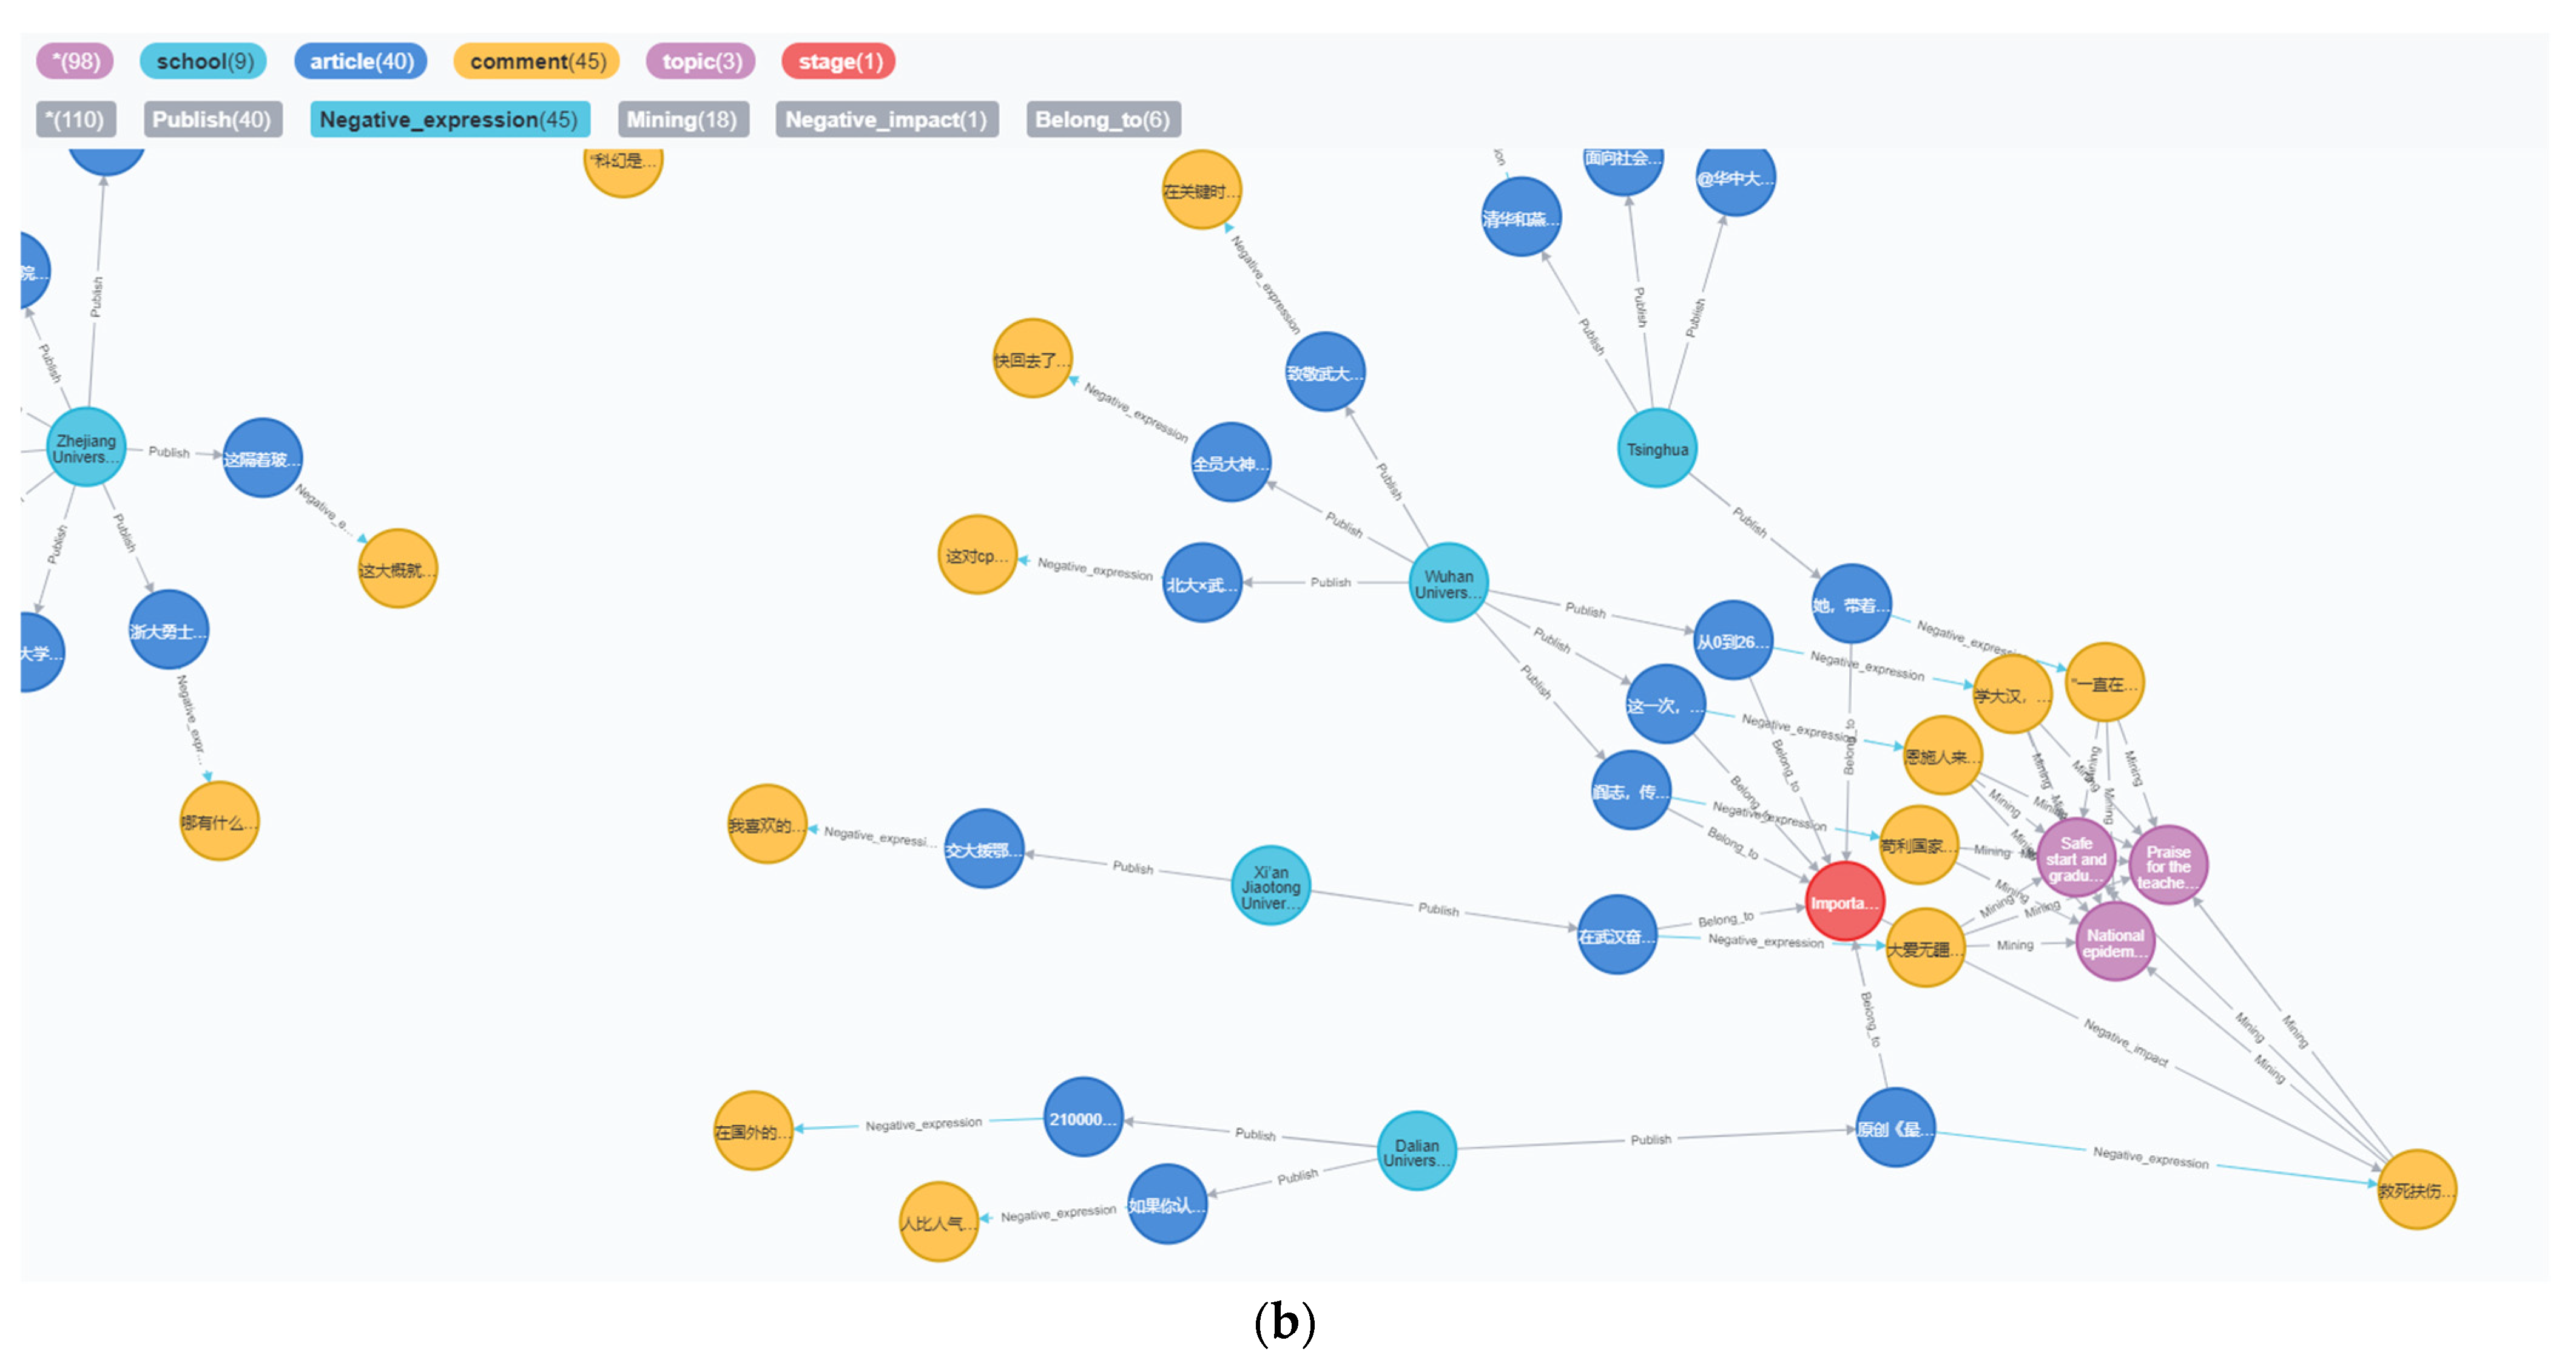
4.2. The Construction of Neo4j Knowledge Graph of Public Opinion in Colleges and Universities

This article imports nodes and relationships via Cypher LOAD CSV. After importing the data into Neo4j, we can obtain the knowledge graph of university public opinion as shown in Figure 12 (Neo4j memory limitation, only some nodes, and relationships are shown). The green circles represent universities, the blue circles represent public articles published by universities, and the yellow circles represent comment content.

4.3. Application of neo4j Topic-Affective Knowledge Graph

4.3.1. Sentiment Retrieval of University Official Account Comments

By analyzing students’ attitudes toward a particular article, that is, by obtaining the distribution of comments on the article, it is possible to understand the thoughts and attitudes of students in higher education and to analyze the reasons for the positive or negative comments, which will help universities to implement timely strategies to maintain a stable online environment.
For example, to query the opening notices issued by universities to check the status of student comments, the query code is as follows:
MATCH (a: article{title:“今天, 开学了! 北航第一批返校的是他们……”})-[]-(b: comment) RETURN a, b
The results of the query are shown in Figure 13, where the blue circles are article titles, the yellow circles are article comments, the red arrows indicate positive comments, and the blue arrows indicate negative comments. It can be seen that students had more positive than negative attitudes toward the start of back-to-school. Through emotion retrieval of the knowledge graph, students’ tendency toward articles on a specific topic can be retrieved to understand students’ attitude towards school decision making, social public opinion, and national policy, which plays an important role in campus supervision and the grasp of public opinion in colleges and universities.

4.3.2. The Source Search of Security Threats in University Social Network

Social networks have a complicated and messy structure and a huge group of users, and the massive information circulating in the network at high speed is difficult to trace and track. In the supervision of public opinion on social networks in colleges and universities, the scope of public opinion management can be greatly reduced by reasoning with the information collected from a large number of user comments, clarifying the information dissemination process of comments–articles–colleges and universities, and finally implementing the source to colleges and universities. This can play a significant role in the regulation of network public opinion.
For example, to find out which universities have the word “dead” in the negative comments of their articles, the search code is as follows:
MATCH (a:school)-[:Publish]-(b:article)-[:Negative_expression]-(c:comment) WHERE c. content =~’.*死.*’ RETURN a, b, c
The results of the query are shown in Figure 14. In Figure 14a, the green nodes are colleges, blue nodes are article titles, and yellow nodes are comments. There were nine university public numbers that included the word “dead” in the negative comments on the article, but the number of comments was small. Further, to analyze a particular comment node, such as the following comment published by the students from Dalian University of Technology: “courage to heal the wounded and rescue the dying, heavier than mount Tai, white angels” the sentiment analysis model can be divided into negative comments, but these can be partially neutral, as the word “death” is not a dangerous word, it is, in fact, in patients with medical staff rescue behavior, praise. Figure 14b expands the purple “comment topic” node and the red “outbreak stage” node by deepening the query on this comment node. By expanding the nodes, the information behind the comments can be better understood and the source of the security threat can be identified.

4.3.3. Public Opinion Monitoring of University Reviews in the COVID-19 Stage

The COVID-19 pandemic broke out at the beginning of 2020, and relevant departments were very alert to the resulting information pandemic in cyberspace, that is, the spread of false, panic, and unstable hazardous information in response to the pandemic. Even though China has entered the post-pandemic period, it still needs to pay close attention to the development of the international pandemic and the potential public opinion risks and do a good job in response and governance. The network public opinion in colleges and universities has the characteristics of fast dissemination and randomness of information dissemination, and the value of college students as the main force of new media is not yet mature. College students are often easily influenced by wrong opinions, which manifests in a large number of negative emotional comments. Therefore, it is particularly necessary to control and monitor public opinion in colleges and universities. Starting from the different stages of the pandemic, this paper explores the attitude of students to the current massive information during the pandemic from the perspective of time, which is conducive to public opinion decision-making in colleges and universities.
For example, to query the commentary on understanding the propensity of students during the T4 period, the query code is as follows:
MATCH p=(:stage{time:’Normalization period for epidemic prevention and control’})-[]-(:comment) RETURN p LIMIT 15000
The results of the query are shown in Figure 15, with the blue areas being negative sentiment comments and the red areas being positive sentiment comments. It can be clearly seen that students’ positive attitudes toward information about the pandemic outweighed the negative attitudes during this period, and the information pandemic in cyberspace was in good condition.

5. Conclusions

In this paper, data were collected through Fiddler on comments and other relevant information on pandemic-themed articles from ten universities’ official accounts. We calculated sentiment values and mapped sentiment tendency distribution for article comments using the built BiLSTM_LSTM sentiment analysis model. According to the interval of emotion value, the positivity or negativity of the comments was determined. The binary comment data set was subdivided according to the four stages of the pandemic, and the eight subdivided data sets were imported into the LDA topic model for topic clustering. According to the confusion index, the best number of topic categories was obtained, and then the topic name was determined by combining the subject word weight and pyldavis visualization results. The Sankey diagrams of positive and negative comment topics were drawn, respectively. Finally, the sentiment analysis results and the results of LDA text mining were integrated, and the nodes and relationships of the Neo4j graph database were determined by identifying entities and relationships, and the CSV data table was imported into Neo4j for data storage and visual presentation, which completed the construction of a public opinion topic–sentiment knowledge graph in colleges and universities. The Cypher statement was used to query the graph database and summarize the application scenarios of the knowledge graph.
  • Theoretical contribution
Firstly, this study helps to study the influence of new social media on public opinion in universities from the perspective of university public numbers. Using university WeChat public number platforms as the experimental platform and pandemic-themed articles as the experimental data source, it provides a new model for the construction method of topic mapping of public opinion events in universities by introducing the topic–sentiment knowledge graph into the research field of university public opinion analysis. Traditionally, most of the data for research on public opinion in universities come from microblogs, but with the development of social network media and the arrival of the 5G era, students are using WeChat more frequently. At the same time, WeChat Official Accounts in colleges and universities are growing rapidly, and the campus ecology in the “Internet+” era has led to the rapid development of public numbers in colleges and universities, which have also become one of the main platforms for students to express their opinions and are an important platform for researching public opinion in colleges and universities. The data obtained in this paper based on this platform are more representative.
Secondly, this study attempts to adapt and improve on the traditional LSTM network, and the obtained BiLSTM_LSTM model for sentiment analysis is good in terms of accuracy, which also lays the foundation for the subsequent construction of a sentimental knowledge graph.
Once again, this study’s dataset, which combines pandemic stages and sentiment tendencies for segmentation, also plays a significant role in the LDA mining of this paper. The LDA topic model finally yields a trend evolution diagram of pandemic article comment topics, which deeply explores the intrinsic relationship between comment contents and also provides material for the prediction and research of university public opinion in the new media era.
Finally, this study uses an efficient and convenient graph database to build a knowledge graph, circumventing the usual problem of using large amounts of structured data to generate a static knowledge graph for opinion analysis, which makes subsequent changes costly. By querying the edges (relationships) of an entity to quickly obtain another entity linked to it, the complex association operations of various tables are eliminated, and the relationship query is more convenient and significantly more efficient. It can also be used in subsequent research to build opinion monitoring systems.
  • Regulatory and policy implications
For campus administrators, this study can timely track and analyze the development of this pandemic topic in colleges and universities, which is conducive to improving the knowledge management ability of colleges and universities regarding network public opinion in the new media era, fully exploring the explicit and implicit values of students’ comments, and providing college staff with methods to better organize, manage, and understand students’ opinions, which, in turn, is conducive to promoting sound relevant campus network public opinion guidance mechanisms. Campus policymakers can make use of the Neo4j topic–sentiment knowledge graph to promote the formation of an informative and professional management team, rationalize the planning and construction of campus network platforms, correctly and effectively lead students to use the Internet, and cultivate their media literacy.
  • Limitations and future prospects
At the same time, this paper still has certain limitations in the research process: first, the use of open-source annotated sentiment quotes in the training of the sentiment analysis model has biases in matching with university students’ comments, and the goodness of the annotation affects the final classification results; second, the optimization of the Neo4j graph database is not sufficient, which could easily result in memory overflow in subsequent query operations; third, the expression of the evolutionary dynamics of the topic of the Sankey diagram visualization is not displayed in the dynamic sentimental knowledge graph.
Based on the topic–sentiment knowledge graph of university public opinion events constructed in this paper, the relationship between the degree of emotional tendency and universities, regions, and the number of likes can be explored through the method of correlation analysis; it can be combined with other machine learning techniques to make a portrait of the users’ public opinion on unexpected events based on university students’ information and to provide theoretical support for accurate public opinion guidance; the knowledge map function can also be improved to realize an early warning system for public opinion Q&A.
In this paper, the focus of research is limited to university public opinion, but without limits, the interesting directions for future research may be (1) the use of topic–sentiment knowledge graphs by FMCG companies to analyze consumers’ hidden needs and develop personalized push services; (2) the realization of accurate health information demand for users of the “Internet + Health” platform; (3) the exploration of potential characteristics of public service personnel and the promotion of matching job requirements with personnel characteristics; and (4) profiling the behavior of users in multiple social environments. To do this, we need a multi-disciplinary and diverse dataset to test our approach and explore empirical insights from multiple disciplines and research areas.

Author Contributions

Methodology, visualization, and writing—original draft preparation, X.L.; writing—review and editing and supervision, Z.L.; data curation, Y.T. All authors have read and agreed to the published version of the manuscript.

Funding

This research received no external funding.

Institutional Review Board Statement

Not applicable.

Informed Consent Statement

Not applicable.

Data Availability Statement

Not applicable.

Conflicts of Interest

The authors declare no conflict of interest.

Appendix A

Table A1. Data from the “pandemic” themed WeChat official accounts.
University NameArticle TitleArticle Publication TimeUsernameComment Post TimeCommentsLikes
Peking UniversityGeneral secretary Xi Jinping sent five letters to Peking University.18 March 2020The suit.18 March 2020 12:18Go China! Go Peking University! [Fist] [Fist]24
Peking UniversityGeneral secretary Xi Jinping sent five letters to Peking University.18 March 2020Big North Shirakawa18 March 2020 12:26Come on [Love]
You can definitely [love]
The power of youth can hold up China
34
Peking UniversityUrgent help from the Middle East! Peking University and Qatar University shared their experience in combating the pandemic through a video link.21 March 2020Chen21 March 2020 8:12“Snow melts on the Liaohe River, flowers bloom on the Rich Mountain; With the same breath and branches, looking forward to the coming of spring.”
We hope to work together to stop the pandemic
Looking forward to the end of the pandemic
8
Peking UniversityUrgent help from the Middle East! Peking University and Qatar University shared their experience in combating the pandemic through a video link21 March 2020EASYMONEY21 March 2020 9:34Hope everyone is safe11
Peking UniversityPeking University academicians, professors, outstanding students on TV together, come to watch this immortal class meeting!24 March 2020Wang xi24 March 2020 20:41Peking University is really full of talents. I hope I can meet with Peking University in 202220
Peking UniversityPeking University academicians, professors, outstanding students on TV together, come to watch this immortal class meeting!24 March 2020ASe thé vert24 March 2020 20:45Every flower of Peking University blooms and dedicates in its proper place14
Table A2. Knowledge graph entity types.
Entity TypeMeaningNumber of EntitiesExample
schoolUniversity name10Tsinghua University
articleArticle title1163The Peking University research team has for the first time confirmed that human respiration is an important emission transmission mode of novel coronavirus
commentArticle comments22,134We 60 million people in Hubei sincerely thank you!
topicComment topic40Hero triumph
stagePandemic stage4Initial containment period of the pandemic
Table A3. Knowledge graph relationship types.
Entity Relationship TypeMeaningNumber of RelationshipsExample
PublishUniversities publish articles2326Wuhan University|Publish|Official announcement! Announcement of the campus policy during the opening of Wuhan University
Belong_toThe publishing time of the article belongs to the stage2326Zhejiang University held the 36th Teacher’s Day and Advanced Commendation Meeting|Belong_to|Normalization period for pandemic prevention and control
article_P_commentPositive comments in the article22,828Peking University, on the front line!|Positive_expression|Come on, Wuhan, Come on, Peking University
article_N_commentNegative comments in the article21,414A message from Peking University Senior three students: Adolescence has a period; we will not see each other!|Negative_expression|Guard against arrogance and rashness, do not forget your original intention, only 123 days left, coming to you!
stage_P_commentComments on positive guidance during the pandemic stage22,828Initial containment period of the pandemic|Positive_guidance|I hope that the pandemic will end soon and every Chinese will be safe and happy
stage_N_commentComments on the negative impact of the pandemic stage21,440Initial containment period of the pandemic|Negative_impact|A tribute to the retrograde heroes of Peking University, the responsibility of the country and the nation.
Comment_topicTopics mined from comments225,868Resolutely implement!|Mining|Schools obey uniform arrangements

References

  1. WeChat Official Accounts. Available online: https://mp.weixin.qq.com (accessed on 20 November 2021).
  2. Chen, X.; He, Y. Research on negative network public opinion communication in universities based on the motivation theory under the new media environment. J. High. Educ. Manag. 2020, 14, 105–116. [Google Scholar] [CrossRef]
  3. Huang, S.; Si, W.; Mu, T. Innovation and Research of Online Public Opinion Control and Guidance Mechanism in Universities in the Self-media Era. Inf. Sci. 2021, 39, 62–67+91. [Google Scholar]
  4. Kuru Alici, N.; Ozturk Copur, E. Anxiety and fear of COVID-19 among nursing students during the COVID-19 pandemic: A descriptive correlation study. Perspect. Psychiatr. Care 2021. Advance online publication. [Google Scholar] [CrossRef]
  5. Zhang, C.; Ma, X.; Zhou, Y.; Guo, R. Analysis of Public Opinion Evolution in COVID-19 Pandemic from a Perspective of Sentiment Variation. J. Geo-Inf. Sci. 2021, 23, 341–350. [Google Scholar]
  6. Imamah; Rachman, F. Twitter Sentiment Analysis of COVID-19 Using Term Weighting TF-IDF And Logistic Regresion. In Proceedings of the 2020 6th Information Technology International Seminar (ITIS), Surabaya, Indonesia, 14–16 October 2020; pp. 238–242. [Google Scholar]
  7. Wu, J. Construct a Knowledge Graph for China Coronavirus (COVID-19) Patient Information Tracking. Risk Manag. Healthc. Policy 2021, 14, 4321–4337. [Google Scholar] [CrossRef] [PubMed]
  8. Fatani, T.H. Student satisfaction with videoconferencing teaching quality during the COVID-19 pandemic. BMC Med. Educ. 2020, 20, 396. [Google Scholar] [CrossRef]
  9. Tasso, A.F.; Sahin, N.H.; San Roman, G.J. COVID-19 Disruption on College Students: Academic and Socioemotional Implications. Psychol. Trauma-Theory Res. Pract. Policy 2021, 13, 9–15. [Google Scholar] [CrossRef]
  10. Ma, T. The Influence of Emergency Network Public Opinion on Ideological and Political Education in Colleges and Universities and Its Countermeasures—Taking the“COVID-19”Network Public Opinion as an Example. Educ. Explor. 2020, 53–57. [Google Scholar]
  11. Wang, Q.; Mao, Z.; Wang, B.; Guo, L. Knowledge Graph Embedding: A Survey of Approaches and Applications. IEEE Trans. Knowl. Data Eng. 2017, 29, 2724–2743. [Google Scholar] [CrossRef]
  12. You, L.; Lang, Y. Construction and Query Application of Emotion Knowledge Graph Based on Semantic Analysis of Product Reviews. Inf. Stud. Theory Appl. 2018, 41, 132–136. [Google Scholar] [CrossRef]
  13. Xu, Z.; Yu, Z.; Dong, Y.; Yan, W. Research on Constructing the Knowledge Graph Based on Emotional Analysis of Film Review. Comput. Simul. 2020, 37, 424–430. [Google Scholar]
  14. Li, J. The Study of Emotional Map of University Public Opinion Users in social media: A Case of “Anti-academic Misconduct” in Sina Weibo. Inf. Sci. 2020, 38, 100–104. [Google Scholar] [CrossRef]
  15. Xie, T.; Yang, Y.; Li, Q.; Liu, X.; Wang, H. Knowledge Graph Construction for Intelligent Analysis of Social Networking User Opinion. In Proceedings of the International Conference on e-Business Engineering, Cham, Germany, 19–21 October 2020; pp. 236–247. [Google Scholar]
  16. Kumar, A.; Kawahara, D.; Kurohashi, S. Knowledge-enriched Two-layered Attention Network for Sentiment Analysis. arXiv 2018, arXiv:1805.07819v4. [Google Scholar]
  17. Lin, S.; Lin, S.; Wei, J.; Wu, Y.; Liao, X. Emotional classification of combining knowledge graph. J. Fuzhou Univ. (Nat. Sci. Ed.) 2020, 48, 269–275. [Google Scholar]
  18. Han, W.; Xu, L.; Niu, A.; Jing, Y.; Qin, W.; Zhang, J.; Jing, X.; Wang, Y. Online-Based Survey on College Students’ Anxiety During COVID-19 Outbreak. Psychol. Res. Behav. Manag. 2021, 14, 385–392. [Google Scholar] [CrossRef] [PubMed]
  19. Liu, Q. Challenges and Responses of Online Public Opinion Guidance in Universities during Epidemic Prevention and Control. Cuanbo Yu Banq. 2020, 185–188. [Google Scholar] [CrossRef]
  20. Mukhtar, K.; Javed, K.; Arooj, M.; Sethi, A. Advantages, Limitations and Recommendations for online learning during COVID-19 pandemic era. Pak. J. Med. Sci. 2020, 36, S27–S31. [Google Scholar] [CrossRef]
  21. Sorour, S.E.; Kamel, T.M.; Abdelkader, H.E. A Hybrid Virtual Cloud Learning Model during the COVID-19 Pandemic. CMC-Comput. Mater. Contin. 2021, 66, 2671–2689. [Google Scholar] [CrossRef]
  22. Lu, K.; Zhao, L. Analysis and Enlightenment of Public Opinion on Education in Public Emergencies —Taking the Public Opinion on Education in Beijing During the COVID-19 Epidemic for Example. Educ. Meas. Eval. 2020, 15–22. [Google Scholar] [CrossRef]
  23. Yao, L.; Yang, Q.; Miao, L. Public Opinion Events of University Online Teaching: An Analysis with Text Mining from New Media. J. Hulunbeier Univ. 2020, 28, 114–119. [Google Scholar]
  24. Li, S.; Zhao, Z.; Hu, R.; Li, W.; Liu, T.; Du, X. Analogical Reasoning on Chinese Morphological and Semantic Relations. In Proceedings of the Meeting of the Association for Computational Linguistics, Melbourne, Australia, 15–20 July 2018; pp. 138–143. [Google Scholar]
  25. ChineseNlpCorpus. Available online: https://github.com/SophonPlus/ChineseNlpCorpus/ (accessed on 20 November 2021).
  26. Chinese Data Preprocessing Materials. Available online: https://github.com/procectcollection/Chinese (accessed on 20 November 2021).
  27. The State Council Information Office of the People’s Republic of China. Fighting COVID-19 China in Action; Foreign Languages Press: Beijing, China, 2020. [Google Scholar]
  28. Fiddler. Available online: https://www.telerik.com/fiddler (accessed on 20 November 2021).
  29. Sharfuddin, A.A.; Tihami, M.N.; Islam, M.S. A Deep Recurrent Neural Network with BiLSTM model for Sentiment Classification. In Proceedings of the 2018 International Conference on Bangla Speech and Language Processing (ICBSLP), Sylhet, Bangladesh, 21–22 September 2018; pp. 1–4. [Google Scholar]
  30. Xu, G.; Meng, Y.; Qiu, X.; Yu, Z.; Wu, X. Sentiment Analysis of Comment Texts Based on BiLSTM. IEEE Access 2019, 7, 51522–51532. [Google Scholar] [CrossRef]
  31. Kumar, V.; Reforgiato Recupero, D.; Riboni, D.; Helaoui, R. Ensembling Classical Machine Learning and Deep Learning Approaches for Morbidity Identification From Clinical Notes. IEEE Access 2020, 9, 7107–7126. [Google Scholar] [CrossRef]
  32. Elfaik, H.; Nfaoui, E.H. Combining Context-Aware Embeddings and an Attentional Deep Learning Model for Arabic Affect Analysis on Twitter. IEEE Access 2021, 9, 111214–111230. [Google Scholar] [CrossRef]
  33. Hameed, Z.; Zapirain, B.G. Sentiment classification using a single-layered BiLSTM model. IEEE Access 2020, 8, 73992–74001. [Google Scholar] [CrossRef]
  34. Hameed, Z.; Garcia-Zapirain, B.; Ruiz, I.O. A computationally efficient BiLSTM based approach for the binary sentiment classification. In Proceedings of the 2019 IEEE International Symposium on Signal Processing and Information Technology (ISSPIT), Ajman, United Arab Emirates, 10–12 December 2019. [Google Scholar]
  35. Du, H.S.; Zhan, B.; Xu, J.; Yang, X. The influencing mechanism of multi-factors on green investments: A hybrid analysis. J. Clean. Prod. 2019, 239, 117977. [Google Scholar] [CrossRef]
  36. Fei, X. An LDA based model for semantic annotation of Web English educational resources. J. Intell. Fuzzy Syst. 2021, 40, 3445–3454. [Google Scholar] [CrossRef]
  37. Song, C.; Guo, C.; Hunt, K.; Zhuang, J. An Analysis of Public Opinions Regarding Take-Away Food Safety: A 2015–2018 Case Study on Sina Weibo. Foods 2020, 9, 511. [Google Scholar] [CrossRef] [Green Version]
  38. Tan, X.; Zhuang, M.; Lu, X.; Mao, T. An Analysis of the Emotional Evolution of Large-Scale Internet Public Opinion Events Based on the BERT-LDA Hybrid Model. IEEE Access 2021, 9, 15860–15871. [Google Scholar] [CrossRef]
  39. Neo4j. Available online: https://neo4j.com/ (accessed on 20 November 2021).
Figure 1. Topic-–sentiment knowledge graph model of public opinion in colleges and universities.
Electronics 10 02921 g001
Figure 2. The main line of event development followed in the study of this paper.
Electronics 10 02921 g002
Figure 3. Fiddler working schematic.
Electronics 10 02921 g003
Figure 4. Block diagram of the proposed model.
Electronics 10 02921 g004
Figure 5. Emotional Tendency Distribution Map.
Electronics 10 02921 g005
Figure 6. LDA topic model structure diagram.
Electronics 10 02921 g006
Figure 7. LDA topic confusion trend chart of the positive sentiment data set during the T4 period.
Electronics 10 02921 g007
Figure 8. Visualization results of pyldavis Library.
Electronics 10 02921 g008
Figure 9. Topic content evolution map of positive comment.
Electronics 10 02921 g009
Figure 10. Topic content evolution map of negative comment.
Electronics 10 02921 g010
Figure 11. Neo4j database structure diagram.
Electronics 10 02921 g011
Figure 12. A Neo4j-based Emotional Knowledge Graph of the Pandemic Theme of University Official Accounts.
Electronics 10 02921 g012
Figure 13. Query the results of the comments on the article “Today, school is starting! The first batch of Beihang back to school are they…”.
Electronics 10 02921 g013
Figure 14. (a) Search results for negative comments on university official accounts articles containing “dead”. (b) Deeper search results based on figure (a).
Electronics 10 02921 g014aElectronics 10 02921 g014b
Figure 15. Comment on emotional tendencies during the period of normalization of pandemic prevention and control.
Electronics 10 02921 g015
Table 1. Model architecture parameters.
Layer (Type)Output ShapeParam #
embedding (Embedding)(None, 113, 300)15,000,000
bidirectional (Bidirectional)(None, 113, 128)186,880
lstm_1 (LSTM)(None, 16)9280
dense (Dense)(None, 1)17
Total params: 15,196,177
Trainable params: 196,177
Non-trainable params: 15,000,000
Table 2. BiLSTM_LSTM model prediction results.
CommentsSentiment ValueSentiment Classification
Tsinghua University! How many people’s faith!0.0207969250
The little brothers and sisters who have studied well are all so good-looking [eat melon]0.98677921
Different departure, the same belief: unremitting self-improvement0.0010080
When I was an intern in ICU, I had a close relationship with Brother Ding. I am a gentle and considerate doctor. I pay tribute to my seniors and learn from them.0.7048951
Return is still a boy [strong] [strong] [strong] [strong] [strong]0.8601221
I envy0.0009781120
Table 3. Partial running results of LDA topic model.
TOPIC1TOPIC2TOPIC3
Give a like127.3196South China Normal University66.1488Tsinghua74.43001
Beihang University94.66321Pandemic64.99213See36.84994
Love85.02743Student47.41485Miss36.34968
Teacher85.02378Take on45.90197Salute35.44682
Wuhan University83.02523Together30.76216Safety34.50235
Zhejiang University70.51457Country27.04597Hope30.35487
Great56.31093Good job22.38388School opens28.34165
School55.97728Awesome21.37601Learning28.14177
Alma mater49.29518Society20.35642Return26.83747
Alumni36.29545Big love19.51961Graduation25.70739
Publisher’s Note: MDPI stays neutral with regard to jurisdictional claims in published maps and institutional affiliations.

