
Recognition of Rice Sheath Blight Based on a Backpropagation Neural Network

 ,
,
Abstract
:1. Introduction
2. Proposed Methods
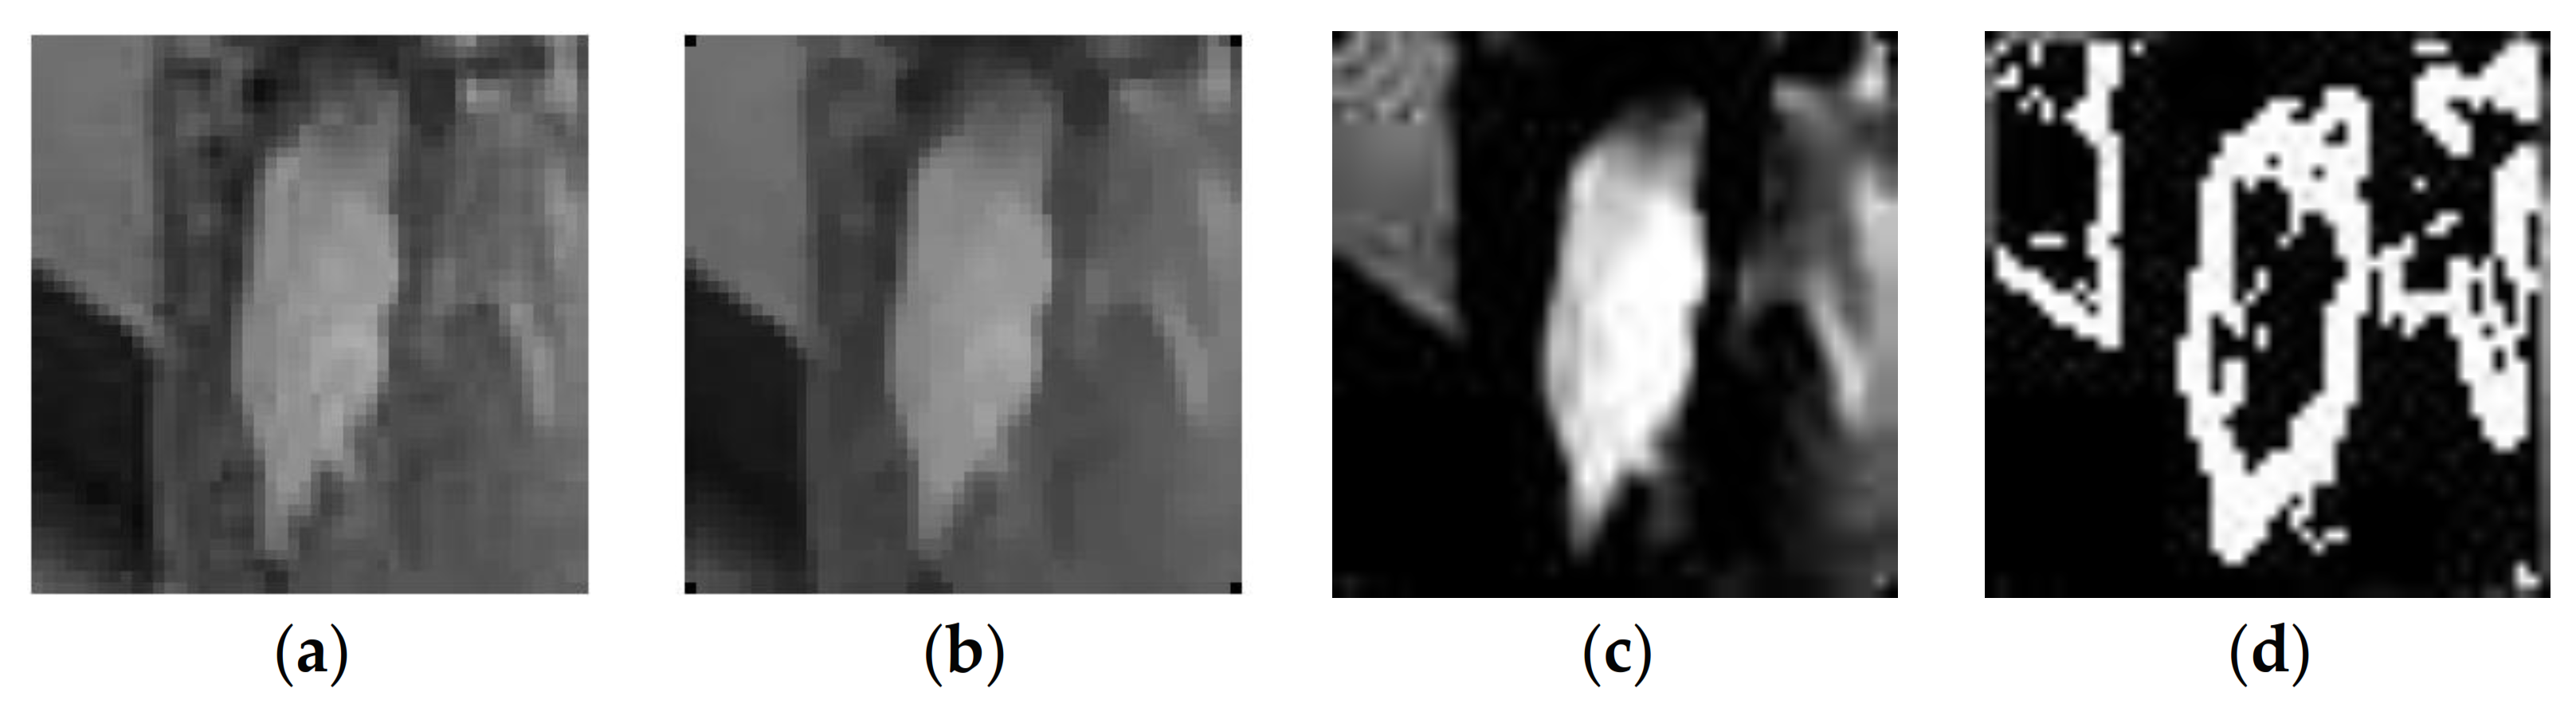
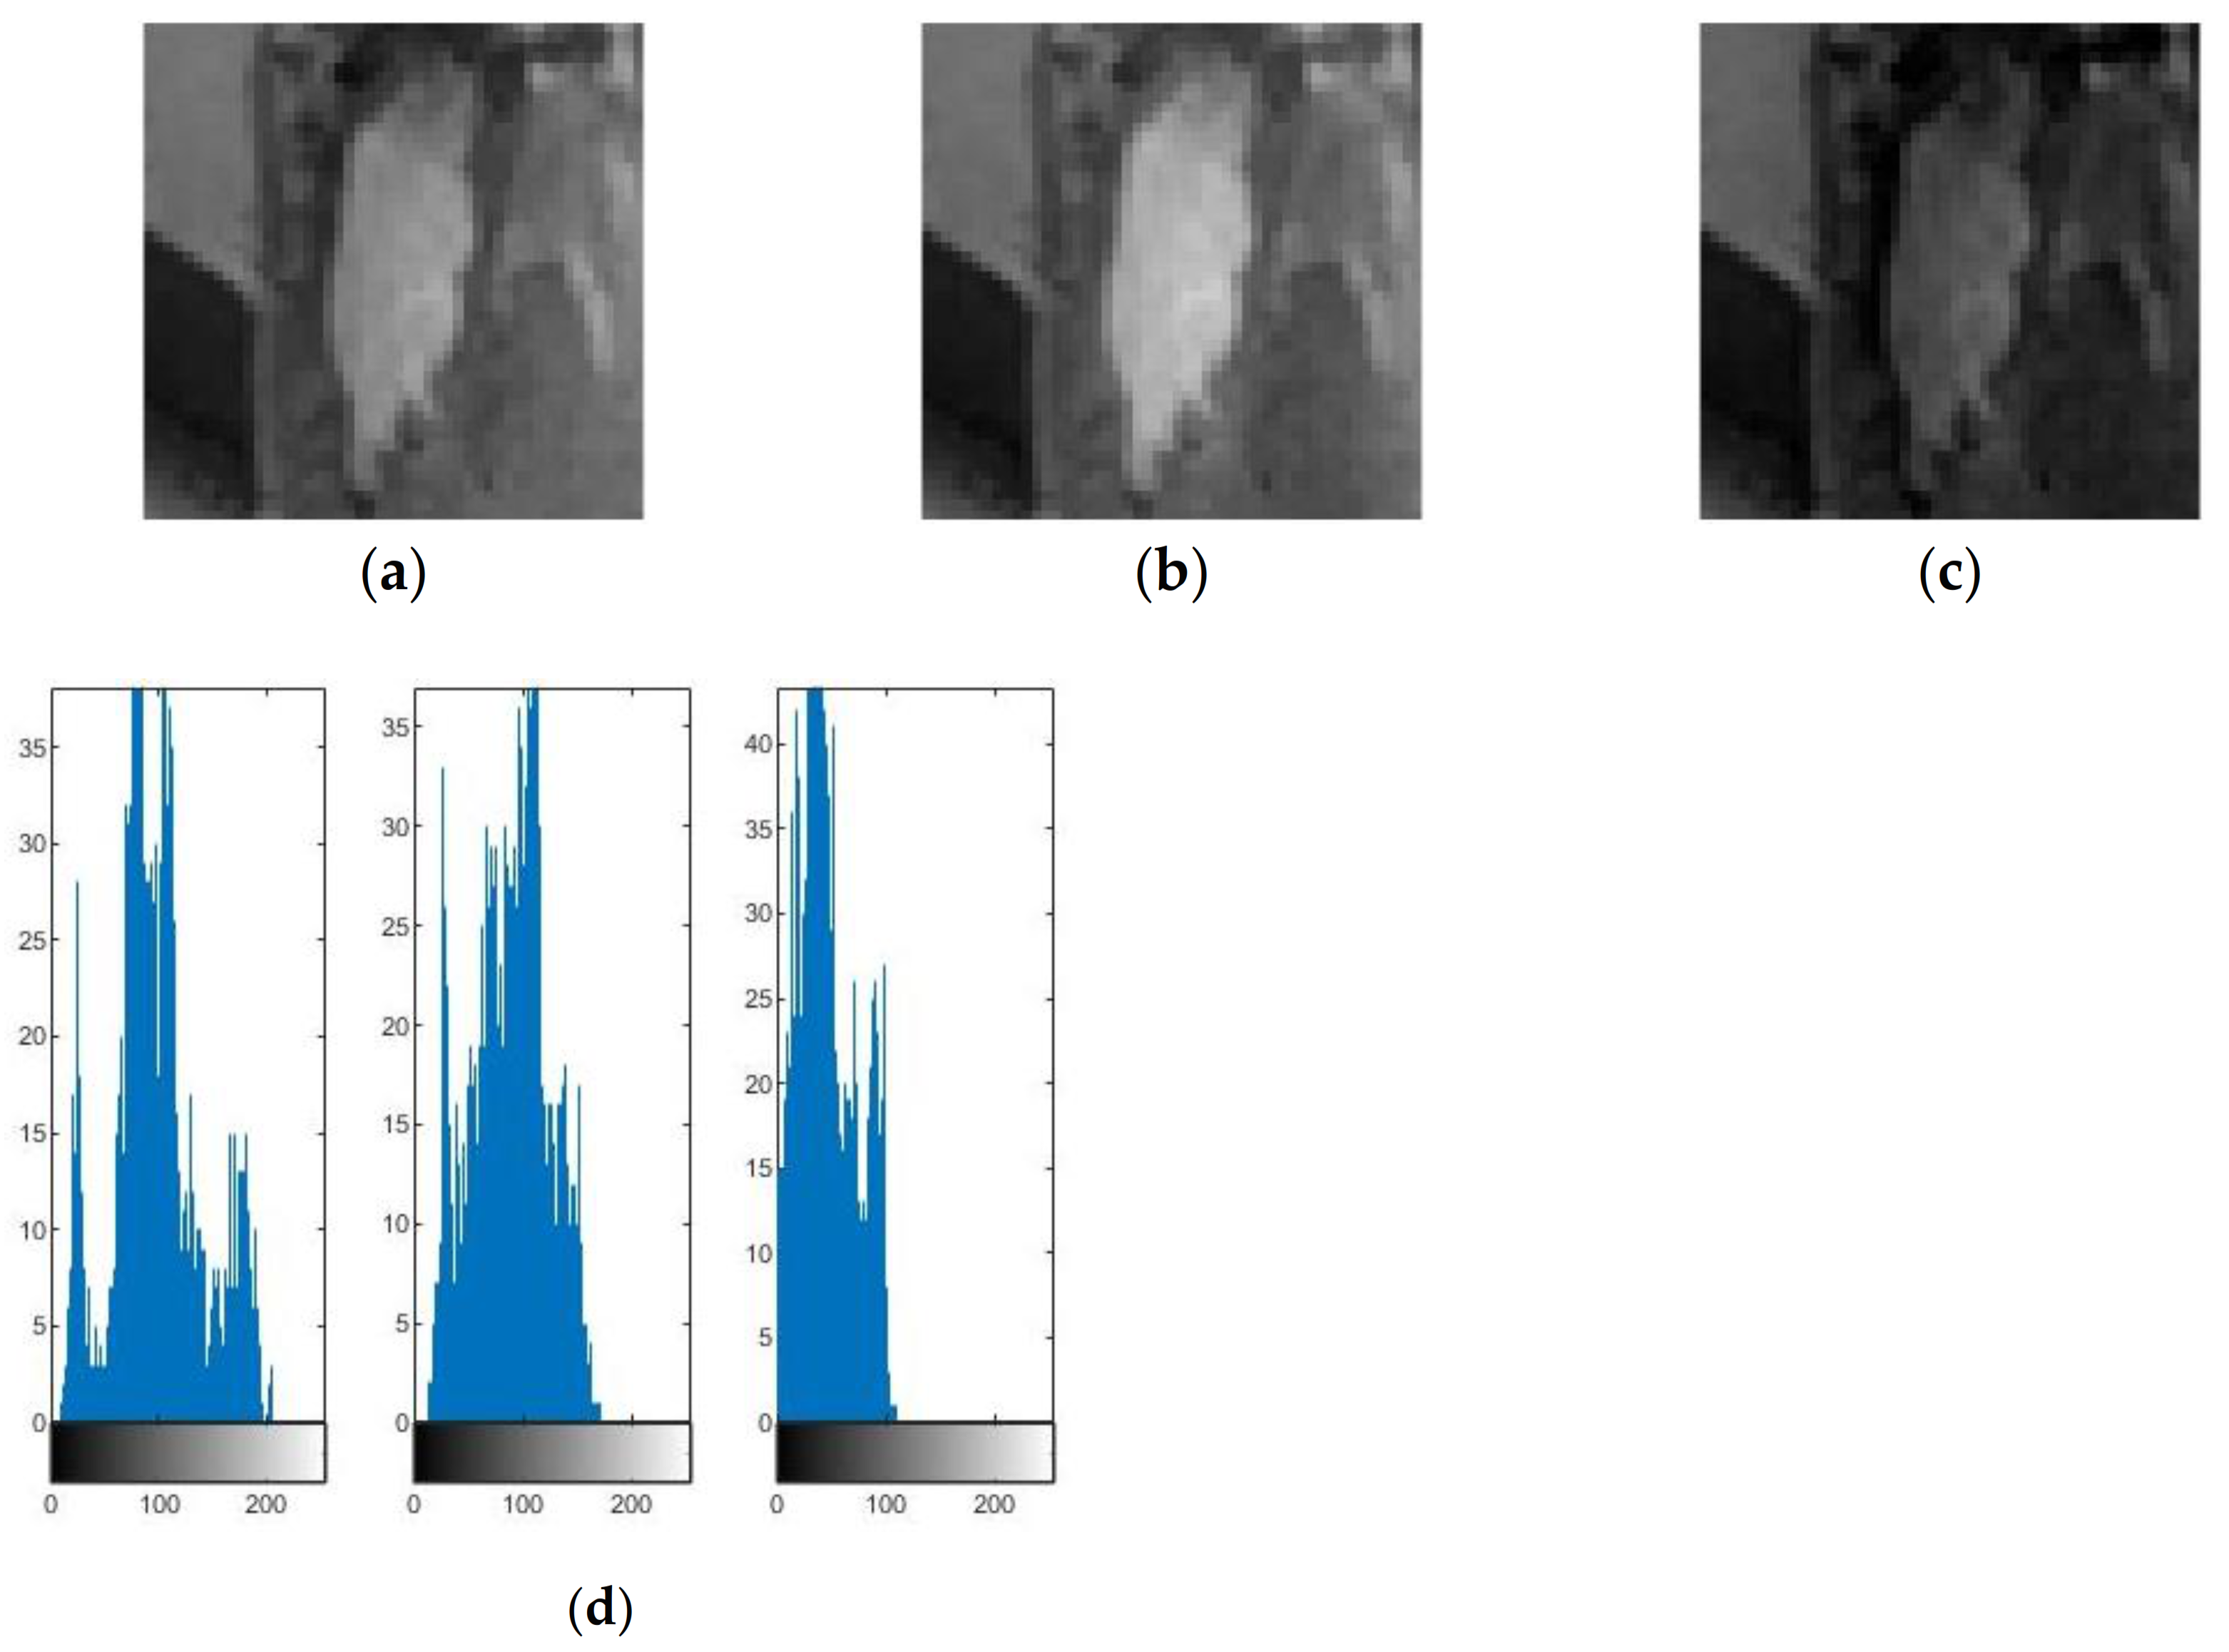
2.1. Image Preprocessing
2.2. Feature Extraction
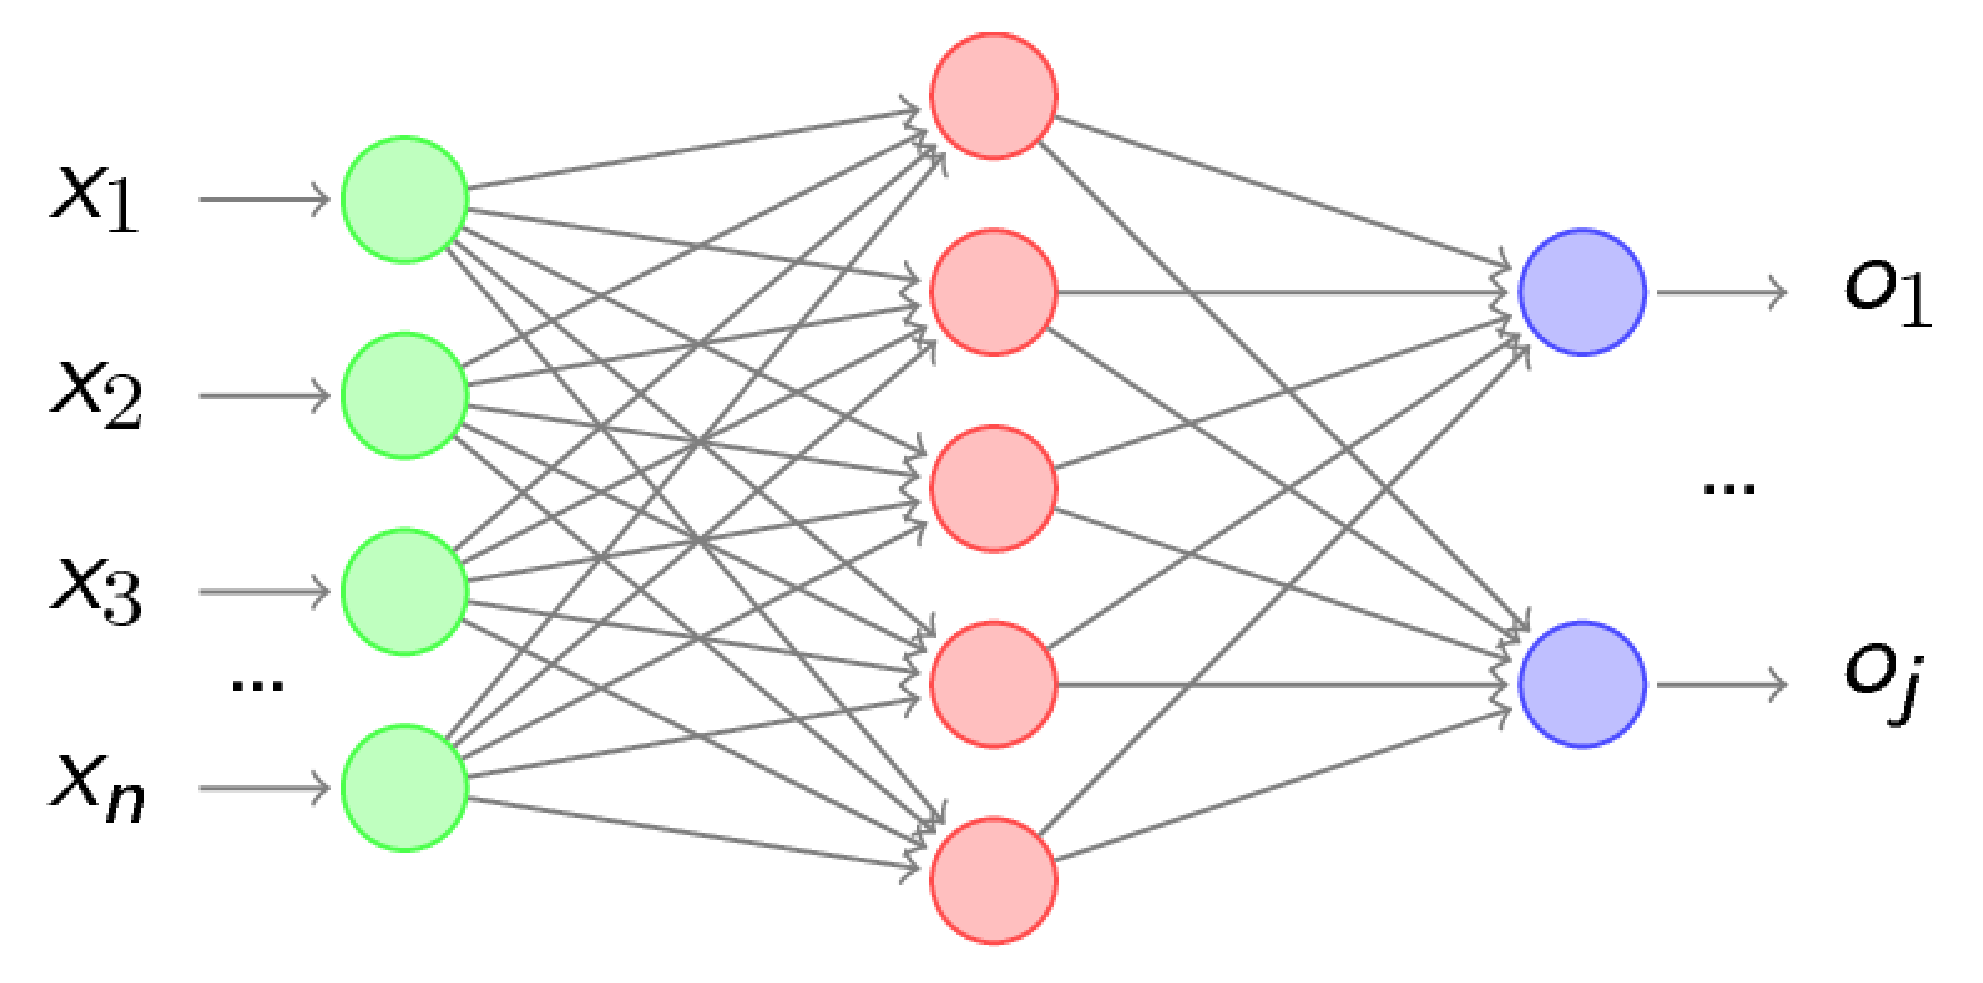
2.3. The BP Neural Network
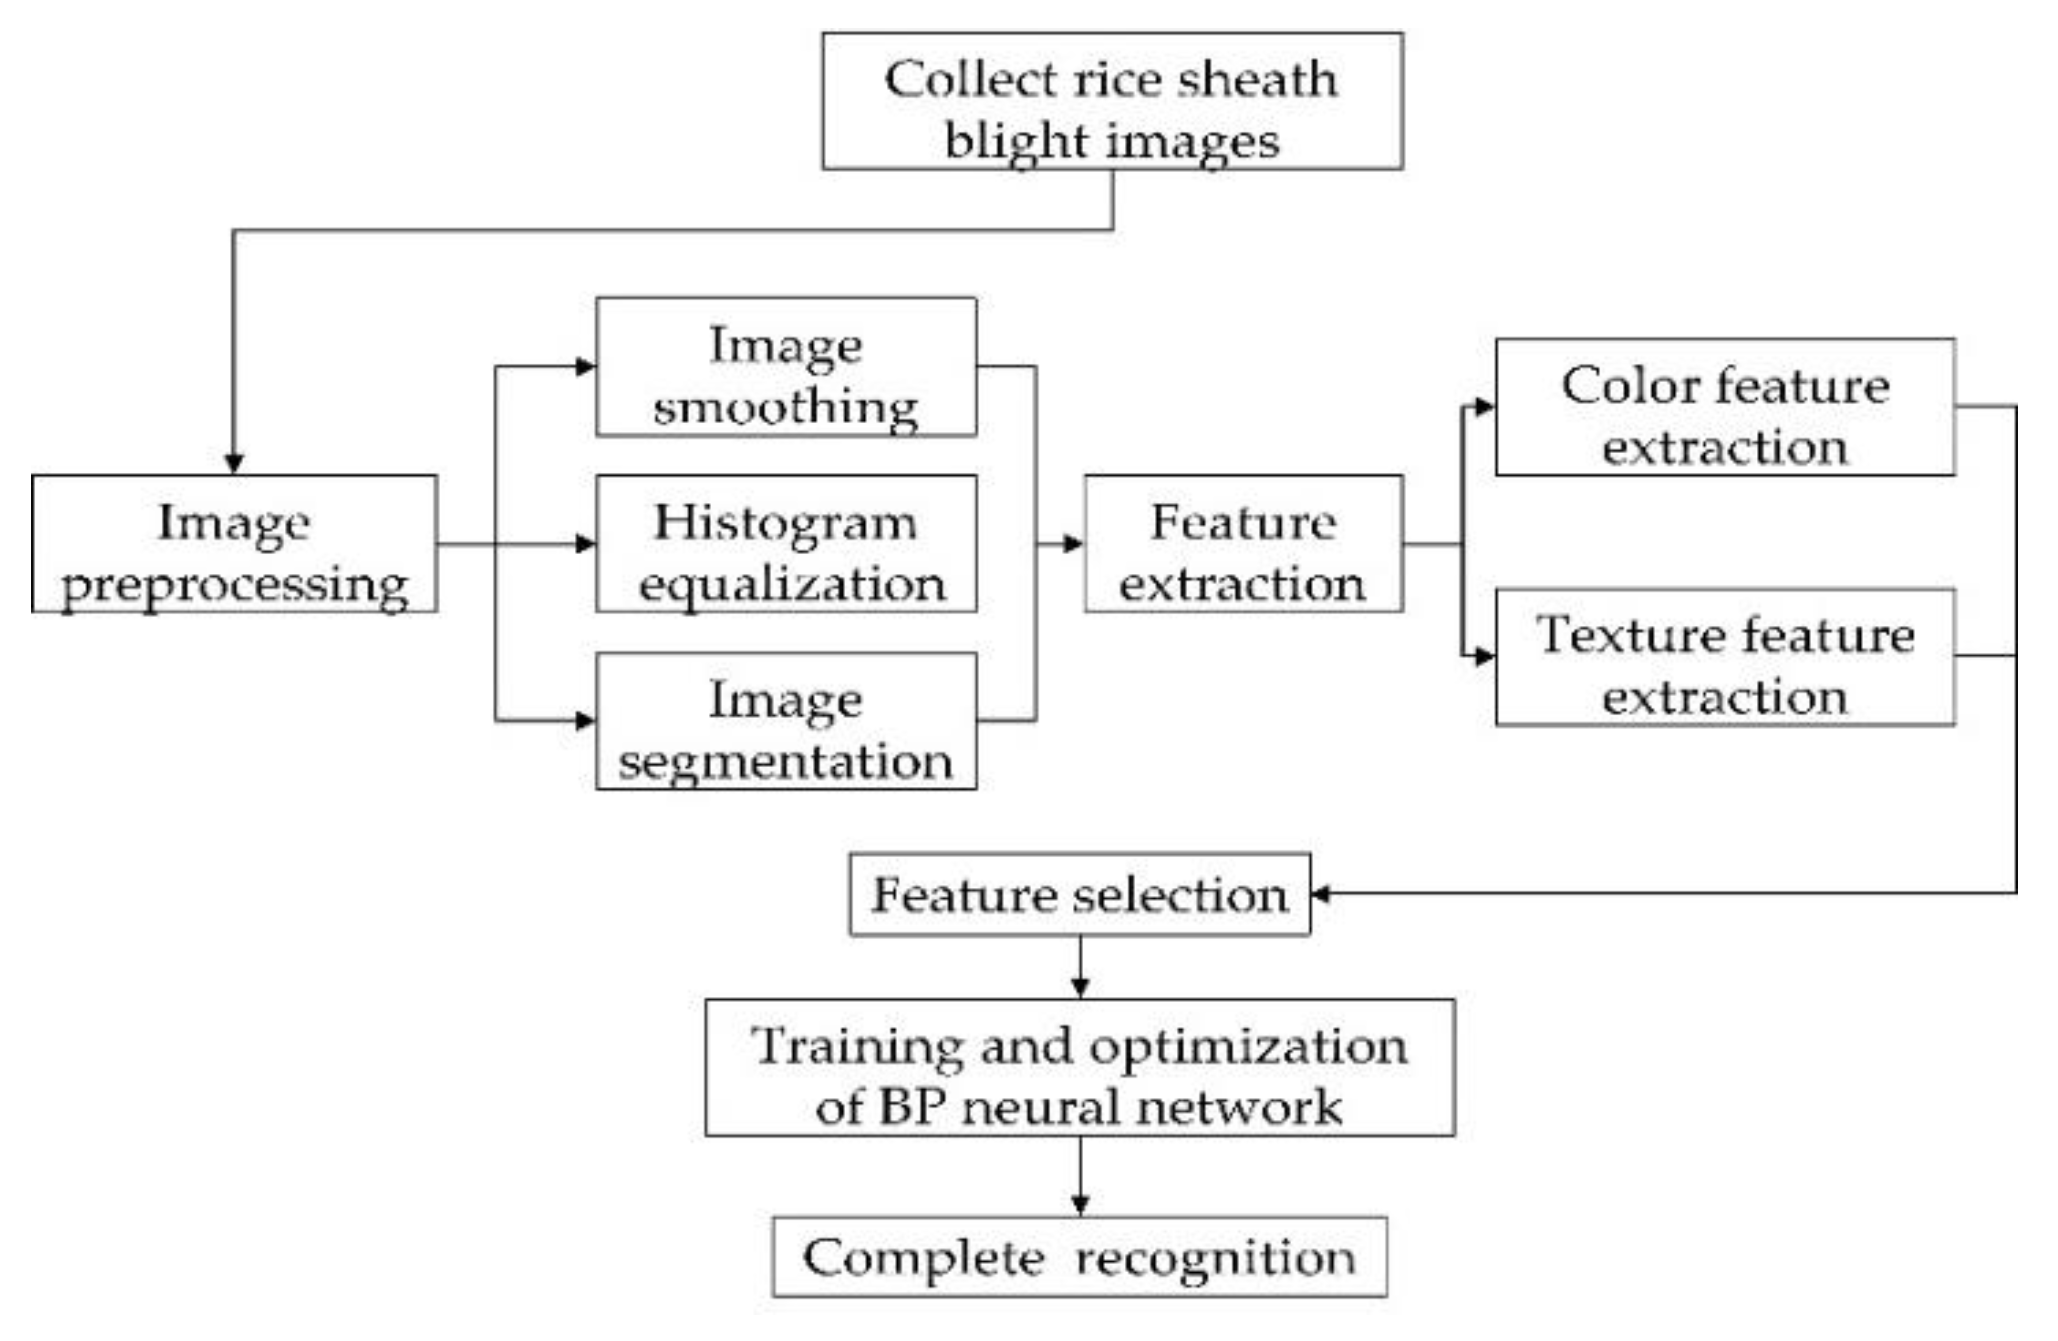
2.4. Process of the Proposed Method
- (1)
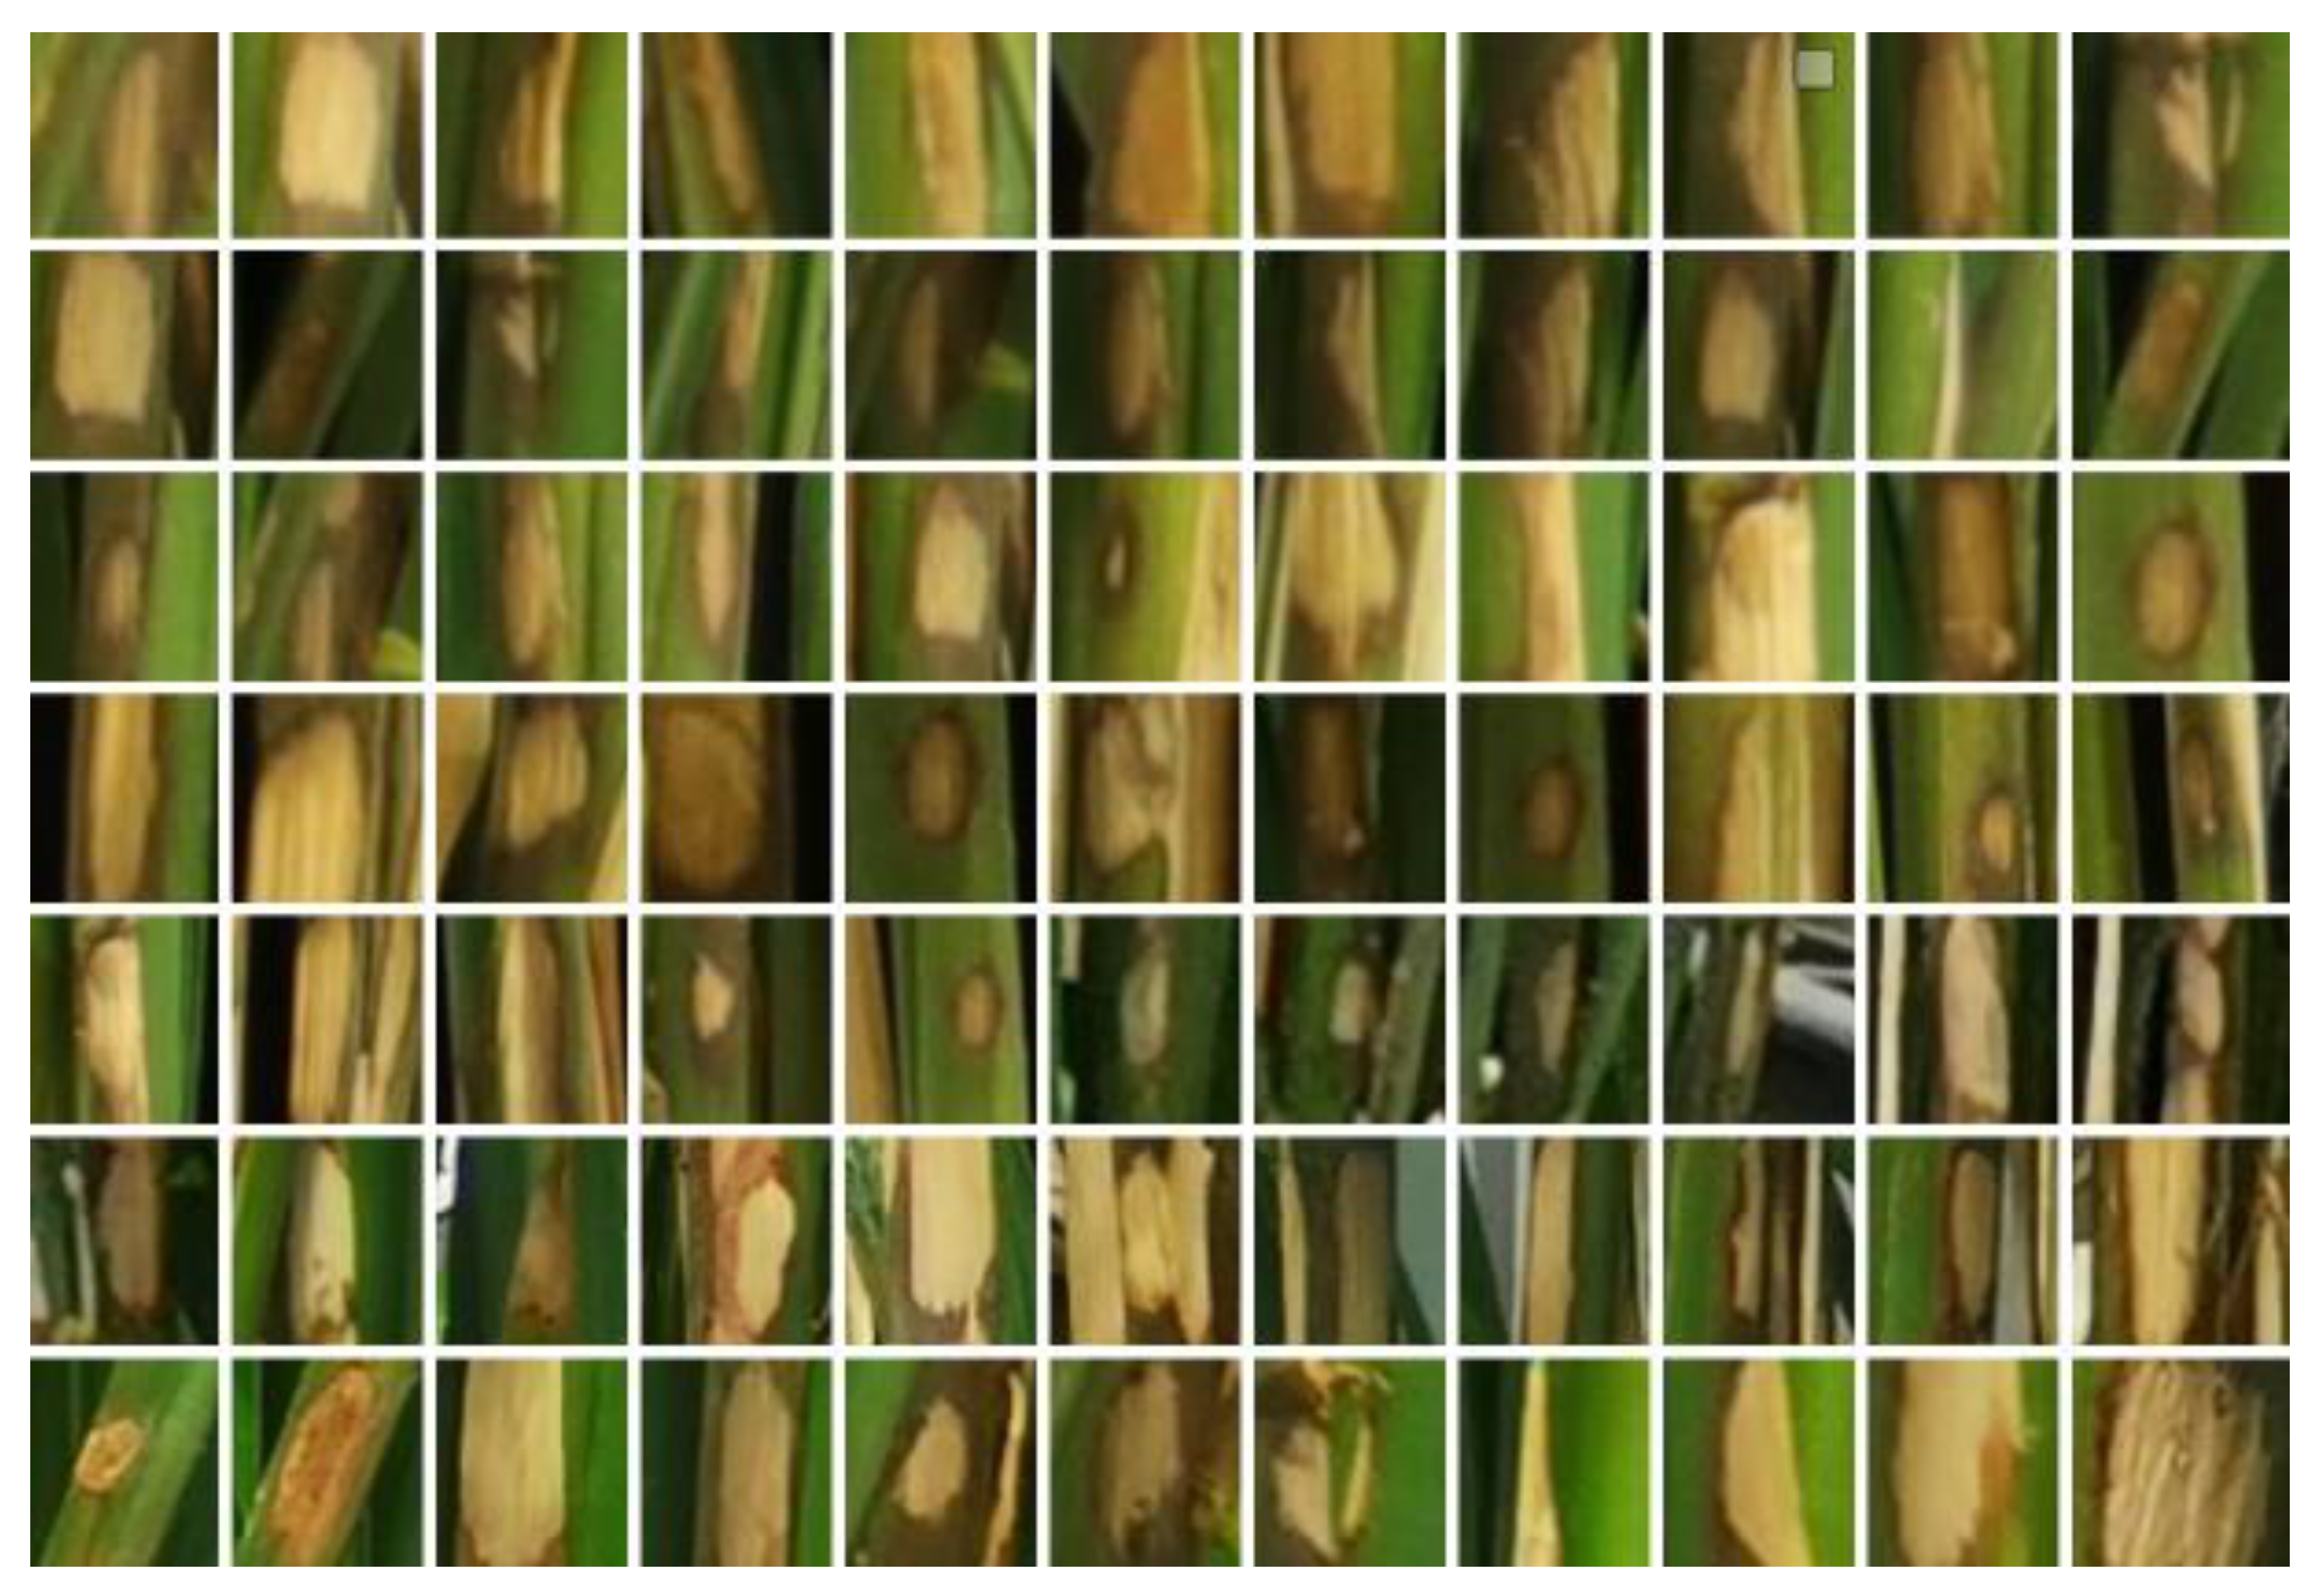
- Image acquisition: the camera is used to collect pictures of rice, including pictures of rice with rice sheath blight and pictures of healthy rice.
- (2)
- Image preprocessing: median filtering, histogram equalization and edge segmentation are performed on the images that have been processed into the same size to remove the complex background.
- (3)
- Feature extraction: based on the color and texture features of rice sheath blight images, the feature parameters of each image are extracted for the training unit.
- (4)
- Image recognition: after building the BP neural network, training and recognition test are carried out, and the number of hidden layers is optimized to improve the recognition efficiency.
3. Results and Discussion
3.1. Data Collection
3.2. Preprocessing and Feature Extraction

| Label | R | G | B |
|---|---|---|---|
| Mean value of first moment | 97.8240 | 88.8168 | 45.9972 |
| Variance of second moment | 41.1104 | 34.4180 | 26.0005 |
3.3. Sample Training and Testing of the BP Neural Network
| Label | Number of Samples | Recognition Quantity | Recognition Rates (%) |
|---|---|---|---|
| 1 | 120 | 106 | 88.3 |
| 2 | 120 | 103 | 85.8 |
| 3 | 120 | 102 | 85.0 |
| 4 | 120 | 101 | 84.2 |
| 5 | 120 | 103 | 85.8 |
| Mean value | \ | \ | 85.8 |
| Label | Number of Samples | Recognition Quantity | Recognition Rates (%) |
|---|---|---|---|
| 1 | 120 | 104 | 86.7 |
| 2 | 120 | 98 | 81.7 |
| 3 | 120 | 102 | 85.0 |
| 4 | 120 | 100 | 83.3 |
| 5 | 120 | 104 | 86.7 |
| Mean value | \ | \ | 84.7 |
4. Discussion
| Label | Actual Class | Predicting Class | |
|---|---|---|---|
| Sheath Blight Picture | Healthy Rice Picture | ||
| 1 | Sheath blight picture | 87 | 9 |
| Healthy rice picture | 5 | 19 | |
| 2 | Sheath blight picture | 83 | 13 |
| Healthy rice picture | 4 | 20 | |
| 3 | Sheath blight picture | 85 | 11 |
| Healthy rice picture | 7 | 17 | |
| 4 | Sheath blight picture | 84 | 12 |
| Healthy rice picture | 7 | 17 | |
| 5 | Sheath blight picture | 85 | 11 |
| Healthy rice picture | 6 | 18 | |
5. Conclusions
- (1)
- In the discovery and control of rice sheath blight, the BP neural network can play an important role in detection of rice sheath blight using images of crops. Its recognition speed is fast and the recognition rate is high. After preprocessing, feature extraction and network optimization, the training recognition rate can reach up to 85.8%.
- (2)
- By preprocessing the sample image, the disease recognition rate can be effectively and significantly enhanced. In the process of image preprocessing, the image recognition rate after median filtering is better than that after mean filtering.
- (3)
- Analyzing the color and texture features of rice sheath blight can significantly improve the recognition rate. The color and texture of diseased spots are quite different from those of healthy rice.
- (4)
- This method realizes the rapid and accurate recognition of rice sheath blight, which is beneficial for dramatically reducing the labor intensity of agricultural employees and thereby improving work efficiency. In the future, it will be necessary to increase the number of pictures of rice sheath blight that are collected, covering the whole process of disease evolution, and increase the number of training samples to improve the recognition rate. In addition, other common disease data can also be added.
Author Contributions
Funding
Conflicts of Interest
References
- Zhou, Y.; Bao, J.; Zhang, D.; Li, Y.; Li, H.; He, H. Effect of heterocystous nitrogen-fixing cyanobacteria against rice sheath blight and the underlying mechanism. Appl. Soil Ecol. 2020, 153, 103580. [Google Scholar] [CrossRef]
- Li, X.; Ma, W.; Chang, W.; Liang, C.; Zhao, H.; Guo, J.; Song, C.; Pan, G. Linkage disequilibrium analysis of rice sheath blight resistance markers of rice grown in the cold region of Northeast China. Genetika 2018, 50, 943–958. [Google Scholar] [CrossRef]
- Yu, Y.; Jiang, C.; Wang, C.; Chen, L.; Li, H.; Xu, Q.; Guo, J. An improved strategy for stable biocontrol agents selecting to control rice sheath blight caused by Rhizoctonia solani. Microbiol. Res. 2017, 203, 1–9. [Google Scholar] [CrossRef] [PubMed]
- Raj, T.S.; Graff, K.H.; Suji, H. Bio efficacy of fungicides against rice sheath blight caused by Rhizoctonia solani under in vitro condition. Int. J. Plant Prot. 2016, 9, 615–618. [Google Scholar] [CrossRef]
- Xue, X.; Cao, Z.; Zhang, X.; Wang, Y.; Zhang, Y.; Chen, Z.; Zuo, S. Overexpression of OsOSM1 enhances resistance to rice sheath blight. Plant Dis. 2016, 100, 1634–1642. [Google Scholar] [CrossRef] [Green Version]
- Wang, R.; Lu, L.; Pan, X.; Hu, Z.; Ling, F.; Yan, Y.; Lin, Y. Functional analysis of OsPGIP1 in rice sheath blight resistance. Plant Mol. Biol. 2015, 87, 181–191. [Google Scholar] [CrossRef]
- Willocquet, L.; Lore, J.S.; Srinivasachary, S.; Savary, S. Quantification of the components of resistance to rice sheath blight using a detached tiller test under controlled conditions. Plant Dis. 2011, 95, 1507–1515. [Google Scholar] [CrossRef] [Green Version]
- Zeng, Y.; Ji, Z.; Li, X.; Yang, C. Advances in mapping loci conferring resistance to rice sheath blight and mining Rhizoctonia solani resistant resources. Rice Sci. 2011, 18, 56–66. [Google Scholar] [CrossRef]
- Rozaqi, A.J.; Sunyoto, A. Identification of Disease in Potato Leaves Using Convolutional Neural Network (CNN) Algorithm. In Proceedings of the 2020 3rd International Conference on Information and Communications Technology (ICOIACT), Yogyakarta, Indonesia, 24–25 November 2020; pp. 72–76. [Google Scholar]
- Li, X.; Rai, L. Apple Leaf Disease Identification and Classification using ResNet Models. In Proceedings of the 2020 IEEE 3rd International Conference on Electronic Information and Communication Technology (ICEICT), Shenzhen, China, 13–15 November 2020; pp. 738–742. [Google Scholar]
- Almadhor, A.; Rauf, H.T.; Lali, M.I.U.; Damaševičius, R.; Alouffi, B.; Alharbi, A. AI-Driven Framework for Recognition of Guava Plant Diseases through Machine Learning from DSLR Camera Sensor Based High Resolution Imagery. Sensors 2021, 21, 3830. [Google Scholar] [CrossRef]
- Oyewola, D.O.; Dada, E.G.; Misra, S.; Damaševičius, R. Detecting cassava mosaic disease using a deep residual convolutional neural network with distinct block processing. PeerJ Comput. Sci. 2021, 7, e352. [Google Scholar] [CrossRef]
- Abayomi-Alli, O.O.; Damaševičius, R.; Misra, S.; Maskeliūnas, R. Cassava disease recognition from low-quality images using enhanced data augmentation model and deep learning. Expert Syst. 2021, 38, e12746. [Google Scholar] [CrossRef]
- Kundu, N.; Rani, G.; Dhaka, V.S.; Gupta, K.; Nayak, S.C.; Verma, S.; Woźniak, M. Iot and interpretable machine learning based framework for disease prediction in pearl millet. Sensors 2021, 21, 5386. [Google Scholar] [CrossRef]
- Hu, R.; Zhang, S.; Wang, P.; Xu, G.; Wang, D.; Qian, Y. The identification of corn leaf diseases based on transfer learning and data augmentation. In Proceedings of the 2020 3rd International Conference on Computer Science and Software Engineering (CSSE 2020), Beijing, China, 22–24 May 2020; pp. 58–65. [Google Scholar]
- Phadikar, S.; Sil, J. Rice disease identification using pattern recognition techniques. In Proceedings of the 2008 11th International Conference on Computer and Information Technology, Khulna, Bangladesh, 24–27 December 2008; pp. 420–423. [Google Scholar]
- Anthonys, G.; Wickramarachchi, N. An image recognition system for crop disease identification of paddy fields in Sri Lanka. In Proceedings of the 2009 International Conference on Industrial and Information Systems (ICIIS), Peradeniya, Sri Lanka, 28–31 December 2009; pp. 403–407. [Google Scholar]
- Majid, K.; Herdiyeni, Y.; Rauf, A. I-PEDIA: Mobile application for paddy disease identification using fuzzy entropy and probabilistic neural network. In Proceedings of the 2013 International Conference on Advanced Computer Science and Information Systems (ICACSIS), Sanur Bali, Indonesia, 28–29 September 2013; pp. 403–406. [Google Scholar]
- Suman, T.; Dhruvakumar, T. Classification of paddy leaf diseases using shape and color features. IJEEE 2015, 7, 239–250. [Google Scholar]
- Wang, K.; Zhang, J.; Ni, H.; Ren, F. Thermal Defect Detection for Substation Equipment Based on Infrared Image Using Convolutional Neural Network. Electronics 2021, 10, 1986. [Google Scholar] [CrossRef]
- Zhang, J.; Kang, X.; Ni, H.; Ren, F. Surface defect detection of steel strips based on classification priority YOLOv3-dense network. Ironmak. Steelmak. 2021, 48, 547–558. [Google Scholar] [CrossRef]
- Zhu, Y.; Huang, C. An improved median filtering algorithm for image noise reduction. Phys. Procedia 2012, 25, 609–616. [Google Scholar] [CrossRef] [Green Version]
- Arias-Castro, E.; Donoho, D.L. Does median filtering truly preserve edges better than linear filtering? Ann. Stat. 2009, 37, 1172–1206. [Google Scholar] [CrossRef] [Green Version]
- Ngo, D.; Lee, S.; Nguyen, Q.H.; Ngo, T.M.; Lee, G.D.; Kang, B. Single image haze removal from image enhancement perspective for real-time vision-based systems. Sensors 2020, 20, 5170. [Google Scholar] [CrossRef]
- Subramani, B.; Veluchamy, M. Fuzzy gray level difference histogram equalization for medical image enhancement. J. Med. Syst. 2020, 44, 103. [Google Scholar] [CrossRef]
- Ewees, A.A.; Abd Elaziz, M.; Al-Qaness, M.A.; Khalil, H.A.; Kim, S. Improved artificial bee colony using sine-cosine algorithm for multi-level thresholding image segmentation. IEEE Access 2020, 8, 26304–26315. [Google Scholar] [CrossRef]
- Kirillov, A.; Wu, Y.; He, K.; Girshick, R. Pointrend: Image segmentation as rendering. In Proceedings of the IEEE/CVF Conference on Computer Vision and Pattern Recognition (CVPR), Seattle, WA, USA, 14–19 June 2020; pp. 9799–9808. [Google Scholar]
- Ghosh, S.; Das, N.; Das, I.; Maulik, U. Understanding deep learning techniques for image segmentation. ACM Comput. Surv. (CSUR) 2019, 52, 1–35. [Google Scholar] [CrossRef] [Green Version]
- Ren, Z.; Sun, Q.; Wu, B.; Zhang, X.; Yan, W. Learning latent low-rank and sparse embedding for robust image feature extraction. IEEE Trans. Image Process. 2019, 29, 2094–2107. [Google Scholar] [CrossRef]
- Yang, A.; Yang, X.; Wu, W.; Liu, H.; Zhuansun, Y. Research on feature extraction of tumor image based on convolutional neural network. IEEE Access 2019, 7, 24204–24213. [Google Scholar] [CrossRef]
- Choras, R.S. Image feature extraction techniques and their applications for CBIR and biometrics systems. Int. J. Biol. Biomed. Eng. 2007, 1, 6–16. [Google Scholar]
- Chen, W.T.; Liu, W.C.; Chen, M.S. Adaptive color feature extraction based on image color distributions. IEEE Trans. Image Process. 2010, 19, 2005–2016. [Google Scholar] [CrossRef]
- Li, H.; Chutatape, O. Automated feature extraction in color retinal images by a model based approach. IEEE Trans. Biomed. Eng. 2004, 51, 246–254. [Google Scholar] [CrossRef] [PubMed]
- Arun, C.H.; Emmanuel, W.S.; Durairaj, D.C. Texture feature extraction for identification of medicinal plants and comparison of different classifiers. Int. J. Comput. Appl. 2013, 62, 1–9. [Google Scholar]
- Prakasa, E. Texture feature extraction by using local binary pattern. INKOM J. 2016, 9, 45–48. [Google Scholar] [CrossRef] [Green Version]
- Yildiz, K. Identification of wool and mohair fibres with texture feature extraction and deep learning. IET Image Process. 2020, 14, 348–353. [Google Scholar] [CrossRef]
- Zhao, Z.; Xin, H.; Ren, Y.; Guo, X. Application and comparison of BP neural network algorithm in MATLAB. In Proceedings of the 2010 International Conference on Measuring Technology and Mechatronics Automation, Changsha, China, 13–14 March 2010; pp. 590–593. [Google Scholar]
- Manahi, A.; Zarei, B.; Saghafi, F. A conceptual model for E-entrepreneurship barriers in education. Int. J. Adv. Comput. Technol. 2012, 4, 65–80. [Google Scholar]
- Zhang, Y.; Wu, L. Stock market prediction of S&P 500 via combination of improved BCO approach and BP neural network. Expert Syst. Appl. 2009, 36, 8849–8854. [Google Scholar]
- Yang, A.; Zhuansun, Y.; Liu, C.; Li, J.; Zhang, C. Design of intrusion detection system for internet of things based on improved BP neural network. IEEE Access 2019, 7, 106043–106052. [Google Scholar] [CrossRef]
- Xiao, M.; Ma, Y.; Feng, Z.; Deng, Z.; Hou, S.; Shu, L.; Lu, Z. Rice blast recognition based on principal component analysis and neural network. Comput. Electron. Agric. 2018, 154, 482–490. [Google Scholar] [CrossRef]
| Label | Mean | Con | Ent |
|---|---|---|---|
| Healthy plants | 0.0492 | 968.5037 | 3.6157 |
| Diseased spots | 0.0573 | 783.3914 | 3.6813 |
| Label | Number of Samples | Recognition Quantity | Recognition Rates (%) |
|---|---|---|---|
| 1 | 120 | 101 | 84.2 |
| 2 | 120 | 99 | 82.5 |
| 3 | 120 | 101 | 84.2 |
| 4 | 120 | 98 | 81.7 |
| 5 | 120 | 102 | 85.0 |
| Mean value | \ | \ | 83.5 |
Publisher’s Note: MDPI stays neutral with regard to jurisdictional claims in published maps and institutional affiliations. |
© 2021 by the authors. Licensee MDPI, Basel, Switzerland. This article is an open access article distributed under the terms and conditions of the Creative Commons Attribution (CC BY) license (https://creativecommons.org/licenses/by/4.0/).
Share and Cite
Lu, Y.; Li, Z.; Zhao, X.; Lv, S.; Wang, X.; Wang, K.; Ni, H. Recognition of Rice Sheath Blight Based on a Backpropagation Neural Network. Electronics 2021, 10, 2907. https://doi.org/10.3390/electronics10232907
Lu Y, Li Z, Zhao X, Lv S, Wang X, Wang K, Ni H. Recognition of Rice Sheath Blight Based on a Backpropagation Neural Network. Electronics. 2021; 10(23):2907. https://doi.org/10.3390/electronics10232907
Chicago/Turabian StyleLu, Yi, Zhiyang Li, Xiangqiang Zhao, Shuaishuai Lv, Xingxing Wang, Kaixuan Wang, and Hongjun Ni. 2021. "Recognition of Rice Sheath Blight Based on a Backpropagation Neural Network" Electronics 10, no. 23: 2907. https://doi.org/10.3390/electronics10232907
APA StyleLu, Y., Li, Z., Zhao, X., Lv, S., Wang, X., Wang, K., & Ni, H. (2021). Recognition of Rice Sheath Blight Based on a Backpropagation Neural Network. Electronics, 10(23), 2907. https://doi.org/10.3390/electronics10232907