Article

Development of Decision Support Software for Deep Learning-Based Automated Retinal Disease Screening Using Relatively Limited Fundus Photograph Data

1
Samsung SDS Artificial Intelligence Research Center, Seoul 05510, Korea
2
Department of Ophthalmology, Kangbuk Samsung Hospital, Sungkyunkwan University School of Medicine, Seoul 03181, Korea
3
Department of Ophthalmology, Yeungnam University Hospital, Yeungnam University College of Medicine, Daegu 42415, Korea
*
Author to whom correspondence should be addressed.
Electronics 2021, 10(2), 163; https://doi.org/10.3390/electronics10020163
Submission received: 24 November 2020 / Revised: 28 December 2020 / Accepted: 6 January 2021 / Published: 13 January 2021
(This article belongs to the Special Issue Deep Learning for Medical Images: Challenges and Solutions)

Abstract

:
Purpose—This study was conducted to develop an automated detection algorithm for screening fundus abnormalities, including age-related macular degeneration (AMD), diabetic retinopathy (DR), epiretinal membrane (ERM), retinal vascular occlusion (RVO), and suspected glaucoma among health screening program participants. Methods—The development dataset consisted of 43,221 retinal fundus photographs (from 25,564 participants, mean age 53.38 ± 10.97 years, female 39.0%) from a health screening program and patients of the Kangbuk Samsung Hospital Ophthalmology Department from 2006 to 2017. We evaluated our screening algorithm on independent validation datasets. Five separate one-versus-rest (OVR) classification algorithms based on deep convolutional neural networks (CNNs) were trained to detect AMD, ERM, DR, RVO, and suspected glaucoma. The ground truth for both development and validation datasets was graded at least two times by three ophthalmologists. The area under the receiver operating characteristic curve (AUC), sensitivity, and specificity were calculated for each disease, as well as their macro-averages. Results—For the internal validation dataset, the average sensitivity was 0.9098 (95% confidence interval (CI), 0.8660–0.9536), the average specificity was 0.9079 (95% CI, 0.8576–0.9582), and the overall accuracy was 0.9092 (95% CI, 0.8769–0.9415). For the external validation dataset consisting of 1698 images, the average of the AUCs was 0.9025 (95% CI, 0.8671–0.9379). Conclusions—Our algorithm had high sensitivity and specificity for detecting major fundus abnormalities. Our study will facilitate expansion of the applications of deep learning-based computer-aided diagnostic decision support tools in actual clinical settings. Further research is needed to improved generalization for this algorithm.

1. Introduction

Although deep learning has yielded substantial results in other areas of research, the development of a deep learning-based diabetic retinopathy detection algorithm by Google may have been the first time that most ophthalmologists acknowledged the potential role of deep learning-based applications in the clinical setting [1,2,3]. Since then, a variety of studies have been conducted to develop deep learning-based algorithms to diagnose diseases, analyze images, and assess treatment response [4,5,6,7,8]. Gargeya et al. [2] diabetic retinopathy (DR) diagnosis model achieved a 0.97 area under the receiver operating characteristic curve (AUC) with a 94% and 98% sensitivity and specificity, respectively, and testing on MESSIDOR 2 and E-Ophtha databases achieved a 0.94 and 0.95 AUC score, respectively. For age-related macular degeneration (AMD), unlike DR, many studies focused on severity classification or treatment responses, rather than diagnosis. Burlina et al. [7] AMD grading model showed performance comparable with that of humans and achieved promising results for providing AMD detailed severity grading, which normally requires highly trained graders [7]. However, so far, the clinical applications of these deep learning-based algorithms have remained limited for various reasons, including the limited availability of well-annotated clinical data for algorithm development and the assessment of performance accuracy, the presence of legal restrictions and regulations, and reimbursement-related challenges. One of the most fundamental problems that ophthalmologists have encountered is that most algorithms are developed for the detection of single disease entities. In most clinical settings, we do not need a screening tool to determine only whether a patient has diabetic retinopathy; instead, we need a diagnostic tool that can reliably determine whether patients have any abnormal ocular findings and then provide specific diagnoses, including multiple diagnoses for a single patient. This function is most important in situations where fundus screening tools are used for large patient populations. In this context, there is a growing need to develop a grading tool to assist in the screening of fundus photographs that can yield reliable results, thereby minimizing ophthalmologists’ work burden.
Therefore, we developed decision support software for deep learning-based automated retinal disease detection for use in fundus photography screening. Here, we report its performance and discuss its potential role as a screening tool for the general population.

2. Methods

This study adhered to the tenets of the Declaration of Helsinki, and the study protocol was reviewed and approved by the Institutional Review Board of Kangbuk Samsung Hospital (No. KBSMC 2018-01-040). The requirement for written informed consent was waived because the study used retrospective and anonymized retinal images.
In the Republic of Korea, a regular systemic health screening examination is mandatory (including optional examinations, such as fundus photography) for adults who are ≥40 years of age. In 2015, 76.1% of South Koreans ≥40 years of age received an annual health examination (National Health Screening Statistical Yearbook, National Health Insurance Corporation, 2016) [9]. Our institution conducted 943,844 fundus photography examinations (both eyes were counted as a single examination) for 316,516 participants who were ≥40 years of age during 2006–2017.
Fundus photographs were taken with various manufacturers’ nonmydriatic fundus cameras, including TRC-NW300, TRC-50IX, TRC-NW200, and TRC-NW8 (Topcon, Tokyo, Japan), CR6-45NMand CR-415NM (Canon, Tokyo, Japan), and VISUCAM 224 (Carl Zeiss Meditec, Jena, Germany). Digital images of the fundus photographs were analyzed with a picture archiving and communication system (INFINITT, Seoul, Korea).
In addition to the fundus photographs of health screening program participants, fundus photographs of patients who visited the Department of Ophthalmology of our hospital were also used for training in order to obtain data on diseases with low prevalence among the general population (especially diabetic retinopathy (DR) and retinal vein occlusion (RVO)). A schematic diagram of the inference workflow for our algorithm is shown in Figure 1.
In a general health screening environment, detecting abnormality has much higher priority than detecting normality, and that is the reason why our study focuses on screening fundus photos that contain abnormalities from a general population. We accordingly designed the inference structure of our algorithm. Although normal (healthy) images are used during training as negative data with respect to the target diagnosis of each classifier, and although we also trained a classifier that predicts whether the photo is normal or not, they were not included in the main classification pipeline because predicting truly healthy is less important than predicting truly abnormal or a specific diagnosis assigned to each classifier. The proposed algorithm consists of five independent diagnosis detectors or binary classifiers that process and analyze one single input image in parallel as shown in Figure 1. There are two main reasons why we adopted five detectors rather than a single multi-class detector:
(1)
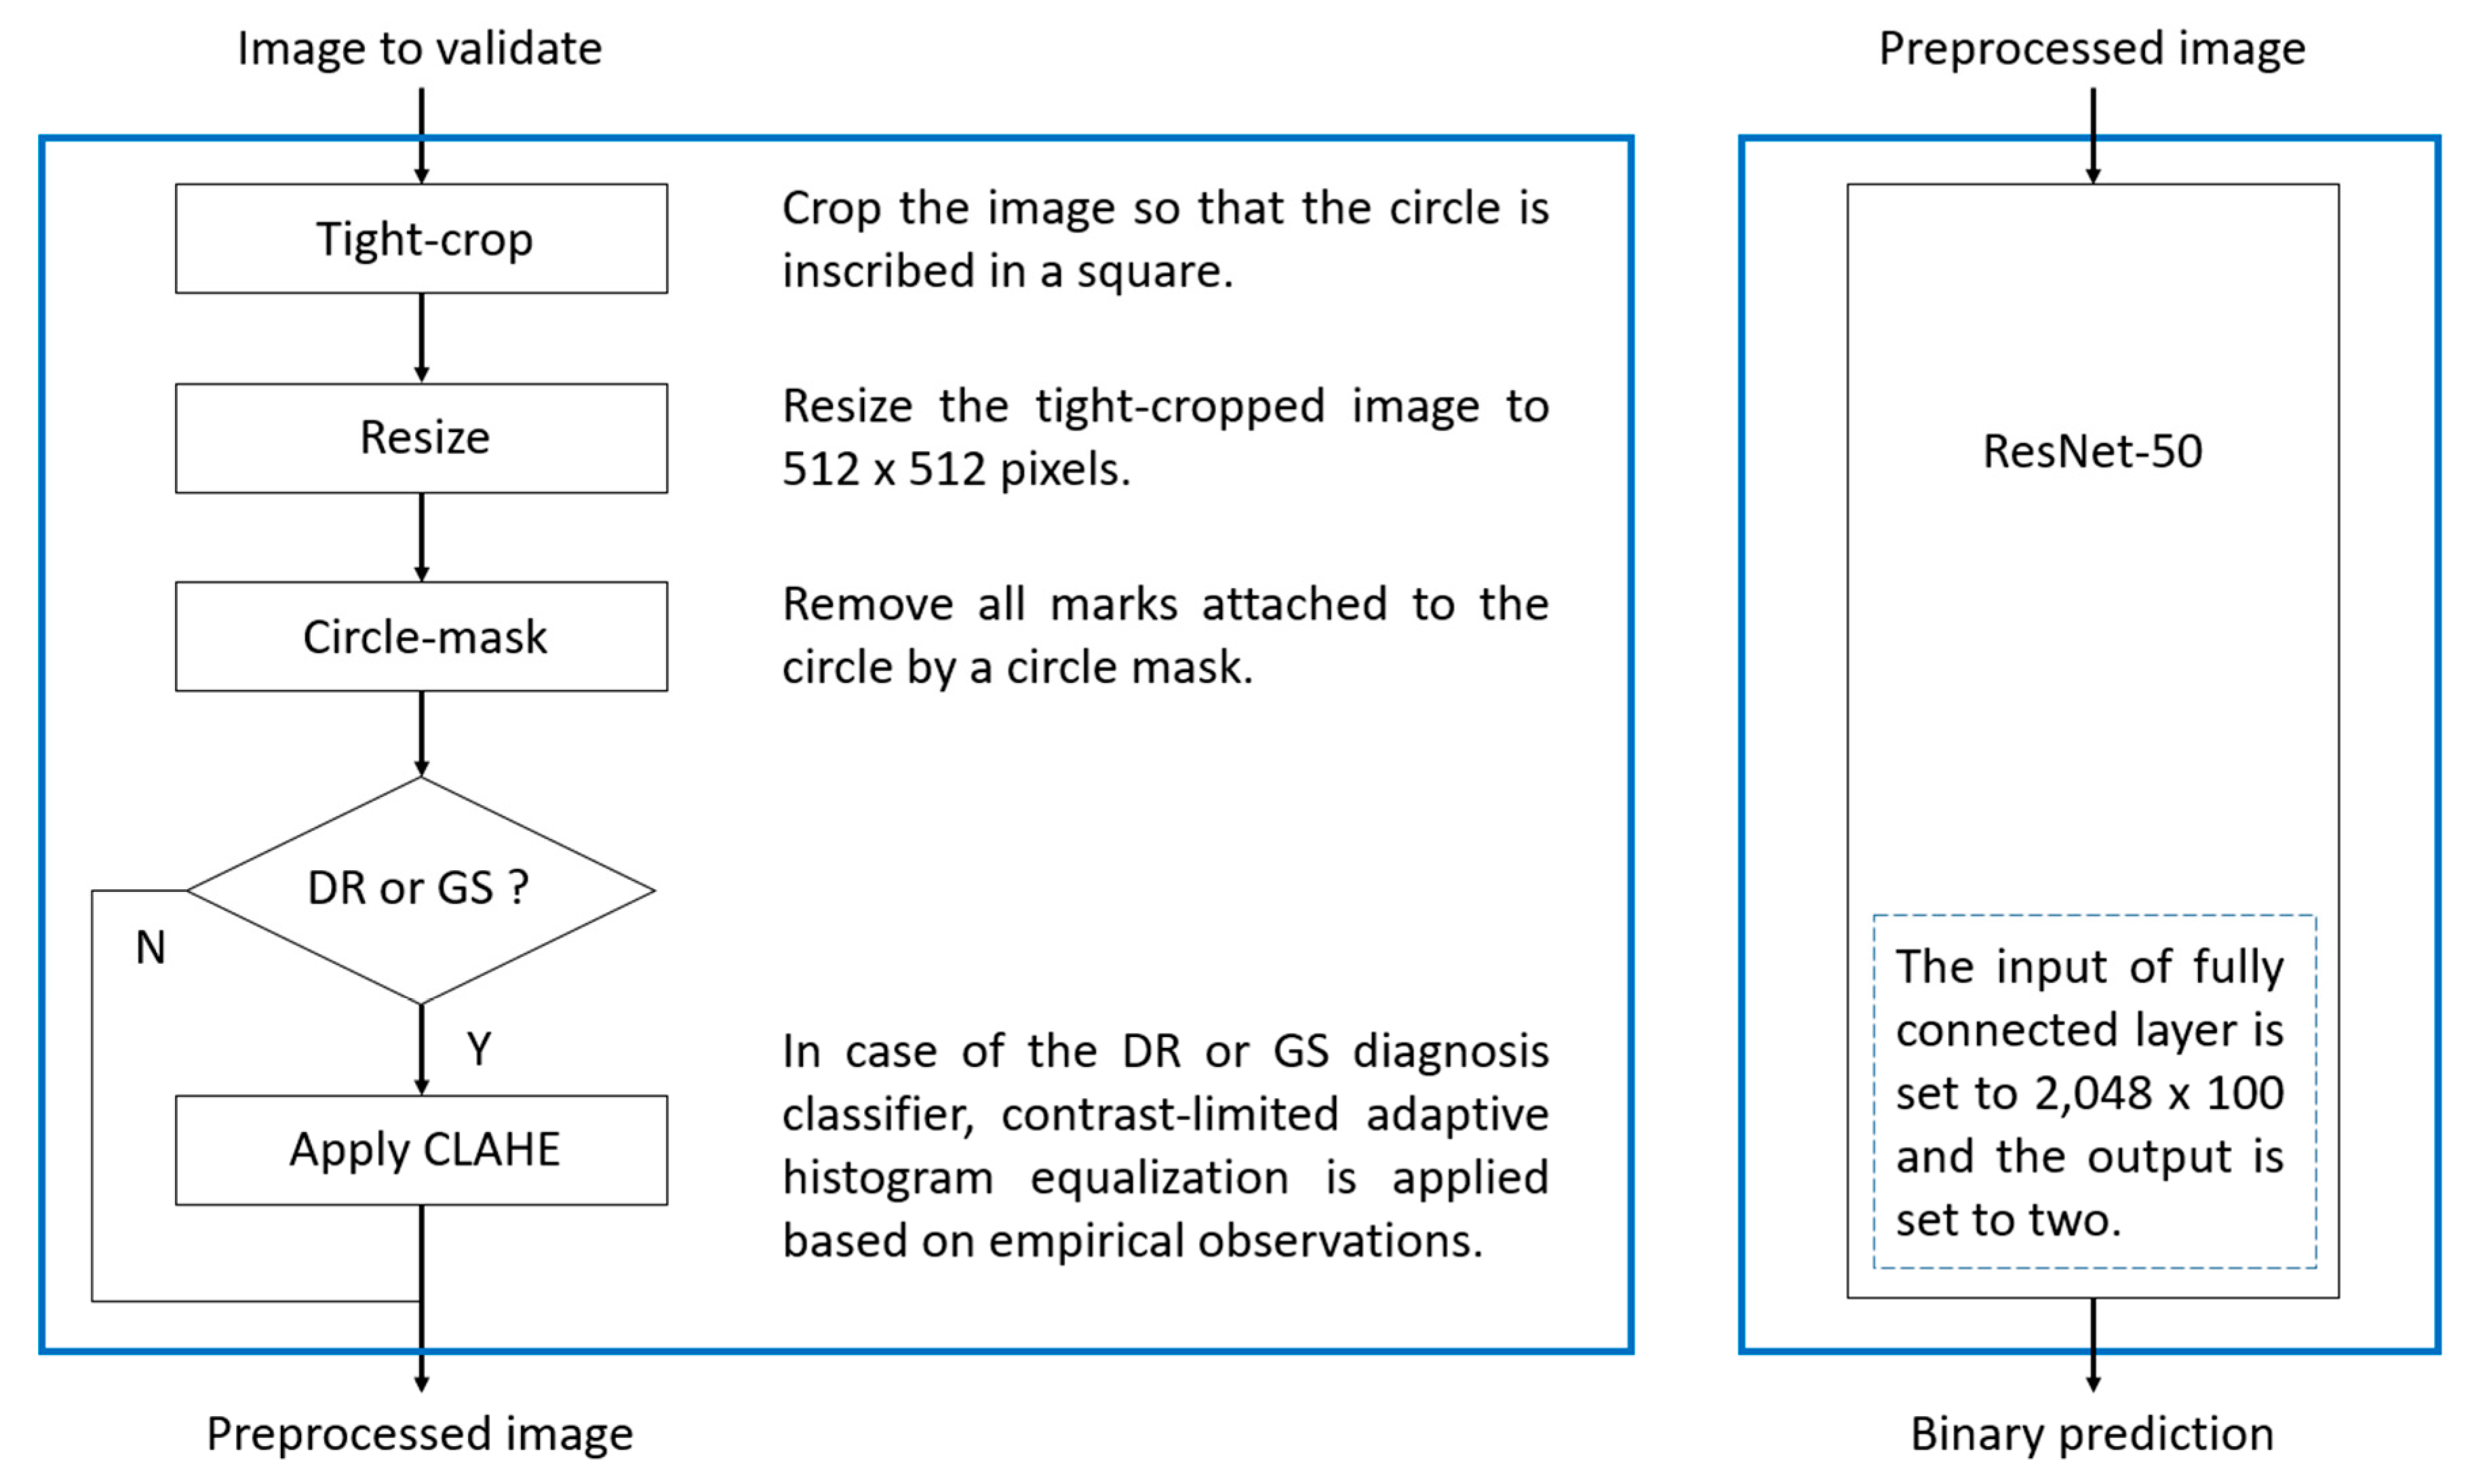
Considering the relatively limited size of the training dataset, we intended to train each diagnosis detector in a way fully specific to each diagnosis without limitation by constructing individual pipelines, which includes a preprocessing unit, the low-level to high-level feature extractor, and the classification head. For instance, it is empirically observed that diabetic retinopathy and glaucoma suspect are better detected after applying preprocessing such as contrast-limited adaptive histogram equalization (CLAHE) [10]. The parallelism can be the best architecture that reflects this diversified situation with ease and flexibility.
(2)
In a real clinical environment, the fundus photo that our model reviews can have multiple diagnoses and not necessarily a single diagnosis. In our second validation dataset, for example, the portion of multiples is up to 8.66%. In this condition that the number of diagnoses varies, it is very hard to make an appropriate prediction using a single multi-class detector because the commonly used softmax score is best fit for top-1 prediction and can cause ambiguity for top-k prediction. We might manage to design a multi-class cutoff threshold system without knowing the number of diagnosis in the photo, but the resulting threshold system must be very complex or confusing. Therefore, this can lead to even less accuracy, as well as ambiguity; thus, it may not be a good architecture. When we conducted training of a single multi-class detector to test feasibility, the average sensitivity was only 79.0% for top-1 prediction and 86.3% for top-2 predictions even though one false positive was allowed. This result supports our idea that multiple one-versus-rest classifiers work properly and can achieve better accuracy for prediction.
Therefore, we trained each modularized diagnosis detector on each one-versus-rest (OVR) relabeled training dataset. Each diagnosis detector focuses on finding abnormalities related to each diagnosis, and we only need to combine the five results from each detector using AND logic. This architecture can remove the complexity which may cause performance degradation and can also provide an easy-to-explain inference procedure from a human’s perspective.

2.1. Disease Definition

Fundus photographs with clinically insignificant fundus findings (e.g., small drusen outside the major vascular arcade) were graded as normal fundus images for the purpose of optimal screening. Regardless of the extent of the photograph that was obscured, if any identifiable abnormal findings were present in fundus photographs, they were considered gradable. Ungradable photographs could contain a fundus with an obscured posterior pole of the retina, without any abnormal findings in the remaining visible area. These ungradable photographs were excluded from the training dataset and the validation dataset for the classification task.
The selection of cases of four major retinal diseases and suspected glaucoma were based on a previous study reporting the vitreoretinal diseases that were prevalent among health screening participants [11].

2.1.1. Age-Related Macular Degeneration

AMD was defined in accordance with the international classification developed by the International Age-Related Maculopathy Epidemiological Study Group [12]. The largest drusen present was used to determine the grade and predominant drusen type. Pigmentary abnormalities included either increased pigmentation or hypopigmentation of the retinal pigment epithelium (RPE), without any visibility of choroidal vessels. Geographic atrophy was defined as any sharply delineated area, approximately round or oval in shape that displayed hypopigmentation, depigmentation, or apparent absence of the RPE; additionally, such areas were required to exhibit greater visibility of choroidal vessels than surrounding areas. Exudative AMD was defined as the presence of any of the following: (1) RPE detachment or serous detachment of the sensory retina; (2) subretinal or sub-RPE neovascular membranes; (3) subretinal hemorrhage; (4) epiretinal, subretinal, intraretinal, or sub-pigment epithelial scarring, glial tissue, or fibrin-like deposits. Early AMD was defined as the presence of a soft drusen (≥63 µm) or any drusen (except a hard, indistinct drusen) combined with RPE changes near the macula. Late AMD was defined as the presence of signs of exudative AMD or geographic atrophy.

2.1.2. Diabetic Retinopathy

DR was defined in accordance with the international classification of DR severity and diabetic macular edema [13]. Regardless of severity, images with any signs of DR were categorized as having DR. Findings indicative of severe disease, including clinically significant macular edema, were annotated for future comparisons.

2.1.3. Epiretinal Membrane

Both cellophane macular reflex (characterized by an irregular, increased light reflex from the inner retinal surface, without prominent retinal folds) and preretinal macular fibrosis (characterized by retinal folds or traction with thickening and contraction of the membrane) were categorized as ERM. Focal ERM located outside the major vascular arcade was not included in the diagnosis. Cases of secondary ERM were classified as multiple diagnoses.

2.1.4. Retinal Vein Occlusion

Regardless of the involved area or the type of occlusion, fundus photographs with any features of RVO were included. Old RVO with ghost vessels or visible collateral vessels was also included in the diagnosis.

2.1.5. Suspected Glaucoma

The diagnosis of suspected glaucoma was based solely on fundus findings. Participants were considered to have suspected glaucoma on the basis of optic disc findings of a vertical or horizontal cup/disc ratio (C/D) of 0.7 or an asymmetric C/D ratio of ≥−0.2. Other fundus findings considered in the diagnosis of suspected glaucoma included neuroretinal rim notching, loss, or thinning, disc hemorrhage, and a defect of the retinal nerve fiber layer. These criteria were based on the International Society of Geographical and Epidemiological Ophthalmology (ISGEO) guidelines, without consideration of any other diseases that can contribute to glaucomatous findings [14,15].

2.1.6. Multiple Diagnoses

In total, 789 fundus photographs had two or more diagnoses. The most common combination was AMD and ERM (n = 417, 52.9%), followed by DR and ERM (n = 99, 12.5%). As our algorithm combined one-versus-rest (OVR) classifiers, multiple diagnoses fit into the workflow naturally. Once each OVR classifier detects its relevant disease, the prediction can be represented in the form of not only the decision, but also a score between 0.0 and 1.0. For screening purposes, it is reasonable to use a high sensitivity threshold for each score so that fundus photographs with any abnormal diagnoses would be further evaluated by ophthalmologists regardless of the diagnosis.

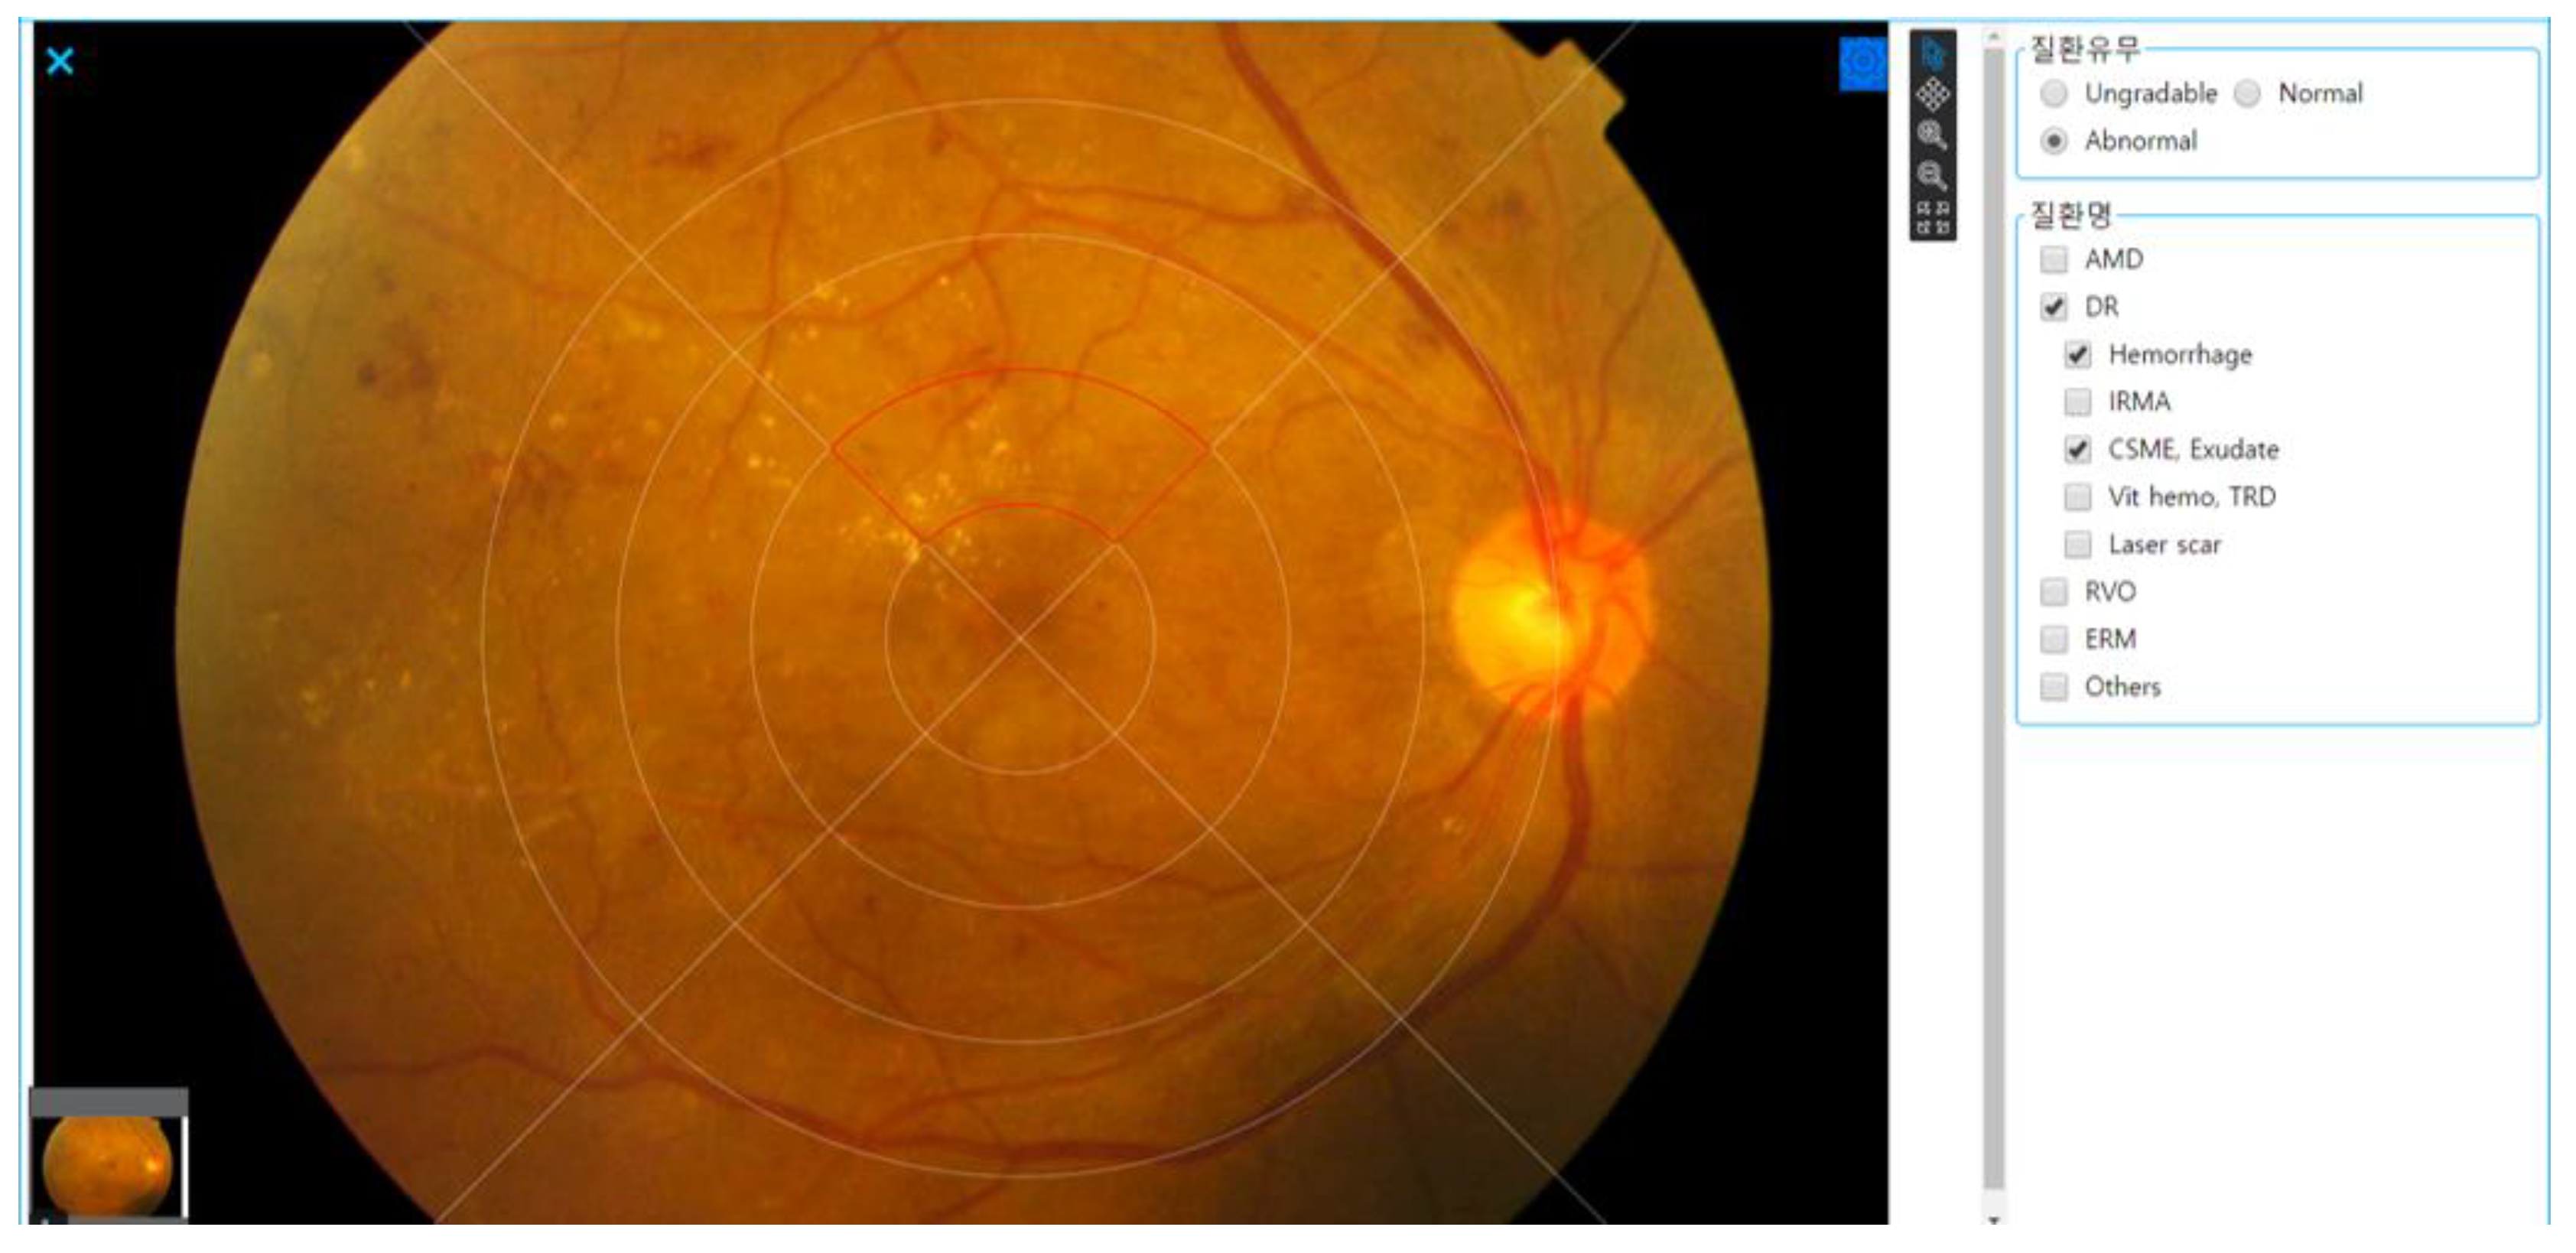
2.2. Grading and Annotation Process

To enhance the performances of detailed diagnosis, we developed an annotation tool which resembled an Early Treatment Diabetic Retinopathy Study grid divided to 20 sectors centering out from fovea to periphery with a maximum diameter of 8000 µm (Figure 2.). In addition to diagnosis, each sector was annotated for specific findings important for diagnosis or differential diagnosis (Figure 2—annotation example for DR).
The graders comprised two retinal specialists and three residents with third to fourth year training. All graders were fully aware of the disease definitions and annotation guidelines. Before the actual grading and annotation process, brief practice and simulation procedures were performed to ensure accurate grading and annotation. At least one retinal specialist was included in the first round of grading, which was performed by two ophthalmologists. Any disagreements regarding diagnosis or annotations were discussed between these two ophthalmologists. Finally, a third ophthalmologist (who was not involved in the first round of grading) made diagnoses or annotations for fundus photographs that could not be clearly determined by the prior two ophthalmologists. Intergrader agreement was assessed using the kappa statistic, which was 0.78–0.90, depending on the disease entity. Intergrader agreement was lowest for AMD and highest for RVO. A total of 43,221 fundus photographs were taken during the development phase, including 33,895 photographs for training and 9332 photographs for performance tuning. The demographic characteristics and disease distributions of the training dataset are listed in Table 1. For the training set, 33,895 fundus photographs were used, of which abnormal fundus photographs constituted 18,221 (53.7%), and, for the tuning set, 9332 fundus photographs, including 5405 (57.9%) abnormal fundus photographs, were used to validate and tune the performance during the training phase. A separate dataset of 11,707 photographs was used to construct multiple validation datasets via balanced and stratified bootstrapping (uniform sampling with allowed replacement) for all annotated retinal fundus photographs.

2.3. Algorithm Development

For development of the algorithm, supervised heterogeneous transfer learning was conducted using ResNet-50 [16] which is pretrained on the ImageNet dataset. In some prior works, the following CNNs were used as backbones.
  • Gulshan et al. [3] JAMA, 20163: ImageNet pretrained Inception-v3 [17] (input pixels: 299 × 299) for DR;
  • Burlina et al. [7] JAMA Ophthalmology, 201724: ImageNet pretrained AlexNet [18] and OverFeat [19] with SVM [20] (input pixels: 256 × 256) for AMD;
  • Ting et al. [4] JAMA, 2017: ImageNet pretrained VGGNet [21] (input pixels: 512 × 512) for DR, AMD, and suspected glaucoma.
On the contrary, we used ResNet-50 with 512 × 512 input pixels. It was difficult to conduct an exact comparison with prior studies because each test dataset is different. However, this customized ResNet resulted in better classification capability of our trained models because ResNet has an improved residual connection architecture that can boost performance, and we allowed larger input images that can be helpful to increase discriminative reception. We observed when training an initial binary classifier that a WideResNet [22]-like CNN showed better performance than Inception-v3 or VGGNet, not to mention AlexNet, and we also found that ResNet performed a bit better than WideResNet when using larger input images. The details of each diagnosis detector including preprocessing are presented in Figure 3.
Each diagnostic OVR classifier (AMD, ERM, DR, RVO, suspected glaucoma) was primarily trained using the pretrained ResNet-50 in order to speed up the convergence of learning representation with the help of good initialization via transfer learning with different tasks (classes to classify) and different domains. During fine-tuning, the rollback technique with lower layers of the network with pre-trained weights [23] was repeatedly applied in order to improve the network’s capability to detect the finer features of the retinal fundus. Of particular note, for the AMD classifier, additional excerpts of retinal fundus photographs that were apt to be misclassified as DR or RVO were used for training.
Unsupervised domain adaptation was applied to each OVR classifier to overcome performance drop, which may be caused by the domain shift. A trained DNN model often fails to work properly in other sites because of the distribution discrepancy between the training data and the data from the target domain, mainly caused by a lack of generalizability. This phenomenon is called domain shift, and domain adaptation addresses this problem by adapting a model trained on a domain (source) to another domain (target). According to the maximum classifier discrepancy principle, two well-trained classifiers that shared a deep feature generator unit for each diagnosis were used with a labeled development dataset and an unlabeled validation dataset [24]. Some performance drop was observed on the validation dataset when the initially trained model using the development dataset was tested from the area under the receiver operating characteristic curve (AUC) perspective. However, a significant improvement in the AUC for each diagnosis was achieved after further training for unsupervised domain adaptation. Two or more classifiers that were candidates for the best prediction model for each diagnosis were used as an ensemble for knowledge transfer via the teacher–student knowledge distillation technique [25]. Overall, 78.4% of the development set was used for training, including fine-tuning of the network, and 21.6% of the development set was used for tuning the performance of the network. Fundus images from the same person were always placed in the same dataset (training or tuning). While training the model and obtaining inferences using the trained model, the input photographs to the model were tightly cropped to obtain an empirically optimized region of interest of 512 by 512 pixels (square) by applying a circular mask that shared the center of the circle to obtain a clear cut of the circular boundary of the fundus image. Histogram equalization was also applied for the prediction of some diagnoses to maximize the discriminative capability of the relevant classifier.

2.4. Evaluation Metric and Statistical Analysis

The model performance for the initial diagnostic classifier was mainly evaluated using areas under the receiver operating characteristic curve (AUROCs), as the sensitivity, specificity, and accuracy vary depending on the cutoff threshold, while the AUROC is static and, thus, shows the predictive capacity of the classifier in a single measure. In more detail, the main validation can be regarded as a representative of a real-world population because we collected data in the health screening center without any considerable compromise. We only added some minority diagnosis images to keep statistical significance; however, as shown in Table 2, the dataset was still largely imbalanced, which is the feature of a real-world population. Because the imbalance between categories can induce a seriously distorted result for PPV (positive predictive value) = TP/(TP + FP) and NPV (negative predictive value) = TN/(TN + FN), they were not used as the evaluation metric. Instead, we used sensitivity = TP/(TP + FN) and specificity = TN/(TN + FP), as well as AUROC, which are not affected by the category imbalance.
To obtain the 95% confidence intervals (CIs) of each measure for the evaluation of statistical significance, sample bootstrapping was repeated 20 times on the basis of a nonparametric approach from the validation dataset. Model evaluation was conducted for each round of sample bootstrapping. When the ratio of a disease is highly imbalanced, the average of each performance measure per disease classifier (the macro-average) is the most appropriate measure to avoid ignoring the performance of the minority disease classifiers; therefore, the macro-average was calculated to quantify overall performance.

3. Results

We evaluated the performance of our algorithm on the independent validation dataset, which consisted of single-diagnosis images gathered in 2019 at the Kangbuk Samsung Hospital health examination center.

3.1. Overall Outcome: The Macro-Average Performance of the Five OVR Classifiers

The macro-average of each classifier’s AUC was 0.952 in the initial training and then improved to 0.964 (95% confidence interval (CI), 0.947–0.982) via domain-adaptive training. The macro-average of sensitivity was 0.910 (95% CI, 0.866–0.954), that of specificity was 0.908 (95% CI, 0.858–0.958), and that of accuracy was 0.909 (95% CI, 0.877–0.942) after adjusting the cutoff threshold of each classifier. In more detail, given that the sensitivity is more important than specificity, we adjusted the cutoff threshold where the ratio of the amount of change in sensitivity and in specificity while moving the ROC curve within specificity ranged between 0.80 and 0.90. We conducted this procedure automatically using Python scripts. One exception was the suspected glaucoma (GS) detector. As the AUROC for the GS detector was very high (0.9967), its sensitivity was greater than 0.99 even when the reference specificity was set to 0.95. Therefore, we set the upper bound of the specificity range to 0.96 only for the GS detector.

3.2. Individual Outcome: The Performance of the OVR Classifier for Each Specific Disease

The per-diagnosis AUC from the OVR perspective was highest for the detection of ERM (0.982; 95% CI, 0.971–0.992) and the lowest for the detection of AMD (0.943; 95% CI, 0.932–0.954).
The per-diagnosis ROC curves and AUCs are presented in Figure 4 and in Table 3, respectively. Each was measured using the relevant OVR classifier on the balanced samples with 20 rounds of bootstrapping after domain-adaptive training.
The per-diagnosis sensitivities are presented in Table 4. Each was measured using the relevant OVR classifier on the balanced samples with 20 rounds of bootstrapping after cutoff threshold tuning with the tuning dataset. Sensitivity was defined as TP/(TP + FN), where TP indicates true positive and FN denotes false negative.
The per-diagnosis specificities (sensitivities for the remaining diagnoses) are presented in Table 5. Each was measured using the relevant OVR classifier on the balanced samples with 20 rounds of bootstrapping after cutoff threshold tuning with tuning datasets. Specificity was defined as TN/(TN + FP), where TN denotes true negative and FP refers to false positive.
When compared with prior distinguished studies, the DR, AMD, and GS classifier of our algorithm demonstrated comparable or superior performance, as shown in Table 6. Note that this was measured using each testing dataset, which differed; to our knowledge, our ERM and RVO classifiers are the first deep learning-based screening models in the literature.

3.3. Additional Analysis: Algorithm Performance for Multiple Diagnosis Photographs or Diseases that Were Not Included in the Training Dataset

For multiple diagnoses, the proportion of images for which the algorithm predicted at least one of the ophthalmologist’s original diagnoses was 96.3%. The proportion of the algorithm’s correct prediction numbers for each disease out of all diagnosed diseases by the ophthalmologist was 78.8%. The proportion of the fundus images for which the algorithm’s predictions covered all the diagnoses by the ophthalmologist without a false negative was 61.6%.
The likelihood that the algorithm predicted at least one of the five trained diagnoses on images with other diagnoses (e.g., macular hole, retinal detachments, retinitis pigmentosa etc.) was 95.3%. The proportion of ungradable images for which the algorithm predicted at least one of the five trained diagnoses was 86.9%.

3.4. External Evaluation: Fundus Photographs from Youngnam University Hospital

We evaluated the performance of our algorithm on an external independent validation dataset from Youngnam University Hospital, which consisted of not only single-diagnosis images, but also multiple-diagnosis images (8.66%). Other than the inclusion of many multiple-diagnosis photographs, the key characteristic of this dataset is that the ratio of photographs with abnormalities was more than 88%, which was the exact opposite of the first validation dataset, in which more than 88% of the photographs were normal. The demographic characteristics and structure of the second validation dataset are summarized in Table 7.
In the second validation dataset, the per-diagnosis AUC from the OVR perspective was highest for the detection of AMD (0.950; 95% CI, 0.937–0.963) and the lowest for the detection of ERM (0.844; 95% CI, 0.796–0.892). The per-diagnosis AUCs are presented in Table 8. Each was measured using the relevant OVR classifier on the balanced samples with 20 rounds of bootstrapping after domain-adaptive training.
For the multiple-diagnosis images, the correct prediction of each diagnosis was separately counted, allowing duplication, when the five disease classifiers were tested on a single image. A promising result is that the detection rate for abnormalities was 1481/1501 = 98.67%, where “others” included other rare diseases or ungradable photos.

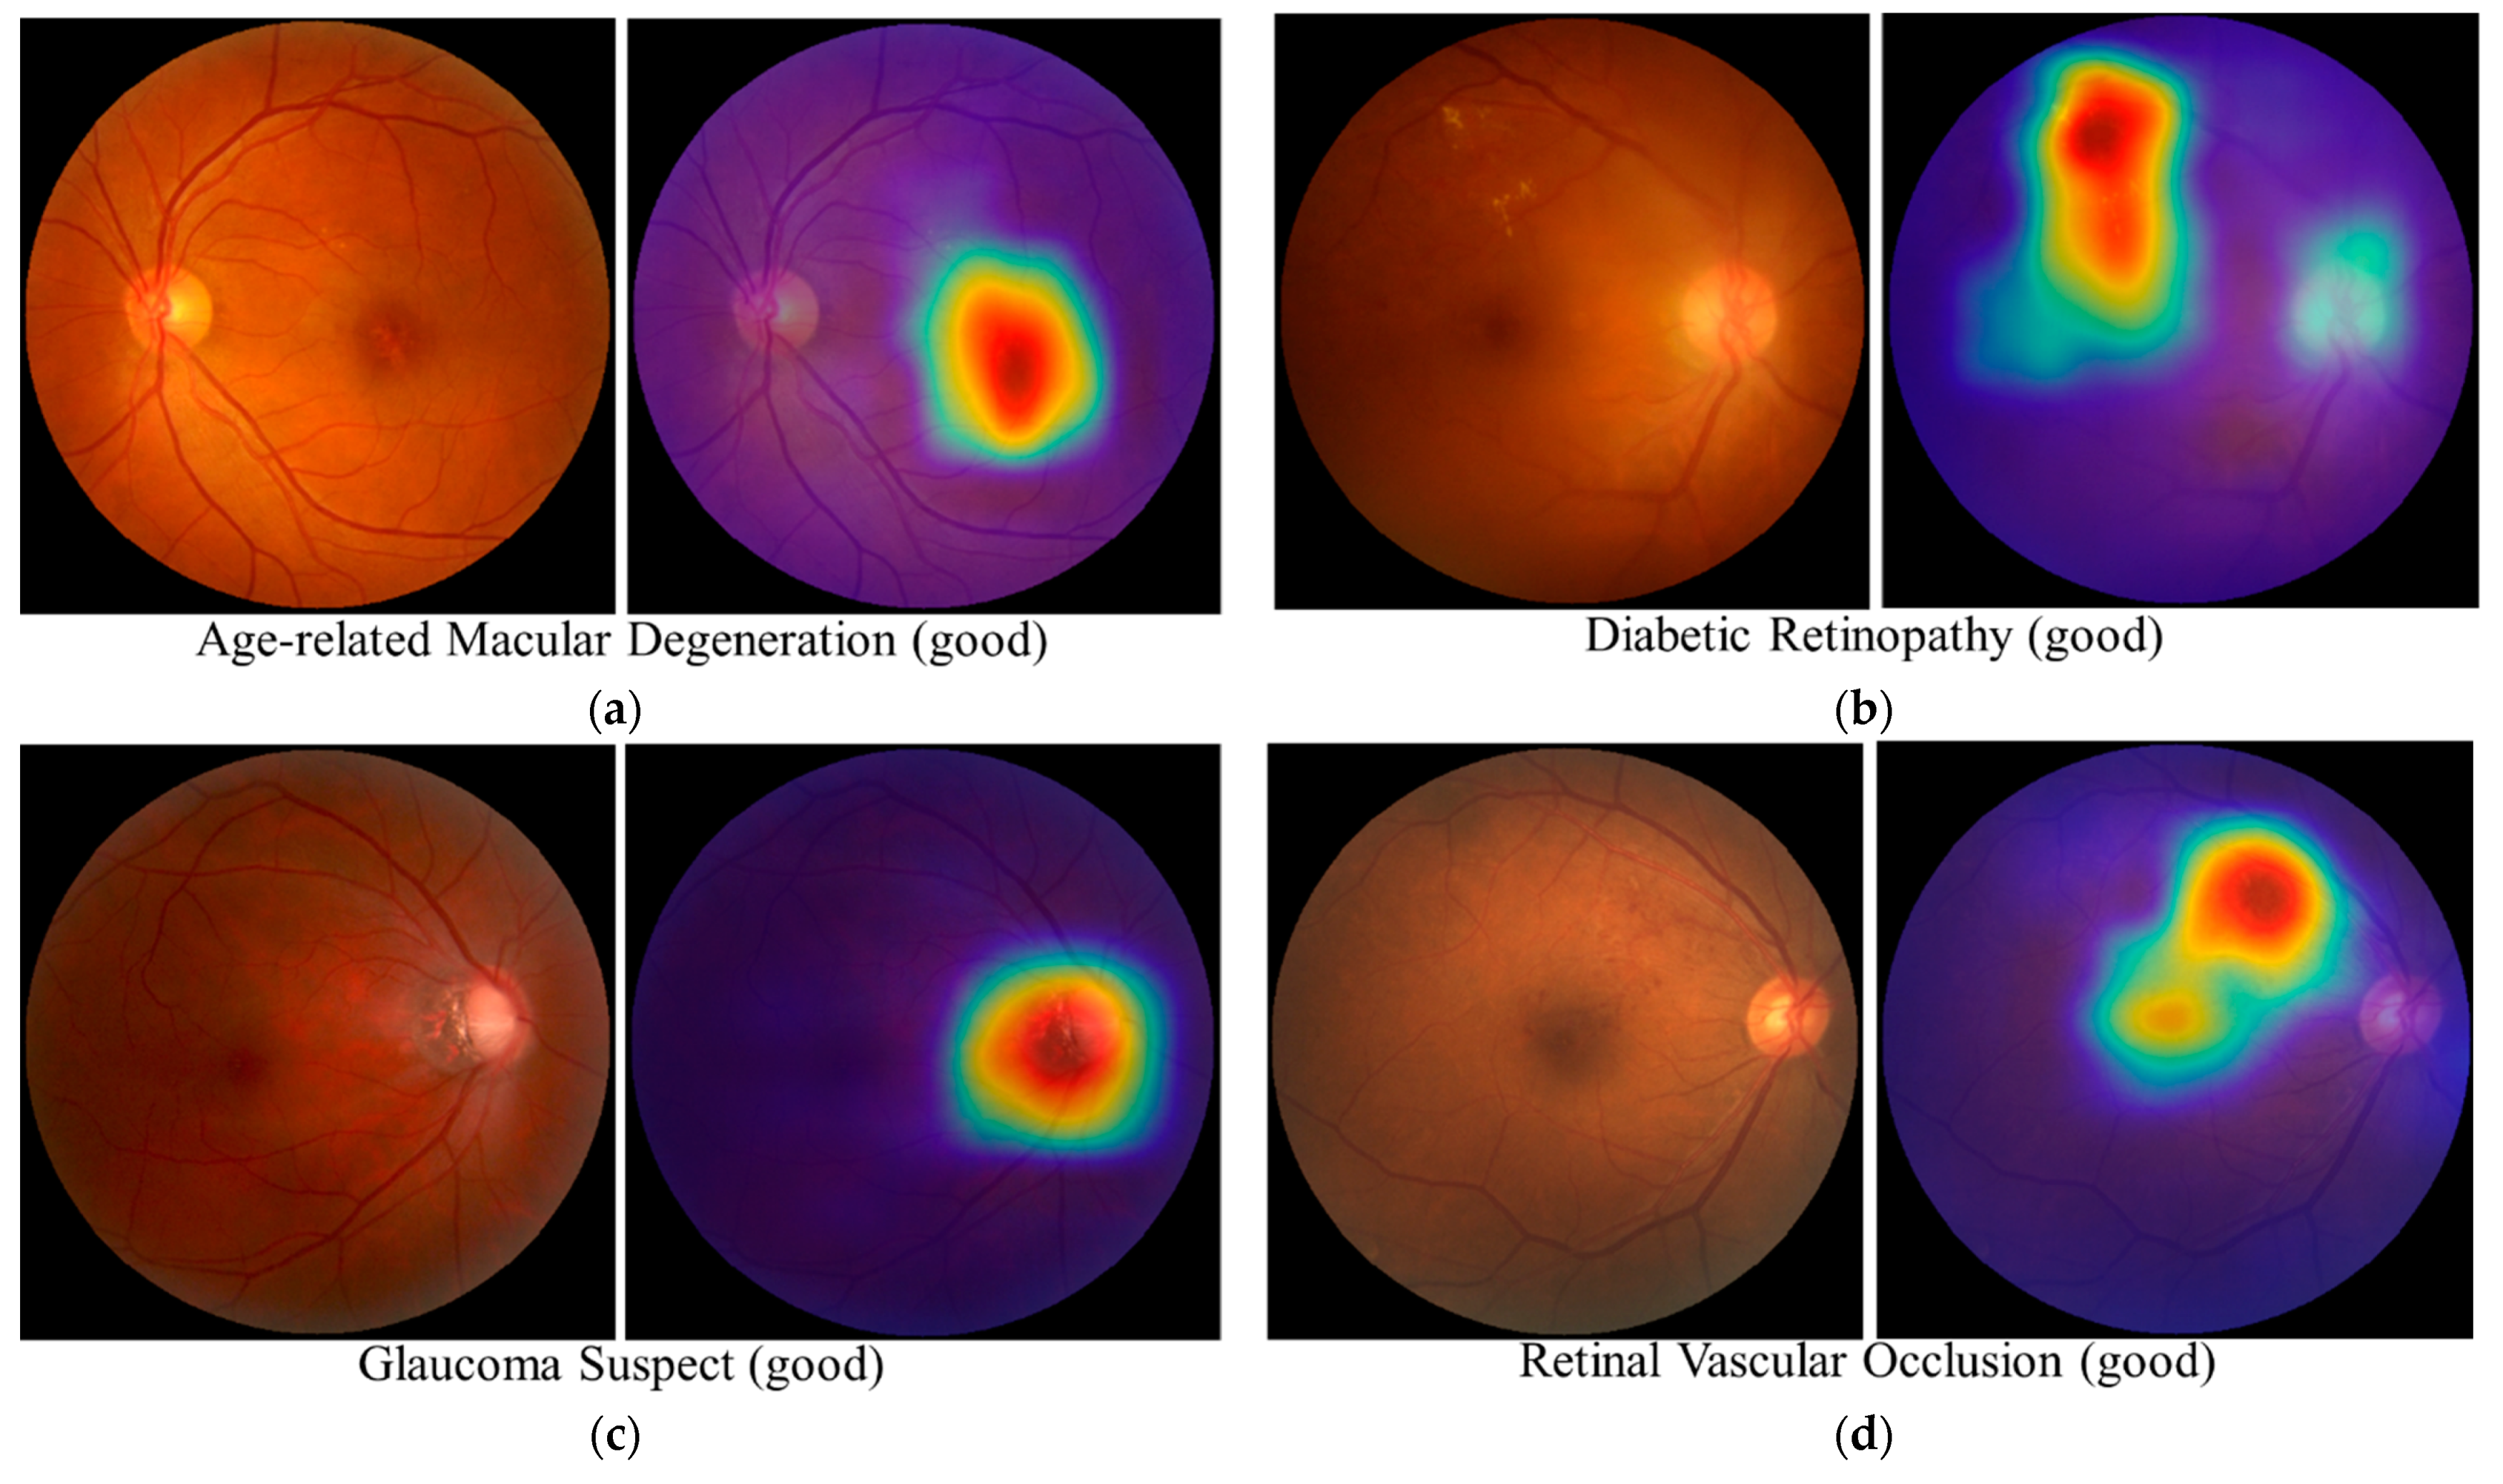
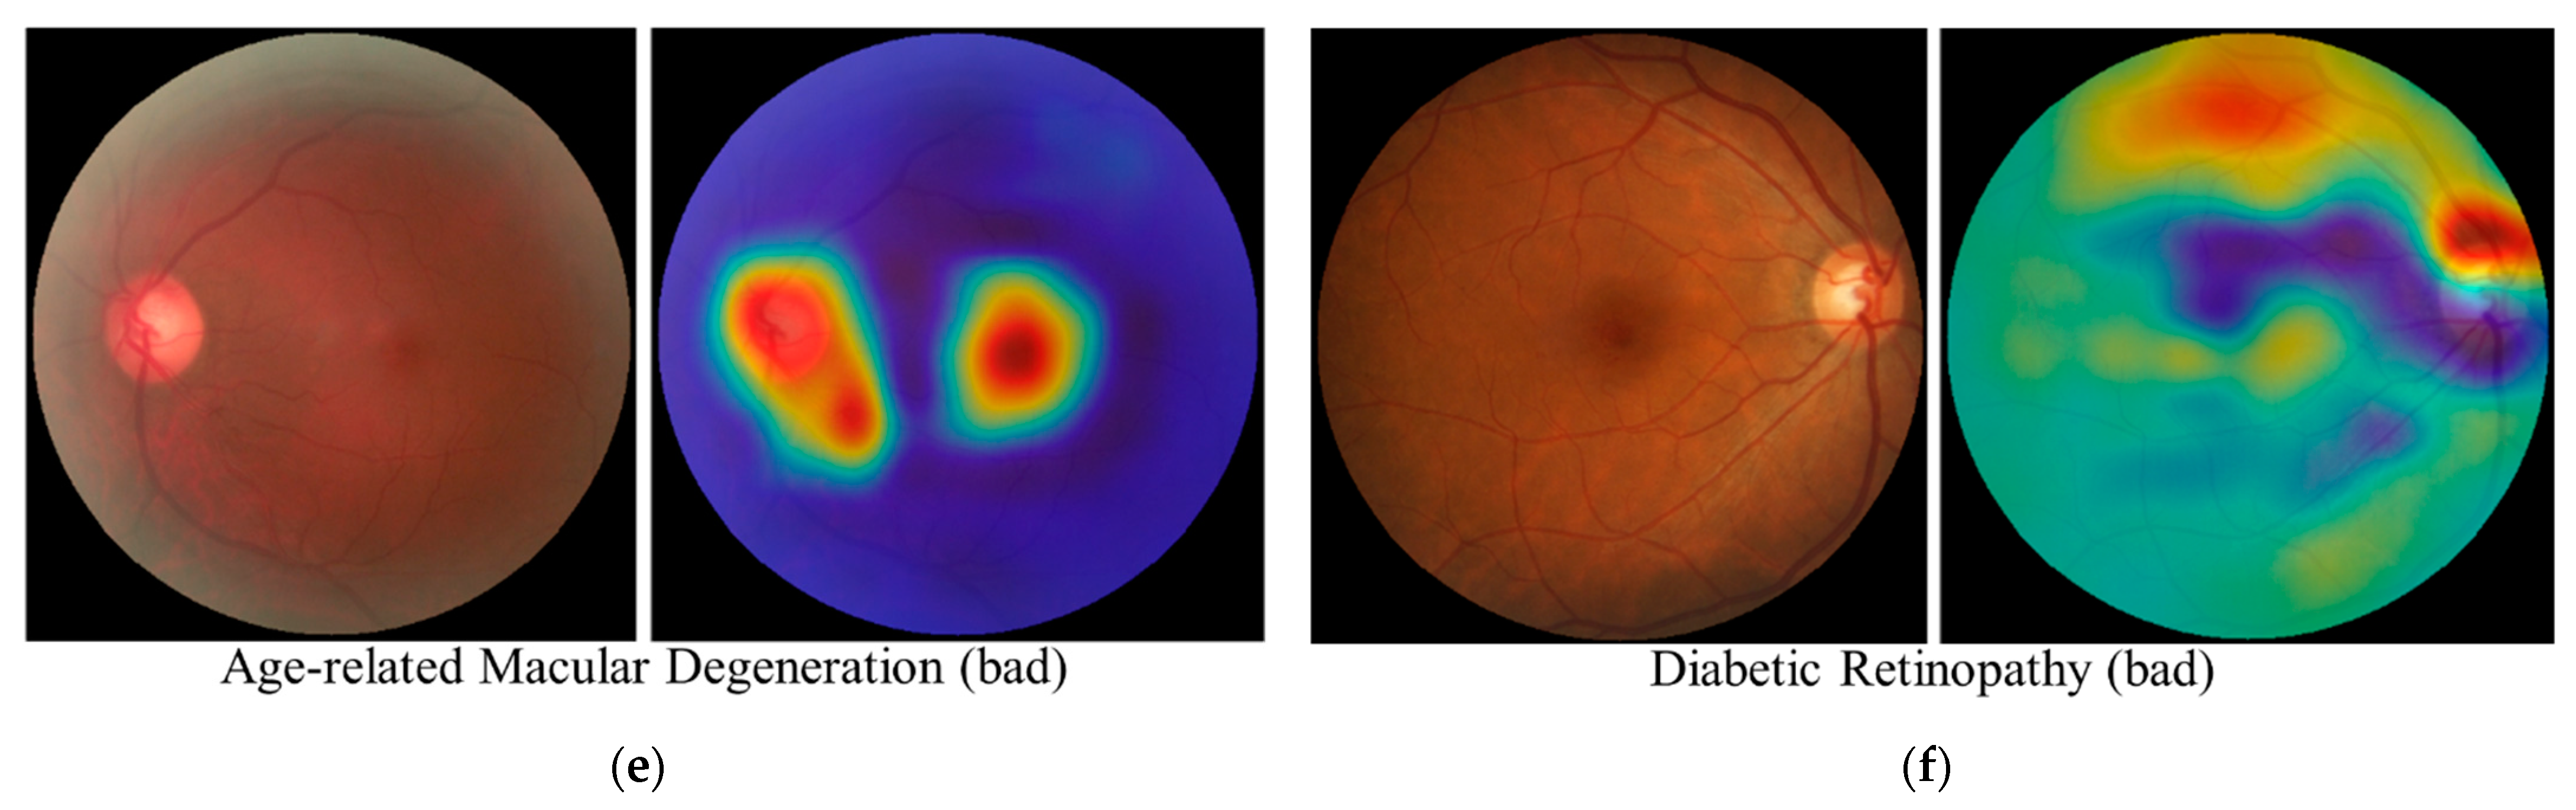
3.5. Interpretability Considerations

Interpretability has been a common challenge for deep learning because deep neural networks (DNNs) are trained to learn features automatically under the data-driven regime. One method to resolve this challenge is supported by visualization based on GradCAM (gradient-weighted class activation map) [26], which can highlight most discriminative regions of the photo for the model to make a prediction, and this was also demonstrated in our study, as shown in Figure 5.
The first four image–GradCAM pairs (a–d) respond to well-presented examples. However, the fifth GradCAM (e) includes both true positive and false positive from the perspective of lesions, and the lesions are spread throughout the fundus image in the sixth GradCAM that can rather hinder the correct interpretation. Although the fifth and sixth GradCAM (f) falls into the “fail” category, we cannot conclude this, since our algorithm provides diagnosis from multiple abnormal findings from one fundus photograph. Whether or not GradCAM provides corresponding areas only for final diagnosis for heterogenous abnormal features needs much more investigation which is far beyond our current study range. Providing confidence or uncertainty can be an alternative approach that is actively used in research. All of these are still not so enough to address high interpretability; thus, it is appropriate to position these kinds of AI tools as decision support software for the moment.

4. Discussion

Attempts to develop automated or semi-automated detection algorithms for various retinal diseases are not a novel concept for ophthalmologists [27,28]. However, the application of a deep learning method enabled these attempts to achieve a higher level of accuracy. In this study, we assessed the performance of our deep learning-based algorithm for detecting major retinal diseases. Unlike other algorithms, we focused on developing an algorithm that can be used as a diagnostic tool to aid in screening of the general population, regardless of baseline diseases. The ability to perform a multivariate diagnosis distinguishes our algorithm from previous algorithms that used univariate or multistep approaches for disease detection. Attempts to perform multi-class classification have previously been made using various methods and models; however, the limited availability of multi-class data and detailed annotation made these attempts marginally successful [5]. Using a fair amount of high-quality and well-annotated disease fundus photographs via transductive transfer learning, combined with a rollback fine-tuning technique to emphasize fine-grained features, our algorithm achieved a high level of initial performance.
In addition to the initial achievement of algorithm performance, considerable performance improvement was observed after applying unsupervised domain adaptation, followed by further transfer learning under a knowledge distillation scheme between ensemble teachers and a single-student model. As it is common for training data or source domain data to be labeled and testing data or target domain data to be unlabeled, it is apparent that these domain-adaptive training sequences are worth integrating into the workflow of algorithm development to improve the generalizability of the algorithms.
Some performance drop occurred when we evaluated our algorithm on another validation dataset including many multiple-diagnosis images. Although the detection rate for abnormalities was higher than 98%, some of the classifiers showed less discriminative capability. This implies that further study is needed to handle multiple-diagnosis photographs and to characterize the clinical applications of this algorithm with improved generalizability.
In conclusion, our algorithm showed high performance for the detection of multiple retinal diseases, such that it can function as a reliable fundus photography screening aid. Our algorithm needs further validation, but provides important proof that ophthalmologists can expect further applications of deep learning methods in visual screening and diagnosis through the appropriate development of algorithms. Further studies should focus on predicting disease progression or planning ophthalmic treatments.

Author Contributions

Conceptualization, S.J.S.; methodology, S.J.S., J.L. (JoonHo Lee), J.L. (Joonseok Lee), S.C., J.S.; software, J.L. (JoonHo Lee), J.L. (Joonseok Lee), S.C., J.S.; validation, M.S., D.P.; formal analysis, M.L.; data curation, S.J.S., S.H.K., J.Y.L., D.H.S., J.M.K., J.H.B.; writing—original draft preparation, S.J.S., J.L. (JoonHo Lee); writing—review and editing, S.J.S., J.L. (JoonHo Lee). All authors have read and agreed to the published version of the manuscript.

Funding

This research was funded by Kangbuk Samsung Hospital medical research fund grant (HIY0180061).

Institutional Review Board Statement

This study adhered to the tenets of the Declaration of Helsinki, and the study pro-tocol was reviewed and approved by the Institutional Review Board of Kangbuk Sam-sung Hospital (No. KBSMC 2018-01-040).

Informed Consent Statement

The requirement for written informed consent was waived because the study used retrospective and anonymized retinal images.

Data Availability Statement

Data available on request (The data used in the study may be available depending on the corresponding author and/or IRB’s discretion).

Acknowledgments

Part of this manuscript was presented at the 2018 Asian Pacific Teleophthalmology meeting.

Conflicts of Interest

The authors declare no conflict of interest.

References

  1. Abramoff, M.D.; Lou, Y.; Erginay, A.; Clarida, W.; Amelon, R.; Folk, J.C.; Niemeijer, M. Improved Automated Detection of Diabetic Retinopathy on a Publicly Available Dataset through Integration of Deep Learning. Investig. Opthalmology Vis. Sci. 2016, 57, 5200–5206. [Google Scholar] [CrossRef] [PubMed] [Green Version]
  2. Gargeya, R.; Leng, T. Automated Identification of Diabetic Retinopathy Using Deep Learning. Ophthalmology 2017, 124, 962–969. [Google Scholar] [CrossRef] [PubMed]
  3. Gulshan, V.; Peng, L.; Coram, M.; Stumpe, M.C.; Wu, D.; Narayanaswamy, A.; Venugopalan, S.; Widner, K.; Madams, T.; Cuadros, J.; et al. Development and Validation of a Deep Learning Algorithm for Detection of Diabetic Retinopathy in Retinal Fundus Photographs. JAMA 2016, 316, 2402–2410. [Google Scholar] [CrossRef] [PubMed]
  4. Ting, D.S.W.; Cheung, C.Y.-L.; Lim, G.; Tan, G.S.W.; Quang, N.D.; Gan, A.; Hamzah, H.; Garcia-Franco, R.; Yeo, I.Y.S.; Lee, S.Y.; et al. Development and Validation of a Deep Learning System for Diabetic Retinopathy and Related Eye Diseases Using Retinal Images from Multiethnic Populations with Diabetes. JAMA 2017, 318, 2211–2223. [Google Scholar] [CrossRef] [PubMed]
  5. Choi, J.Y.; Yoo, T.K.; Seo, J.G.; Kwak, J.; Um, T.T.; Rim, T.H. Multi-categorical deep learning neural network to classify retinal images: A pilot study employing small database. PLoS ONE 2017, 12, e0187336. [Google Scholar] [CrossRef] [PubMed] [Green Version]
  6. Park, S.J.; Shin, J.Y.; Kim, S.; Son, J.; Jung, K.-H.; Park, K.H. A Novel Fundus Image Reading Tool for Efficient Generation of a Multi-dimensional Categorical Image Database for Machine Learning Algorithm Training. J. Korean Med. Sci. 2018, 33, 239. [Google Scholar] [CrossRef] [PubMed]
  7. Burlina, P.M.; Joshi, N.; Pacheco, K.D.; Freund, D.E.; Kong, J.; Bressler, N.M. Use of Deep Learning for Detailed Severity Characterization and Estimation of 5-Year Risk among Patients with Age-Related Macular Degeneration. JAMA Ophthalmol. 2018, 136, 1359–1366. [Google Scholar] [CrossRef] [PubMed] [Green Version]
  8. Poplin, R.; Varadarajan, A.V.; Blumer, K.; Liu, Y.; McConnell, M.V.; Corrado, G.S.; Peng, L.; Webster, D.R. Prediction of cardiovascular risk factors from retinal fundus photographs via deep learning. Nat. Biomed. Eng. 2018, 2, 158–164. [Google Scholar] [CrossRef] [PubMed]
  9. Seong, S.C.; Kim, Y.-Y.; Park, S.K.; Khang, Y.H.; Kim, H.C.; Park, J.H.; Kang, H.-J.; Do, C.-H.; Song, J.-S.; Lee, E.-J.; et al. Cohort profile: The National Health Insurance Service-National Health Screening Cohort (NHIS-HEALS) in Korea. BMJ Open 2017, 7. [Google Scholar] [CrossRef] [PubMed] [Green Version]
  10. Setiawan, A.W.; Mengko, T.R.; Santoso, O.S.; Suksmono, A.B. Color retinal image enhancement using CLAHE. In Proceedings of the International Conference on ICT for Smart Society (ICISS), Jakarta, Indonesia, 13–14 June 2013. [Google Scholar] [CrossRef]
  11. Youm, D.J.; Oh, H.-S.; Yu, H.G.; Song, S.J. The Prevalence of Vitreoretinal Diseases in a Screened Korean Population 50 Years and Older. J. Korean Ophthalmol. Soc. 2009, 50, 1645–1651. [Google Scholar] [CrossRef]
  12. Bird, A.C.; Bressler, N.M.; Bressler, S.B.; Chisholm, I.H.; Coscas, G.; Davis, M.D.; de Jong, P.T.; Klaver, C.C.W.; Klein, B.; Klein, R.; et al. An international classification and grading system for age-related maculopathy and age-related macular degeneration: The International ARM Epidemiological Study Group. Surv. Ophthalmol. 1995, 39, 367–374. [Google Scholar] [CrossRef] [Green Version]
  13. Early Treatment Diabetic Retinopathy Study Research Group. Grading Diabetic Retinopathy from Stereoscopic Color Fundus Photographs—An Extension of the Modified Airlie House Classification. Ophthalmology 1991, 98 (Suppl. 5), 786–806. [Google Scholar] [CrossRef]
  14. Kim, K.E.; Kim, M.J.; Park, K.H.; Jeoung, J.W.; Kim, S.H.; Kim, C.Y.; Kang, S.W. Prevalence, awareness, and risk factors of primary open-angle glaucoma: Korea National Health and Nutrition Examination Survey 2008–2011. Ophthalmology 2016, 123, 532–541. [Google Scholar] [CrossRef] [PubMed]
  15. Kim, C.S.; Seong, G.J.; Lee, N.H.; Song, K.C.; Society, K.G.; Namil Study Group. Prevalence of primary open-angle glaucoma in central South Korea the Namil study. Ophthalmology 2011, 118, 1024–1030. [Google Scholar] [CrossRef] [PubMed]
  16. He, K.; Zhang, X.; Ren, S.; Sun, J. Deep residual learning for image recognition. In Proceedings of the 29th IEEE Conference on Computer Vision and Pattern Recognition Recognition (CVPR 2016), Las Vegas, NV, USA, 26 June–1 July 2016; pp. 770–778. [Google Scholar]
  17. Szegedy, C.; Vanhoucke, V.; Ioffe, S.; Shlens, J.; Wojna, Z. Rethinking the Inception Architecture for Computer Vision. In Proceedings of the 2016 Computer Vision and Pattern Recognition (CVPR), Las Vegas, NV, USA, 26 June–1 July 2016. [Google Scholar]
  18. Krizhevsky, A.; Sutskever, I.; Hinton, G.E. Imagenet classification with deep convolutional neural networks. In Proceedings of the Advances in Neural Information Processing Systems (NIPS), Lake Tahoe, NV, USA, 3–8 December 2012; pp. 1097–1105. [Google Scholar]
  19. Sermanet, P.; Eigen, D.; Zhang, X.; Mathieu, M.; Fergus, R.; LeCun, Y. Overfeat: Integrated recognition, localization and detection using convolutional networks. arXiv 2014, arXiv:1312.6229. [Google Scholar]
  20. Vapnik, V.N. Statistical Learning Theory; Wiley: New York, NY, USA, 1998; pp. 416–417. [Google Scholar]
  21. Simonyan, K.; Zisserman, A. Very deep convolutional networks for large-scale image recognition. In Proceedings of the 3rd International Conference on Learning Representations (ICLR), San Diego, CA, USA, 7–9 May 2015; pp. 1–14. [Google Scholar]
  22. Zagoruyko, S.; Komodakis, N. Wide residual network. In Proceedings of the 27th British Machine Vision Conference, York, UK, 19–22 September 2016. [Google Scholar] [CrossRef] [Green Version]
  23. Ro, Y.; Choi, J.; Jo, D.U.; Heo, B.; Lim, J.; Choi, J.Y. Backbone can not be trained at once: Rolling back to pre-trained network for person re-identification. In Proceedings of the 33rd AAAI Conference on Artificial Intelligence (AAAI-19), Honolulu, HW, USA, 27 January–1 February 2019. [Google Scholar] [CrossRef]
  24. Saito, K.; Watanabe, K.; Ushiku, Y.; Harada, T. Maximum classifier discrepancy for unsupervised domain adaptation. In Proceedings of the 2018 Computer Vision and Pattern Recognition (CVPR), Salt Lake City, UT, USA, 18–23 June 2018. [Google Scholar] [CrossRef] [Green Version]
  25. Hinton, G.; Vinyals, O.; Dean, J. Distilling the knowledge in a neural network. arXiv 2015, arXiv:1503.02531. [Google Scholar]
  26. Selvaraju, R.R.; Cogswell, M.; Das, A.; Vedantam, R.; Parikh, D.; Batra, D. Grad-CAM: Visual explanations from deep Networks via gradient-based localization. In Proceedings of the 16th IEEE International Conference on Computer Vision (ICCV), Venice, Italy, 22–29 October 2017; pp. 618–626. [Google Scholar]
  27. Quellec, G.; Lee, K.; Dolejsi, M.; Garvin, M.K.; Abramoff, M.D.; Sonka, M. Three-dimensional analysis of retinal layer texture: Identification of fluid-filled regions in SD-OCT of the macula. IEEE Trans. Med. Imaging. 2010, 29, 1321–1330. [Google Scholar] [CrossRef] [PubMed] [Green Version]
  28. Rhee, E.J.; Chung, P.W.; Wong, T.Y.; Song, S.J. Relationship of retinal vascular caliber variation with intracranial arterial stenosis. Microvasc. Res. 2016, 108, 64–68. [Google Scholar] [CrossRef] [PubMed]
Figure 1. Schematic diagram of the inference workflow of our algorithm; each diagnosis classifier independently yields a positive output when the predictive score exceeds the cutoff threshold. AMD, age-related macular degeneration; DR, diabetic retinopathy; ERM, epiretinal membrane; RVO, retinal vascular occlusion; GS, suspected glaucoma.
Electronics 10 00163 g001
Figure 2. Representative annotation example. Annotation for DR: red-lined section consists of DR findings with retinal hemorrhages and macular edema.
Electronics 10 00163 g002
Figure 3. The details of each diagnosis: (left) preprocessing; (right) diagnosis detector.
Electronics 10 00163 g003
Figure 4. Areas under the receiver operating characteristic curve (AUC) of performance for detecting abnormal fundus photography: (a) AMD, (b) DR, (c) ERM, (d) suspected glaucoma, and (e) RVO.
Electronics 10 00163 g004
Figure 5. GradCAM (gradient-weighted class activation map) [20] analysis on the trained model.
Electronics 10 00163 g005aElectronics 10 00163 g005b
Table 1. Demographic characteristics and image features of the dataset used in this study.
OverallTraining DataTuning Data
Numbers43,22733,8959332
Participants25,90520,4985407
Age (mean ± SD, years)53.38 ± 10.9752.13 ± 10.7556.71 ± 10.79
Sex (female, %)16,36512,702 (38.57%)3663 (40.27%)
Location (right eye, %)22,34817,543 (51.76%)4805 (51.49%)
Abnormal grading (instances, %)23,61318,209 (53.7%)5404 (57.9%)
Label (%)
AMD (instances, %)13,47110,485 (30.92%)2986 (31.99%)
ERM (instances, %)25991998 (5.89%)601 (6.44%)
DR (instances, %)54414045 (11.93%)1396 (14.96%)
RVO (instances, %)1166930 (2.74%)236 (2.53%)
Suspected glaucoma (instances, %)949763 (2.25%)186 (1.99%)
SD: standard deviation, AMD: age-related macular degeneration, ERM: epiretinal membrane, DR: diabetic retinopathy, RVO: retinal vascular occlusion.
Table 2. Main validation dataset structure.
Testing Data
Numbers11,707
Abnormal grading (instances, %)1327 (11.34%)
Label (%)
AMD (instances, %)857 (7.32%)
ERM (instances, %)176 (1.50%)
DR (instances, %)103 (0.88%)
RVO (instances, %)69 (0.59%)
Suspected glaucoma (instances, %)122 (1.04%)
AMD: age-related macular degeneration, ERM: epiretinal membrane, DR: diabetic retinopathy, RVO: retinal vascular occlusion.
Table 3. Per-diagnosis AUCs.
AMDDRERMGSRVO
Mean0.94320.96210.98160.97270.9612
Min, 95% CI0.93230.94020.97130.95350.9354
Max, 95% CI0.95410.98390.99190.99200.9870
AUC: area under the receiving operating characteristic curve, AMD: age-related macular degeneration, ERM: epiretinal membrane, DR: diabetic retinopathy, RVO: retinal vascular occlusion; CI: confidence interval.
Table 4. Per-diagnosis sensitivities.
AMDDRERMGSRVO
Mean0.89170.91170.94300.94230.8605
Min, 95% CI0.87060.85980.91270.89050.7963
max, 95% CI0.91270.96350.97330.99410.9246
AMD: age-related macular degeneration, ERM: epiretinal membrane, DR: diabetic retinopathy, RVO: retinal vascular occlusion.
Table 5. Per-diagnosis specificities.
AMDDRERMGSRVO
Mean0.86240.89450.92830.89330.9610
Min, 95% CI0.84040.83380.88810.81470.9109
Max, 95% CI0.88440.95520.96850.97191.0000
AMD: age-related macular degeneration, ERM: epiretinal membrane, DR: diabetic retinopathy, RVO: retinal vascular occlusion.
Table 6. Area under the receiver operating characteristic curve (AUROC) comparison with prior studies.
Gulshan et al. [3]Burlina et al. [7]Ting et al. [4]This Work
Diseases of interestDRAMDDR, AMD, GSDR, AMD, GS, ERM, RVO
Referable DR or DME0.974
(0.971–0.978)
0.936
(0.925–0.943)
0.962
(0.940–0.984)
Referable AMD 0.95
(0.94–0.96)
0.942
(0.929–0.954)
0.943
(0.932–0.954)
Glaucoma Suspected 0.942
(0.929–0.954)
0.973
(0.954–0.992)
ERM 0.982
(0.971–0.992)
RVO 0.961
(0.935-0.987)
Table 7. Demographic characteristics and image features of the second validation dataset.
Testing Data
Numbers1698
Participants1080
Age (mean ± SD, years)59.59 ± 14.58
Sex (female, %)455 (42.13%)
Location (OD, %)858 (50.53%)
Abnormal grading (instances, %)1501 (88.40%)
Label (%)
AMD (instances, %)545 (32.10%)
ERM (instances, %)152 (8.95%)
DR (instances, %)581 (34.22%)
RVO (instances, %)154 (9.07%)
Suspected glaucoma (instances, %)46 (2.71%)
Others (instances, %)176 (10.37%)
Multiple diagnosis (instances, %)147 (8.66%)
SD: standard deviation, AMD: age-related macular degeneration, ERM: epiretinal membrane, DR: diabetic retinopathy, RVO: retinal vascular occlusion.
Table 8. Per-diagnosis AUCs on the second validation dataset.
AMDDRERMGSRVO
Mean0.94970.90700.84380.94510.8667
Min, 95% CI0.93660.88580.79600.89370.8232
Max, 95% CI0.96280.92820.89170.99650.9102
AUC: area under the receiving operating characteristic curve, AMD: age-related macular degeneration, ERM: epiretinal membrane, DR: diabetic retinopathy, RVO: retinal vascular occlusion.
Publisher’s Note: MDPI stays neutral with regard to jurisdictional claims in published maps and institutional affiliations.

