Article

A Novel Two-Level Fusion Feature for Mixed ECG Identity Recognition

1
College of Communication Engineering, Jilin University, Changchun 130012, China
2
School of Electronic and Information Engineering (SEIE), Zhuhai College, Jilin University, Zhuhai 519041, China
*
Author to whom correspondence should be addressed.
Electronics 2021, 10(17), 2052; https://doi.org/10.3390/electronics10172052
Submission received: 10 July 2021 / Revised: 22 August 2021 / Accepted: 22 August 2021 / Published: 25 August 2021
(This article belongs to the Section Bioelectronics)

Abstract

:
In recent years, with the increasing standard of biometric identification, it is difficult to meet the requirements of data size and accuracy in practical application for training a single ECG (electrocardiogram) database. The paper aims to construct a recognition model for processing multi-source data and proposes a novel ECG identification system based on two-level fusion features. Firstly, the features of Hilbert transform and power spectrum are extracted from the segmented heartbeat data, then two features are combined into a set and normalized to obtain the elementary fusion feature. Secondly, PCANet (Principal Component Analysis Network) is used to extract the discriminative deep feature of signal, and MF (MaxFusion) algorithm is proposed to fuse and compress the two layers learning features. Finally, a linear support vector machine (SVM) is used to obtain labels of single feature classification and complete the individual identification. The recognition results of the proposed two-level fusion PCANet deep recognition network achieve more than 95% on ECG-ID, MIT-BIH, and PTB public databases. Most importantly, the recognition accuracy of the mixed database can reach 99.77%, which includes 426 individuals.

1. Introduction

The new recognition technology mainly refers to biometric identification technology. It uses the physiological or behavioral characteristics of the human body as a recognition basis and combines with modern computer science to realize the recognition function. Common biometric technologies include fingerprint, face, iris, and gait recognition [1], but they are all static biometric features of the external body and have security problems of being stolen and copied. Therefore, researchers have begun to study identification technology based on ECGs, which only exist in the living body.
An ECG consists of physiological information that exists along with one’s life, and the waveforms are various with an individual’s heart size, position, gender, age, and other self-factors. So ECG signal represents discriminative identity information among different individuals [2]. The amplitude, area and mean value of ECG signals in different individuals are different, and these visual difference features of signals have a unique value for identification [3,4,5]. This kind of visual difference can be extracted from time-domain feature points which are based on accurately locating the P, Q, R, S, and T waveforms in signals. These parameters are adopted to represent the characteristics of one heartbeat, and then the classifier is used for classification [6,7,8,9,10,11]. Muhammad Najam Dar et al. used the method of before and after R-peak signal segmentation and applied discrete wavelet transform (DWT) to extract wavelet coefficients for ECG signals recognition [12]. Xu et al. proposed personal biometric identification with a convolutional neural network (CNN) based on the ECG signals that were measured during bathing. They used a QRS complex which had more discriminative information as input samples [13]. In the above literature, fiducial point detection is performed to obtain features of ECG signals. This kind of method relies on the accuracy of the fiducial detection algorithm and the visual differences of time-domain features cannot deeply learn discriminative information from signals, thus affecting the recognition result.
To solve the limitation of time-domain features based on the above fiducial points, researchers proposed to mine and transform low information of signals to obtain the deep features [14,15]. Lin et al. implemented a nonlinear SVM classifier with a polynomial kernel function to identify the extracted chaotic feature combination of ECG signal [16]. Rahhal et al. built the deep neural network model to classify ECG signal features that automatically learned from SDAEs (stacked denoising autoencoders) [17]. Kim et al. used a 2-D coupling image generated from three periods of ECG signal as input data and applied CNN that was specialized for image processing to complete personal identification [18]. Through analysis of the above literature, we can see that the deep learning network model has a stronger ability of automatic feature learning. The multi-layer neural network model is applied in the ECG signal identification system [19,20,21]. However, the above studies only adopted a single feature form and were applied on a single database or dataset with few individuals. When dealing with a large number of individuals, it is difficult to ensure that the feature space of ECG signals can obtain the same ideal identification result.
Aiming at the practical application requirements of a single feature model, the advantages of multi-feature fusion technology have attracted the attention of researchers. According to the location of fusion modules, multi-feature fusion algorithm includes data layer fusion, feature layer fusion [22], score layer fusion [23], and decision layer fusion [24]. Chen et al. extracted fusion features of QRS complex and other feature points with Kernel Principal Component Analysis (KPCA) to identify [25]. Golrizkhatami et al. combined multi-layer features of the trained CNN by score level fusion method and realized effective feature layer fusion of two handcrafted features. Finally, the individual decisions of three different classifiers are fused together based on the majority voting [26]. Danni et al. proposed a fast feature-fusion method of ECG heartbeat classification based on multi-linear subspace learning [27]. In different fusion levels, the complementary information contained in signals is different based on different forms of data, so the fusion results are not the same. As the advantages and disadvantages of each fusion algorithm are fixed, the system will face the problem of how to balance the selection of fusion features and recognition performance when using any single fusion method.
According to these problems that existed in research results of personal identification, this paper proposes an ECG identity recognition model of two-level feature layer fusion. The first level of the system analyzes the time-frequency domain fusion features of the ECG signal, then PCANet is adopted to mine the internal relations of the first-level features. As a simple deep learning model, PCANet has been applied in the field of image recognition and arrhythmia diagnosis. It has achieved great experimental results [28,29,30,31]. The features extracted through PCANet are often sparse and high-dimensional, which can be easily distinguished by linear classifiers. Due to the consideration of different distribution rules of various ECG databases, the data increasing is likely to cause the exponential growth of dimension of PCANet learning features. Therefore, in the second level of the system, a novel fusion dimension reduction algorithm is proposed, which effectively fuses the deep feature information of two PCANet layers. The fundamental contributions of this study can be summarized as follows:
  • The simplified process of identification without denoising algorithm;
  • Novel combination of manual features for Hilbert transform and power spectrum;
  • The MaxFusion algorithm is proposed to reduce the dimension of PCANet learning features;
  • The identification implementation of mixed data set with different sampling frequencies.
The subsequent arrangement of the paper is as follows: Section 2 introduces specific contents of the proposed identification network of two-level fusion features in detail. Section 3 shows the simulation results of the proposed model. Section 4 deeply discusses the simulation experiment results and future work. Section 5 states the final conclusions.

2. Materials and Methods

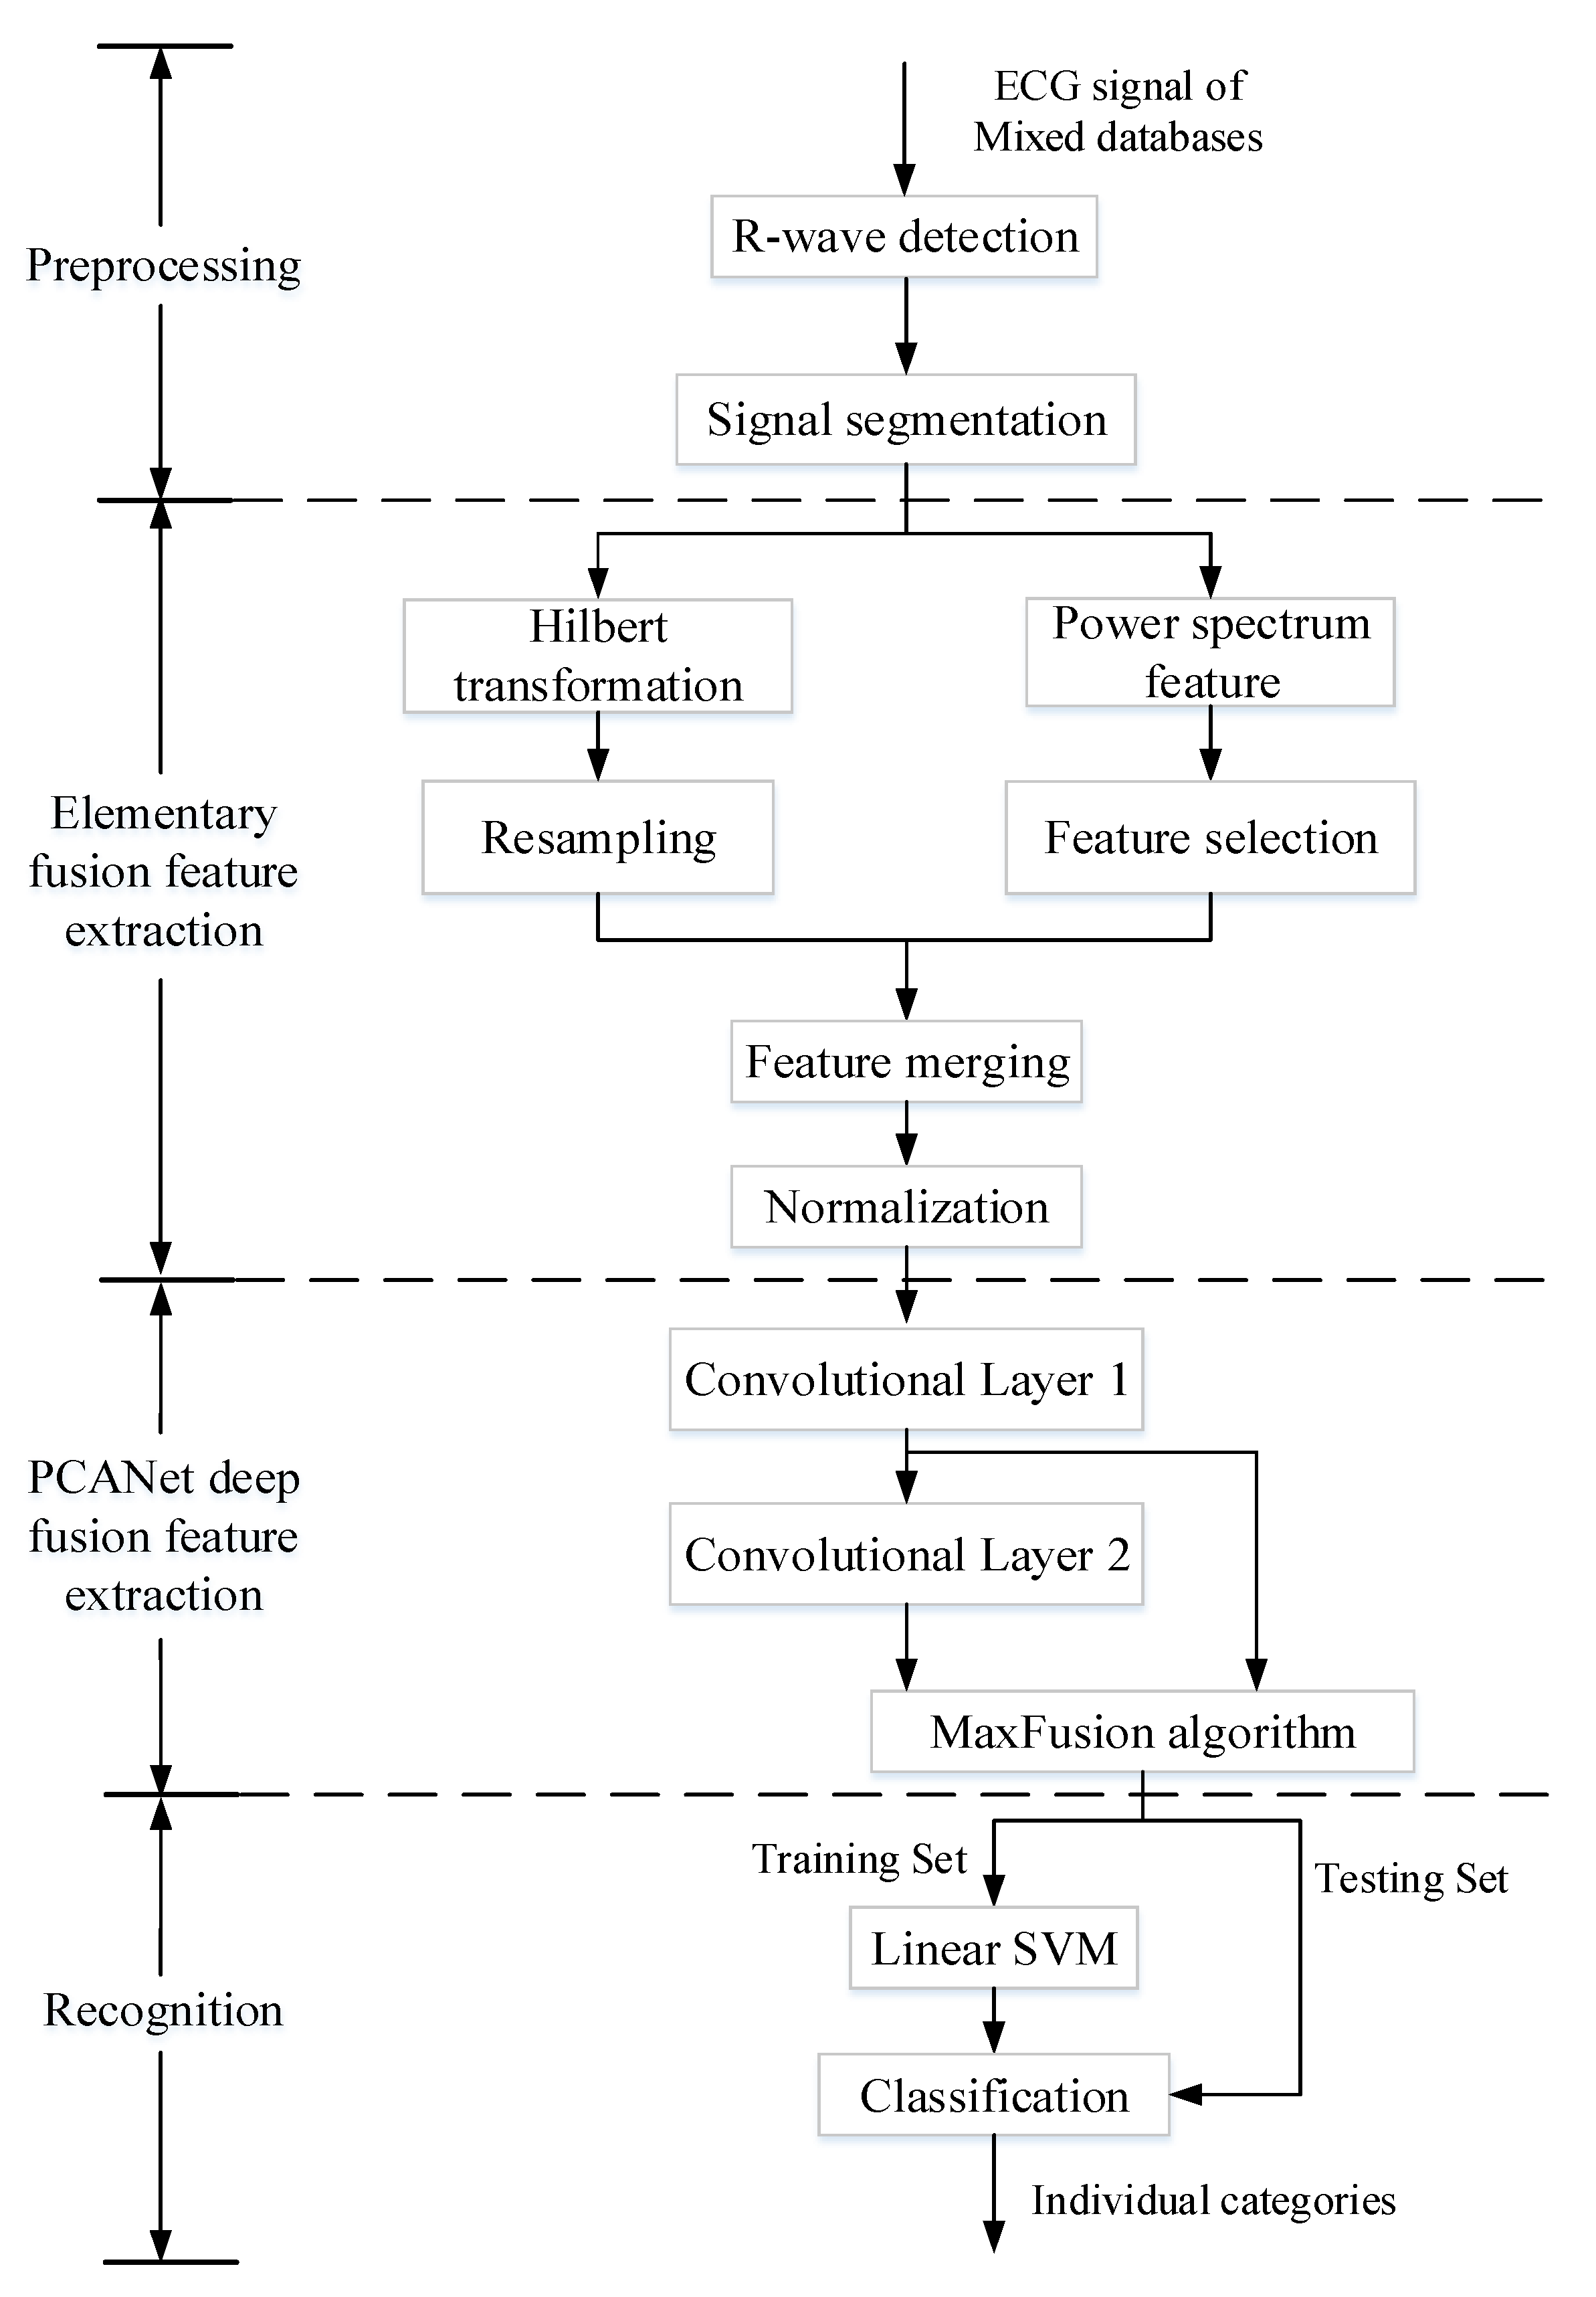
2.1. The Overall Process of Two-Level Fusion Feature Identification Network
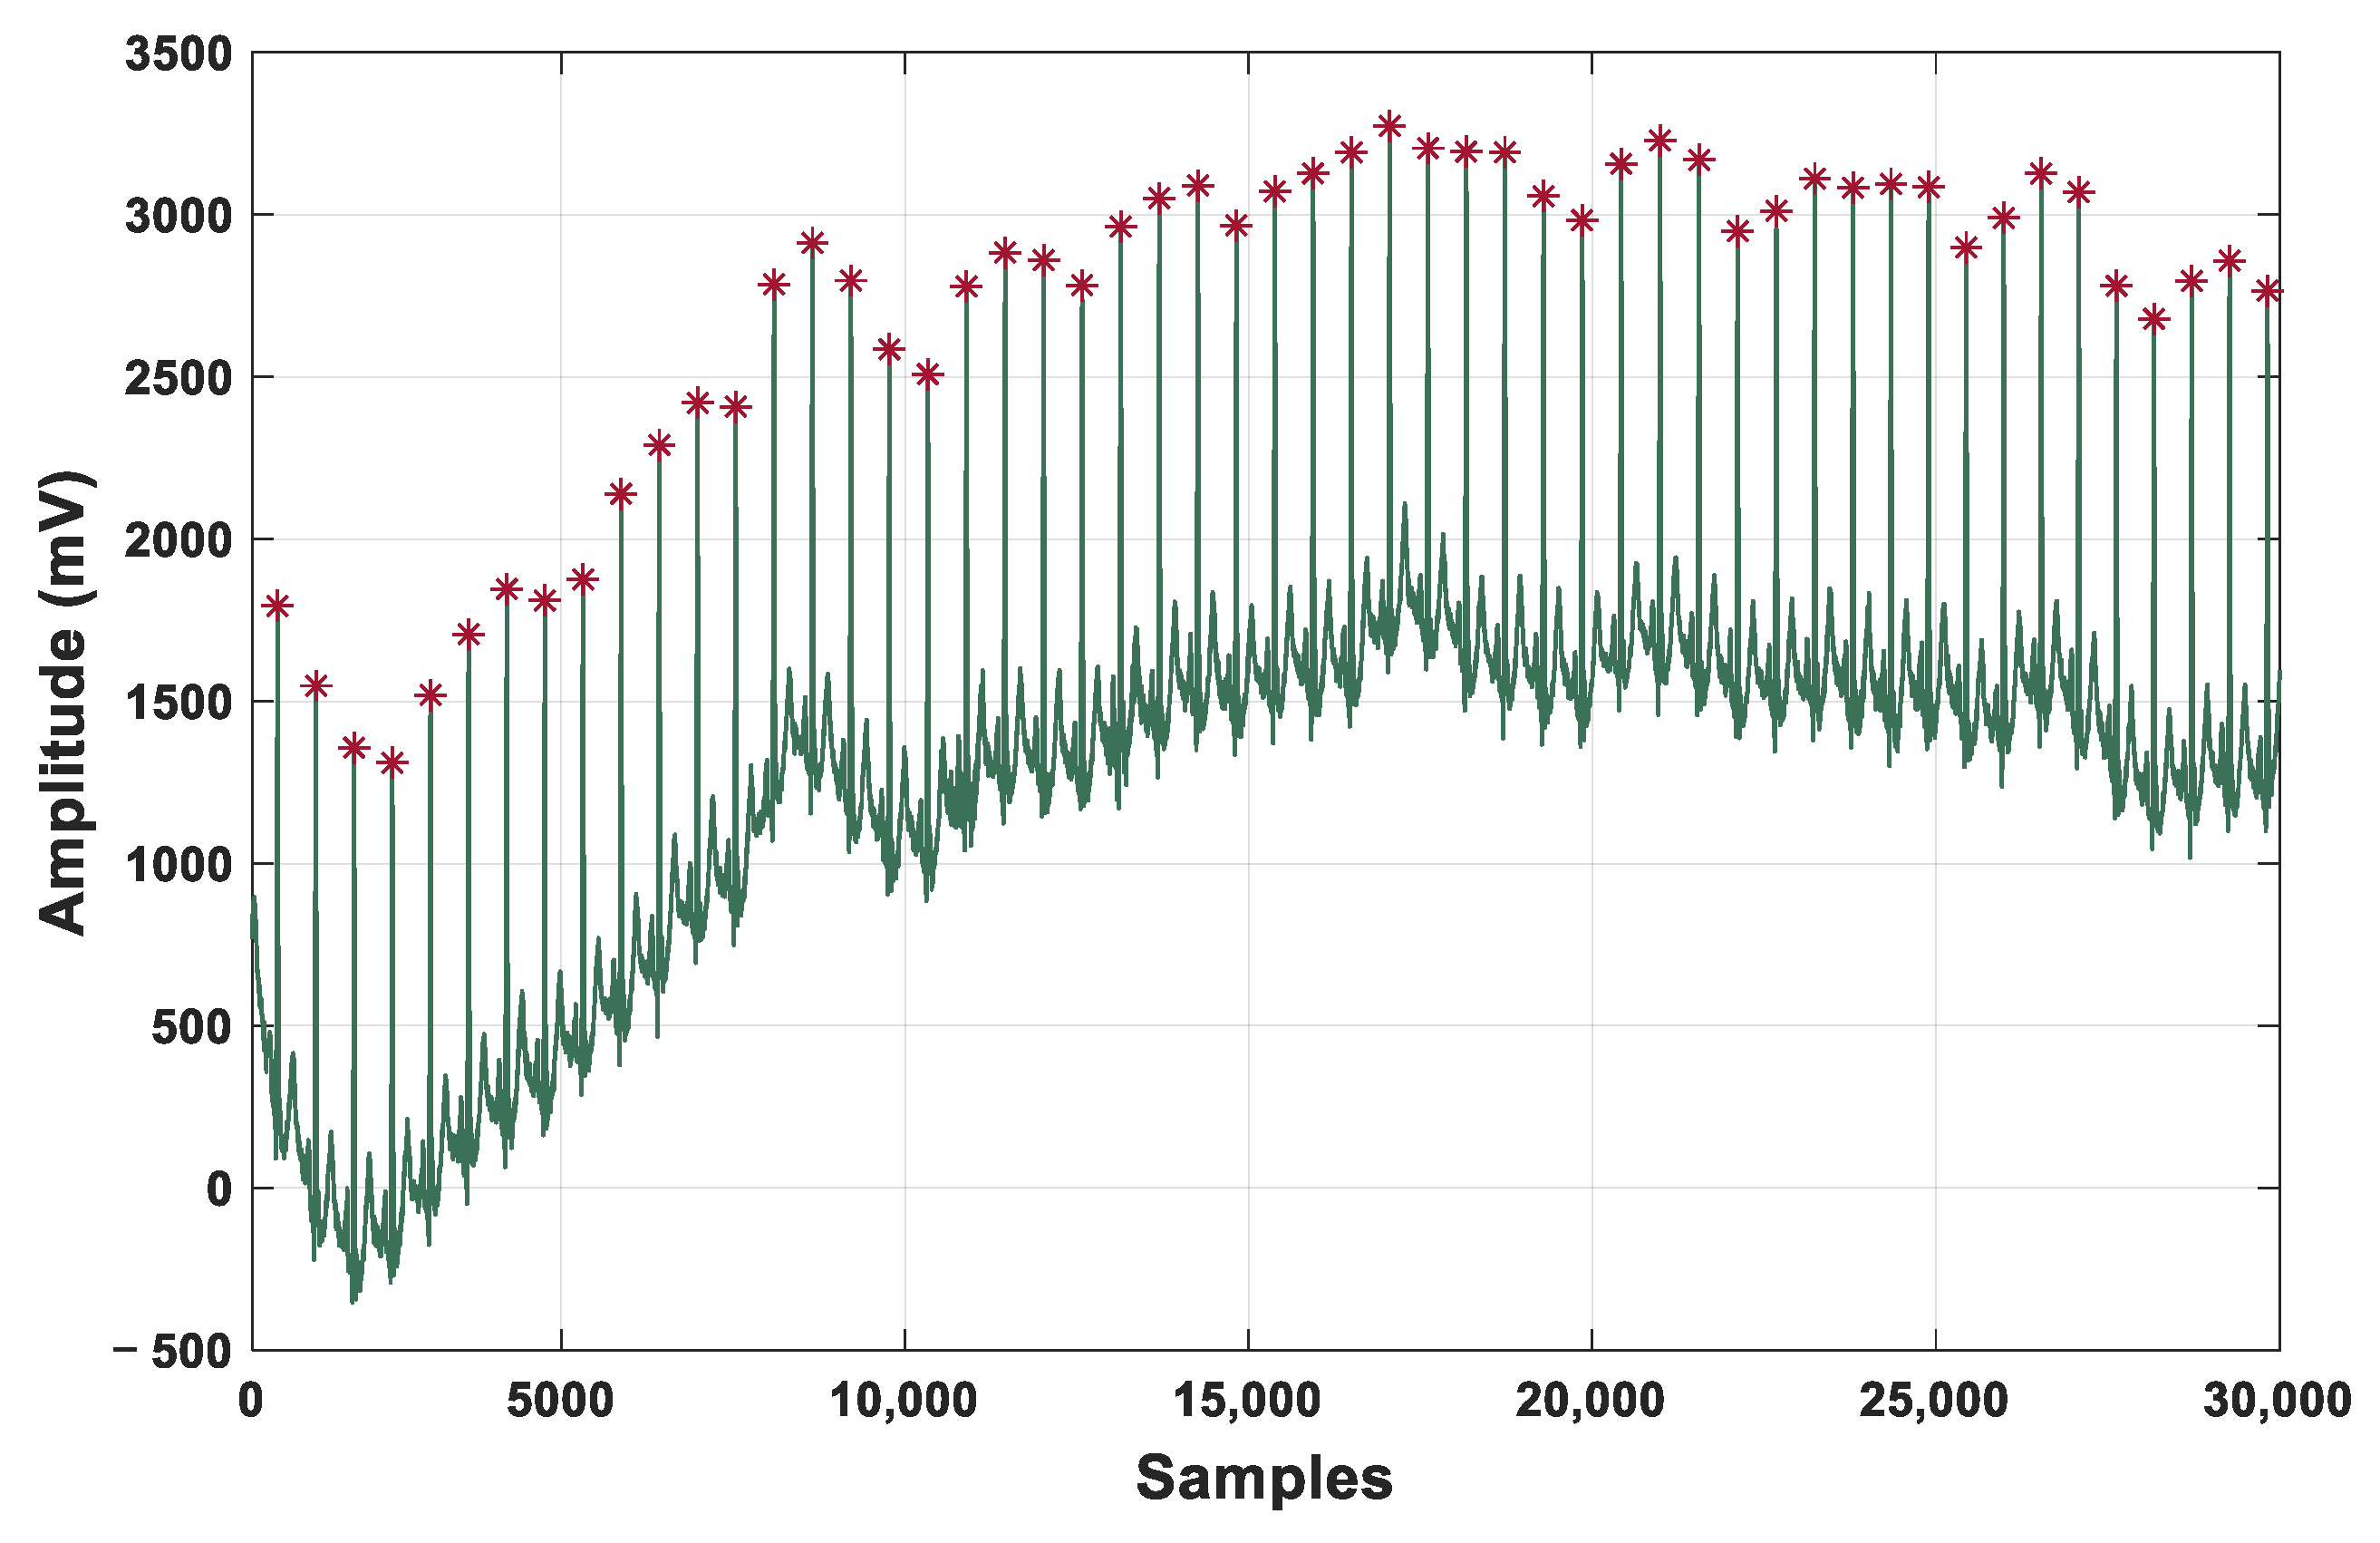
Figure 1 is the overall block diagram of the two-level fusion identification structure proposed in this paper. As shown in Figure 1, the whole recognition process is mainly composed of the following parts: (1) Preprocessing; (2) Elementary fusion feature extraction algorithm; (3) PCANet deep fusion feature extraction algorithm; (4) Individual label recognition. The second and third parts are the core content of the proposed method and they are called the two-level feature fusion algorithm. The two parts are described in Section 2.2 and Section 2.3 for details.

2.2. Preprocessing

The three public ECG data sources used in this paper contain different degrees of noise. In recent years, more denoising algorithms have been studied, “pure ECG signal” that seems with less interference is obtained. Due to the overlap of ECG signal and noise in the frequency domain, the denoising operation is likely to remove part of signals that are useful for individual classification, thus affecting recognition accuracy. In the overall recognition model of the paper, R wave detection is directly implemented for raw ECG signals and the process of denoising is omitted. On one hand, the process of preprocessing is simplified, and on the other hand, the useful information for discrimination will not be lost while removing noise to reduce model performance.
Compared with the other waves in ECG signals, the fluctuation characteristic of the QRS complex is more evident, the amplitude and slope of the R wave are relatively large. Therefore, the system detects the R wave peak of original ECG signals with noise. The singular point R wave in signals corresponds to the maximum point of each wavelet scale signal. Mexh wavelet base [32] is selected to transform signals in the six-layer frequency domain, and the threshold is set to mark the R wave peak. Meanwhile, according to the condition of the refractory period and amplitude, false and missed detections are carried out to improve the positioning accuracy of the R wave peak. Figure 2 shows the marking results of the R wave of the No. 45 individual ECG signal in the PTB database.
If the current j th R wave peak is marked as R _ p o s j , then the left boundary point of each fragment unit in signals is R _ p o s j 1 , and the right boundary point is R _ p o s j + 1 . That is, the ECG signal wave within the previous R wave peak to the next R wave of the current QRS complex is used as a fragment unit. As can be seen from Figure 3, this method of signal segmentation can not only preserve all QRS complex containing key individual information but also obtain the fragment unit signals with similar information. However, the different sampling frequencies among databases make the length of segmented data inconsistent so that it is difficult to carry out subsequent unified identification. Therefore, the paper proposes an elementary fusion of the time-frequency domain feature extraction algorithm to obtain the combined feature with the same dimension for the mixed data set.

2.3. Elementary Fusion Feature Extraction

Analyzing the analytic signal of the above segmented ECG signal sequence, the imaginary part is taken as the Hilbert transform feature. Compared with the original signal, the transformation is the feature sequence with a phase shift of π / 2 . At this time, the lengths of Hilbert transform features are not the same. Hence, resampling operation is used to unify them in the next step. And the length of resampled feature F e a t u r e H is set to appropriate 600 sampling points based on the sampling frequencies of three databases. At the same time, the segmented ECG signal is introduced from time to frequency domain, and the power spectrum feature of fragments are acquired for analysis. The power spectrum lengths of segmented signals are the same after computing and 500 sampling points are selected as the final power spectrum feature F e a t u r e P . The feature vectors came from different time-frequency representation are merged, the combined feature is in the form of F e a t u r e E l e m e n t a r y F u s i o n = [ F e a t u r e H , F e a t u r e P ] . According to the above steps, fusion features with the same length can be extracted from the fragmented signals with different lengths, which is convenient for subsequent effective recognition. Through the step of feature normalization to generate the value of features within [−1, 1], an elementary fusion feature is obtained that is easy to be subsequent processing. The function of normalization is to prevent data to overflow during iterations. The following is a specific introduction of the principles of two feature extraction algorithms.

2.3.1. Hilbert Transform Feature

For nonstationary ECG signals, the frequency characteristics will change over time. To get such time-varying characteristics, the Hilbert transform of signals is implemented for time-frequency analysis. For the real valued function f ( t ) , the Hilbert transform is f ^ ( t ) , defined as the convolution of f ( t ) and 1 / π t .
f ^ ( t ) = H [ f ( t ) ] = + f ( t ) π ( t τ ) d τ = f ( t ) 1 π t
Hilbert transform can be regarded as passing the original signal through a filter or time-invariant system, and the impulse response of system is h ( t ) = 1 / π t .
Using the special characteristic of convolution that the convolution Fourier transform of two functions is equal to the product of two Fourier transforms. Set F ( f ( t ) ) as the Fourier transform of signals f ( t ) and H ( f ( t ) ) is the result of a Hilbert transform of signals, then:
F ( H ( f ( t ) ) ) = F ( 1 π t f ( t ) ) = F ( ω ) [ j sgn ( ω ) ]
where sgn ( ω ) = { 1 , ω > 0 1 , ω < 0 is sign function. Therefore, the frequency-domain representation of the Hilbert transform feature is obtained:
F ( f ^ ( t ) ) = { j F ( ω ) , ω > 0 j F ( ω ) , ω < 0
so in terms of the frequency spectrum, the filter multiplies the positive frequency part of the original signal by j . In other words, the phase is shifted π / 2 while keeping the amplitude invariant, and the negative frequency part is shifted π / 2 .
Therefore, the Hilbert transform corresponds to a phase shift converter. For the time domain signal, it can be regarded as a projection of a signal in the complex field onto the real field. The Hilbert transform for time-domain signals is not only the process of transforming the real signal into the analytic signal, but also transforming one-dimensional signals into two-dimensional complex plane signals.

2.3.2. Power Spectrum Feature

The power spectrum of ECG signals can reflect the dynamic characteristics of the heart, so this feature can be used as an approach for quantitative analysis of ECG signals to realize personal identification research. The estimation of the power spectrum is the process of converting the time-domain signal to the frequency-domain [33] and also transforming the relationship between amplitude and time in ECG signals to energy and frequency. The classical power spectrum estimation adopts the correlation function method, firstly autocorrelation function R ( m ) is estimated from the segmented signal x N ( n ) :
R ( m ) = 1 N n = 0 N 1 x N ( n ) x N ( n m ) , | m | N 1
Fourier transform is performed on autocorrelation function R ( m ) , and power spectrum estimation of x N ( n ) is obtained according to Equation (5), which is denoted as P ( ω ) :
P ( ω ) = m = M M R ( m ) e j ω m
thus, the power spectrum feature is the signal value after frequency-domain transformation, which is represented as the distribution of signal power with frequency changing in frequency band unit. According to the Nyquist sampling theorem, the highest frequency component of signal does not exceed half of the sampling frequency, the highest frequencies corresponding to three databases with different sampling frequencies are different. When selecting the same 500 data points to be F e a t u r e P , the frequency resolutions are different. The power spectrum curves of the three databases are shown in Figure 4. The curve of Figure 4c is close to the axis, which is not easy to see.
After calculation, the frequency range corresponding to 500 points is within [0-vertical line] in Figure 4. The frequency corresponding to the 500th data point in the MIT-BIH database is about 22 Hz, the frequency of the ECG-ID database is about 31 Hz and the frequency of the PTB database is about 61 Hz. The ECG signal studied in this paper belongs to the weak electrical signal of the body surface. Generally, the spectrum range of ECG signal is 0.05–100 Hz, 90% frequency energy concentrates in 0.5–45 Hz. The energy peak of the QRS complex is about 10–20 Hz. Therefore, the frequency range (0–22 Hz, 0–31 Hz, 0–61 Hz) selected in this paper almost covers the QRS complex in three databases. Moreover, it can be seen from Figure 4 that the energy of 500 data points is large and concentrated, the energy amplitudes of other frequency ranges are relatively weak, so they are omitted.
Although the spectrum ranges corresponding to 500 data points are not completely consistent, these ranges of all three databases can cover the QRS complex which is really important for identification. Thus, this feature plays a positive role in the subsequent PCANet deep learning. Through many experiments, the recognition performance is better when 500 values are selected empirically. The power spectrum feature of three different individuals and three ECG fragments of the same individual in the ECG-ID database are shown in Figure 5.
From the comparison of spectral estimation curves in Figure 5, it can be observed that the amplitude of the power spectrum varies with the change of frequency among different individuals. The trends of the curves for the same individual are similar which verifies the fact that the power spectrum feature has characteristic information that can distinguish individuals. The normalized frequency of the X-axis is the frequency divided by the sampling frequency of the signal.

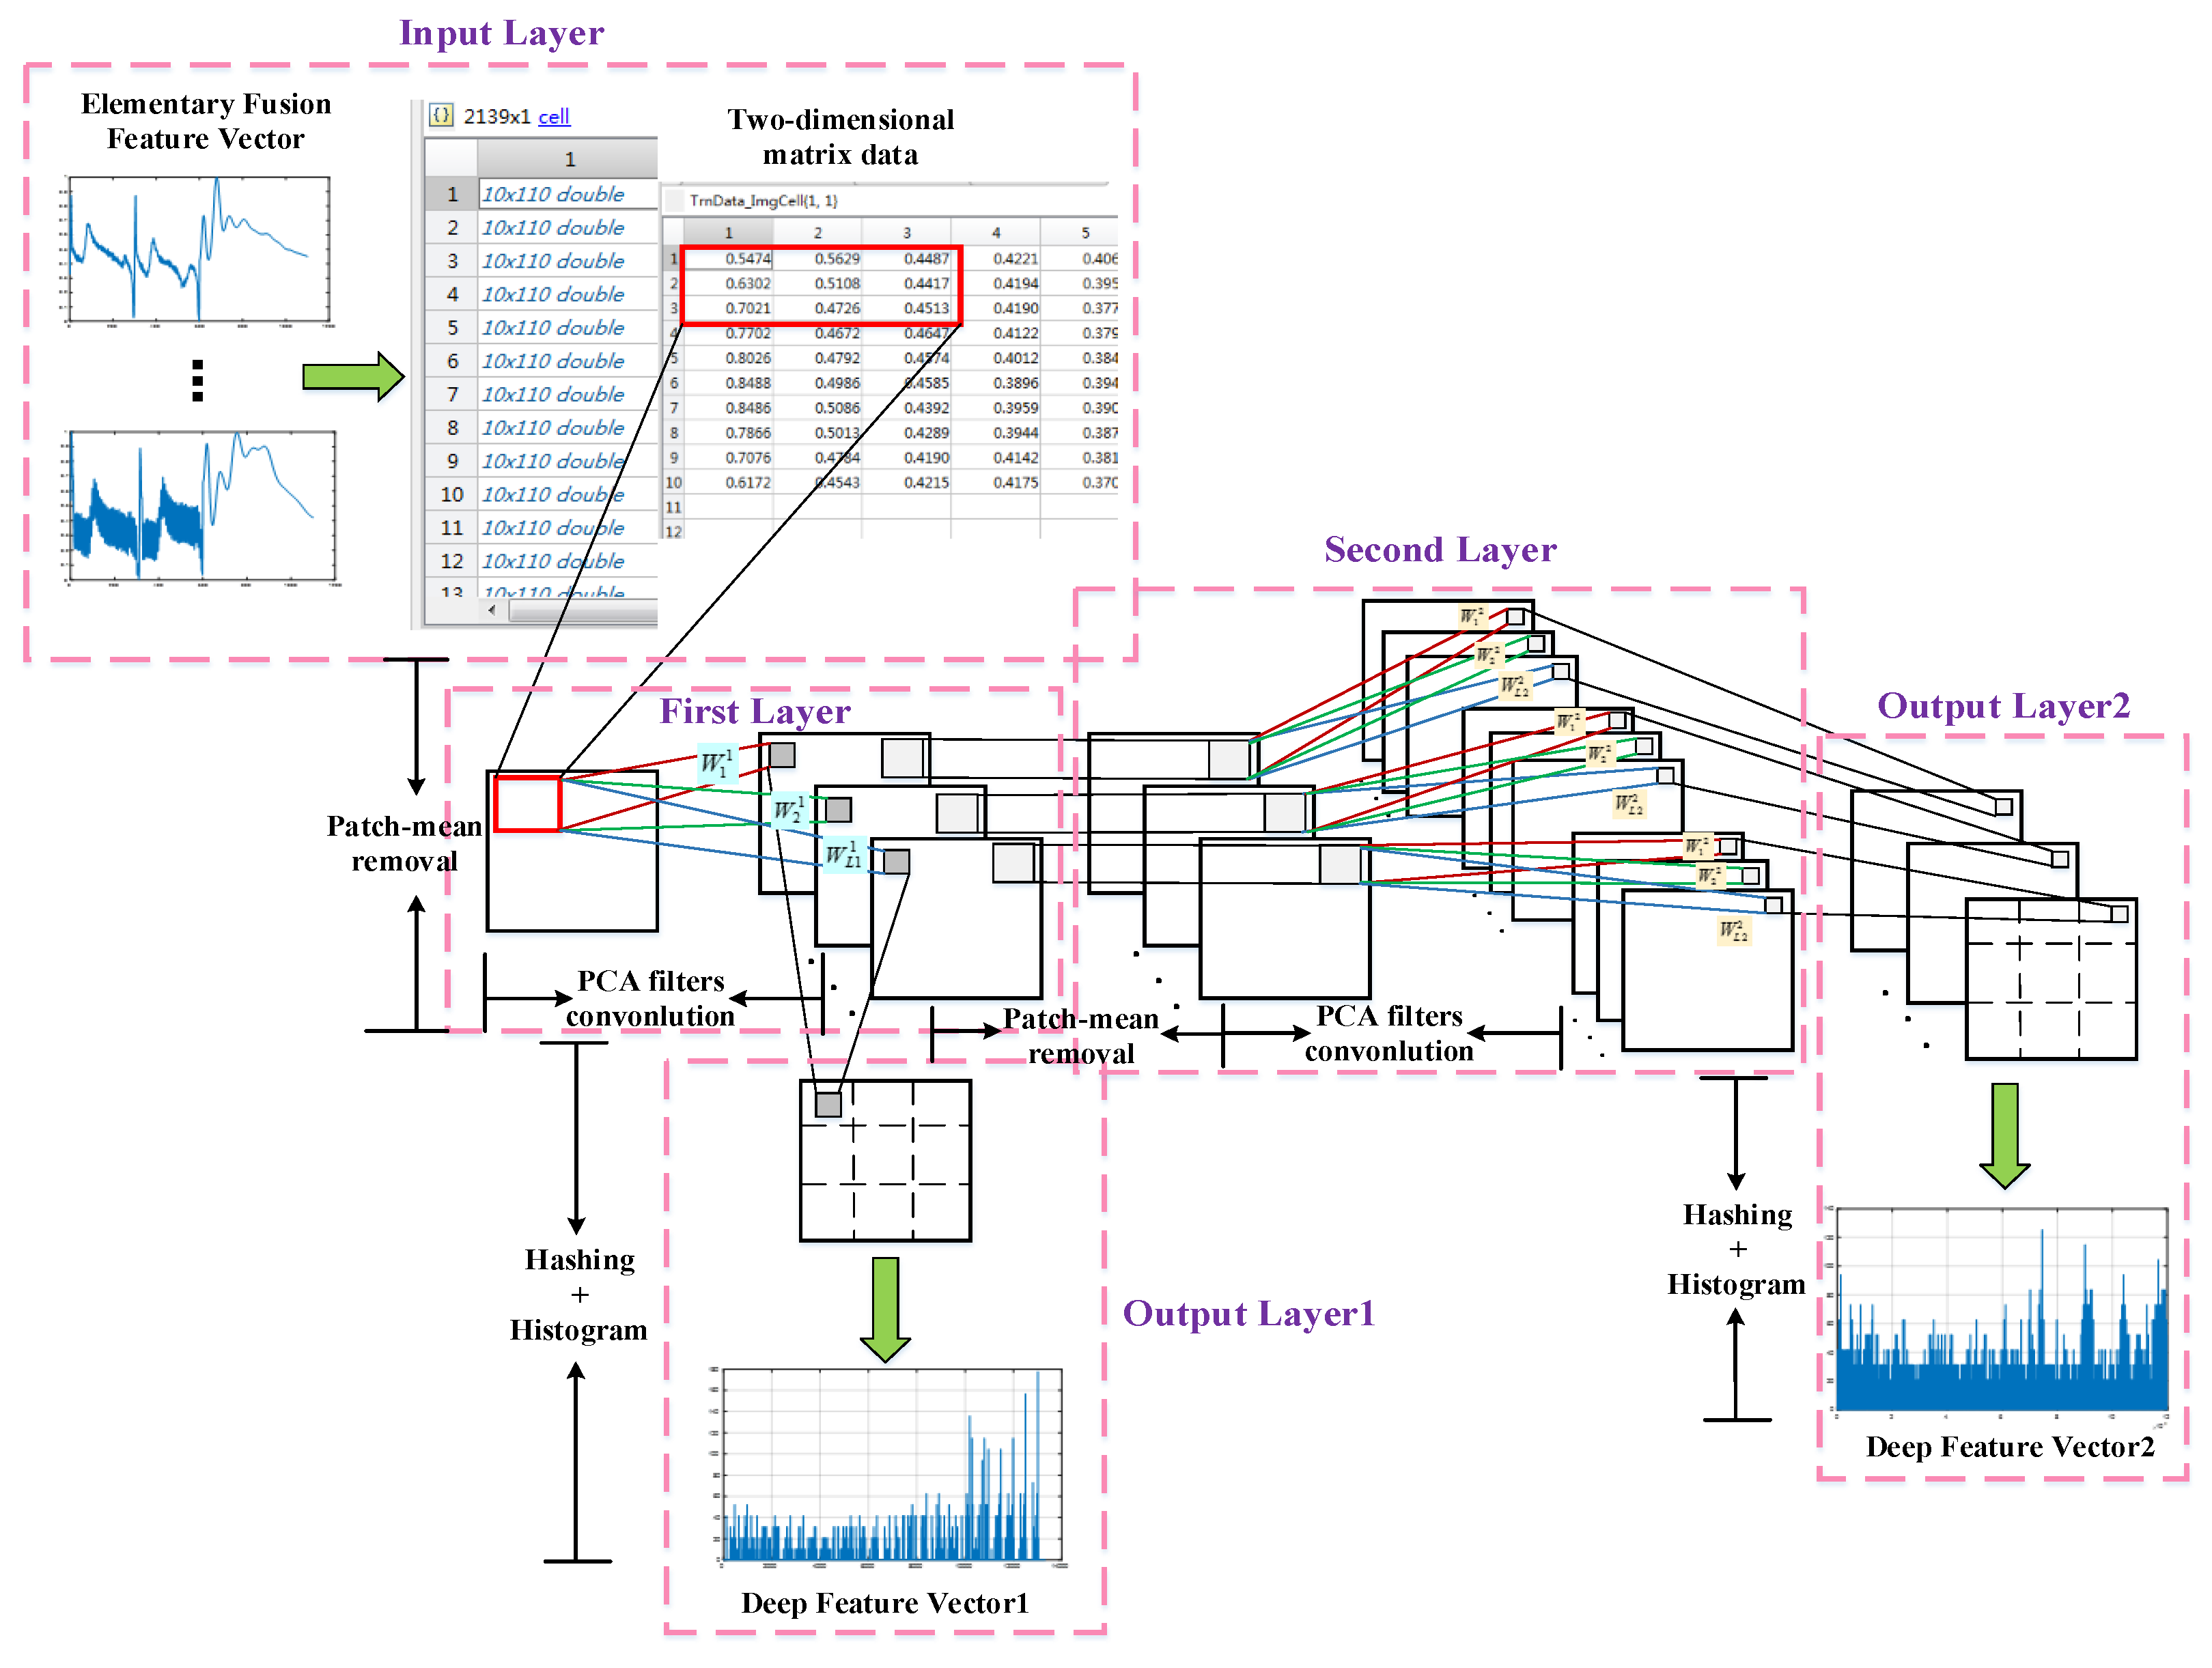
2.4. PCANet Deep Fusion Feature Extraction

2.4.1. PCANet

As a deep learning model of a simplified CNN network [34] based on the convolution concept, PCANet has made great achievements in the field of image recognition [35]. Its training process and network structure are simple, and the recognition result of the learning feature is stable. Therefore, PCANet has been widely used in the analysis of one-dimensional physiological signals, which converts into two-dimensional images in recent years [36]. Due to the limitation of the manual feature extraction, the algorithm in the paper uses the PCANet model to mine multi-layer information from the above elementary fusion time-frequency domain feature and obtain deeper individual discriminative features of ECG signals. The model structure of the two layers PCANet adopted in the paper is shown in Figure 6.
  • Input Layer
Firstly, the elementary fusion feature I E = [ I 1 , I 2 , , I N ] obtained in Section 2.3 are folded into two-dimensional matrix data in the input layer for the subsequent PCANet learning. Among them, each one-dimensional elementary fusion feature vector is I i = [ i 1 , i 2 , , i m n ] , then its specific folding process of each input is as follows:
[ i 1 , i 2 , , i m n ] = [ i 1 i 2 i n i n + 1 i n + 2 i 2 n i ( m 1 ) n + 1 i ( m 1 ) n + 2 i m n ]
2.
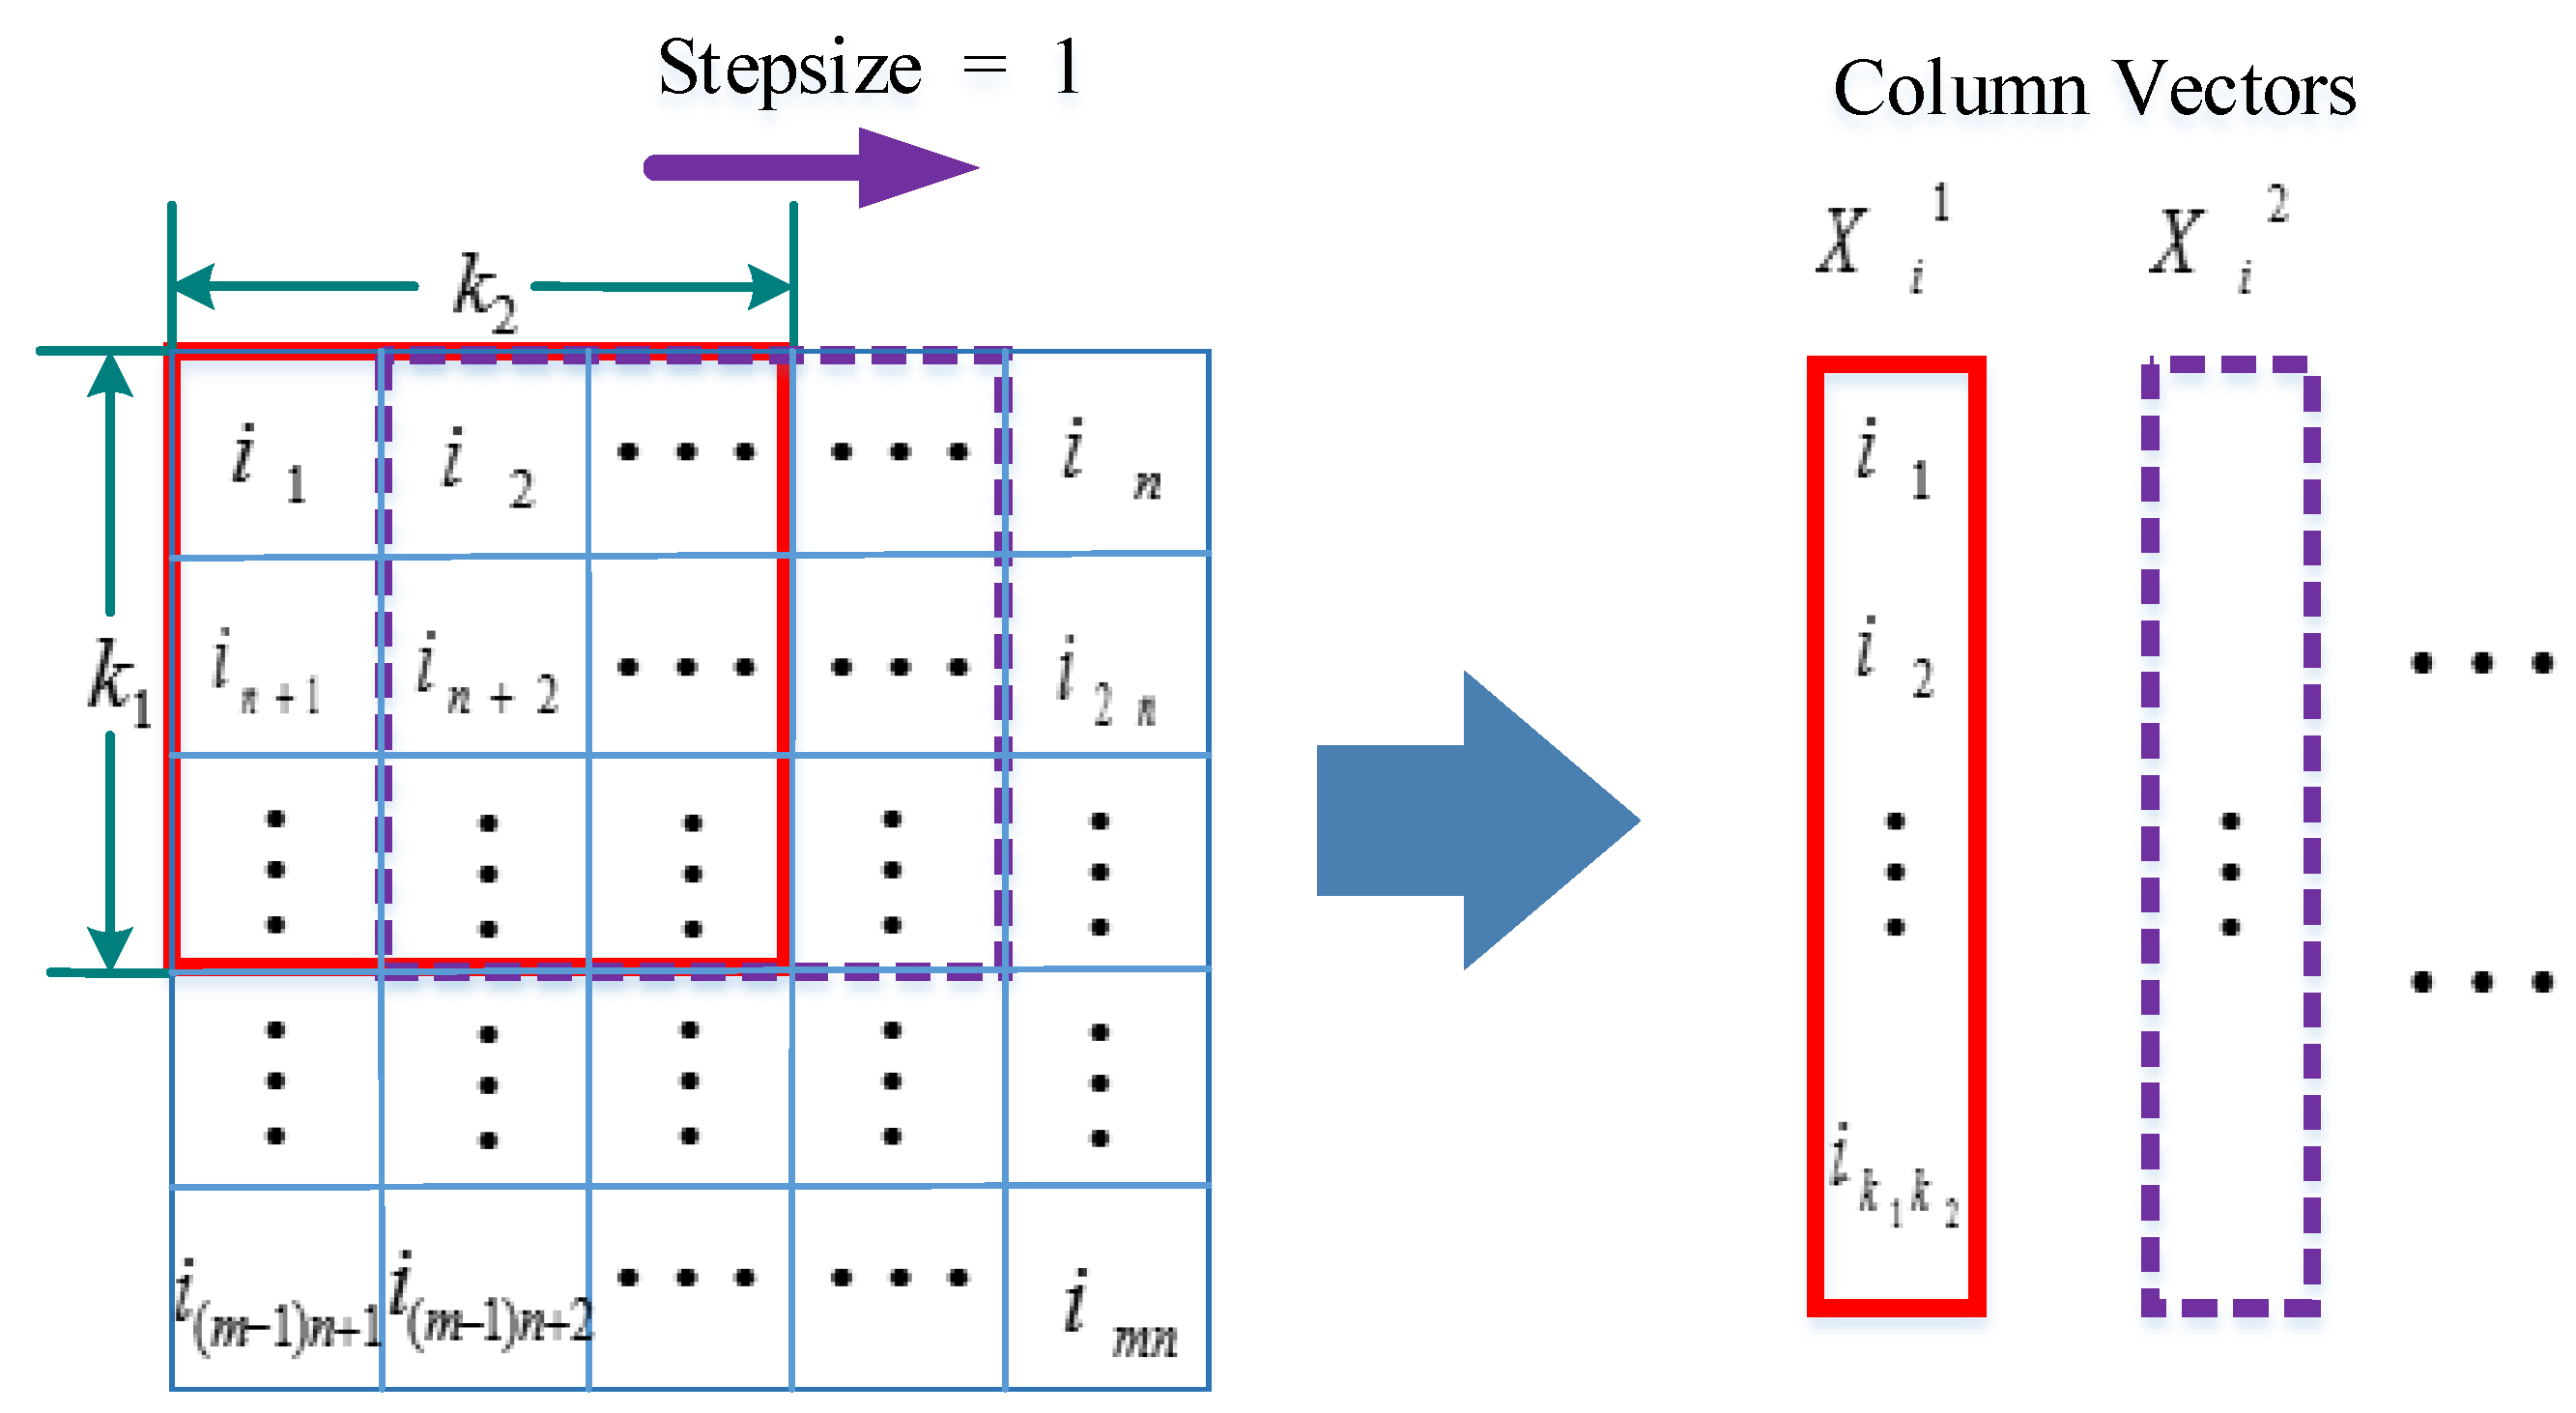
First Convolutional Layer
In the first layer, the size k 1 × k 2 of the sliding window is used to select some local features of signals X i 1 , X i 2 , , X i ( m k 1 / 2 ) ( n k 2 / 2 ) , i = 1 , 2 , , N with each element as the center and the fixed stepsize of 1. The specific mechanism of the sliding window is shown in Figure 7.
After sliding, reshape each of the window blocks of the i th ECG matrix into column vectors and concatenated to a model. Each column vector represents a local expansion feature that contains k 1 k 2 elements. Then subtracting the matrices-mean from each matrix corresponding to the input elementary feature. Let all mean removal vectors X ¯ i = [ X ¯ i 1 , X ¯ i 2 , , X ¯ i λ , , X ¯ i ( m k 1 / 2 ) ( n k 2 / 2 ) ] , i = 1 , 2 , , N be spliced, the new feature expression of vectorization is as follows:
X = [ X ¯ 1 , X ¯ 2 , , X ¯ N ]
there are N ( m k 1 / 2 ) ( n k 2 / 2 ) column vectors totally. A principal component analysis is carried out on the matrix of the window vector X , and the first L 1 feature vectors are taken as the convolution kernel of the first convolution layer.
F l 1 = m a t k 1 , k 2 ( q l ( X X T ) ) , l = 1 , 2 , , L 1
where m a t k 1 , k 2 ( ) reconstructs each eigenvector into the matrix F l 1 , called the convolution filter. q l ( ) extracts the l th principal eigenvector of XXT. The eigenvectors of the largest L 1 eigenvalues mapping in the covariance matrix are regarded as the convolution kernel. The eigenvectors I i of each input are implemented convolution with L 1 convolution kernels respectively to get the PCANet feature of the first layer.
I i l = I i F l 1 , i = 1 , 2 , , N
Equation (9) is the output of the l th convolution filter, where represents the convolution and I i l is the first-layer feature matrices. Therefore, for each ECG feature sample I i , there are L 1 convolution outputs in the first layer, which is executed N times for the total sample.
3.
Second Convolutional Layer
N L 1 convolution features I i l of the first layer are taken as input signals of the second layer in the PCANet model. Executing the similar algorithm procedure as the first layer to obtain a new window vector matrix Y = [ Y 1 , Y 2 , , Y L 1 ] R k 1 k 2 × L 1 N ( m k 1 / 2 ) ( n k 2 / 2 ) . The eigenvectors corresponding to the first L 2 eigenvalues are taken as the convolution kernel of the second layer structure.
F l 2 = m a t k 1 , k 2 ( q l ( X X T ) ) , l = 1 , 2 , , L 2
in the convolution process of the second layer; L 2 convolution filters are performed convolutions, which are generated from each output matrix of the first layer.
O i l = { I i l F l 2 } l = 1 L 2 , i = 1 , 2 , , N
thus O i l represents the collection of the second-layer ECG features, the second layer of PCANet corresponding to each input sample can output L 1 L 2 eigenmatrices.
4.
Output Layer
For each convolution eigenmatrix of the first and second layer, the Heaviside function H ( ) is used to binarize, where the value is 1 for positive entries and 0 otherwise. The binarized ECG features ζ i l are transformed into a single integer-valued matrix.
T i l = l = 1 L 2 2 l 1 ζ i l
where the value in T i l is in the range [ 0 , 2 L 2 1 ] . Finally, each integer-valued matrix T i l is divided into B blocks, and histogram information of all blocks is calculated. The stepsize of the sliding window k 3 × k 4 for division can set the window overlap ratio υ to adjust. B histogram statistical results are cascaded and transformed into a single vector B h i s t ( T i l ) . After that, the final feature combination has been generated from the input ECG elementary fusion feature I E as follows:
F e a t u r e i = [ B h i s t ( T i 1 ) , , B h i s t ( T i L 1 ) ] T
the model in this paper is to send the first-layer and the second-layer convolution results into the output layer of the network, respectively, which includes Hash coding and distributed histogram statistics. Thus, the deep feature vectors of one and two layers of the PCANet can be obtained.

2.4.2. MaxFusion Algorithm

The above PCANet features of the first and second-layer extracted respectively can be regarded as mining the internal information of elementary fusion features with different depths. Therefore, this paper considers the effective fusion of two layers’ features, to realize the high-order expression of elementary features and obtain more comprehensive feature information for identification. The paper proposes an MF (MaxFusion) algorithm of different layers in PCANet and the specific implementation process is shown in Algorithm 1. The first step is to cascade the two layers of training and testing features respectively and set them as X F t r a i n _ a l l and X F t e s t _ all . However, the way of block vectorization in PCANet greatly increases the extracted feature dimension, which is higher than the input elementary fusion feature dimension. To avoid the high dimensional data of two-layer cascaded features leading to the subsequent individual classification long, the algorithm uses sliding window maximum technology to reduce feature dimensions. The second step is to set the appropriate sliding window size L s l i d i n g w i n d o w . The third step is to find the maximum value x j in the generated sliding window signal X s l i d i n g w i n d o w and set the maximum as the element of the fusion feature, to form the MF fusion feature vector of each signal. Through the effective fusion of key information in two-layer features of the network, the algorithm can ensure identity recognition accuracy and improve the efficiency of identification.
Algorithm 1. MaxFusion algorithm procedure of two layers PCANet features
Input:  X = [ X 1 , X 2 , , X N ]
Trainset samples: X F r a i n 1 (The first layer feature of PCANet);
X F r a i n 2 (The second layer feature of PCANet);
Testset samples: X T e s t 1 ; X T e s t 2
Output: MF Fusion feature: X F t r a i n _ f u s i o n ; X F t e s t _ f u s i o n
do Cascade two layers of training and testing features X F t r a i n _ a l l ; X F t e s t _ all
Set sliding window size L s l i d i n g w i n d o w
for i = 1 to N t r a i n or N t e s t
for j = 1 to N s l i d i n g w i n d o w
do Generate the window signal X s l i d i n g w i n d o w
Find the maximum value of window signal x j = max ( X s l i d i n g w i n d o w )
Form the new single feature [ x 1 , , x j , , x N s l i d i n g w i n d o w ]
end for
Form the new MF fusion data set X F t r a i n _ f u s i o n ; X F t e s t _ f u s i o n
end for
Aiming at the high-dimensional and deep abstract feature of the PCANet, the algorithm combines feature vectors of the first and second layer and finds the maximum value of local signals through the sliding window. The dimension of the fusion feature is set according to the number of windows, then the maximum value of multiple windows are adopted to form a new fusion feature for a single sample. At last, all fusion features are cascaded as input for the classifier to realize efficient identification. The main point of the MF algorithm is based on the sparse characteristic of the PCANet feature, the feature dimension of the second layer is more than one hundred thousand with many zero elements. So the method of computing larger amplitude in statistical characteristics can eliminate a large number of redundant features, and it is suitable for processing these abstract and non-physiological features of PCANet. In this algorithm, there is no overlap between windows in the sliding process, and the overlap ratio is set to 0.

2.5. Classifier

As the classical algorithm of the supervised learning model, the main idea of the support vector machine is to find the hyperplane farthest from all kinds of sample points, which is called the maximum margin hyperplane. SVM utilizes kernel function to map data to high-dimensional space and transform it into linear separable data, to achieve a better classification effect. The linear kernel function is mainly used to deal with the problem of linear separability, which is suitable for the classification of high-dimensional and sparse data. The fusion feature of two layers PCANet extracted in the paper has such properties. So linear kernel SVM is selected to classify the above deep fusion features and the classification result of each fusion feature is labeled. According to the classification label statistics of all features in one individual, the category label of each complete ECG signal is judged and determined by voting.

3. Results

3.1. Database

To verify feasibility and generalization performance of the proposed ECG two-level fusion feature identification system, the simulation experiments are respectively carried out on the ECG-ID Database, MIT-BIH Arrhythmia Database, PTB Diagnostic ECG Database and these three mixed dataset, which all come from the PhysioNet physiological signals website.
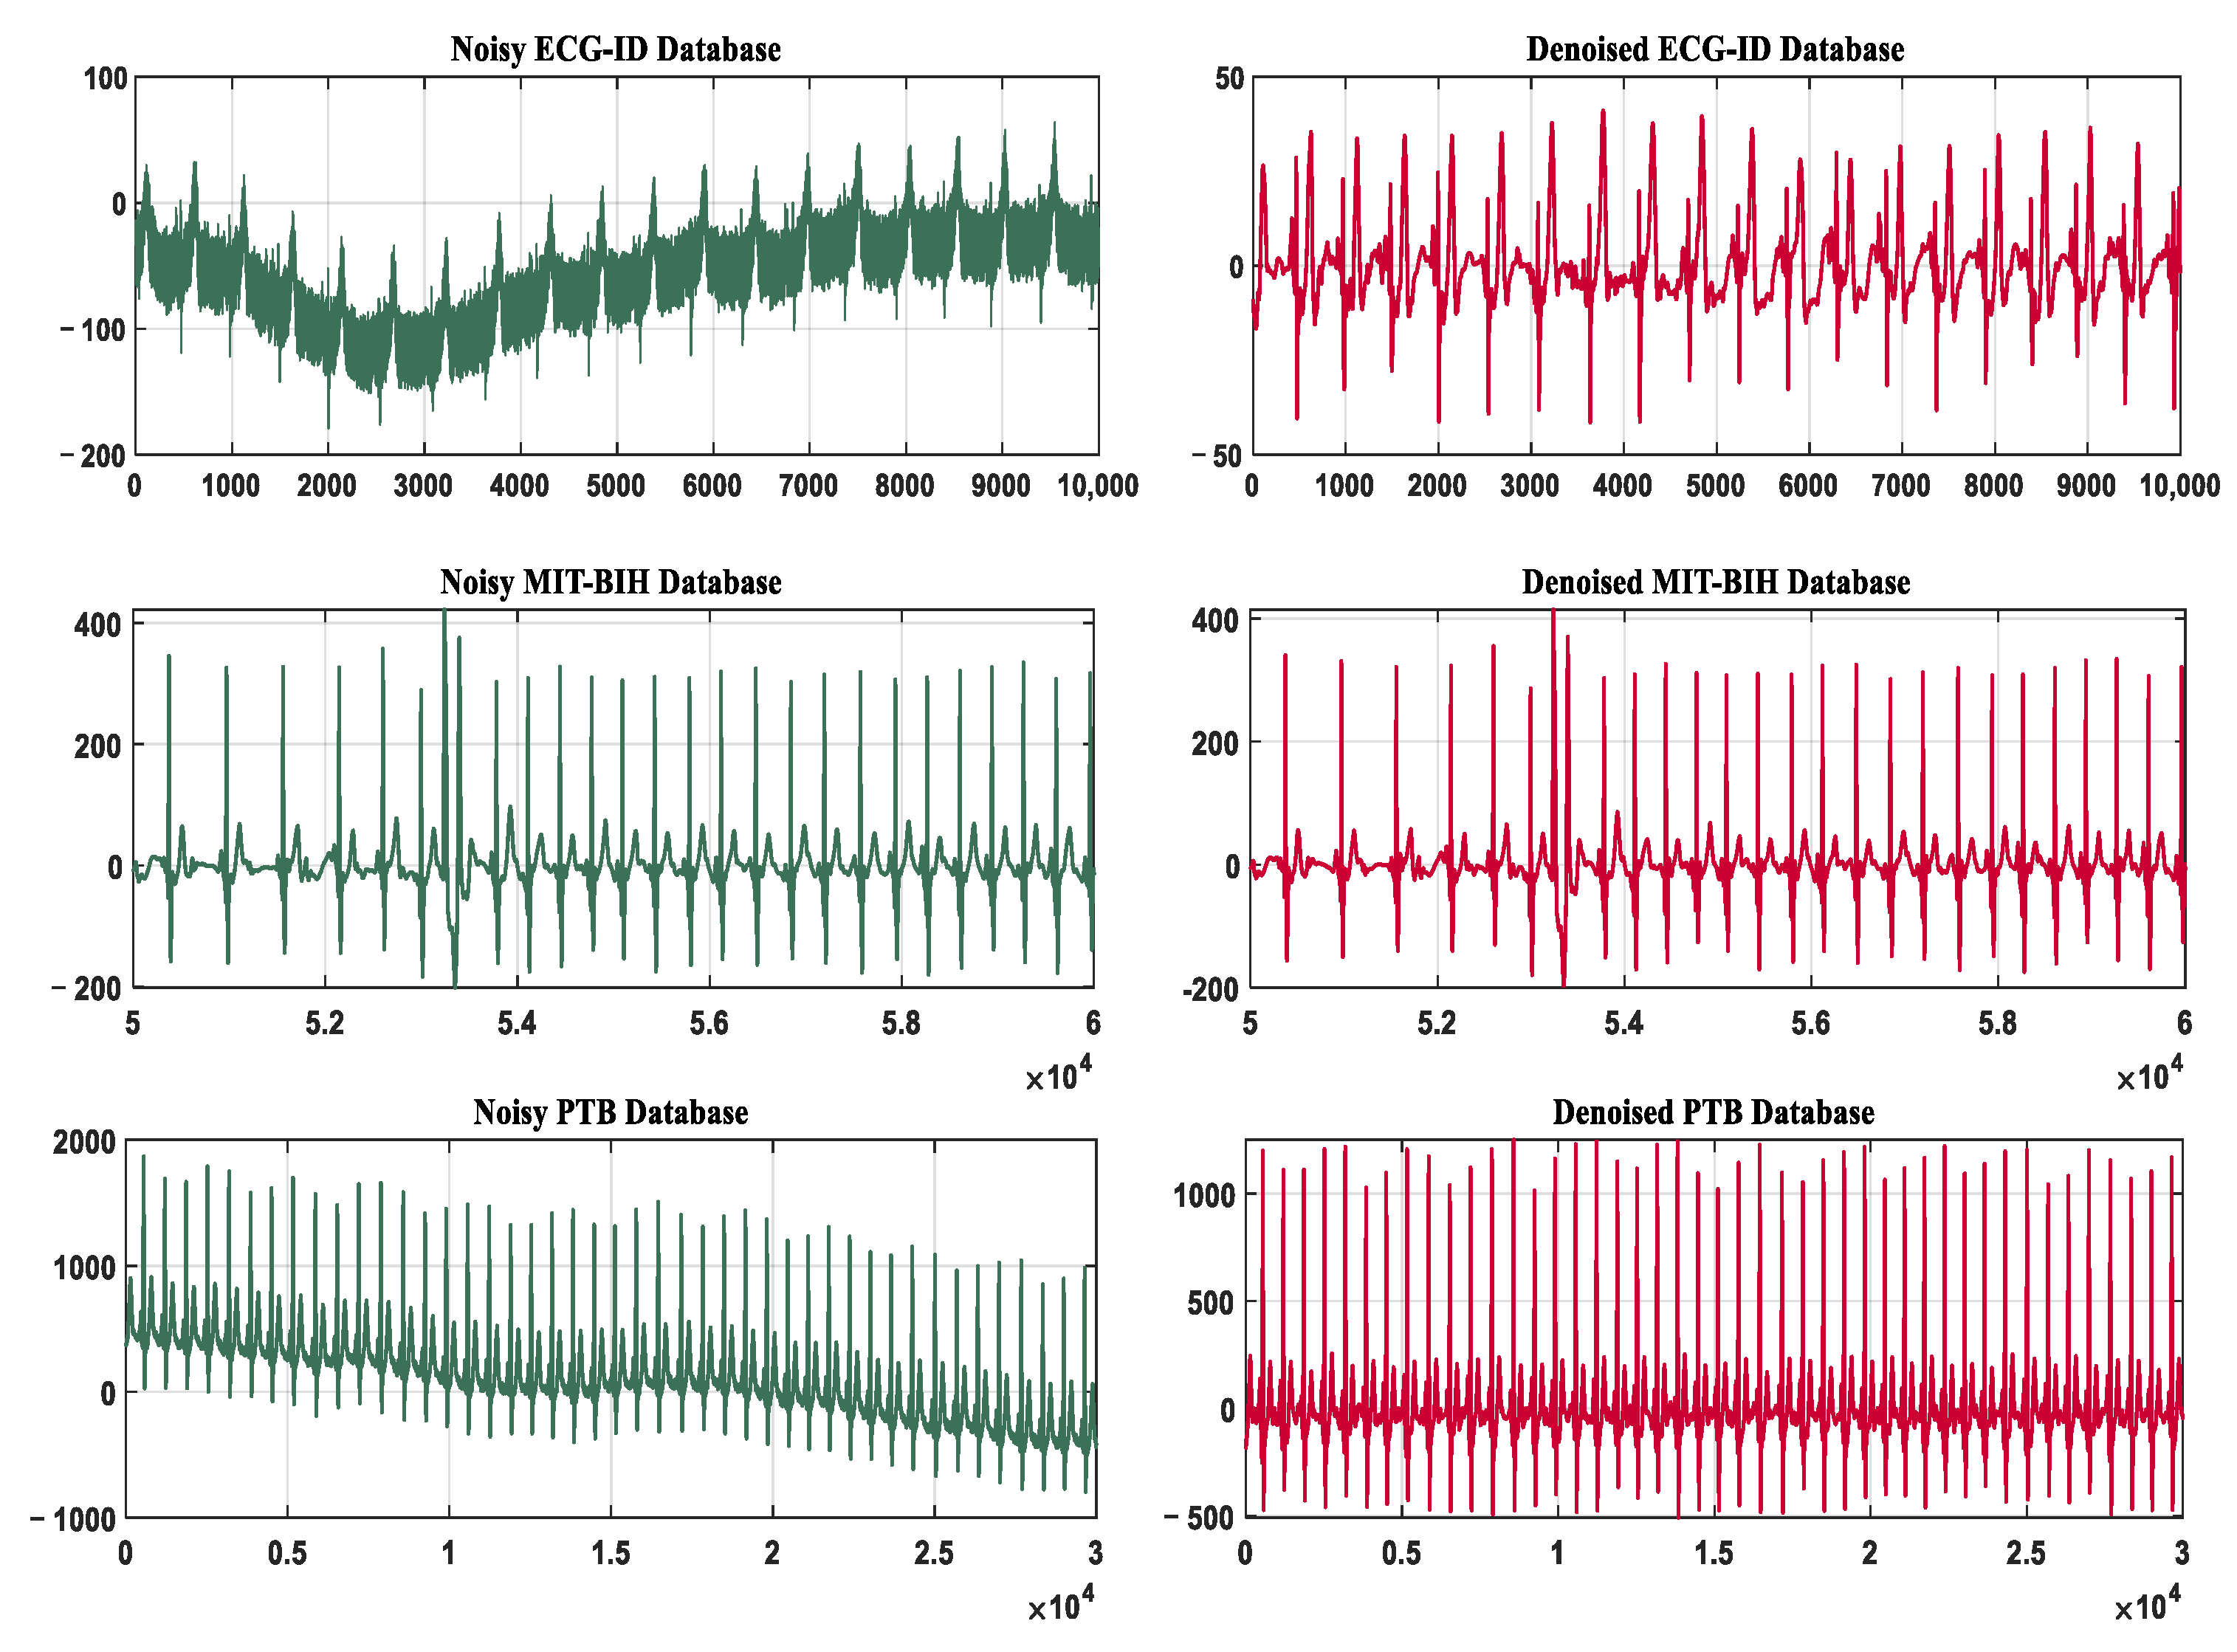
  • ECG ID Database: 310 ECG recordings are collected in the ECG ID database, which comes from 90 healthy individuals. Each signal is recorded 20 s, the sampling frequency is 500 Hz. In the experiment, two data of each person are randomly selected as training and testing set, while the 47th individual is eliminated as only containing one recording of ECG signals. So the remaining 89 individuals are used as study subjects in all ECG-ID database experiments;
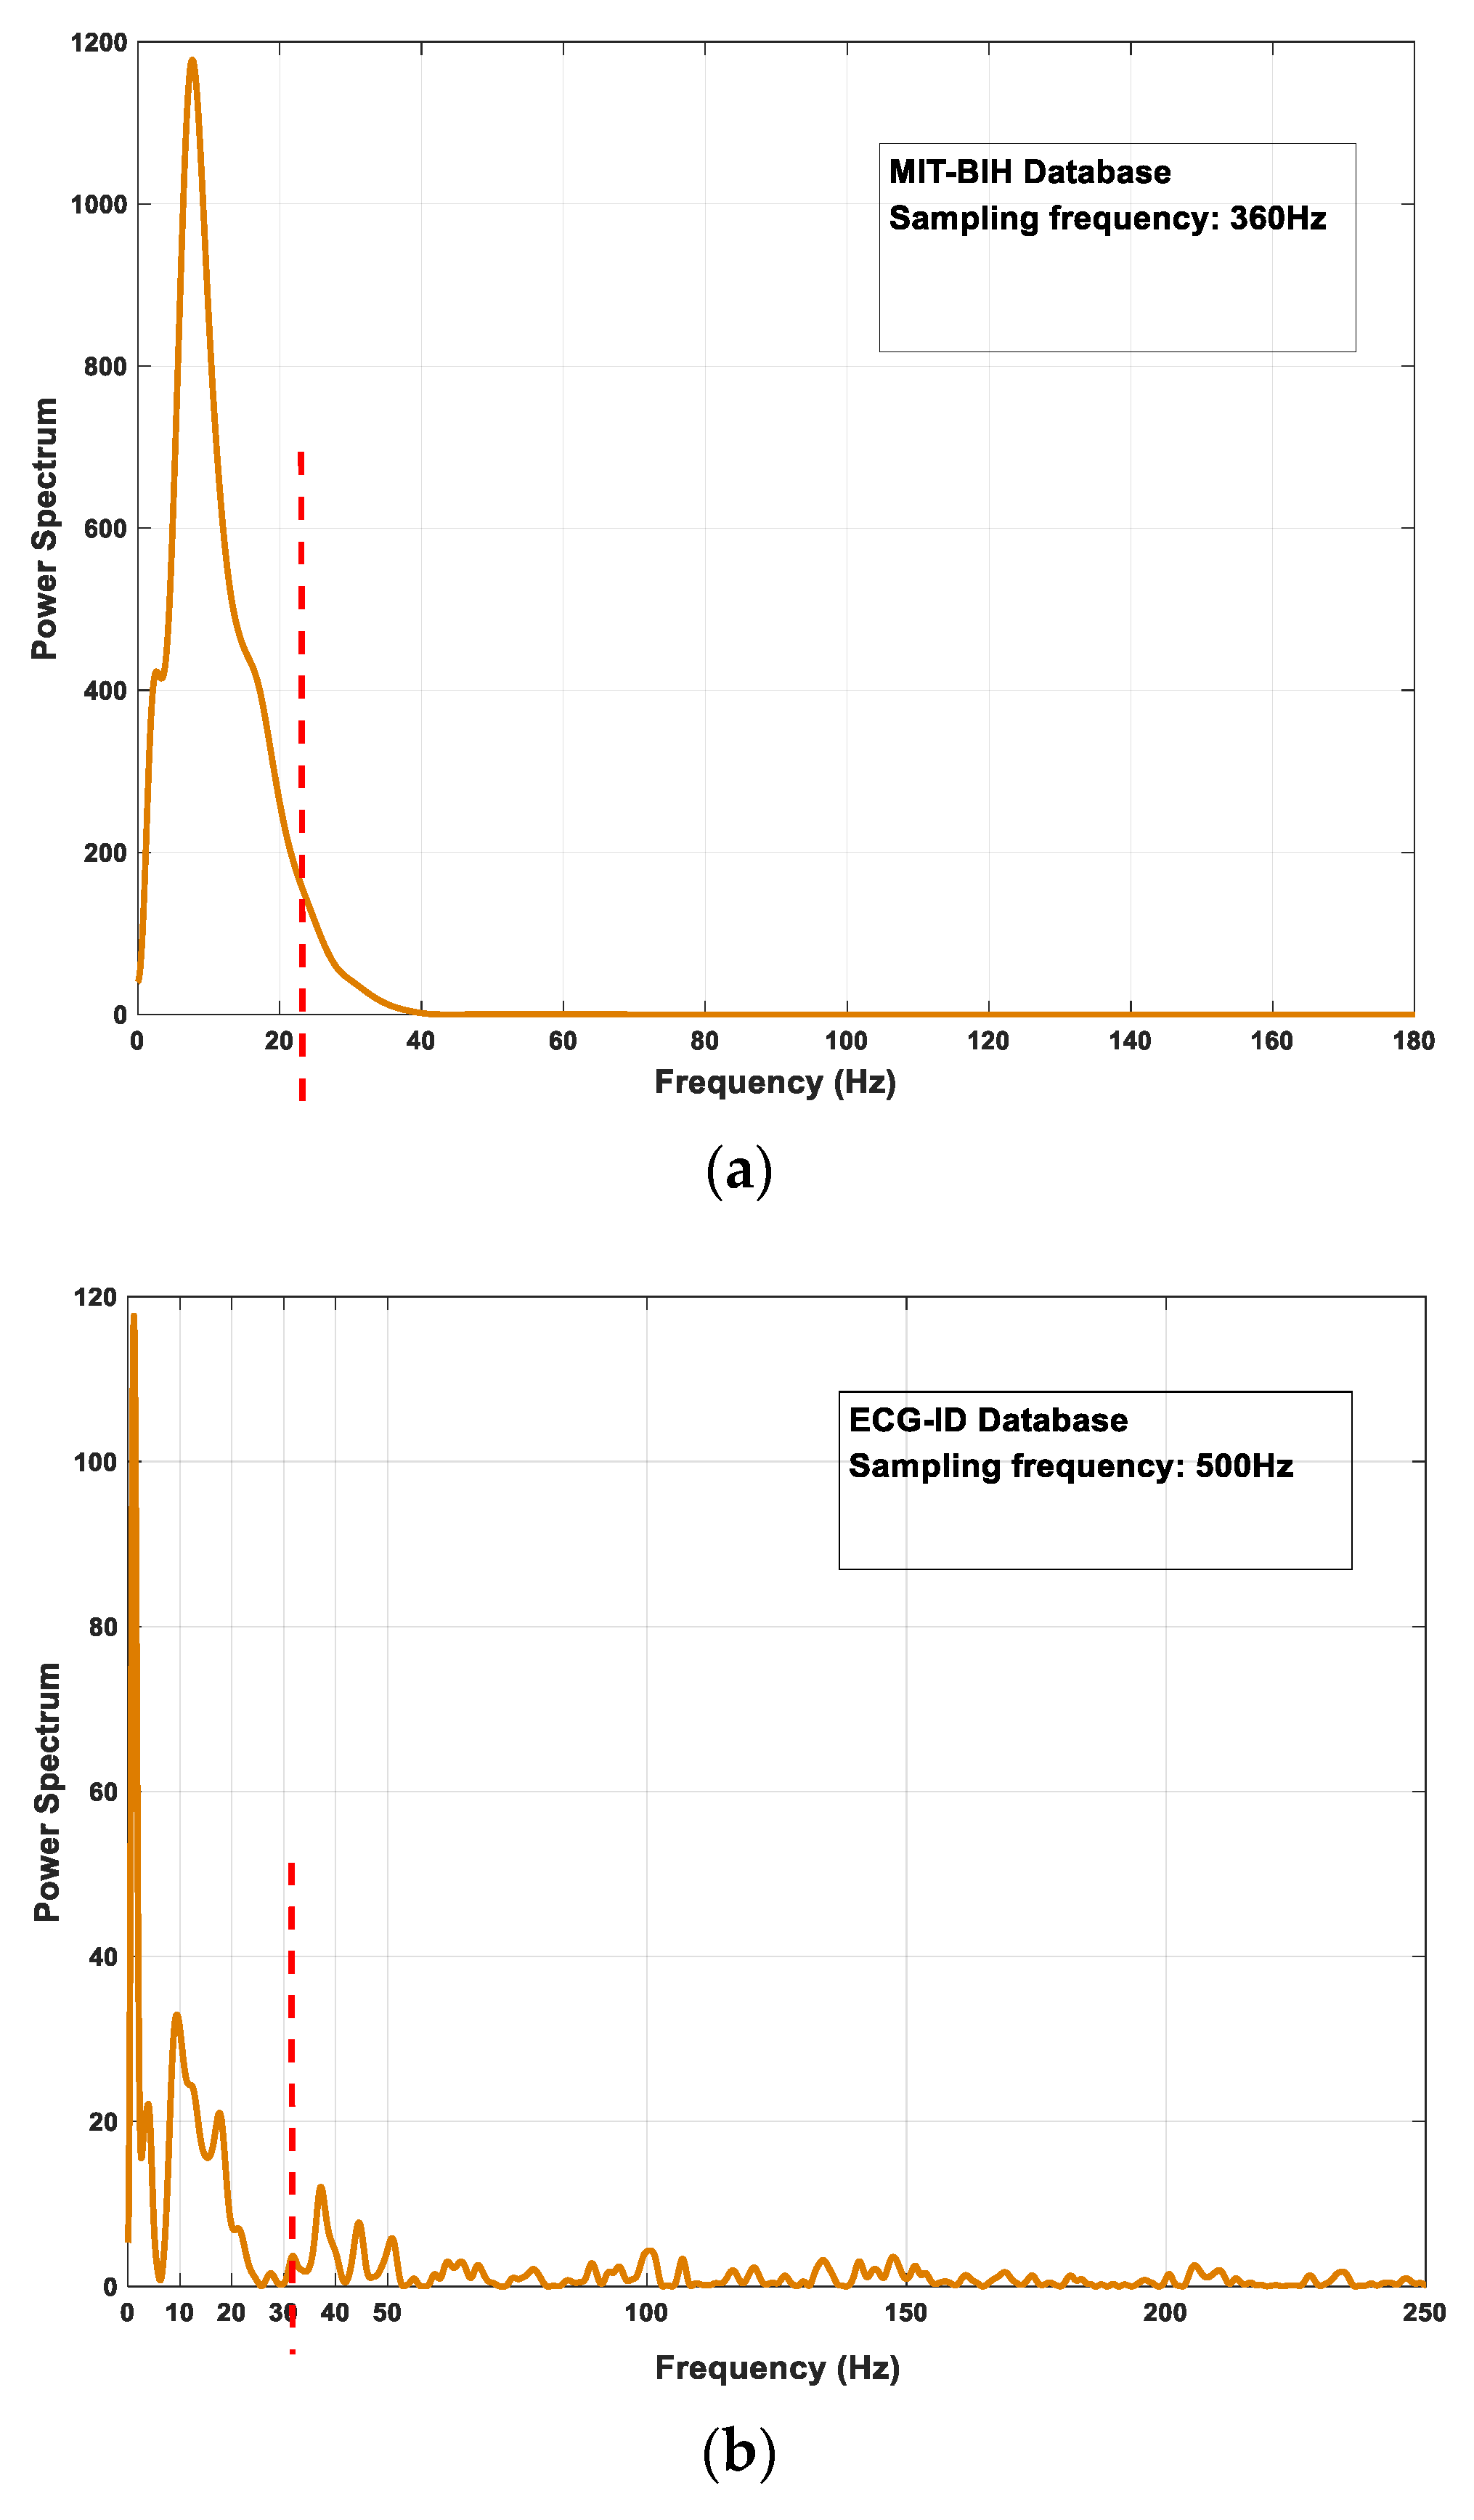
  • MIT-BIH Arrhythmia Database: There are 48 ambulatory ECG signals with two-channel in the MIT-BIH arrhythmia database, among them, labels 201 and 202 come from the same subject. So the database records ECG data for 47 individuals with various arrhythmia diseases. Each signal lasts 30 min and the sampling frequency is 360 Hz. This database is used as abnormal ECG signals to test the proposed model;
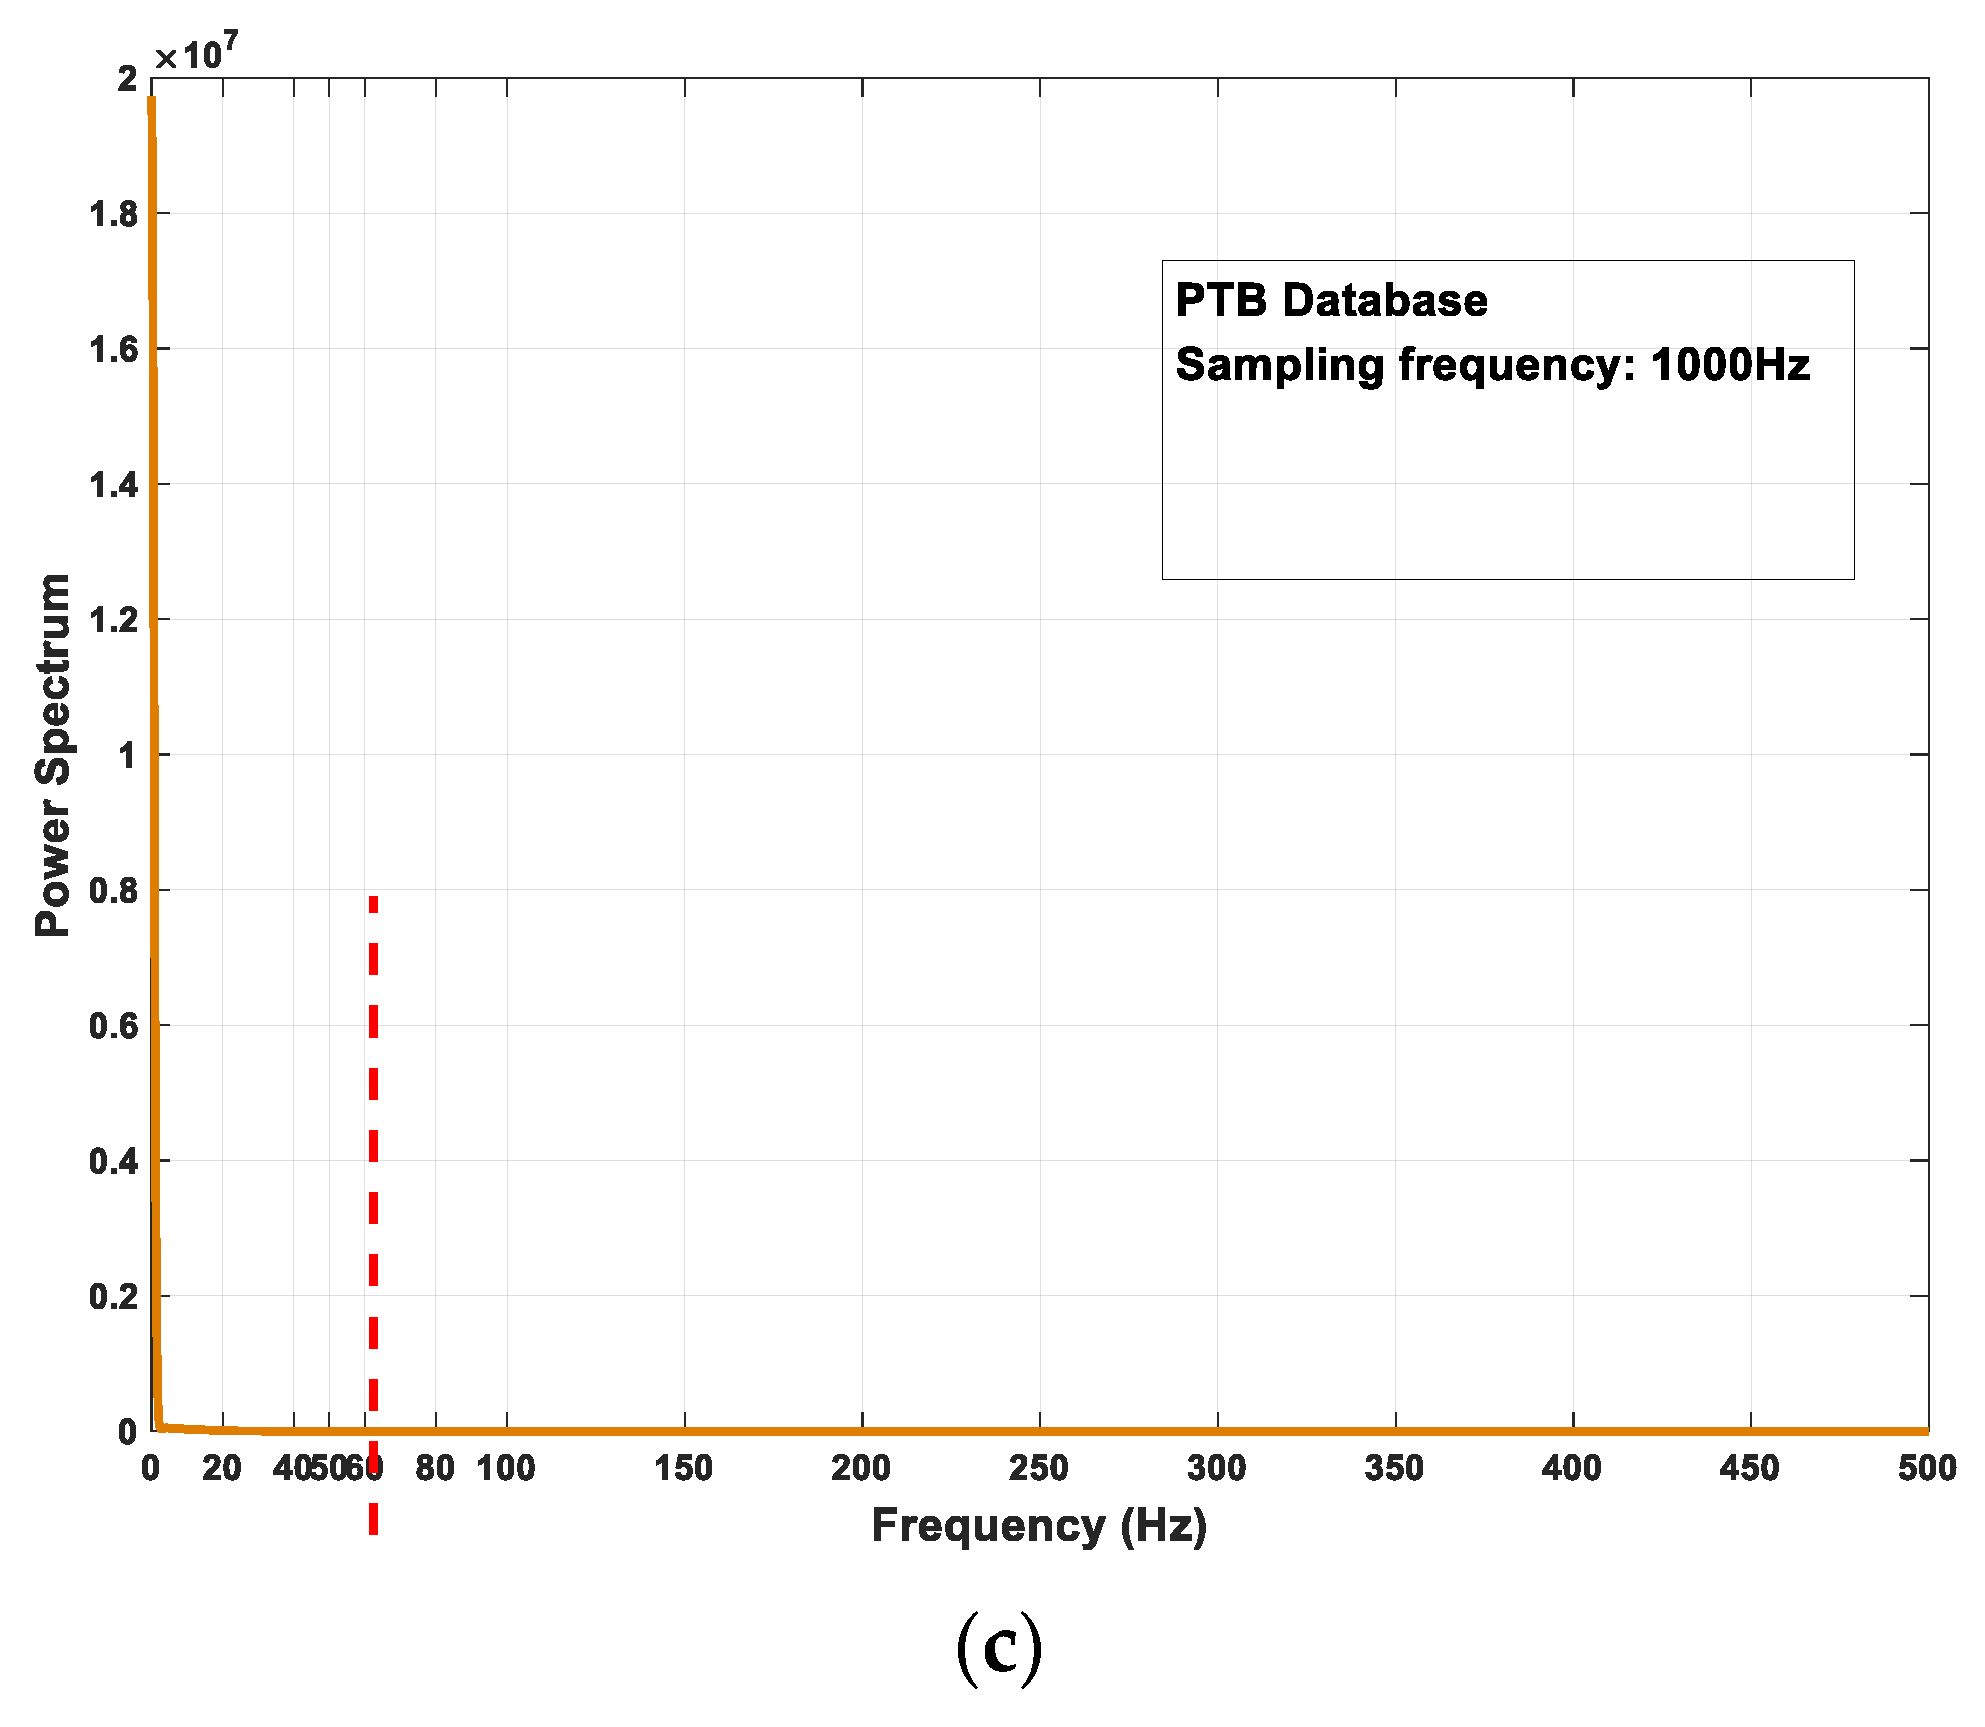
  • PTB Diagnostic ECG Database: It is composed of 549 data recordings for 290 subjects, 52 of which are healthy, and the sampling frequency is 1000 Hz. In the experiment, a total of 290 individuals of the same day signals are selected to detect model recognition ability of ECG signals with obvious baseline drift noise;
  • The Mixed Data Set: The mixed three databases with different sampling frequencies contains 426 individuals which are applied to identify. The experiment chooses such a merged database to prove the feasibility of the model when the number of individuals increases and test generalization ability for ECG signals under different acquisition conditions.

3.2. Experimental Setting

All experiments of the built ECG identification model of two-level fusion feature are implemented on MATLAB 2019a. The experiments are simulated on the computer equipped with Windows 7 system and Intel Core i5-6500 CPU. The PCANet structure and parameter settings of each layer constructed in the paper are shown in Table 1.

3.3. Experimental Results

In the task of identity recognition, the extracted features are the basic units of the classifier and individual recognition is the final goal. Therefore, the experiments in this paper compute the accuracy of feature classification and identity recognition respectively as the main evaluation indicators of algorithm performance. Among them, feature classification accuracy refers to the recognition result of a single feature, which is the proposed two-level fusion features; the identity recognition accuracy are the statistical voting results of all features’ labels in each individual. The following five groups of comparative experimental studies are carried out by taking the above indexes.

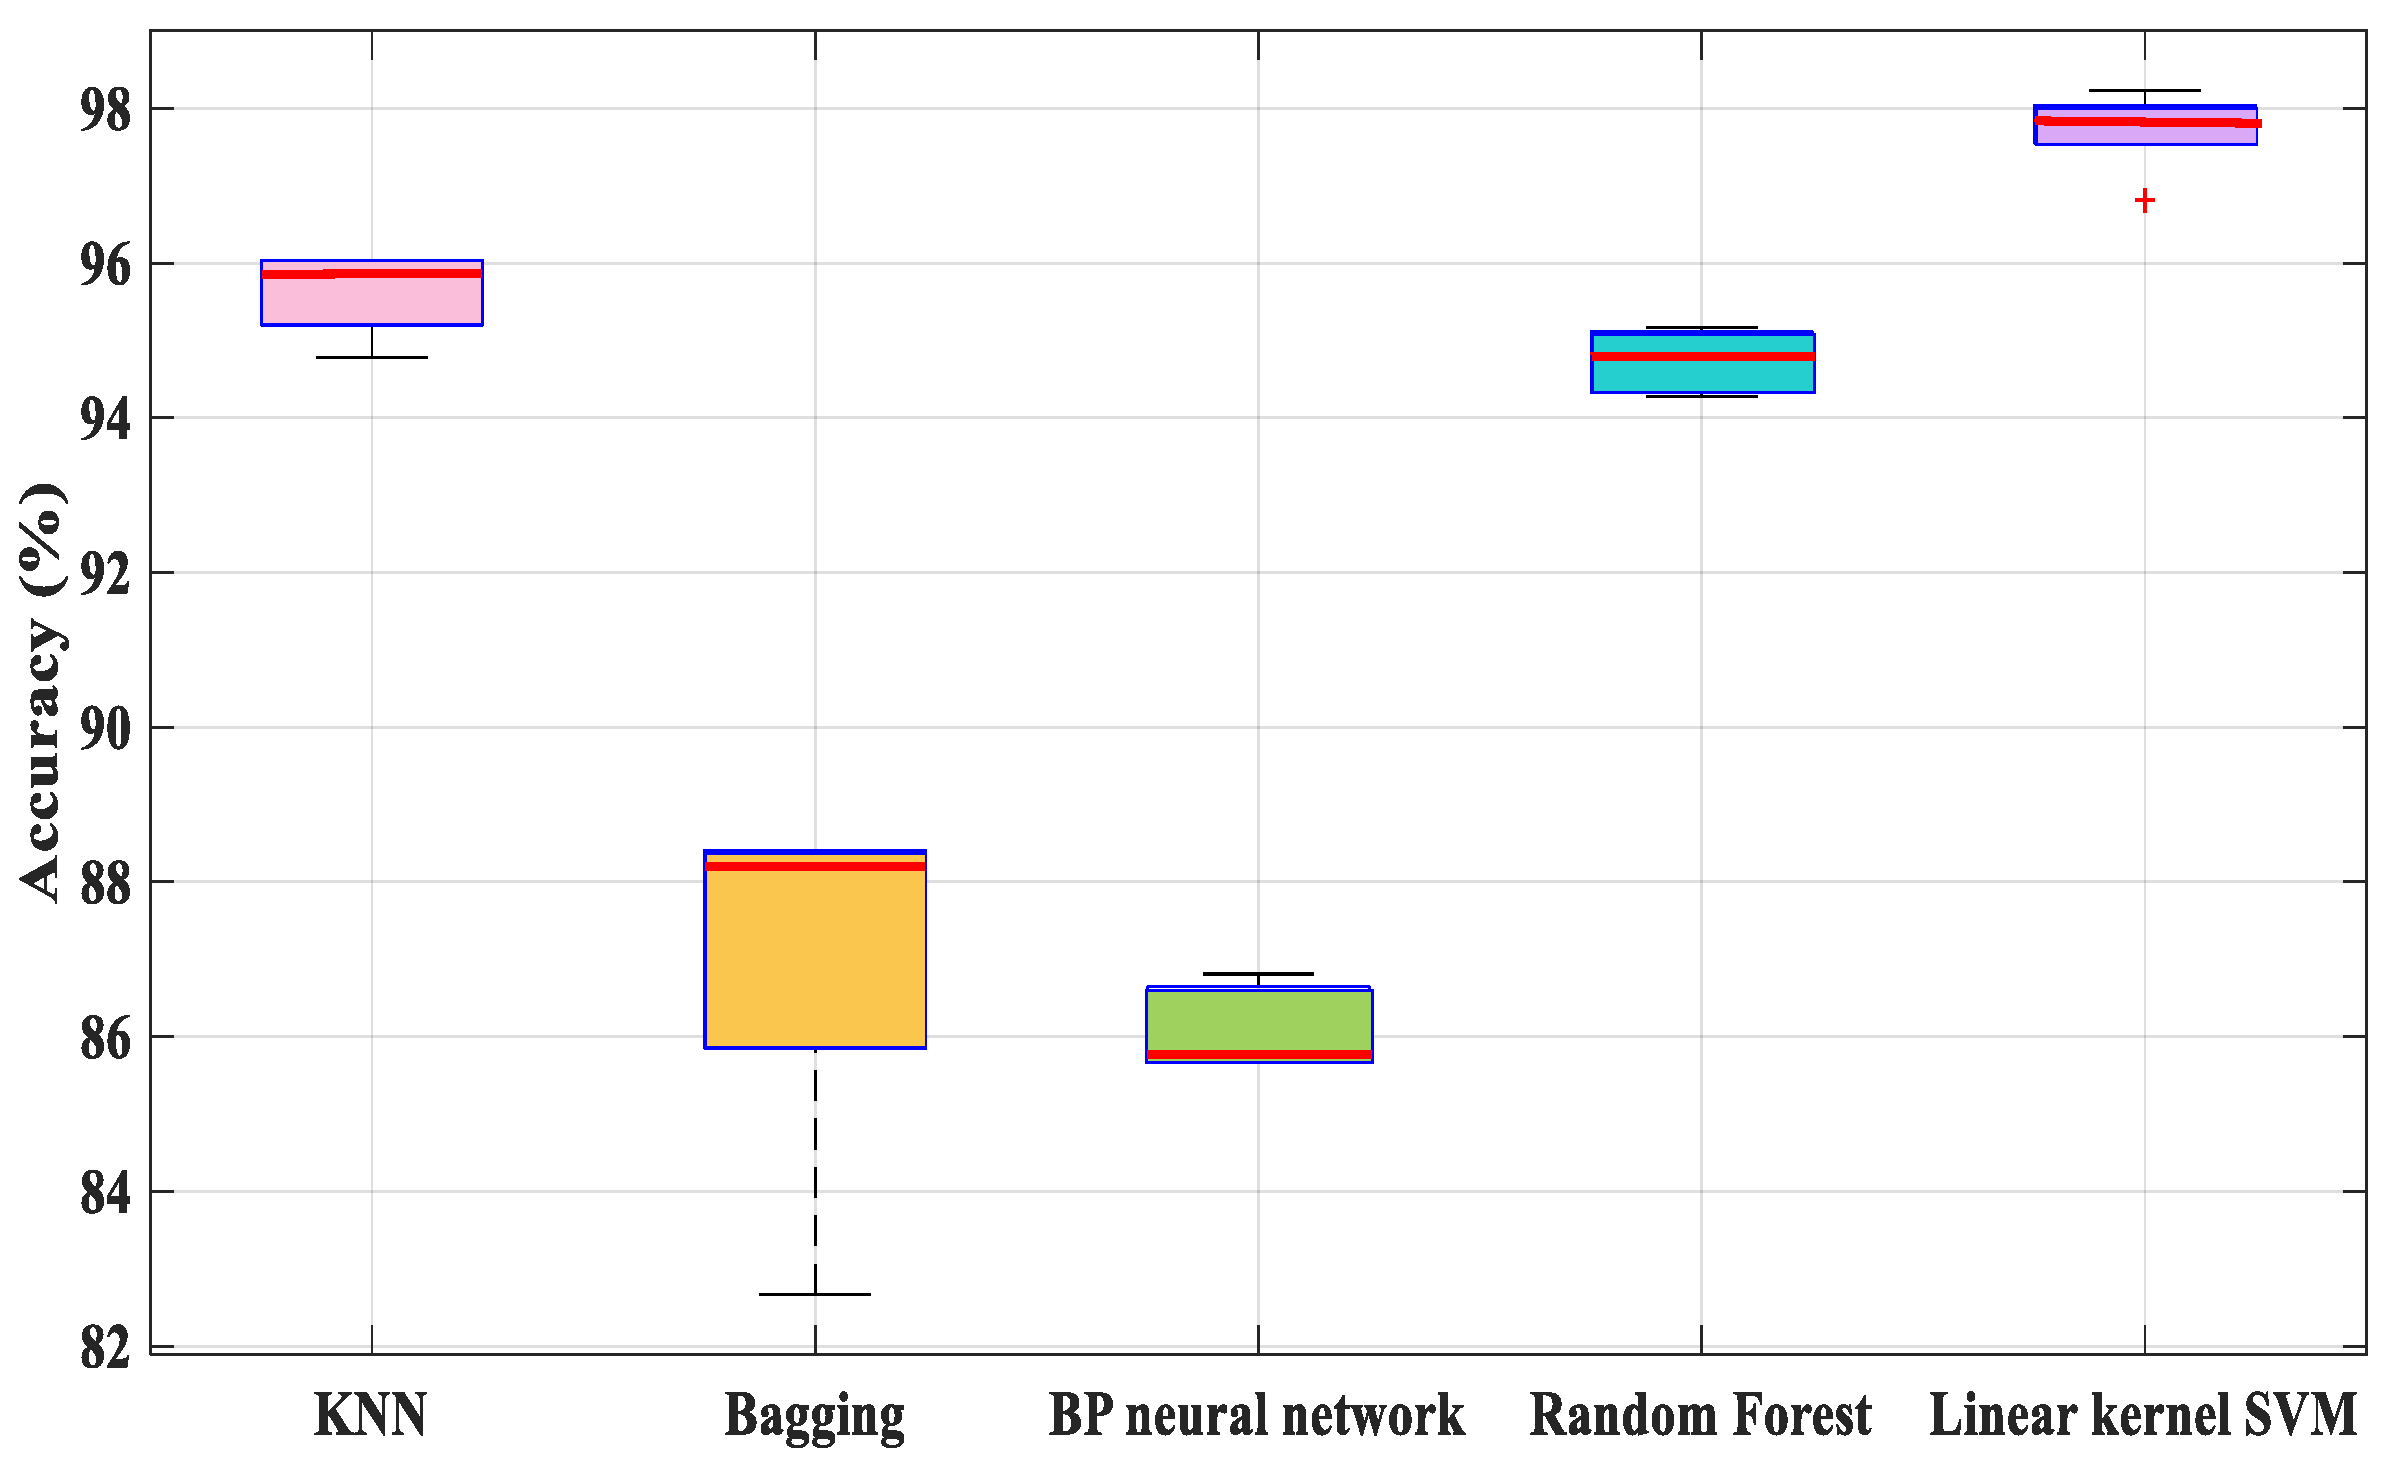
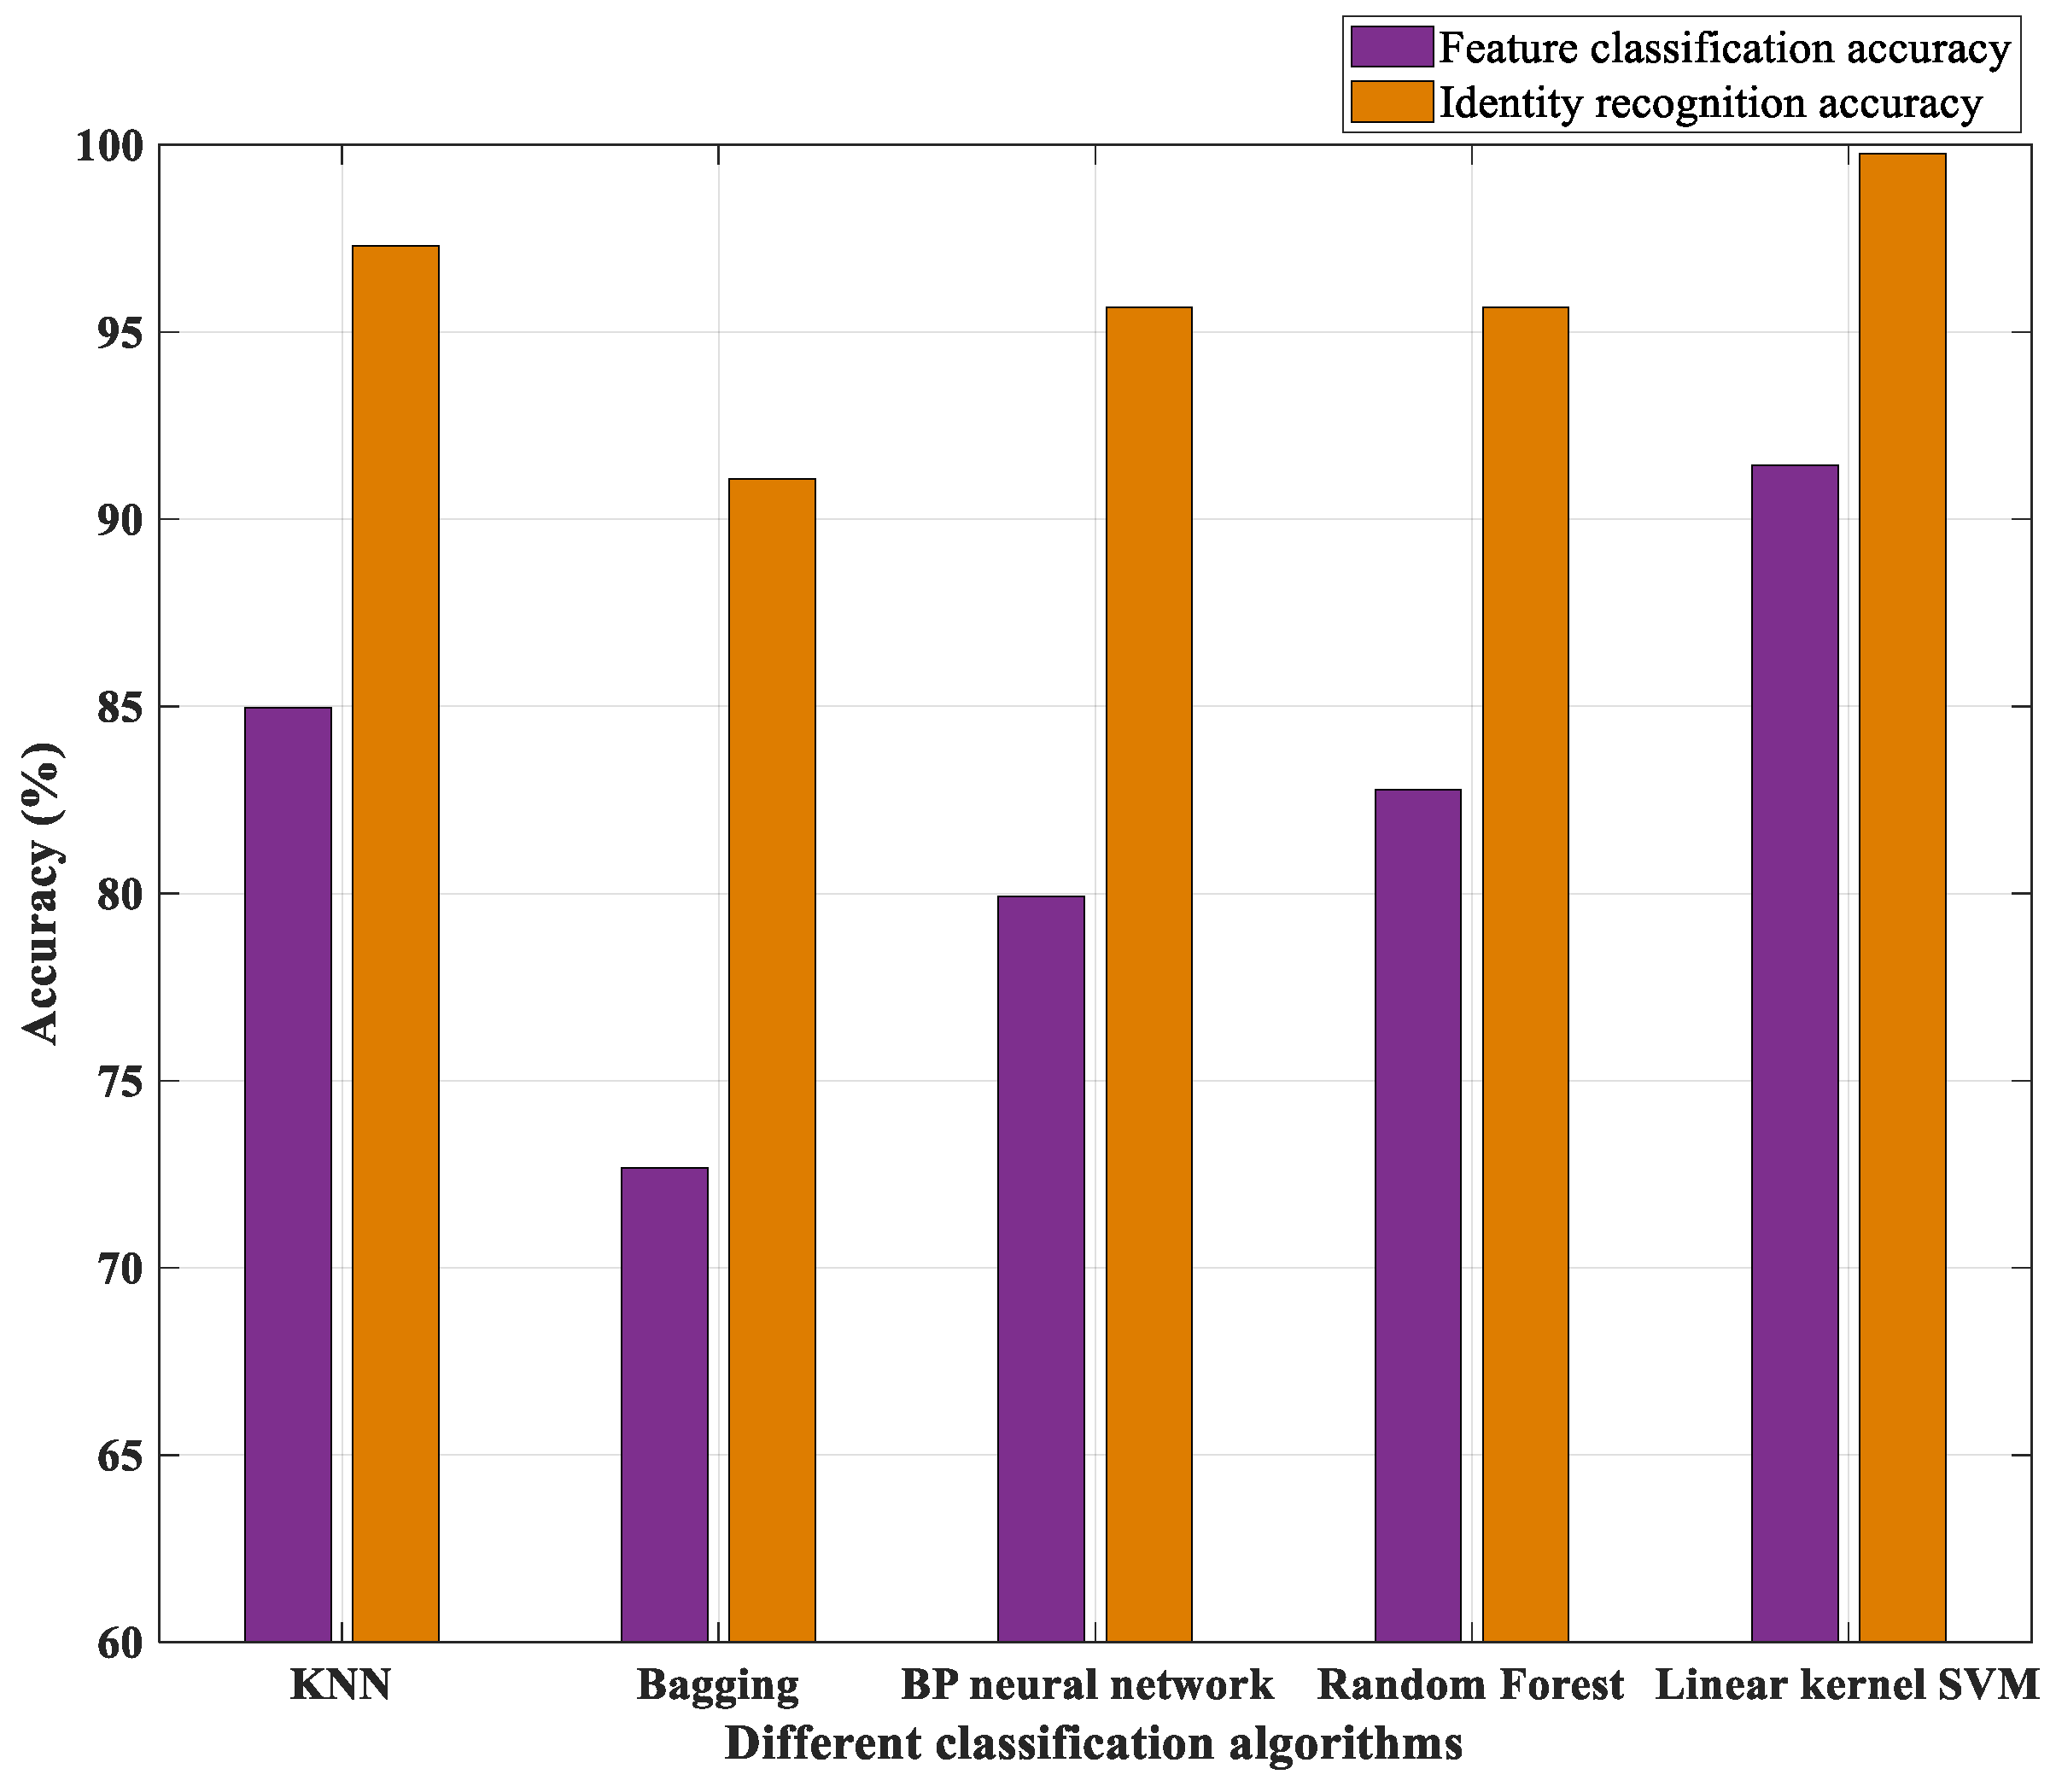
3.3.1. Comparison Experiment for Different Classifiers

To verify the feasibility of the proposed two-level fusion feature extraction algorithm in the paper, five common classifiers are adopted to classify the extracted features. This experiment is applied to the PTB database and the whole data set is divided into five parts, one part is used for training, and the other four parts are testing. The experiments are repeated five times in turn to get different performance results. Figure 8 shows the accuracy evaluation of each of the five classification algorithms when ensuring the same settings of other system modules.
It can be seen from Figure 8 that the single-feature classification accuracy of the proposed feature extraction all achieve more than 80% in different classifiers. Five classifiers have universal adaptability to the two-level fusion features, which also verifies the feasibility and effectiveness of the proposed model. Compared with KNN, Bagging ensemble learning, BP neural network, and random forest, the linear kernel SVM selected in this paper is good at processing high-dimensional and sparse PCANet fusion features, to obtain higher recognition accuracy. Through analysis and comparison of boxplot, it can be seen that the five results of Bagging fluctuate more obviously than other classifiers, which is due to the randomness of the multiple independent sampling process of ensemble learning. And linear kernel SVM classification model has good classification stability. In addition, for identification of the mixed data set came from three public databases, experimental result comparison for different classification models is shown in Figure 9.
As each person in the ECG-ID database contains at least two signals of different days, two signals of every person are used alternately as training and testing set in the experiments. Therefore, the two-fold cross-validation method is applied to the mixed dataset to obtain the average recognition result of the model. As shown in Figure 9, the results of linear kernel SVM are higher than the other four models in both single-feature classification accuracy and identity recognition accuracy. Experimental results can verify the effectiveness of the proposed model for mixed ECG identification with different sampling frequencies, and identity recognition accuracy of linear kernel SVM reaches 99.77%.

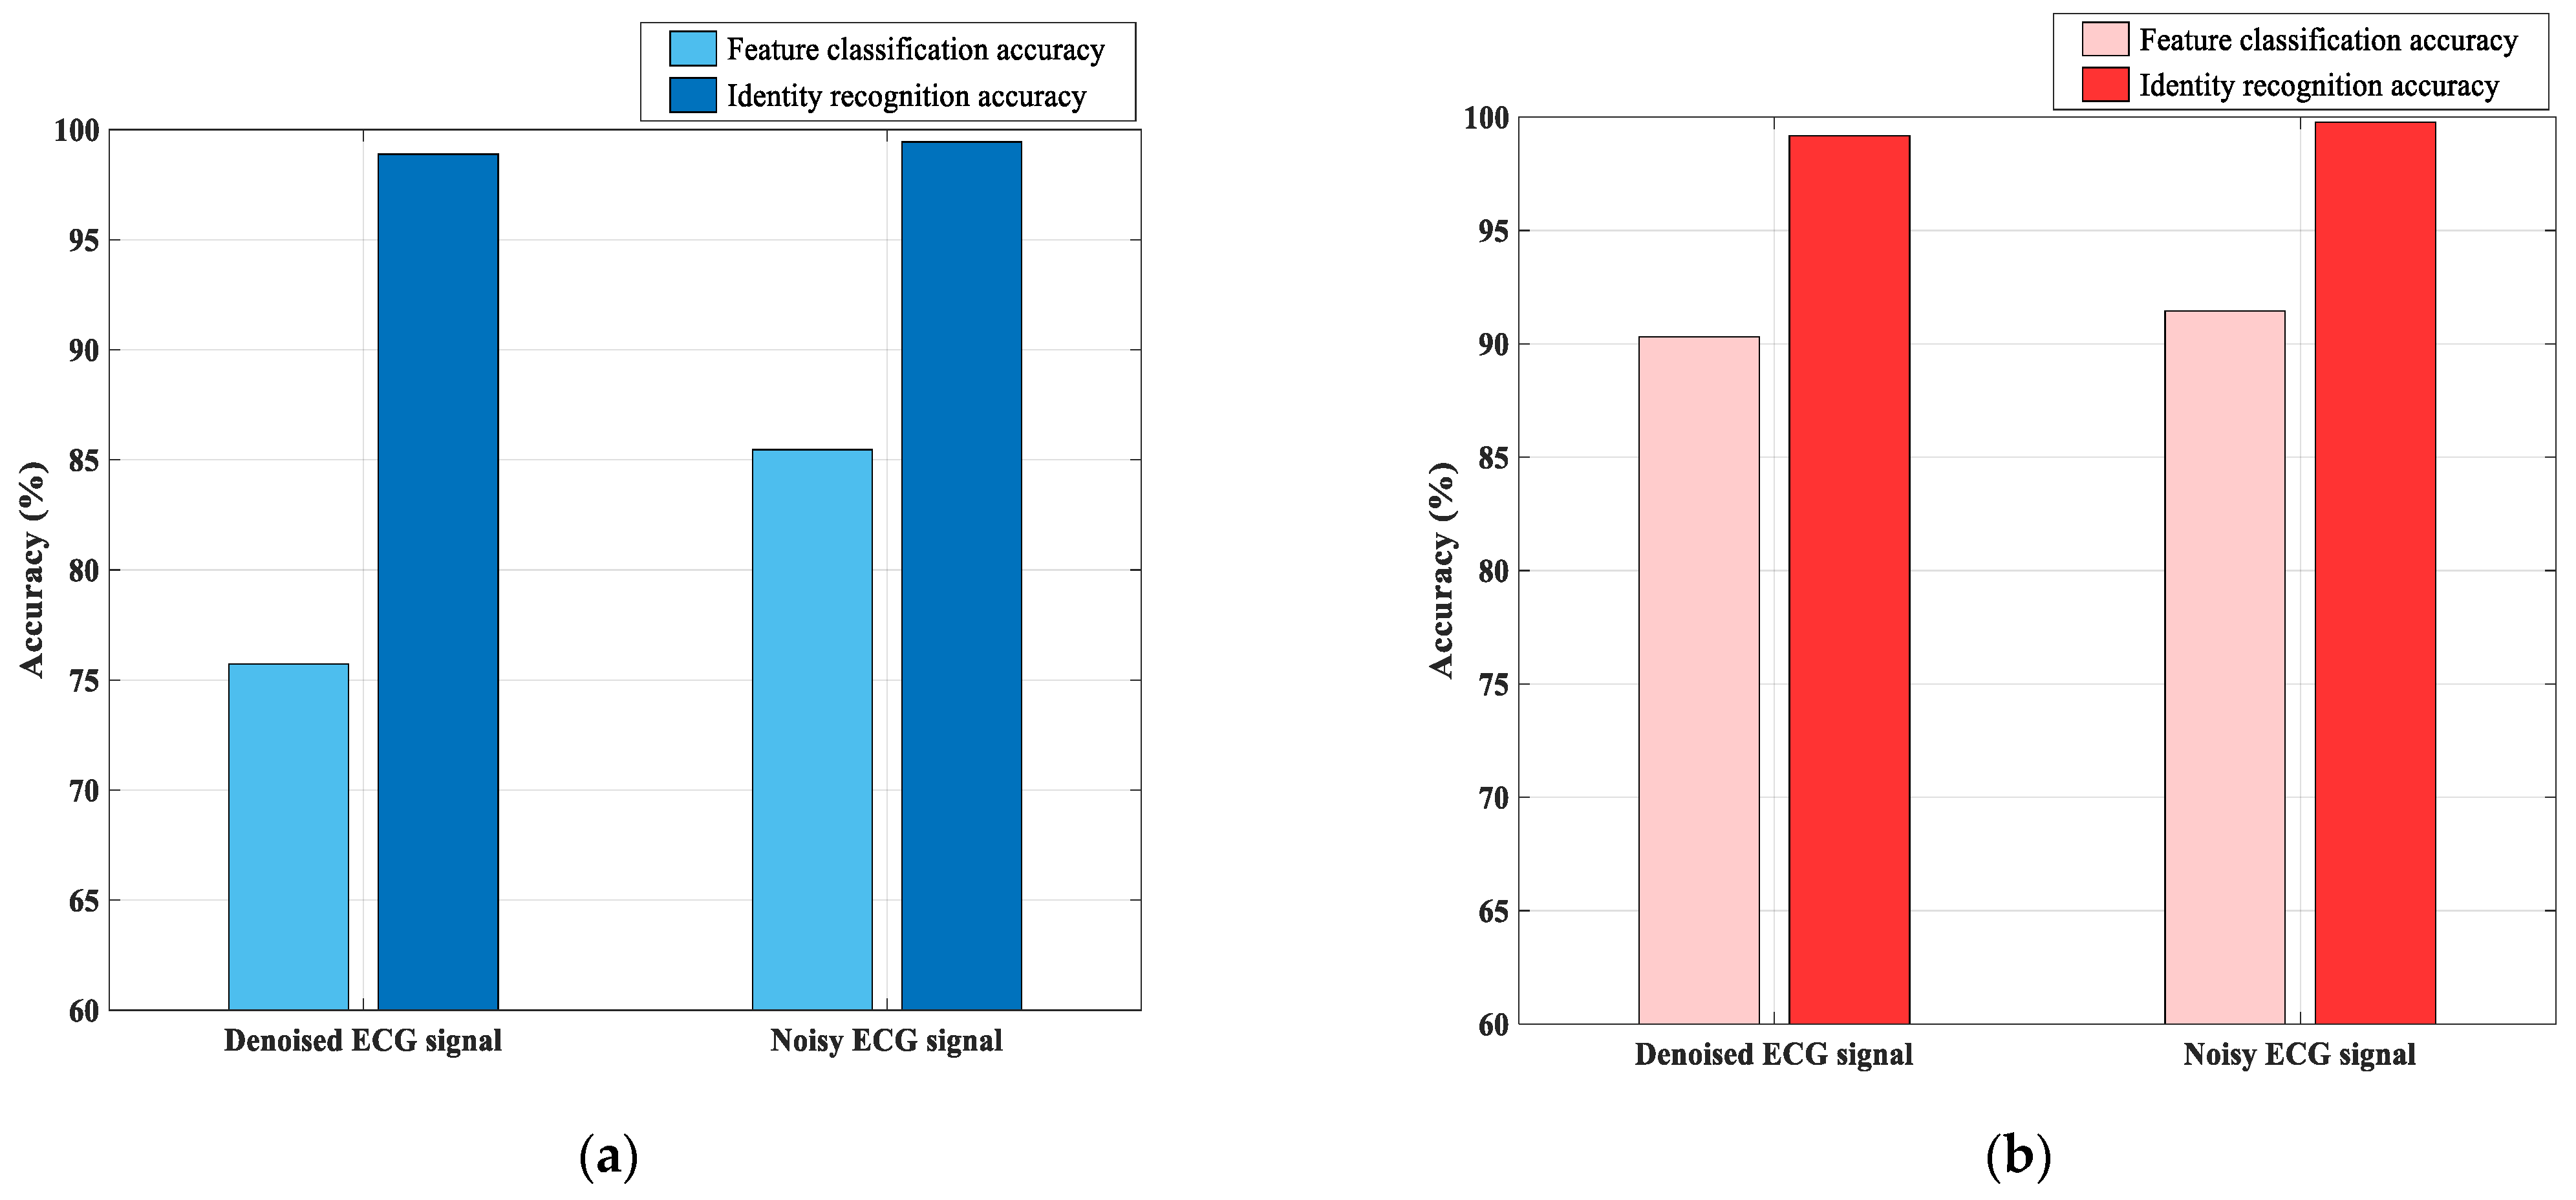
3.3.2. Comparison Experiment for Denoised and Original Signals

Considering that the proposed feature extraction model does not need to be denoised separately, to analyze the identification performance difference between the original noisy signal and the denoised “pure” ECG signal, a fast denoising algorithm based on DB4 wavelet lifting is added in the experiment for ECG signal denoising. Figure 10 displays the denoising effect of different databases.
According to the comparison of noisy and denoised ECG signals in Figure 10, the high-frequency noise, baseline drift, and other noises in the original signal are effectively suppressed after introducing the denoising module and the relatively “clean” and stable ECG signal can be obtained. The recognition result of the denoised signal on the right side is compared with the original signal on the left side, which are input into the proposed two-level fusion feature model. As shown in Figure 11, noise simulation experiments are carried out on ECG-ID healthy individual database and mixed arrhythmia disease data set respectively.
As can be seen from Figure 11a, in the healthy individual database, although the identity recognition accuracy of denoised ECG signal is near to the original signal with noise, the single-feature classification accuracy of the noisy signal is higher than the denoised. It is mainly caused that the relatively “clean” ECG signals are eliminated interference and also removed beneficial information for identification by denoising the algorithm, thus affecting the single-feature recognition accuracy. In Figure 11b, although two kinds of accuracies are found to be relatively close on the mixed ECG data, the base of the individual’s data increases so that there are about three misidentifying individuals differences between the denoised and noisy signals. Meanwhile, considering the complex characteristics of ECG signals in the mixed data set, this experiment verifies that the algorithm can still obtain high recognition results without denoising. On the other hand, the corresponding anti-noise robustness of the model is proved. Under certain interference, the proposed two-level PCANet fusion feature can deal with the inter-class variability better.

3.3.3. Comparison Experiment for Different Feature Extraction Algorithms

To evaluate the necessity of each module in the overall proposed model that can make the system have good classification performance, this paper simulates the identification scheme of different module combinations. The segmented input feature is set as the same as Section 2.2 and a linear kernel support vector machine is used to complete classification in each scheme. Different combinations of algorithms used in two levels feature fusion are changed. Table 2 records various accuracy comparisons of each feature extraction scheme in the mixed ECG data set.
Through the analysis of Table 2, Method 2, 3, and 4 are the process of extracting PCANet high-order features from the single feature, respectively. Different from the transform-domain features extracted by Method 3 and 4, the fragment signals in Method 2 are time-domain representations directly. The accuracies of the three features are similar and lower than Method 5, indicating that the three features only describe original ECG signals partially. Although the accuracy of elementary features adopted in Method 1 is not high, it is not difficult to find that the recognition performance of Method 5 with adding an elementary fusion feature algorithm is significantly higher than Method 2. Hence, through the comprehensive analysis of Method 1, 2, and 5, the result verifies that the elementary feature is the effective supplement for identification. The proposed model uses PCANet to deeply mine elementary fusion features of time-frequency joint distribution and the obtained high-order fusion features contain sufficient discrimination information of ECG signals. The distance among individual categories increases and the internal differences of ECG signals identified by the model are stronger.

3.3.4. Comparison Experiment for Different PCANet Features

To evaluate the high efficiency of the proposed MaxFusion algorithm for feature recognition, the classification performance of PCANet features extracted in different structures are compared on the mixed ECG data set. The simulation results are shown in Table 3. The deep features of the first layer, the second layer of PCANet, the combined two layers feature vectors and the fused two layers features conducted by the MF algorithm are input into linear kernel SVM classifier for recognition, respectively.
For comparison of simulation experiments, the preprocessing and elementary fusion feature extraction algorithm are set exactly the same, so the number of training features input into PCANet are the same. According to Table 3, with the number of layers increasing, the length of deep feature data extracted by convolution kernel becomes longer greatly. The impact of this growth is that the training time of the classification model becomes longer and takes up a large amount of computer memory. The combination of two layers PCANet features brings higher single-feature classification accuracy at the cost of classification efficiency. The feature classification accuracy of the proposed MF algorithm of two layers PCANet features is slightly lower than the combined features, but the individual recognition accuracy obtained through cross-validation is relatively high. It is confirmed that different layers of PCANet features are complementary to the internal information of individuals. Moreover, the running time of training is shortened by half comparing with the combined features, which effectively improves the performance and efficiency of the classification model.

3.3.5. Comparison Experiment of the Related Researches

The proposed model is compared with the domestic and foreign literature on three public databases: ECG-ID, MIT-BIH Arrhythmia, and PTB database. The performance comparison results are shown in Table 4.
As can be seen from Table 4, the relevant studies do not use the mixed data set as data sources of experiments, and the number of individuals applied in most experiments is small. To ensure comparability among different research schemes, the algorithm proposed in this paper not only applies to mixed ECG datasets but also presents the identification results of single databases. Among them, the methods in paper [37,38] and the proposed model all achieve high identification results on the ECG-ID database that accuracies are more than 98%. In the MIT-BIH database, the noise of the signals is removed by the filter in paper [38], while the proposed algorithm still achieves recognition accuracy of 100% without denoising process, which is more convenient for algorithm implementation. In contrast, the feature extraction method in [39,40] relies on the accuracy of traditional QRS positioning, so the detection rate is easy to affect the final recognition accuracy. The proposed two-level fusion feature algorithm realizes the complementary advantages of statistical feature and deep high-order feature and achieves a relatively high recognition accuracy of 99.77% on the mixed data set. Therefore, the feasibility and validity of ECG signal identification from different sources are proved.

4. Discussion

In the practical application of individual identification, ECG signals from various sources present complex characteristics as a result of different influences of acquisition conditions, environments, and some external factors. For the efficient identification of ECG signals with various sampling frequencies, a novel two-level fusion feature extraction model is proposed in this paper.
First of all, the model does not need ECG signal denoising in the mixed dataset, and fragments of two R-R intervals are segmented directly according to the location of the R wave. This part can be verified according to the comparison experiment of noisy and denoised in Section 3.3.2. The original noisy ECG signal has higher recognition accuracy than the denoised signal because it does not remove or change any detailed information. Then using the combination of the transform-domain features of the segmented signals that are feature stitching of the extracted Hilbert and power spectrum. Two kinds of features are obtained by constructing analytic signals in complex-domain and frequency-domain transformation. The frequency-domain features can offset the reduced accuracy caused by disturbed time-domain waveform. And the transformed features only use mathematical methods to automatically analyze and calculate, which do not need to rely on physiological information contained in waveforms of ECG signals. In Section 3.3.3, Table 2 can illustrate the effectiveness of the elementary fusion feature for individual recognition. PCANet was utilized to extract different layers of deep representations from the above elementary features, and the feature vectors output from the first and second layers are fused by the MF algorithm. Section 3.3.4 proves the feasibility of high-order features fusion and the efficiency improvement of the classifier. The deep features fused by the MF algorithm are input into linear kernel SVM model for classification, performing the voting mechanism to realize the final label decision. Compared with different classifiers and several published research studies, the better performance and effectiveness in mixed data set are verified from different perspectives. This part is based on Section 3.3.1 and Section 3.3.5.
The main advantages of this paper are as follows: The manually extracted elementary fusion features are not affected by sampling frequency and have unified dimension, clearly physical meaning, and a similar amount of discrimination information; PCANet is used to mine elementary features of the time-frequency domain, which can express the correlation information in signals and have low sensitivity to an abnormal heartbeat; The proposed MaxFusion algorithm can effectively reduce the dimension of the high-dimensional features in two-layer PCANet and decrease individual classification time when ensuring high recognition accuracy.
As the signals in mixed data set include healthy and abnormal individuals, the recognition results of the two-level fusion feature model can prove the strong robustness of the algorithm to abnormal disease data. However, the number of individuals in mixed data set is still limited comparing to the big data in practical applications. Our future research will look into how we can break through conventional training and optimization mechanisms to meet the demands of real-time identification for large-scale individuals and adaptively adjust the parameters of the network.

5. Conclusions

The two-level fusion feature extraction model proposed in the paper mainly consists of two levels. The first level is the fusion of two elementary transformation features. The second level is the MF algorithm to fuse two layers features in PCANet. These two levels of fusions contain complementary discriminative features of individuals. And the strong feature extraction ability of PCANet has the characteristics of low sensitivity to noise. All experimental results indicate that the identity recognition accuracy of the proposed model is high on both single and mixed datasets. The model has advantages over the methods of feature extraction and classification in recent years. The research hopes to provide valuable ECG identity recognition technology for practical application scenarios.

Author Contributions

Conceptualization, X.L. and Y.S.; methodology, X.L.; formal analysis, X.L. and W.Y.; data curation, W.Y.; writing—original draft preparation, X.L. and Y.S.; writing—review and editing, W.Y.; supervision, W.Y. All authors have read and agreed to the published version of the manuscript.

Funding

This work was supported by the Science and Technology Development Plan Project of Jilin Province under Grant No. 20190302035GX and the Special Project in the Key Areas of Universities in Guangdong Province under Grant No. 2020ZDZX3016.

Conflicts of Interest

The authors declare no conflict of interest.

References

  1. Kaplan Berkaya, S.; Uysal, A.K.; Sora Gunal, E.; Ergin, S.; Gunala, S.; Bilginer Gulmezogluc, M. A survey on ECG analysis. Biomed. Signal Process. Control 2018, 43, 216–235. [Google Scholar] [CrossRef]
  2. Karimian, N.; Guo, Z.M.; Tehranipoor, M.; Forte, D. Highly Reliable Key Generation from Electrocardiogram (ECG). IEEE Trans. Biomed. Eng. 2017, 64, 1400–1411. [Google Scholar] [CrossRef]
  3. Stegmayer, G.; Gerard, M.; Milone, D.H. Data mining over biological datasets: An integrated approach based on computational intelligence. Comput. Intell. Mag. 2012, 7, 22–34. [Google Scholar] [CrossRef]
  4. Agrafioti, F.; Gao, J.; Hatzinakos, D. Heart biometrics: Theory, methods and applications. Biometrics 2011, 3, 199–216. [Google Scholar]
  5. Pinto, J.R.; Cardoso, J.S.; Lourenco, A. Evolution, Current Challenges, and Future Possibilities in ECG Biometrics. IEEE Access 2018, 6, 34746–34776. [Google Scholar] [CrossRef]
  6. Khoma, V.; Pelc, M.; Khoma, Y. Artificial neural network capability for human being identification based on ECG. In Proceedings of the 2018 23rd International Conference on Methods & Models in Automation & Robotics (MMAR), Miedzyzdroje, Poland, 27–30 August 2018; pp. 479–482. [Google Scholar]
  7. Ferdinando, H.; Seppanen, T.; Alasaarela, E. Comparing features from ECG pattern and HRV analysis for emotion recognition system. In Proceedings of the 2016 IEEE Conference on Computational Intelligence in Bioinformatics and Computational Biology (CIBCB), Chiang Mai, Thailand, 5–7 October 2016; pp. 1–6. [Google Scholar]
  8. Rezgui, D.; Lachiri, Z. Integrating EMD attributes for person identification from electrocardiographic signals. In Proceedings of the 2016 2nd International Conference on Advanced Technologies for Signal and Image Processing (ATSIP), Monastir, Tunisia, 21–23 March 2016; pp. 478–482. [Google Scholar]
  9. Byeon, Y.-H.; Pan, S.-B.; Kwak, K.-C. Intelligent Deep Models Based on Scalograms of Electrocardiogram Signals for Biometrics. Sensors 2019, 19, 935. [Google Scholar] [CrossRef] [PubMed] [Green Version]
  10. Kiranyaz, S.; Ince, T.; Gabbouj, M. Real-Time Patient-Specific ECG Classification by 1-D Convolutional Neural Networks. IEEE Trans. Biomed. Eng. 2016, 63, 664–675. [Google Scholar] [CrossRef] [PubMed]
  11. Ferdinando, H.; Seppänen, T.; Alasaarela, E. Bivariate empirical mode decomposition for ECG-based biometric identification with emotional data. In Proceedings of the 2017 39th Annual International Conference of the IEEE Engineering in Medicine and Biology Society (EMBC), Jeju, Korea, 11–15 July 2017; pp. 450–453. [Google Scholar]
  12. Dar, M.N.; Akram, M.U.; Usman, A.; Khan, S.A. ECG biometric identification for general population using multiresolution analysis of DWT based features. In Proceedings of the Second International Conference on Information Security & Cyber Forensics, Cape Town, South Africa, 15–17 November 2015; pp. 5–10. [Google Scholar]
  13. Xu, J.; Li, T.; Chen, Y.; Chen, Y. Personal identification by convolutional neural network with ECG signal. In Proceedings of the 2018 International Conference on Information and Communication Technology Convergence (ICTC), Jeju, Korea, 17–19 October 2017; pp. 559–563. [Google Scholar]
  14. Wu, Y.; Wu, H.; Chang, W. Compressed Domain ECG Biometric Identification Using JPEG2000. In Proceedings of the International Joint Conference on E-business & Telecommunications, Colmar, France, 20–22 July 2015; pp. 5–13. [Google Scholar]
  15. Zhang, Q.; Zhou, D.; Zeng, X. HeartID: A multiresolution convolutional neural network for ECG-based biometric human identification in smart health applications. IEEE Access 2017, 5, 11805–11816. [Google Scholar] [CrossRef]
  16. Lin, S.L.; Chen, C.K.; Lin, C.L.; Yang, W.C.; Chiang, C.T. Individual identification based on chaotic electrocardiogram signals during muscular exercise. IET Biom. 2014, 3, 257–266. [Google Scholar] [CrossRef]
  17. AI Rahhal, M.M.; Bazi, Y.; Alhichri, H.; Alajlan, N.; Melgani, F.; Yager, F.F. Deep learning approach for active classification of electrocardiogram signals. Inf. Sci. 2016, 345, 340–354. [Google Scholar] [CrossRef]
  18. Kim, J.S.; Kim, S.H.; Pan, S.B. Personal recognition using convolutional neural network with ECG coupling image. J. Ambient. Intell. Humaniz. Comput. 2020, 11, 1923–1932. [Google Scholar] [CrossRef]
  19. Wieclaw, L.; Khoma, Y.; Falat, P.; Sabodashko, D.; Herasymenko, V. Biometrie identification from raw ECG signal using deep learning techniques. In Proceedings of the 2017 9th IEEE International Conference on Intelligent Data Acquisition and Advanced Computing Systems: Technology and Applications (IDAACS), Bucharest, Romania, 21–23 September 2017; pp. 129–133. [Google Scholar]
  20. Salloum, R.; Kuo, C.C.J. ECG-based biometrics using recurrent neural networks. In Proceedings of the IEEE International Conference on Acoustics, Speech and Signal Processing (ICASSP), New Orleans, LA, USA, 5–9 March 2017; pp. 2062–2066. [Google Scholar]
  21. Acharya, U.R.; Fujita, H.; Lih, O.S.; Hagiwara, Y.; Tan, J.H.; Adam, M. Automated detection of arrhythmias using different intervals of tachycardia ECG segments with convolutional neural network. Inf. Sci. 2017, 405, 81–90. [Google Scholar] [CrossRef]
  22. Ramya, M.; Muthukumar, A.; Kannan, S. Multibiometric based authentication using feature level fusion. In Proceedings of the 2012 International Conference on Advances in Engineering, Science and Management (ICAESM), Nagapattinam, India, 30–31 March 2012; pp. 191–195. [Google Scholar]
  23. Shahram, T.; Nsen, T. Animal classification using facial images with score-level fusion. IET Comput. Vis. 2018, 12, 679–685. [Google Scholar]
  24. Vijayalakshmi, V.; Divya, R.; Jaganath, K. Finger print and Palm print based Multibiometric Authentication System with GUI Interface. In Proceedings of the 2013 International Conference on Communication and Signal Processing Melmaruvathur, Tamilnadu, India, 3–5 April 2013; pp. 738–742. [Google Scholar]
  25. Chen, X.; Xu, H.; Shen, H. ECG Identification Based on Fusion Features of Morphological Characteristics and KPCA. Electron. Technol. 2015, 3, 5–8. [Google Scholar]
  26. Golrizkhatami, Z.; Acan, A. ECG classification using three-level fusion of different feature descriptors. Expert Syst. Appl. 2018, 114, 54–64. [Google Scholar] [CrossRef]
  27. Ai, D.; Yang, J.; Wang, Z.; Fan, J. Fast multi-scale feature fusion for ECG heartbeat classification. Eurasip J. Adv. Signal Process. 2015, 2015, 46. [Google Scholar] [CrossRef] [Green Version]
  28. Meng, X.; Liang, C.; Polajnar, D.; Tong, W. Local binary pattern network: A deep learning approach for face recognition. In Proceedings of the IEEE International Conference on Image Processing, Phoenix, AZ, USA, 25–28 September 2016; pp. 3224–3228. [Google Scholar]
  29. Yang, X.; Liu, W.; Tao, D.; Cheng, J.; Li, S. Multiview canonical correlation analysis betworks for remote sensing image recognition. IEEE Geosci. Remote. Sens. Lett. 2017, 14, 1855–1859. [Google Scholar] [CrossRef]
  30. Yang, W.; Si, Y.; Wang, D.; Zhang, G. A novel method for identifying electrocardiograms using an independent component analysis and principal component analysis network. Measurement 2020, 152, 107363. [Google Scholar] [CrossRef]
  31. Yang, W.; Si, Y.; Wang, D.; Zhang, G. A novel approach for multi-Lead ECG classification using DL-CCANet and TL-CCANet. Sensors 2019, 19, 3214. [Google Scholar] [CrossRef] [PubMed] [Green Version]
  32. Wei, W.; Zhang, C.X.; Lin, W. A QRS Wave Detection Algorithm Based on Complex Wavelet Transform. Appl. Mech. Mater. 2013, 239–240, 1284–1288. [Google Scholar] [CrossRef]
  33. Khazaee, A.; Zadeh, A.E. ECG beat classification using particle swarm optimization and support vector machine. Front. Comput. Sci. 2014, 8, 217–231. [Google Scholar] [CrossRef]
  34. Liu, W.; Wang, Z.; Liu, X.; Zeng, N.; Liu, Y.; Alsaadi, F.E. A survey of deep neural network architectures and their applications. Neurocomputing 2017, 234, 11–26. [Google Scholar] [CrossRef]
  35. Chan, T.H.; Jia, K.; Gao, S.; Lu, J.; Zeng, Z.; Ma, Y. PCANet: A Simple Deep Learning Baseline for Image Classification? IEEE Trans. Image Process. 2015, 24, 5017–5032. [Google Scholar] [CrossRef] [PubMed] [Green Version]
  36. Wang, D.; Si, Y.; Yang, W.; Zhang, G.; Liu, T. A Novel Heart Rate Robust Method for Short-Term Electrocardiogram Biometric Identification. Appl. Sci. 2019, 9, 201. [Google Scholar] [CrossRef] [Green Version]
  37. Chu, Y.; Shen, H.; Huang, K. ECG Authentication Method Based on Parallel Multi-scale One-dimensional Residual Network with Center and Margin Loss. IEEE Access 2019, 7, 51598–51607. [Google Scholar] [CrossRef]
  38. Rui, L.A.; Gya, B.; Kw, A.; Huang, Y. Robust ECG biometrics using GNMF and sparse representation. Pattern Recognit. Lett. 2020, 129, 70–76. [Google Scholar]
  39. Gurkan, H.; Hanilci, A. ECG based biometric identification method using QRS images and convolutional neural network. Pamukkale Univ. J. Eng. Sci. 2020, 26, 318–327. [Google Scholar] [CrossRef]
  40. Dong, X.; Si, W.; Yu, W. Identity recognition based on the qrs complex dynamics of electrocardiogram. IEEE Access 2020, 99, 1. [Google Scholar] [CrossRef]
  41. Liu, F.; Si, Y.; Luo, T.; Wang, D.; Liu, Q.; Li, L. The ECG Identification Based on GRNN. In Proceedings of the 2018 IEEE International Conference on Communication Systems (ICCS), Chengdu, China, 19–21 December 2018; pp. 418–422. [Google Scholar]
  42. Pal, A.; Singh, Y.N. ECG Biometric Recognition. In International Conference on Mathematics & Computing; Springer: Singapore, 2018; pp. 61–73. [Google Scholar]
  43. Alotaiby, T.N.; Alshebeili, S.A.; Aljafar, L.M.; Alsabhan, W.M. ECGbased subject identification using common spatial pattern and SVM. J. Sens. 2019, 2019, 1–9. [Google Scholar]
Figure 1. The overall architecture of the two-level fusion feature identity recognition network.
Electronics 10 02052 g001
Figure 2. R wave detection result of PTB database signal.
Electronics 10 02052 g002
Figure 3. The method of signal segmentation.
Electronics 10 02052 g003
Figure 4. The power spectrum curves of ECG signals in three databases. (a) MIT-BIH database; (b) ECG-ID database; (c) PTB database.
Electronics 10 02052 g004aElectronics 10 02052 g004b
Figure 5. Spectrum estimation curves of ECG signals from different individuals and the same individual.
Electronics 10 02052 g005
Figure 6. Two layers of the PCANet model.
Electronics 10 02052 g006
Figure 7. The principle diagram of the sliding window.
Electronics 10 02052 g007
Figure 8. The accuracy boxplot of different classification models on the PTB database.
Electronics 10 02052 g008
Figure 9. Comparison for recognition performance of different classifiers on mixed data set.
Electronics 10 02052 g009
Figure 10. Denoising effect of three different databases.
Electronics 10 02052 g010
Figure 11. Comparison for recognition accuracy of denoised and noisy ECG signal. (a) Recognition performance comparison on ECG-ID database; (b) Recognition performance comparison on the mixed data set.
Electronics 10 02052 g011
Table 1. PCANet fusion structure and parameter setting.
LayerParametersValue
Input layerElementary fusion feature matrix size m × n 10 × 110
First layerThe size of patch k 1 × k 2 7 × 7
The number of filters L 1 9
Output layer 1The size of histogram block k 3 × k 4 7 × 7
The overlap ratio of histogram block υ 0.5
Second layerThe size of patch k 1 × k 2 7 × 7
The number of filters L 2 9
Output layer 2The size of histogram block k 3 × k 4 7 × 7
The overlap ratio of histogram block υ 0.5
Fusion layerThe length of fusion feature10,000
Table 2. Comparison for recognition performance of different feature extraction models.
Method 1Method 2Method 3Method 4Method 5 (The Proposed Method)
Hilbert transform featureYNYNY
Power spectrum featureYNNYY
Two-layer PCANet fusion featureNYYYY
Sensitivity S e 49.88%88.90%88.80%89.55%93.84%
Precision P c 50.02%89.78%89.73%89.87%94.58%
Feature classification accuracy A c c 59.04%87.20%86.97%85.33%91.45%
Table 3. Comparison for classification performance of different PCANet features.
Number of Training FeaturesTraining Feature LengthTraining Time of Linear SVMFeature Classification AccuracyIdentity Recognition Accuracy
One-layer PCANet features738913,31244.59 s89.59%99.53%
Two-layers PCANet features119,808352.31 s90.97%99.53%
The combined two layers PCANet features133,120391.63 s92.17%99.77%
The fused two layers PCANet features by MF algorithm10,000159.28 s91.45%99.77%
Table 4. Comparison for identification results of different studies.
MethodsDatabasesNumber of SubjectsIdentity Recognition Accuracy
Byeon (2019) [9]AlexNetPTB6192.50%
Chu et al. (2019) [37]Residual networkECG-ID9098.24%
MIT-BIH Arrhythmia4795.99%
Rui et al. (2020) [38]GNMF + sparse representationECG-ID8998.03%
MIT-BIH Arrhythmia47100%
Gurkan et al. (2020) [39]QRS images + CNNPTB5083.95%
Dong et al. (2020) [40]The QRS complex dynamics + radial basis function networksPTB5297.31%
Liu et al. (2018) [41]SVD-LDA + GRNNECG-ID8996.60%
Pal et al. (2018) [42]Area fiducial features + PCAPTB10097.10%
Alotaiby et al. (2019) [43]CSP features + SVMPTB20095.15%
The proposed modelTwo-level fusion feature + SVMECG-ID8999.44%
MIT-BIH Arrhythmia47100%
PTB29099.66%
Mixed Data Set42699.77%
Publisher’s Note: MDPI stays neutral with regard to jurisdictional claims in published maps and institutional affiliations.

