Review

A Summary of F-Transform Techniques in Data Analysis

by
Ferdinando Di Martino
1,2,*,
Irina Perfilieva
3 and
Salvatore Sessa
1,2
1
Dipartimento di Architettura, Università degli Studi di Napoli Federico II, Via Toledo 402, 80134 Napoli, Italy
2
Di Ricerca “Alberto Calza Bini”, Università degli Studi di Napoli Federico II, Via Toledo 402, 80134 Napoli, Italy
3
Institute for Research and Applications of Fuzzy Modeling, 708 00 Ostrava, Czech Republic
*
Author to whom correspondence should be addressed.
Electronics 2021, 10(15), 1771; https://doi.org/10.3390/electronics10151771
Submission received: 28 June 2021 / Revised: 18 July 2021 / Accepted: 22 July 2021 / Published: 24 July 2021
(This article belongs to the Special Issue Fuzzy Systems and Data Science)

Abstract

:
Fuzzy transform is a technique applied to approximate a function of one or more variables applied by researchers in various image and data analysis. In this work we present a summary of a fuzzy transform method proposed in recent years in different data mining disciplines, such as the detection of relationships between features and the extraction of association rules, time series analysis, data classification. After having given the definition of the concept of Fuzzy Transform in one or more dimensions in which the constraint of sufficient data density with respect to fuzzy partitions is also explored, the data analysis approaches recently proposed in the literature based on the use of the Fuzzy Transform are analyzed. In particular, the strategies adopted in these approaches for managing the constraint of sufficient data density and the performance results obtained, compared with those measured by adopting other methods in the literature, are explored. The last section is dedicated to final considerations and future scenarios for using the Fuzzy Transform for the analysis of massive and high-dimensional data.

1. Introduction

Fuzzy Transform (for short, F-transform) [1,2] is a recent soft computing approximation technique, successfully used in numerous applications in image and data analysis (see, e.g., [3] for an in-depth discussion on this matter).
In particular, the properties of the F-transform in the information aggregation and function approximation favors its use in many data analysis and data mining problems.
The aim of this paper is to provide an in-depth overview of soft computing data analysis techniques based on the use of the F-transform proposed in the literature.
Some variations of basic functions used to constrict the F-transform are proposed in [4], in which they are given by B-spline functions, and in [5] where the basic functions are given by block pulse functions.
Recently an extension of the basic F-transform on higher-degree F-transform was introduced in [6] by generalizing the case of constant (zero-order) components to the case of m-order polynomial components. In [7,8] the applicability of the m-order F-transform is discussed and an application of the one-degree F-transform in seasonal time series forecasting is presented in [9]. However, while increasing the performance in terms of accuracy and precision of the results compared to basic F-transforms, the higher-degree fuzzy transforms are computationally more complex to manage and this makes them unsuitable for use in data analysis applications, especially in the presence of datasets of high cardinality and size.
In this work we focus on the application of the basic (zero-order) F-transform in data analysis. We will discuss the techniques proposed in the literature that employ the direct and inverse zero-order F-transform in data mining problems, such as dependencies between attributes, time series analysis and data classification, analyzing their critical points and performance benefits.
F-transform techniques were initially applied in image analysis in which the constraint of sufficient density described in Section 2 is always respected. In data analysis, however, the application of the F-transform necessarily requires the management of this constraint and the choice of suitable fuzzy partitions of the domains of the input variable and the choice of the appropriate dimensionality of the fuzzy partitions which cannot be too fine, to guarantee sufficient data density, nor too coarse grained, to guarantee high performance levels.
In Section 2 we introduce the one-dimensional and multi-dimensional F-transforms, providing a summary of their characteristics. In particular, the constraint of sufficient density of the data will be analyzed, which is of extreme importance in the use of F-transform techniques in data analysis. In Section 3 are discussed the methods proposed in the literature applying the multidimensional F-transform in the analysis of dependencies between attributes in the data and in detecting association rules. Section 4 focuses on the F-transform techniques applied in time series analysis. In Section 5 a classification method based on the multi-dimensional F-transform is discussed. Final considerations are contained in Section 6. A list with descriptions of all acronyms and abbreviations in the text is given in Appendix A.

2. Preliminaries

2.1. Basic Functions

Let X = [a,b] be a close interval in R and {x1, x2, …, xn} be a set of n fixed points in [a,b] such that 3 ≤ n and a = x1 < x2 <…< xn = b.
In [1,2] the following definition of fuzzy partition of X was introduced: the fuzzy sets A1, …, An: [a,b] → [0,1] form a (generalized) fuzzy partition of [a,b], if for each k = 2, …, n − 1, the following constraints hold:
1.
A k x = 0   x x k 1 , x k + 1 (locality)
2.
A k x > 0   x x k 1 , x k + 1   and   A k x k = 1   (positivity)
3.
Ak is continuous in x k 1 , x k + 1 (continuity)
4.
Ak is strictly decreasing in (xk−1, xk) and strictly increasing in (xk, xk+1)
5.
k = 1 n A k x = 1   x a , b (Ruspini condition).
The membership functions A 1 , , A n are called basic functions. If the nodes x1, ..., xn are equidistant, the fuzzy partition A 1 , , A n is called h-uniform fuzzy partition of [a,b] where h = (b − a)/(n + 1) is the distance between two consecutive nodes.
For an h-uniform fuzzy partition the following additional properties hold:
1.
A k x k x = A k x k + x   x 0 , h
2.
A k x = A k 1 x h   and   A k 1 x = A k x + h   x x k , x k + 1
An h-uniform fuzzy partition can be generated (see, e.g., [2]) by an even function A0: [[–1,1] → [0,1], which is continuous, positive in (−1,1) and null on boundaries {−1,1}. The function A0 is called generating function of the h-uniform fuzzy partition. The following expression represents an arbitrary basic function from an h-uniform generalized fuzzy partition:
A k ( t ) = A 0 x x k h x x k h , x k + h 0 otherwise .

2.2. One-Dimensional Direct and Inverse F-Transform

Let {A1, A2, …, An} be a fuzzy partition of [a,b] and f(x) be a continuous function on [a,b]. The n-tuple F 1 , F 2 , , F n with components:
F k = a b f x A k x d x a b A k x d x k = 1 , , n
is called the fuzzy transform of f with respect to {A1, A2, …, An}. The Fk are called components of the F-transform.
If the fuzzy partition {A1, A2, …, An} is uniform with nodes x1, x2, …, xn, the components are given (cfr. [2] Lemma 1) by the formula:
F k = 2 h x 1 x 2 f x A k x d x   if   k = 1 1 h x i 1 x i f x A k x d x   if   k = 2 , , n - 1 2 h x n 1 x n f x A k x d x   if   k = n
Now we define the following function on [a,b] given by a weighted average of the basic functions in which the weights are the F-transform components:
f F , n x = k = 1 n F k A k x x a ,   b
It is called inverse F-transform of f with respect to the uniform fuzzy partition {A1, A2, …, An}. An important theorem proves that the function fF,n approximates the continuous function f on [a,b] with arbitrary precision. We enunciate below this theorem and its proof is given in [2] Theorem 2.
Theorem 1.Let f(x) be a continuous function on [a,b]. For every ε > 0, then there exist an integer n(ε) and a related fuzzy partition {A1, A2, …, An(ε)} of [a,b] such that for all x ∊ [a, b] results f x f F ,   n ε x   < ε .
Theorem 1 concerns the approximation of a known continuous function f, but in many cases we only know that the function f assumes determined values in a set of m points p1, …, pm ∊ [a,b].
We assume that the set P of these nodes is sufficiently dense with respect to the fixed fuzzy partition, i.e., for each k = 1, …, n there exists an index j ∊ {1, …, m} such that Ak(pj) > 0. Then we can define the n-tuple [F1, F2, …, Fn] as the discrete F-transform of f with respect to {A1, A2, …, An }, where each Fk is given by
F k = j = 1 m f p j A k p j j = 1 m A k p j k = 1 , , n
Then we call the discrete inverse F-transform of f with respect to {A1, A2, …, An} to be the following function defined in the same points p1, ..., pm of [a,b]:
f F , n x = k = 1 n F k A k x x a ,   b
Analogously to Theorem 1, we have the following approximation theorem (its proof is given in [2] Theorem 5.
Theorem 2.Let f(x) be a function assigned on a set P of points p1, ..., pm of [a,b]. Then, for every ε > 0, there exists an integer n(ε) and a related fuzzy partition {A1, A2, …, An(ε) } of [a,b] such that P is sufficiently dense with respect to {A1, A2, …, An(ε) } and for every pj ∊ [a, b], j = 1, …, m, holds f x f F ,   n ε x   < ε .
Theorem 2 states that the inverse F-transform (6) approximates the original continuous function f in a point with an arbitrary precision.

2.3. Multi-Dimensional Direct and Inverse F-Transform

The one-dimensional F-transform can be extended to approximate continuous functions defined in a N-dimensional domain given by the Cartesian product [a1,b1] × [a2,b2] ×… × [as,bs] of s real intervals [ai,bi] ⊆ R (i = 1, …, s).
Let f: [a1,b1] × [a2,b2] ×… × [as,bs] → R be a continuous function on the universe of discourse. Let A 11 , A 12 , , A 1 n 1 ,   A 21 , A 22 , , A 2 n 2 ,     A s 1 , A s 2 , , A s n s uniform fuzzy partitions of [a1,b1], …,[as,bs], respectively.
The F-transform of the function f with respect to   A 11 , A 12 , , A 1 n 1 ,   A 21 , A 22 , , A 2 n 2 ,   , A s 1 , A s 2 , , A s n s , are the functions given by
F k 1 k 2 k s = a s b s a 2 b 2 a 1 b 1 f ( x 1 , x 2 , , x s ) A k 1 ( x 1 ) A k 2 ( x 2 ) A k s ( x s ) d x 1 d x 2 d x s a s b s a 2 b 2 a 1 b 1 A k 1 ( x 1 ) A k 2 ( x 2 ) A k s ( x s ) d x 1 d x 2 d x s
The inverse F-transform of the function f with respect to A 11 , A 12 , , A 1 n 1 ,   A 21 , A 22 , , A 2 n 2 ,     A s 1 , A s 2 , , A s n s are the following functions defined on [a1,b1] × [a2,b2] ×…× [as,bs]:
f n 1 n 2 n s F x 1 , x 2 , , x s = k 1 = 1 n 1 k 2 = 1 n 2 k s = 1 n s F k 1 k 2 k s A k 1 x 1 A k 2 x 2 A k s x s
Let the function f(x1, x2, …, xs) be known in N points pj = (pj1, pj2, …, pjs) ∊ [a1,b1] × [a2,b2] ×…× [as,bs] being j = 1, 2, …, N.
The set P = {(p11, p12, …, p1s), (p21, p22, …, p2s), …, (pN1, pN2, …, pNs)} is called sufficiently dense with respect to the partitions A 11 , A 12 , , A 1 n 1 , …, A s 1 , A s 2 , , A s n s if, for any combination (h1, …, hs) ∊ {1, …, n1} ×…× {1, …, ns} there is some p v = p v 1 , p v 2 , p v s P, v ∊ {1, …, N}, such that A 1 h 1 p v 1 A 2 h 2 p v 2 A s h s p v s > 0 . So we can define the (h1, h2, …, hs)th components F h 1 h 2 h s of the direct F-transform of f with respect to the basic functions A 11 , A 12 , , A 1 n 1 , …,   A s 1 , A s 2 , , A s n s as
F h 1 h 2 h s = j = 1 N f p j 1 , p j 2 , p j s A 1 h 1 p j 1 A 2 h 2 p j 2 A s h s p j s j = 1 N A 1 h 1 p j 1 A 2 h 2 p j 2 A s h s p j s
If the set P is sufficiently dense with respect to the fuzzy partition we can define the inverse multi-dimensional F-transform of f with respect to the basic functions A 11 , A 12 , , A 1 n 1 ,   A 21 , A 22 , , A 2 n 2 ,     A s 1 , A s 2 , , A s n s to be the following functions by setting for each point pj = (pj1, pj2, …, pjs) ∊ [a1,b1] × …× [as,bs]:
f n 1 n 2 n s F p j 1 , p j 2 , , p j s = h 1 = 1 n 1 h 2 = 1 n 2 h s = 1 n s F h 1 h 2 h s A 1 h 1 p j 1 A s h s p j s
for j = 1, …, N. The following theorem, which is an extension of Theorem 2, holds:
Theorem 3.Let f x 1 , , x s be a function assigned on the set of points P = {(p11, p12, …, p1s),(p21, p22, …, p2s), …,(pm1, pm2, …, pms)} [a1,b1] × [a2,b2] × …× [ak,bs] and assuming values in [0,1]. Then for every ε > 0, there exist k integers n1(ε), …, ns(ε) and related fuzzy partitions A 11 , A 12 , , A 1 n 1 ε , …, A s 1 , A s 2 , , A s n s ε such that the set P is sufficiently dense with respect to this fuzzy partitions. Moreover, for every pj = (pj1, pj2, …, pjs) P, j = 1, …, m, the following inequality holds.
f p j 1 , p j 2 , , p j s f n 1 ε n 2 ε F n s ε p j 1 , p j 2 , , p j s < ε
The inverse multi-dimensional F-transform f n 1 n 2 n s F can be used in regression analysis only if the input dataset is sufficiently dense with respect to the set of fuzzy partitions A 11 , A 12 , , A 1 n 1 ,   A 21 , A 22 , , A 2 n 2 ,     A s 1 , A s 2 , , A s n s .
In Figure 1 an example of data points not sufficiently dense with respect to the fuzzy partition is shown. Let A 11 , A 12 , , A 1 n 1   be a fuzzy partition of the domain [a1,b1] and A 21 , A 22 , , A 2 n 2   be a fuzzy partition of the domain [a2,b2]. The data points are shown in red. No data points are located within the subset a 1   h 1 , , a 1   h + 1 ×   a 2   k 1 , , a 2   k + 1 , corresponding to the dark yellow area in Figure 1. Consequently, for each data point pj = (pj1, pj2) j = 1, …, N we have A 1 h p j 1 = 0 and A 2 k p j 2 = 0 . Then, the data are not sufficiently dense with respect to this set of two fuzzy partitions.
In Figure 2 two examples of fuzzy partitions that are more coarse-grained with respect to the fuzzy partitions are shown in Figure 1. In both cases the data points are sufficiently dense with respect to the fuzzy partitions.
It is necessary to properly set the size of the fuzzy partitions. In fact, the use of fuzzy partitions that are too thin can make the data points not sufficiently dense with respect to them; on the contrary, fuzzy partitions that are too coarse grained, while guaranteeing the sufficient density of the data points, can significantly reduce the performances of the regression analysis methods in which the inverse multi-dimensional fuzzy transform is used as a regression function.

3. Multi-Dimensional F-Transform Methods to Explore Dependency and Rules in the Data

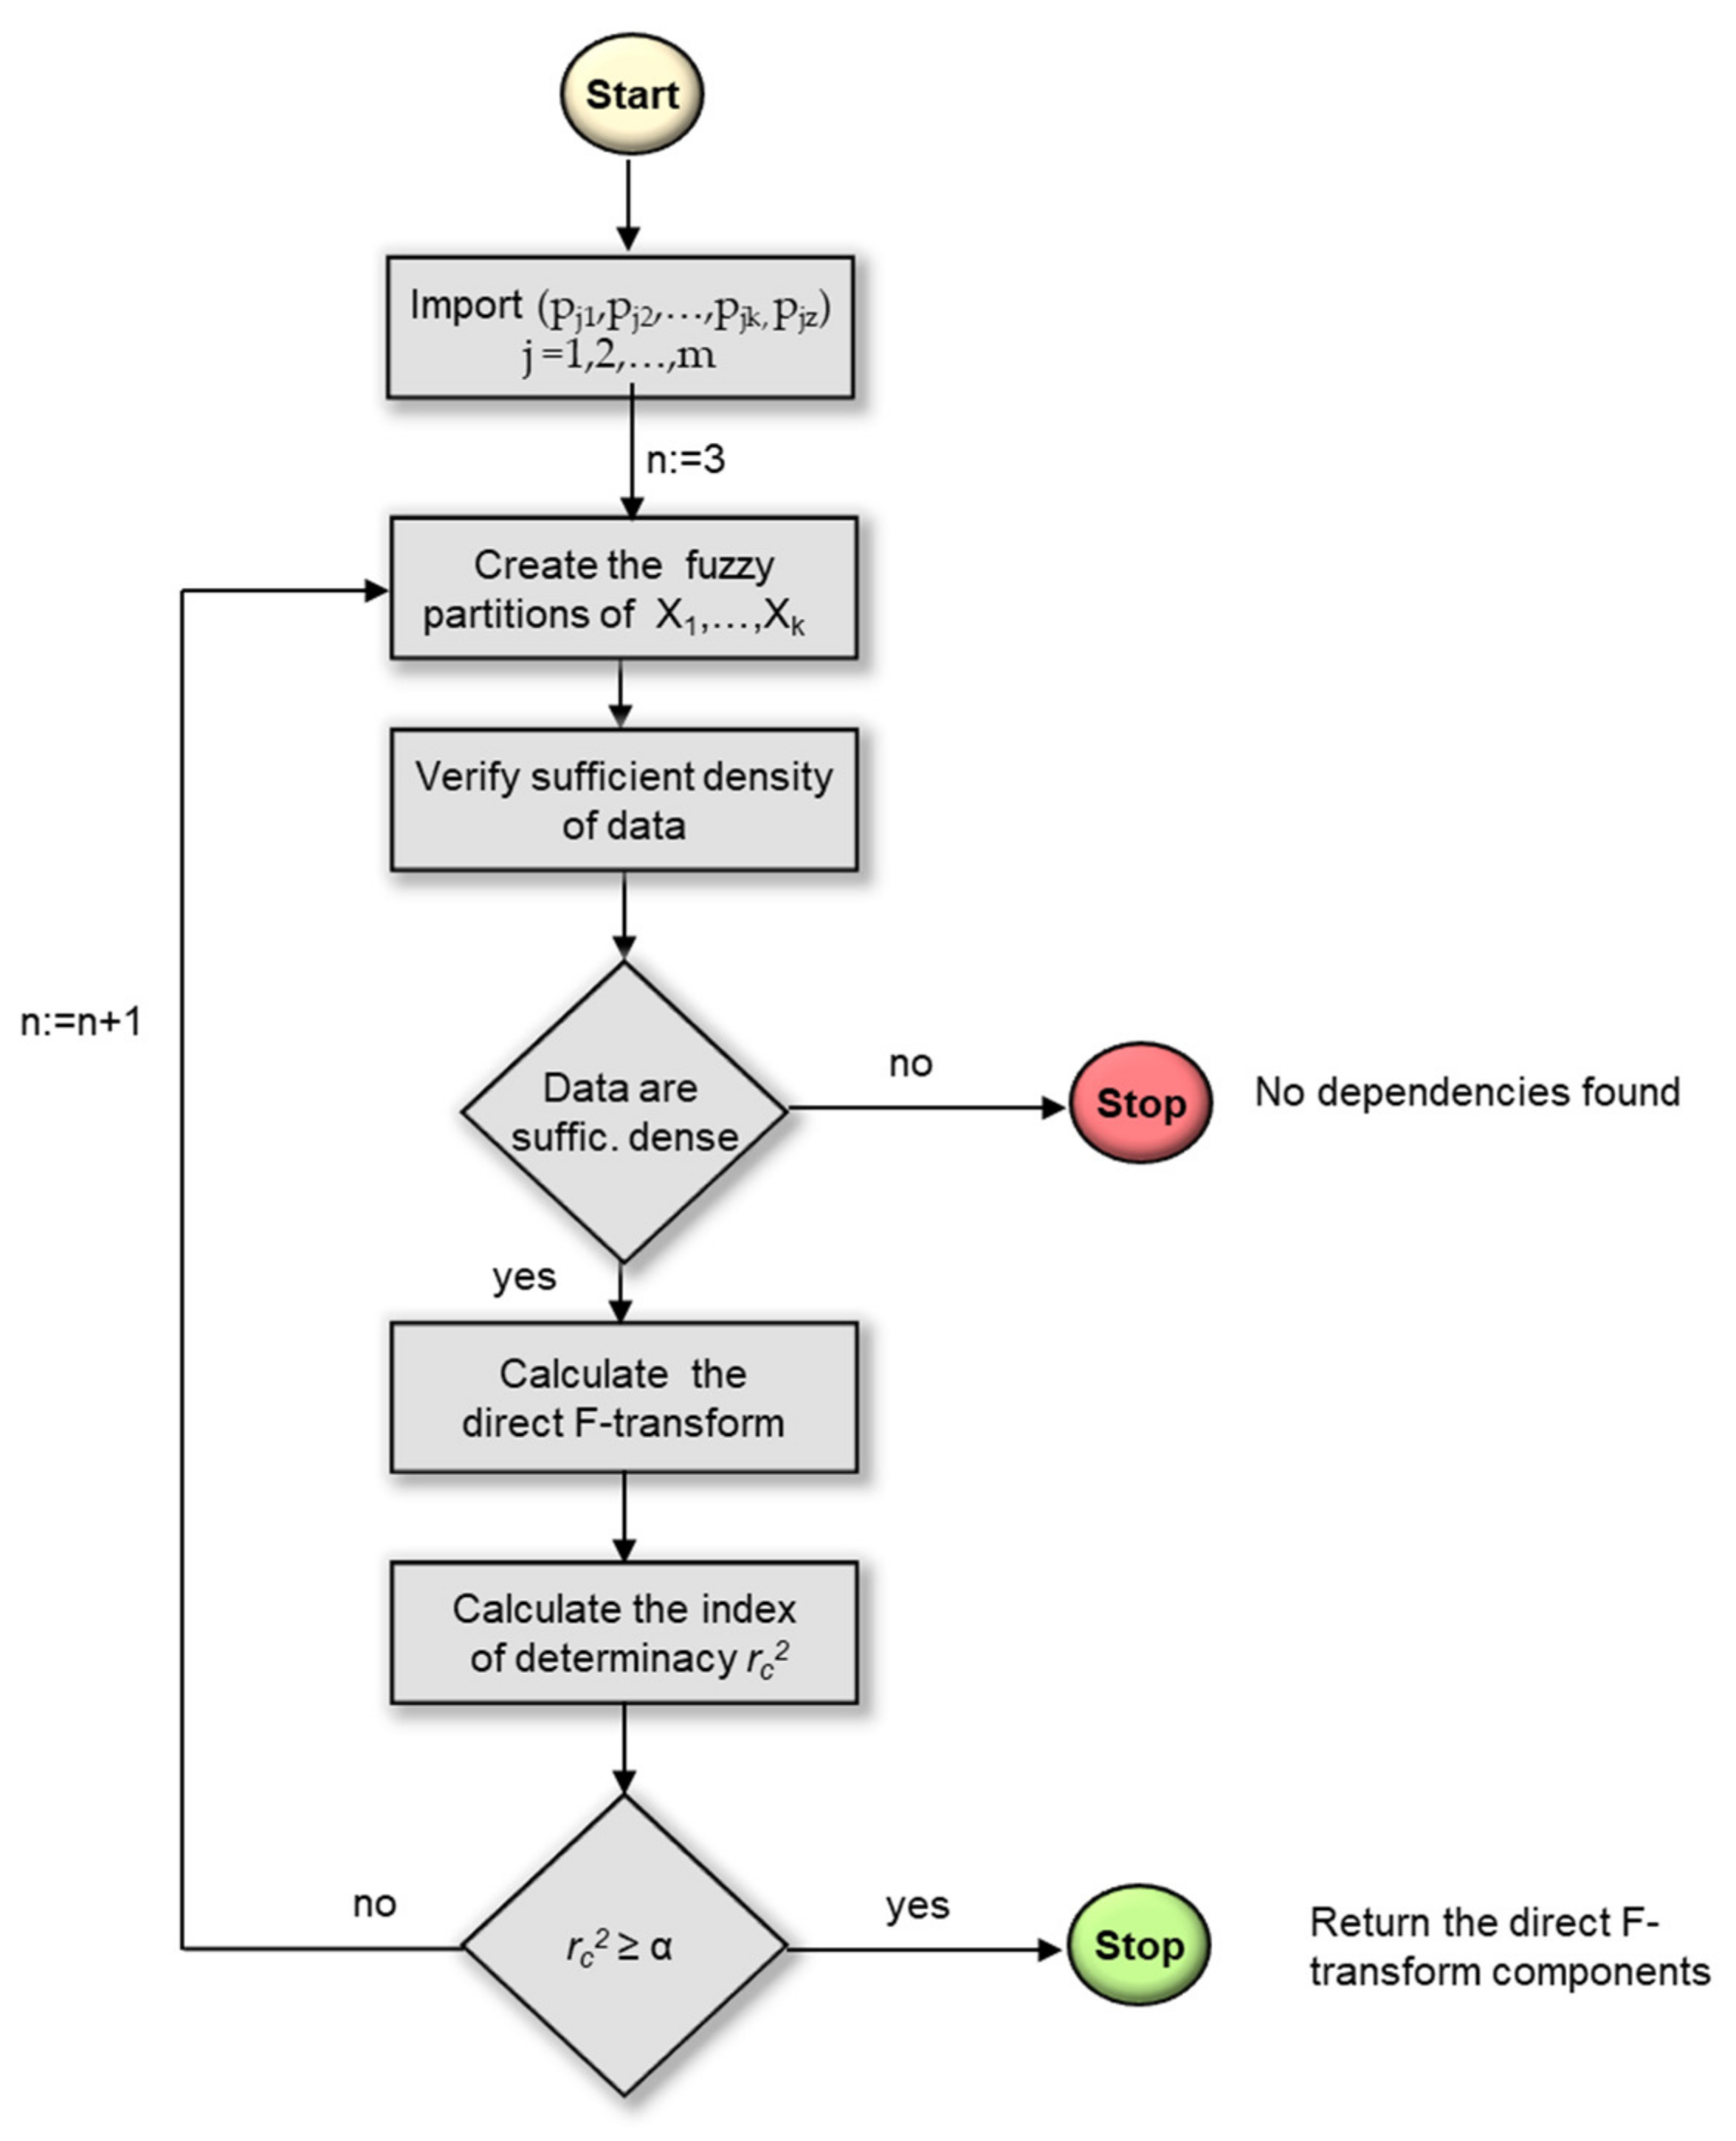
3.1. Multi-Dimensional F-Transform Techniques to Detect Dependency between Attributes in Datasets

The multi-dimensional F-transform was applied by many researchers to detect dependency among numerical features in datasets.
In [10,11] the multi-dimensional discrete F-transform is applied to find dependency between attributes in the data.
Following [10,11] a dataset with r features can be schematized as a relation with r attributes and m instances as in Table 1.
where X1, …, Xi, …, Xr are the attributes and, O1, …, Oj, …, Om (m > r) are the objects in the dataset; each object Oj is given by an r-dimensional data point (pj1, …, pji, …, pjr) where pji is the value assumed by Oj of the attribute Xi.
The attribute Xi is a variable assuming values in the real interval [ai,bi] defined by setting ai = min{p1i, …, pmi} and bi = max{p1i, …, pmi}.
In [10,11] the dependency is studied among attributes in the form:
X z = H X 1 ,   , X K
where H: [a1,b1] × [a2,b2] ×…× [ak,bk] → [az,bz] is a continuous function of k variables.
In [10] the multi-dimensional inverse F-transform was applied as a regression function to assess the functional dependency (12). The given function H(X1, …, Xk) is known in m points Pj = (pj1, pj2, …, pjk), j = 1, …, m, by setting H(pj1, pj2, …, pjk) = pjz for j = 1, 2, …, m.
For any interval [ai,bi], i = 1, …, k, a fuzzy partition { A i 1 , A i 2 , .... , A i n i } is created with ni ≥ 3. If the set of m points is sufficiently dense with respect to these fuzzy partitions, we can define the multi-dimensional direct F-transform of H with (h1, h2, …, hk)th components given by
F h 1 h 2 h k = j = 1 m p j z A 1 h 1 p j 1 A k h K p j k j = 1 m A 1 h 1 p j 1 A k h K p j k
Using Formula (10), the inverse F-transform H n 1 n 2 n k F of H in the point Pj is given by
H n 1 n 2 n k F p j 1 , p j 2 , p j k = h 1 = 1 n 1 h 2 = 1 n 2 h k = 1 n k F h 1 h 2 h K A 1 h 1 p j 1 A k h K p j k
In [10] a measure of the dependency of Xz from X1, …, Xk evauated by (14) is given by the statistical index of determinacy:
r c 2 = j = 1 m H n 1 n 2 n k F p j 1 , p j 2 , p jk p ^ z 2 j = 1 m p jz p ^ z 2
where p ^ z is the average of values p1z, p2z, …, pmz of the attribute Xz.
The index of determinacy r c 2 ranges in the interval [0,1], where r c 2   = 0 means that H n 1 n 2 n k F does not fit to the data and, conversely, r c 2 = 1 means that H n 1 n 2 n k F fits perfectly to the data.
A variation of the Formula (15) used in multiple regression analysis to take into account the number of independent variables k and the scale of the data sample is given by (Johnson and Wichern, 1998):
r c 2 = 1 1 r c 2 m 1 m k 1
This formula includes both the number of independent variables k and the scale of the data sample. The function H in the point (x1, x2, …, xk) is approximated by the following formula:
H n 1 n 2 n k F x 1 , x 2 , x k = h 1 = 1 n 1 h 2 = 1 n 2 h k = 1 n k F h 1 h 2 h K A 1 h 1 x 1 A k h K x k
In [10] the inverse multi-dimensional F-transform is applied to find dependency among attributes in the dataset containing economic data measured in the Czech Republic in quarters starting from 1997. The two indices of determinacy (15) and (16) are used to evaluate the existence of such dependency.
The results obtained show that the inverse multi-dimensional F-transform provides good performance used as a regression function for the analysis of the dependency between numerical attributes in the datasets. However, it is necessary to determine the optimal fuzzy partitions of the domains of the input attributes and check when the data points are not sufficiently dense. In [11] an algorithm has been proposed that finds the optimal fuzzy partitions and checks that the data points are sufficiently dense with respect to the fuzzy partition. This algorithm is schematized in Figure 3.
To reduce the computational costs, the same number n of fuzzy sets is assigned to each of the fuzzy partitions of the input attribute domains. Initially the minimum value n = 3 is set; in each cycle the algorithm checks that the data points are sufficiently dense with respect to the fuzzy partitions and, successively, calculates the direct multi-dimensional F-transform and, for each data point, the inverse multi-dimensional F-transform, finally measuring the value of the index of determinacy. If this value exceeds a predetermined α threshold, the algorithm ends by returning the components of the direct F-transform, otherwise a successive iteration is performed in which the number n is increased by one unit. If, during an iteration, the data points are not sufficiently dense with respect to the fuzzy partition, the algorithm terminates by reporting that it has not found the dependency of Xz on the attributes X1, ..., Xk.
In [11] this algorithm is executed to explore dependency between oceanographic and surface meteorological attributes of a dataset containing data measured from a series of buoys positioned throughout the Equatorial Ocean Pacific and used to analyze the El Nino/Southern Oscillation (ENSO) cycles.
The application of the multi-dimensional F-transform as a machine learning regression function can become expensive in the presence of massive datasets in which the number of data points and the number of features become higher. In a recent work [12] an extension of the algorithm is proposed in [11], called MFAD (Massive F-transform Attribute Dependency) aimed to find dependencies between numerical attributes in massive datasets. MFAD apply a uniform sampling algorithm to partition the dataset in subsets having the same cardinality. The F-transform attribute dependency algorithm [11] is executed on each subset returning the multi-dimensional direct F-transform components (13) and the index of determinacy (16). Let Fq be the direct F-transform vector obtained applying the F-transform attribute dependency algorithm on the qth subset, where q = 1, …, s.
The functional dependency of Xz from X1, X2, …, Xk in the form Xz = H(X1, X2, …, Xk) in a point (x1, x2, …, xk) is evaluated computing the following weighted average:
H F x 1 , x 2 , , x k = q = 1 s w p x 1 , x 2 , , x k H n q F x 1 , x 2 , , x k p = 1 s w q x 1 , x 2 , , x k
where H n q F x 1 , x 2 , , x k  q = 1, …, s is the value of the inverse multi-dimensional F-transform in the point (x1, x2, …, xk) obtained by (17) using the qth direct F-transfom Fq and the weighted term w q x 1 , x 2 , , x k ,  q = 1, …, s, is given by the formula:
w q x 1 , x 2 , , x k = r c q 2   if   x 1 , x 2 , , x k   D q   0   otherwise
The closed set Dq = [aq1,bq1] × [aq2,bq2] ×…× [aqk,bqk] is the domain in which is defined the qth subset and r c q 2 is the index of determinacy obtained by executing the F-transform attribute dependency algorithm on the qth subset.
The greater the index of determinacy r c q 2 , the greater the weight of the inverse multi-dimensional F-transform   H n q F x 1 , x 2 , , x k in the approximation of the function H in the point (x1, x2, …, xk). The weighted term (19) is null if the point (x1, x2, …, xk) is outside the domain Dq.
In Figure 4 the MFAD method is schematized. Each subset is treated separately by applying the F-transform attribute dependency algorithm. The regression function is constituted by the weighted average of the single inverse-fuzzy transforms where the weights are the values of the index of determinacy obtained for each subset.
To test the MFAD algorithm in [12] it was applied on a large dataset given by the Italian National Statistical Institute census database with 140 numerical features related to census characteristics and measured for all the 402,678 Italian census tracts enclosed. In their tests the authors execute the MFAD algorithm by varying the number s of subsets and compare the results with those ones obtained by applying the classical F-transform attribute dependency algorithm [11] to the entire dataset (s = 1). Table 2 show the final index of determinacy obtained by applying MFAD to explore the dependency of Xz = Families in owned residences on the attribute X1 = Resident population with job or capital income, setting a threshold α = 0.8.
Table 1 shows the value of the index of determinacy obtained for different values of the parameter s. The value of the index of determinacy obtained by running the attribute dependency algorithm on the entire dataset (s = 1) is 0.881. All the values of the resulting index of determinacy obtained applying MFAD with different number of datasets (from s = 8 to s = 40) are comparable with this value.
The results of tests performed in [12] on large datasets show that the performances are comparable with the ones obtained using the well-known Support Vector Regression (SVM) and Multilayer Perceptron (MLP) regression methods.

3.2. Multi-Dimensional F-Transform Techniques for Mining Association Rules

In [10] a method based on the multi-dimensional F-transform for mining association rules in the data is proposed. The inverse multi-dimensional F-transform (14) applied to find a dependency of the attribute Xz to the attribute X1, …, Xk in the form Xz = H(X1Xk) can be used to mine association rules.
However, unlike to the functions describing dependency between attributes, mining associations are fuzzy functions which establish a correspondence between universes of fuzzy sets.
Let U1, …, Uk be the domains of k attributes partitioned by fuzzy sets: a mining association functionally joins some fuzzy sets from partitions of U1Uk with fuzzy sets over respective F-transform components.
Let { A i h 1 , …, A i h i , …,   A i h i } be an uniform fuzzy partition of the domain of the ith attribute Xi constructed as basic functions of this domain. The fuzzy partition is obtained on the ni nodes xi1, …,   x i n i in the domain Ui.
Each association is supported by two parameters, namely the degrees of support r and confidence γ defined below. In [10] the multi-dimensional F-transform is applied in order to discover associations rules in the following form:
X 1   i s   A 1 h 1 A N D X 2   i s   A 2 h 2 A N D   ..   A N D X k   i s   A k h k F m e a n X z   i s   C
where A i h i , i = 1, …, k, models the meaning of the linguistic expression “approximately x h i ”. The corresponding logic clause can be read as “Xi is approximately x h i .
The label C in the consequent is one of the following linguistic expressions characterizing the (h1, …, hk)th component of the F-transform: Sm (small), Me (medium), Bi (big); it is eventually combined with one of the following linguistic hedges: Ex (extremely), Si (significantly), Ve (very), empty hedge, ML (more or less), Ro (roughly), QR (quite roughly), VR (very roughly). Let Oj, j = 1, 2, …, m, be the jth data point with component (pj1, pj2, …, pjk, pjz).
To measure the strength of the fuzzy rule (20), in [10] a membership function of an induced fuzzy set on the set of m data points {O1, …, Om} is defined by considering the antecedent of the hth rule (20):
A h ( O j ) = A 1 h 1 ( p j 1 ) A k h k ( p j k )
where A i h i ( p j i ) is the membership degree to the fuzzy set A i h i of the ith attribute in the jth data point. The following value
r = c a r d O j | A h ( O j ) > 0 m
is called degree of support of the association rule (20). If F h 1 h 2 h k is the (h1, …, hk)th component of the direct F-transform (13) and
f n 1 n 2 n k F O j = h 1 = 1 n 1 h 2 = 1 n 2 h k = 1 n k F h 1 h 2 h K A 1 h 1 p j 1 A k h K p j k
is the inverse F-transform on the point (pj1, …, pjk), in (Perfilieva et al., 2008) the degree of confidence of the association rule (20) is defined as
γ = j = 1 m f n 1 n 2 n k F O j F h 1 h 2 h K 2 A 1 h 1 p j 1 A kh K p jk j = 1 m p jz F h 1 h 2 h K 2 A 1 h 1 p j 1 A kh K p jk
The strength of the hth association rule is evaluated by measuring the degree of support r and the degree of confidence γ. If both the two parameters are greater or equal to a degree of support threshold and a degree of confidence threshold, respectively, the association is found.
In [10] this method is tested on a dataset of measures of air pollution produced on a road related to traffic volumes and weather conditions, collected by the Norwegian Public Roads Administration.

4. F-Transform Techniques for Time Series Analysis

Time series forecasting involves methods for fitting over historical data referring to measures of an observable series and using them to predict future observations.
A time series is given by a set of data measured at different times listed in time order. Let y be a measured parameter and y(t) the measure performed at the time t. A time series is a function y: tNy(t)∈ R known in n regular time steps y(1), y(2), …, y(n), where y(i), i = 1, 2, …, n, is the measured value of y at the ith time step.
Time series forecasting techniques assess the value of y in the n future time steps y(n + 1), ..., y(n + m), where the value y(t + 1) at the step t + 1 is evaluated as a function of the previous p + 1 measured values y(t), y(t − 1), ..., y(tp). Let y(t), t = 1, 2, …, T, be a time series. It can be decomposed by following two terms:
y t = f t + r t
The term f(t) is a deterministic part, called trend; the term r(t) is an additional random function called residuals, giving the random error with respect to the trend at the time t. A general model of a stationary time series y(t) as a linear function of the p + 1 measured values y(t), y(t − 1), ..., y(tp) is the Auto-Regressive of order p model AR(p), given by ([13,14]):
y t = α 1 y t 1 + + α p y t p + ε t
The p coefficients α1, …, αp must satisfy some constraints and the term εt is the statistical white noise giving the fluctuations in the observations that cannot be explained by the model.

4.1. One-Dimensional F-Transform Time Series Models

In [15,16] the one-dimensional F-transform is applied to approximate the trend f(t) in (25). Let {y(t), t = 1, 2…, T} be a time series given by a set of data y(t) measured in T regular time intervals. Let {t1 = 1, t2, …, tn = T} be a set of n nodes of the interval [1,T], where 3 ≤ n ≤ T, and {A1, ..., An} be the basic functions of a uniform fuzzy partition of the interval [1,T].
If the dataset given by the time series {y(t), t = 1, 2…, T} is sufficiently dense with respect to this fuzzy partition, then there exists the direct one-dimensional F-transform of f with components
F k = i = 1 T y t A k t i = 1 T A k t       k = 1 , 2... , n
Let Pk, k = 1, ..., n, be a subset of {1, 2, …, T} given by the time steps t, being Ak(t) > 0, as
P k = t T A k ( t ) > 0
We can decompose y(t) as:
y t = k = 1 n F k + r t k
where rtk is the kth residual of yt with respect to Ak given by
r t k = y t F k   i f   t P k    otherwise
Based on the autoregressive model (26), in [15,16] the kth component Fk is given by a linear combination of the p previous components. The trend at the kth time step is assessed by
F k = α 1 F k 1 + α 2 F k 2 + + α p F k p k = p + 1 ,   , n
In [15,16] p = 3 is set as well. The calculated value for Fn are used to forecast the unknown value Fn+1 as
F n + 1 = α - 1 F n + α - 2 F n 1 + α - 3 F n 3
The values α ˜ 1 , α ˜ 2 , α ˜ 3   chosen for the three coefficients α 1 , α 2 , α 3   minimize the absolute difference between the predicted and the calculated values of Fn. In [15] a numerical method and a Multilayer Perceptron neural network are used to find the optimal values of the coefficients α1, α2, α3. In [16] a method based on fuzzy relations is proposed to find the best values of the three coefficients.
In [16] comparisons with the autoregressive model ARIMA and with other time series fuzzy-based models are performed; the MAPE and SMAPE indexes are used to measure the forecast errors; the authors showed that their F-transform-based time series prevision model has the best performances.
In [17] the one-dimensional F-transform is proposed to filter the high frequencies in the time series. A time series can be additively decomposed into three components: trend cycle, a seasonal component, and noise. The authors prove that the one-dimensional F-transform acts as a low-pass filter, removing or significantly reducing the seasonal and noise components; then, the inverse F-transform optimally approximates the trend component.

4.2. Multi-Dimensional F-Transform Time Series Model

In [17] a time series forecasting model based on the multi-dimensional F-transform is proposed. The authors applied their method to the well-known Mackey-Glass time series generated by the differential equation:
d y d t = 0.2 y t τ 1 + y 10 t τ 0.1 y t  
In [18] the function y(t) is approximated by previous t-6 values y(t − 6), y(t − 5), …, y(t − 1) by constructing a multi-dimensional F-transform to approximate the output variable y as a function of six variable xi = y(ti), i = 1, …, 6.
To construct the components of the direct multi-dimensional F-transform the N points x 1 j , x 2 j , , x 6 j , y j are considered, where j = 1, …, N. They are given by
F h 1 h 2 h 6 = j = 1 N y j A 1 h 1 x 1 j A 6 h 6 x 6 j j = 1 N A 1 h 1 x 1 j A 6 h 6 x 6 j
The inverse F-transform is given by
f n 1 n 2 n 6 F x 1 j 1 , x 2 j , , x 6 j = h 1 = 1 n 1 h 2 = 1 n 2 h 6 = 1 n 6 F h 1 h 2 h 6 A 1 h 1 x 1 j A 6 h 6 x 6 j
To assess the value of the function y(t) at the time t considering the value obtained in the six previous time steps: xi = y(ti) i = 1, …, 6, the Formula (35) is applied by obtaining the following:
y ˜ = f n 1 n 2 n 6 F x 1 , x 2 ,   , x 6 = h 1 = 1 n 1 h 2 = 1 n 2 h 6 = 1 n 6 F h 1 h 2 h 6 A 1 h 1 x 1 A 6 h 6 x 6
In [18] the authors compare the results obtained by applying this method to the Mackey-Glass time series with those ones obtained by using the well-known Wang and Mendel method and with the results obtained using a local Wavelet Neural Network with three layers, six input nodes, 10 hidden nodes and one output node. They measure the MAPE, RMSE and MADMEAN indices, showing that the multi-dimensional time series method has the best performances.
The multi-dimensional fuzzy transform method [18] can be generalized for any function considering a dependency on k input parameters. In [19] it is applied for forecasting problems in spatial analysis. The framework proposed in [19] is schematized in Figure 5.
The area of study is partitioned in subzones. For each subzone a training dataset with the measure of characteristics of the subzone in a specified period is extracted. Then, the time series correspondent to a measured characteristic f(t) from a time t = 0 to t = T is constructed and the multi-dimensional F-transform prediction method [17] is applied to assess the value of f at the time T + Δt. The RMSE and the MADMEAN are used to evaluate the performances of the forecasting model. Finally, two thematic maps of the predicted value of the characteristic at the time T + Δt and of the prediction error in each subzone are given after performing a fuzzification process. This approach is encapsulated in a Geographical Information System and is tested in [19] to analyze the demographical balance data measured every month in the period 1 January 2003–31 October 2014 in the municipalities of Cilento and Vallo di Diano National Park located in the province of Salerno (Italy). The birth-rate and death-rate in November 2014 in each municipality are evaluated. The mean RMSE obtained is under 0.01.

4.3. F-Transform Seeasonal Time Series Model

In some time series a phenomenon called seasonality is present, given by a repetitive and regular pattern of changes that repeats over S time periods. For example, in a monthly time series S = 12, in an hourly time series S = 24, and so on.
Some well-known statistical models as the Seasonal Auto Regressive Integrated Moving Average (SARIMA) models [20,21] are used to forecast the value of the output variable at a time t as a combination of the trend with a seasonal component.
In [22] a seasonal time-series forecasting method based on F-transforms is proposed as Time Series Seasonal F-transform (TSSF). A polynomial best fit is applied to extract the trend; then the data are de-trended, subtracting the trend from the time series and the de-treated time series is partitioned in S subsets. The one-dimensional F-transform is applied to each subset to assess the correspondent seasonality.
To assess the value of the output variable y at the time t included in the sth season, with s in {1, 2, …, S}, we calculate the inverse F-transform f n s F t .
Let {(t(1), y(1)), (t(2), y(2)) ...(t(Ms), y(Ms))} be the de-treated sth subset with cardinality Ms, where y(j), j = 1, …, Ms, is given by difference between the original measure obtained at the time t(j) and the trend calculated at that time.
Let Fh, where h = 1, 2, …, n(s), be the hth component of the one-dimensional direct F-transform calculated by using a fuzzy partition of n(s) basic functions of the domain of the sth subset. The one-dimensional inverse F-transform calculated at the time t is given by
f n s F t = h = 1 n s F h A h t
The forecasted value y ˜ 0 t   of the output y0 at the time t included in season s is
y ˜ 0 t = f n s F t + t r e n d t
where the term trend(t) is the assessed value of the trend of the time series at the time t.
In the TSSF model, to verify that each subset of data is sufficiently dense with respect to the fuzzy partition and to find the best fuzzy partition, is applied the technique proposed in [11]. To find the best fuzzy partition for each subset the MADMEAN measure is calculated, being
      M A D M E A N S = j = 1 M s f n s F t j y j j = 1 M s y j
The number of fuzzy sets of the initial fuzzy partition is set to 3; then, the sufficient density of the data with respect to the fuzzy partition is verified and the direct F-transform is calculated. The inverse F-transform in each time t(j), where j = 1, …, Ms, is calculated by Formula (37) and, finally, the MADMEAN index (39) is measured. If the MADMEAN index is greater than a fixed threshold, then the process stops and the direct F-transform components are stored; otherwise, the number of fuzzy sets of the fuzzy partition n(s) is increased by one unit and the previous steps are iterated. This process is executed for each seasonal subset.
In Figure 6 the flow diagram of the TSSF model is shown.
In [22] many comparison tests are performed comparing the performance of TSSF with the ones measured executing other forecasting algorithms applied to seasonal time series. Comparisons are executed with respect to the statistical Average Seasonal Variation (avgSV) and Seasonal ARIMA models [21], the model based on the multi-dimensional F-transform (MF-tr) [18] and the soft computing forecasting models Support Vector Machine (SVM) [23] and Automatic Design of Artificial Neural Networks (ADANN) [24]. Table 3 shows the RMSE obtained applying these models on a set of 14 seasonal time series giving the daily mean temperature measured by 14 weather monitoring stations located in the province of Genova (Italy). In each experiment, the month is used as seasonality and each dataset is partitioned in twelve subsets.
The results in Table 2 show that the TSSF’s performances are better than the ones obtained by using the avgSV, SARIMA and F-transform and comparable with those ones obtained by using SVM and ADANN. In addition, SVM and ADANN are computationally more complex to manage than TFSS. A critical point of TSFF is its inability to manage irregular time series, in which it is complex to evaluate time series patterns in the data.
In [9] an extension of the TFSS model has been proposed, based on the use of the first-order F-transform. This model improves the performance of the TFSS model but increases its computational complexity.

5. F-Transform in Data Classification

In Section 3 we analyzed techniques that use the multi-dimensional F-transform as a regression function to explore dependency between data ([10,11]). In [25] a classification method based on the use of the multi-dimensional F-transform is proposed. The proposed algorithm, called MFC (Multi-dimensional F-transform Classification), compute the direct and inverse multi-dimensional F-transforms to classify data points.
The learning dataset is given by a set of data points characterized by a pair (X,Y), where X is a vector of s numerical features (X1, … Xs) and Y is the class feature designated as class which has C categories, labelled with the values 1, 2, …, C.
The multi-dimensional F-transform is applied to explore a relation between attributes in the form:
Y = f x 1 ,   , x s
where f is a discrete function f: [a1,b1] × [a2,b2] ×…× [as,bs] → {1, 2, ..., C} with xi    [ai,bi] i = 1, …, s, and Y     {1, 2, ..., C}.
MFC uses the multi-dimensional inverse F-transform to approximate the function f. To avoid the over-fitting problem is applied the K-fold cross validation resampling algorithm to control this presence.
K-fold cross validation is a well-known resampling technique in which the dataset is partitioned into K subsets of equal size called folds. The classification algorithm is iterated K times. At any iteration of a fold constitutes the validation set and the union of the other K-1 folds forms the training set, used to train the classifier. With respect to other resampling techniques, K-fold is more efficient in dealing with the over-fitting problem, as in K-fold each fold is treated once as a validation set.
Let P = (p1, p2, …, ps) be a data point. Formally, if F k is the multi-dimensional direct F-transform calculated by using the kth fold and f n 1 n 2 n s F k p 1 , p 2 , , p s is the value of the multi-dimensional inverse F-transform calculated in P, then, an average of the K inverse F-transforms in the point P is calculated as
f n 1 n 2 n s p 1 , p 2 , , p s = 1 K k = 1 K f n 1 n 2 n s F k p 1 , p 2 , , p s
The point P is classified in the class labeled c*, where
c * = a r g m i n c = 1 , , C f n 1 n 2 n s p 1 , p 2 , , p s c
To evaluate the performance of the classifier for each fold two index C V 1 k and C V 2 k  k = 1, …, K are calculated, where
-
C V 1 k   is the percentage of all the misclassified data points in the kth training set;
-
C V 2 k   is the percentage of all the misclassified data points in the kth validation set.
The final index giving the average of the percentage of misclassified data points in the training sets is
C V 1 = 1 K k = 1 K CV 1 k
and the final index giving the average of the percentage of misclassified data points in the validation sets is
C V 2 = 1 K k = 1 K CV 2 k
CV1 and CV2 are used to evaluate the performances of MFC. If CV1 is under a fixed threshold α and CV2 is under a fixed threshold β, then the algorithm stops, else a finer set of fuzzy partitions of the domains of the s input variables is constructed and the process is iterated.
In Figure 7 we show the flow diagram of MFC.
In [25] comparison tests are performed on over 100 classification datasets extracted from the University of California, Irvine (for short, UCI) Machine Learning and from the Knowledge Extraction Evolution Learning repositories.
In Table 4 are shown the mean accuracy, precision and recall classification measures obtained by running MFC, Decision tree-based J48 [26], Multi-Layer Perceptron [27], naive Bayes [28] and Lazy K-Nearest Neighbor IBK [29].
These results show that MFC provides classification performance better than those ones obtained by using the naive Bayes and Lazy IBK algorithms. They are comparable with the results obtained by the Decision tree J48 and the Multilayer Perceptron algorithms.
A weak point of MFC algorithm is its high computational complexity which makes it unsuitable to manage massive and high-dimensional datasets.
The integration with data compression and feature selection approaches in the pre-processing phase can reduce these high computational costs. An approach that integrates Principal Component Analysis (PCA) feature reduction techniques with higher-degree F-transform has been proposed in [30] in image classification. A mixed model that integrates higher-degree F-transform and PCA techniques could be tested in data classification to reduce the number of features and improve the accuracy and precision of the classifier model, without significantly increasing the time consumption.

6. Conclusions

This paper presents a summary of the data analysis techniques proposed in the literature based on the use of the F-transform in one or more dimensions. We initially presented the definition of one-dimensional direct and inverse F-transform, showing how it can be used to approximate a continuous function on a real interval. We then extended this concept to the multi-dimensional F-transform, showing how it can be used in regression analysis. In particular, attention was paid to the constraint of sufficient data density with respect to fuzzy partitions, which is extremely important for the choice of the optimal cardinality of fuzzy partitions. Then, the methods proposed in the literature for the analysis of the dependency between attributes in the data and for the extraction of association rules through the use of direct and inverse multi-dimensional F-transforms were presented and analyzed. An extensive discussion was devoted to the different time series analysis techniques based on the F-transforms proposed in the literature. Finally, a classification method recently presented in the literature based on the multi-dimensional F-transform was described.
The use of F-transform-based approaches in data analysis still remains an evolving research field. We foresee that in the future new approaches based on the use of the F-transform may be presented that reduce the time-consumption and computational complexity that currently, on the one hand, prevent the application of these techniques to massive and high dimensional data and on the other hand allow to also use high-orders F-transforms in data analysis, improving the performance obtained using the zero-order F-transform. In the future, hybrid strategies of using the high-order F-transform and reducing the data size could lead to an optimal trade-off between the quality of the results and the processing times.
In the future, the multidimensional zero and high-order fuzzy transform methods may be included into soft computing hybrid models for the analysis of risk prediction and damage assessment proposed in recent soft computing risk analysis and forecasting models such as damage assessment of existing buildings [31] and entity assessment of the damage that can be produced on them by seismic events [32]. Moreover, fuzzy transform methods can be applied for the solution of fuzzy differential equations [33] and fuzzy partial equations [34] in data analysis models for complex systems.

Author Contributions

The contributions of the three authors F.D.M., I.P. and S.S. are summarized below: conceptualization, F.D.M., I.P. and S.S..; methodology, F.D.M., I.P. and S.S.; software, F.D.M., I.P. and S.S.; validation, F.D.M., I.P. and S.S.; formal analysis, F.D.M., I.P. and S.S.; investigation, F.D.M., I.P. and S.S.; resources, F.D.M., I.P. and S.S..; data curation, F.D.M., I.P. and S.S.; writing—original draft preparation, F.D.M., I.P. and S.S.; writing—review and editing, F.D.M., I.P. and S.S.; visualization, F.D.M., I.P. and S.S.; supervision, F.D.M., I.P. and S.S. All authors have read and agreed to the published version of the manuscript.

Funding

This research received no external funding.

Acknowledgments

The work of Irina Perfilieva was partially supported by the project AI-Met4AI, CZ.02.1.01/0.0/0.0/17-049/0008414.

Conflicts of Interest

The authors declare no conflict of interest.

Appendix A. Table of Acronyms and Abbreviations

In Table A1 are listed the acronyms and abbreviation terms used in the text.
Table A1. Acronyms and abbreviations.
Acronym/Abbreviation Explanation
F-transformFuzzy transform
Multidimensional F-transformMulti-dimensional Fuzzy transform
MFADMassive F-transform Attribute Dependency method
SVMSupport Vector regression Method
MLPMultiLayer Perceptron method
avgSVAVeraGe Seasonal Variation model
SARIMASeasonal AutoRegressive Integrated Moving Average model
MF-trMulti-dimensional Fuzzy TRansform forecasting model
TFSSTime Series Seasonal time series F-transform model
ADANNAutomatic Design of Artificial Neural Networks model
MFCMultidimensional F-transform Classification method
UCIUniversity of California, Irvine
K-foldCross-validation K-fold resampling method applied in classification.
Naïve BayesNaïve Bayesian classification method
J48Decision tree J48 classification algorithm in the Weka data mining tool.
Lazy IBKLazy K-Nearest Neighbor Instance-Bases learning with parameter K classification method.
PCAPrincipal Component Analysis.

References

  1. Perfilieva, I.; Haldeeva, E. Fuzzy transformation. In Proceedings of the IFSA World Congress and 20th NAFIPS International Conference, Joint 9th, Vancouver, Canada, 25–28 July 2001; IEEE: Piscataway, NJ, USA, 2001; Volume 4, pp. 1946–1948. [Google Scholar]
  2. Perfilieva, I. Fuzzy transforms: Theory and applications. Fuzzy Sets Syst. 2006, 157, 993–1023. [Google Scholar] [CrossRef]
  3. Di Martino, F.; Sessa, S. Fuzzy Transforms for Image Processing and Data Analysis. Core Concepts, Processes and Applications; Springer: Cham, Switzerland, 2020; p. 217. [Google Scholar] [CrossRef]
  4. Bede, B.; Rudas, I.J. Approximation properties of fuzzy transforms. Fuzzy Sets Syst. 2011, 180, 20–40. [Google Scholar] [CrossRef]
  5. Khastan, A. A new representation for inverse fuzzy transform and its application. Soft Comput. 2017, 21, 3503–3512. [Google Scholar] [CrossRef]
  6. Perfilieva, I.; Dankova, M.; Bede, B. Towards a higher degree f-transform. Fuzzy Sets Syst. 2020, 180, 3–19. [Google Scholar] [CrossRef]
  7. Alikhani, R.; Zeinali, M.; Bahrami, F.; Shahmorad, S.; Perfilieva, I. Trigonometric fm-transform and its approximative properties. Soft Comput. 2017, 21, 3567–3577. [Google Scholar] [CrossRef]
  8. Zeinali, M.; Alikhani, R.; Bahrami, F.; Shahmorad, S.; Perfilieva, I. On the structural properties of fm-transform with application. Fuzzy Sets Syst. 2018, 342, 31–52. [Google Scholar] [CrossRef]
  9. Di Martino, F.; Sessa, S. Seasonal Time Series Forecasting by F1-Fuzzy Transform, Special Issue Intelligent Systems in Sensor Networks and Internet of Things. Axioms 2019, 19, 3611. [Google Scholar]
  10. Perfilieva, I.; Novàk, V.; Dvoràk, A. Fuzzy transforms in the analysis of data. Int. J. Approx. Reason. 2008, 48, 36–46. [Google Scholar] [CrossRef] [Green Version]
  11. Di Martino, F.; Loia, V.; Sessa, S. Fuzzy transforms method and attribute dependency in data analysis. Inf. Sci. 2010, 180, 493–505. [Google Scholar] [CrossRef]
  12. Di Martino, F.; Sessa, S. Attribute dependency data analysis for massive datasets by fuzzy transforms. Soft Comput. 2021. [Google Scholar] [CrossRef]
  13. Wold, H. A Study in Analysis of Stationary Time Series. R. Stat. Soc. 1939, 102, 295–298. [Google Scholar]
  14. Wei, W.W.S. Time Series Analysis Univariate and Multivariate Methods, 2nd ed.; Pearson Addison Wesley: Boston, MA, USA, 2006; p. 605. ISBN 0-321-32216-9. [Google Scholar]
  15. Perfilieva, I.G.; Yarushkina, N.G.; Afanasieva, T.V. In Proceedings of International Conference on Fuzzy Systems, Barcelona, Spain, 18–23 July 2010.
  16. Perfilieva, I.; Yarushkina, N.; Afanasieva, T.; Romanov, A. Time series analysis using soft computing methods. Int. J. Gen. Syst. 2013, 42, 687–705. [Google Scholar] [CrossRef]
  17. Novàk, V.; Perfilieva, I.; Kreinovich, V. Filtering out high frequencies in time series using F-transform. Inf. Sci. 2014, 274, 192–209. [Google Scholar] [CrossRef] [Green Version]
  18. Di Martino, F.; Loia, V.; Sessa, S. Fuzzy transforms method in prediction data analysis. Fuzzy Sets Syst. 2011, 180, 146–163. [Google Scholar] [CrossRef]
  19. Di Martino, F.; Sessa, S. Fuzzy transform prediction in spatial analysis and its application to demographic balance data. Soft Comput. 2017, 21, 3537–3550. [Google Scholar] [CrossRef] [Green Version]
  20. Ziegel, E.R.; Box, G.E.P.; Reinsel, G.C.; Jenkins, S. Time Series Analysis, Forecasting, and Control. Technometrics Taylor Fr. Milton Park 1995, 37, 238–239. [Google Scholar] [CrossRef]
  21. Box, G.E.P.; Jenkins, G.M.; Reinsel, G.C. Time Series Analysis: Forecasting and Control, 5th ed.; Prentice Hall: Englewood Cliffs, NJ, USA, 2015; p. 712. ISBN 978-1-118-67502-1. [Google Scholar]
  22. Di Martino, F.; Sessa, S. Time series seasonal analysis based on fuzzy transforms. Symmetry 2017, 9, 281. [Google Scholar] [CrossRef] [Green Version]
  23. Pai, P.F.; Lin, K.P.; Lin, C.S.; Chang, P.T. Time series forecasting by a seasonal support vector regression model. Exp. Syst. Appl. 2010, 37, 4261–4265. [Google Scholar] [CrossRef]
  24. Štepnicka, M.; Cortez, P.; Peralta Donate, J.; Štepnickova, L. Forecasting seasonal time series with computational intelligence: On recent methods and the potential of their combinations. Exp. Syst. Appl. 2013, 40, 1981–1992. [Google Scholar] [CrossRef] [Green Version]
  25. Di Martino, F.; Sessa, S. A classification algorithm based on multi-dimensional fuzzy transforms. Ambient Intell. Humaniz. Comput. 2021. [Google Scholar] [CrossRef]
  26. Bhargawa, N.; Sharma, G.; Bhargava, R.; Mathuria, M. Decision Tree Analysis on J48 Algorithm for Data Mining. Int. J. Adv. Res. Comput. Sci. Softw. Eng. 2013, 3, 1114–1119. [Google Scholar]
  27. Pal, S.K.; Mitra, S. Multilayer perceptron, fuzzy sets, and classification. IEEE Trans. Neural Netw. 1992, 3, 683–697. [Google Scholar] [CrossRef] [PubMed]
  28. Murphy, K.P. Machine Learning: A Probabilistic Perspective (Adaptive Computation and Machine Learning Series), 1st ed.; The MIT Press: London, UK, 2012; p. 1070. ISBN 978-0262018029. [Google Scholar]
  29. Aha, D.W. (Ed.) Lazy Learning; Kluwer Academic Publishers: Norwell, MA, USA, 1997; p. 436. ISBN 978-0792345848. [Google Scholar]
  30. Hurtik, P.; Molek, V.; Perfilieva, I. Novel dimensionality reduction approach for unsupervised learning on small datasets. Pattern Recognit. 2020, 103, 107291. [Google Scholar] [CrossRef]
  31. Harirchian, E.; Ehsan, S.; Hosseini, A.; Jadhav, K.; Kumari, V.; Rasulzade, S.; Işık, E.; Wasif, M.; Lahmer, T. A review on application of soft computing techniques for the rapid visual safety evaluation and damage classification of existing buildings. J. Build. Eng. 2021, 43, 102536. [Google Scholar] [CrossRef]
  32. Harirchian, E.; Lhamer, T. Developing a hierarchical type-2 fuzzy logic model to improve rapid evaluation of earthquake hazard safety of existing buildings. Structures 2020, 28, 1384–1399. [Google Scholar] [CrossRef]
  33. Georgieva, A. Application of Double Fuzzy Natural Transform for Solving Fuzzy Partial Equations, AIP Conference Proceedings; AIP Publishing: Melville, NY, USA, 2021; Volume 2333, p. 080006. [Google Scholar] [CrossRef]
  34. Mazandarani, M.; Xiu, L. A Review on Fuzzy Differential Equations. IEEE Access 2021, 9, 62195–62211. [Google Scholar] [CrossRef]
Figure 1. Example of non sufficiently dense data points with respect to the fuzzy partitions.
Electronics 10 01771 g001
Figure 2. Examples of data points sufficiently dense with respect to the fuzzy partitions.
Electronics 10 01771 g002
Figure 3. Flow diagram of the algorithm proposed in [11].
Electronics 10 01771 g003
Figure 4. Schema of the MFAD method proposed in [12].
Electronics 10 01771 g004
Figure 5. Schema of the framework proposed in [19].
Electronics 10 01771 g005
Figure 6. Flow diagram of the TSSF model in [22].
Electronics 10 01771 g006
Figure 7. Flow diagram of the MFC algorithm [25].
Electronics 10 01771 g007
Table 1. Schema of a relation with r attributes and m instances.
X1...Xi...Xr
O1p11.p1i.p1r
......
......
......
Ojpj1.pji.pjr
......
......
......
Ompm1.pmi.pmr
Table 2. Values of the index of determinacy applying MFAD for different values of the parameter s [12].
sIndex of Determinacy
10.881
80.872
90.872
100.874
110.875
130.877
160.878
200.878
260.875
400.872
Table 3. RMSE in six methods for the mean temperature in 14stations in the province of Genova (Italy).
StationRMSE
avgSVSARIMAMF-tr.TSSFSVMADANN
Alpe Gorreto2.981.201.490.840.810.83
Campo Ligure2.741.091.340.760.710.76
Barbagelata3.251.301.570.890.840.90
Camogli3.391.381.680.950.880.86
Campo ligure3.021.201.490.830.770.79
Carlasco2.911.151.420.800.770.76
Chiavari2.781.121.390.780.730.77
Genova Bolzaneto2.951.161.410.810.770.75
Genova Pegli3.341.291.640.940.890.88
Panesi3.201.291.560.870.840.83
Rapallo2.711.081.330.750.780.84
Rovegno2.941.181.450.820.820.80
Tigliolo3.061.241.520.850.800.85
Viganego3.171.281.570.880.820.83
Table 4. Mean accuracy, precision and recall with 5 classification algorithms.
Algorithm Accuracy Precision Recall
MFC Classifier98.15%98.09%97.36%
Decision tree J4898.38%98.17%97.51%
Multilayer Perceptron98.22%98.23%97.48%
Naive Bayes96.55%91.89%90.65%
Lazy IBK97.17%93.30%91.44%
Publisher’s Note: MDPI stays neutral with regard to jurisdictional claims in published maps and institutional affiliations.

