Method for Assessment of Water Supply Diversification
Abstract
1. Introduction
- Siq—36 m3/h;
- Wadi Shab Qais—30 m3/h;
- Ain Braq—0.8 m3/h;
- Ain Dabdabah—2.5 m3/h;
- Ain Ammon i Ain Siyagh—<1.0 m3/h.
2. Materials and Methods
- If there is limited (or a lack of) of unevenness shares, the index dQ/dV reach the approximate maximum values for a given number m/n;
- In the case of a significant unevenness in shares, the rule stating that the larger the m/n the higher the index dQ/dV does not apply.
- Low diversification 0 < d ≤ 0.200
- Average diversification 0.200 < d ≤ 0.400
- Good diversification 0.400 < d ≤ 0.600
- Excellent diversification d > 0. 600
- Category A—small <10,000 (6 CWSS);
- Category B—medium 10,000 < NR ≤ 25,000 (4 CWSS);
- Category C—large 25,000 < NR ≤ 100,000 (7 CWSS);
- Category D—very large NR ≤ 100,000 (6 CWSS).
3. Results and Discussion
- Category A 0.5 tank;
- Category B 0.8 tank;
- Category C 2.3 tank;
- Category D 8.3 tank.
- Category A α = 0.07;
- Category B α = 0.14;
- Category C α = 0.19;
- Category D α = 0.36.
- Biecz (A)—has the highest dQ;
- Czarna (B)—the second highest dQ;
- Gorzow Wlkp (D)—the third highest dQ and three tanks;
- Lancut (B)—has three intakes and three tanks, and the second highest α index;
- Olsztyn (D)—has the highest dV (with 14 tanks), as well as six intakes;
- Rzeszow (D)—has two intakes and 12, achieving the third highest dV.
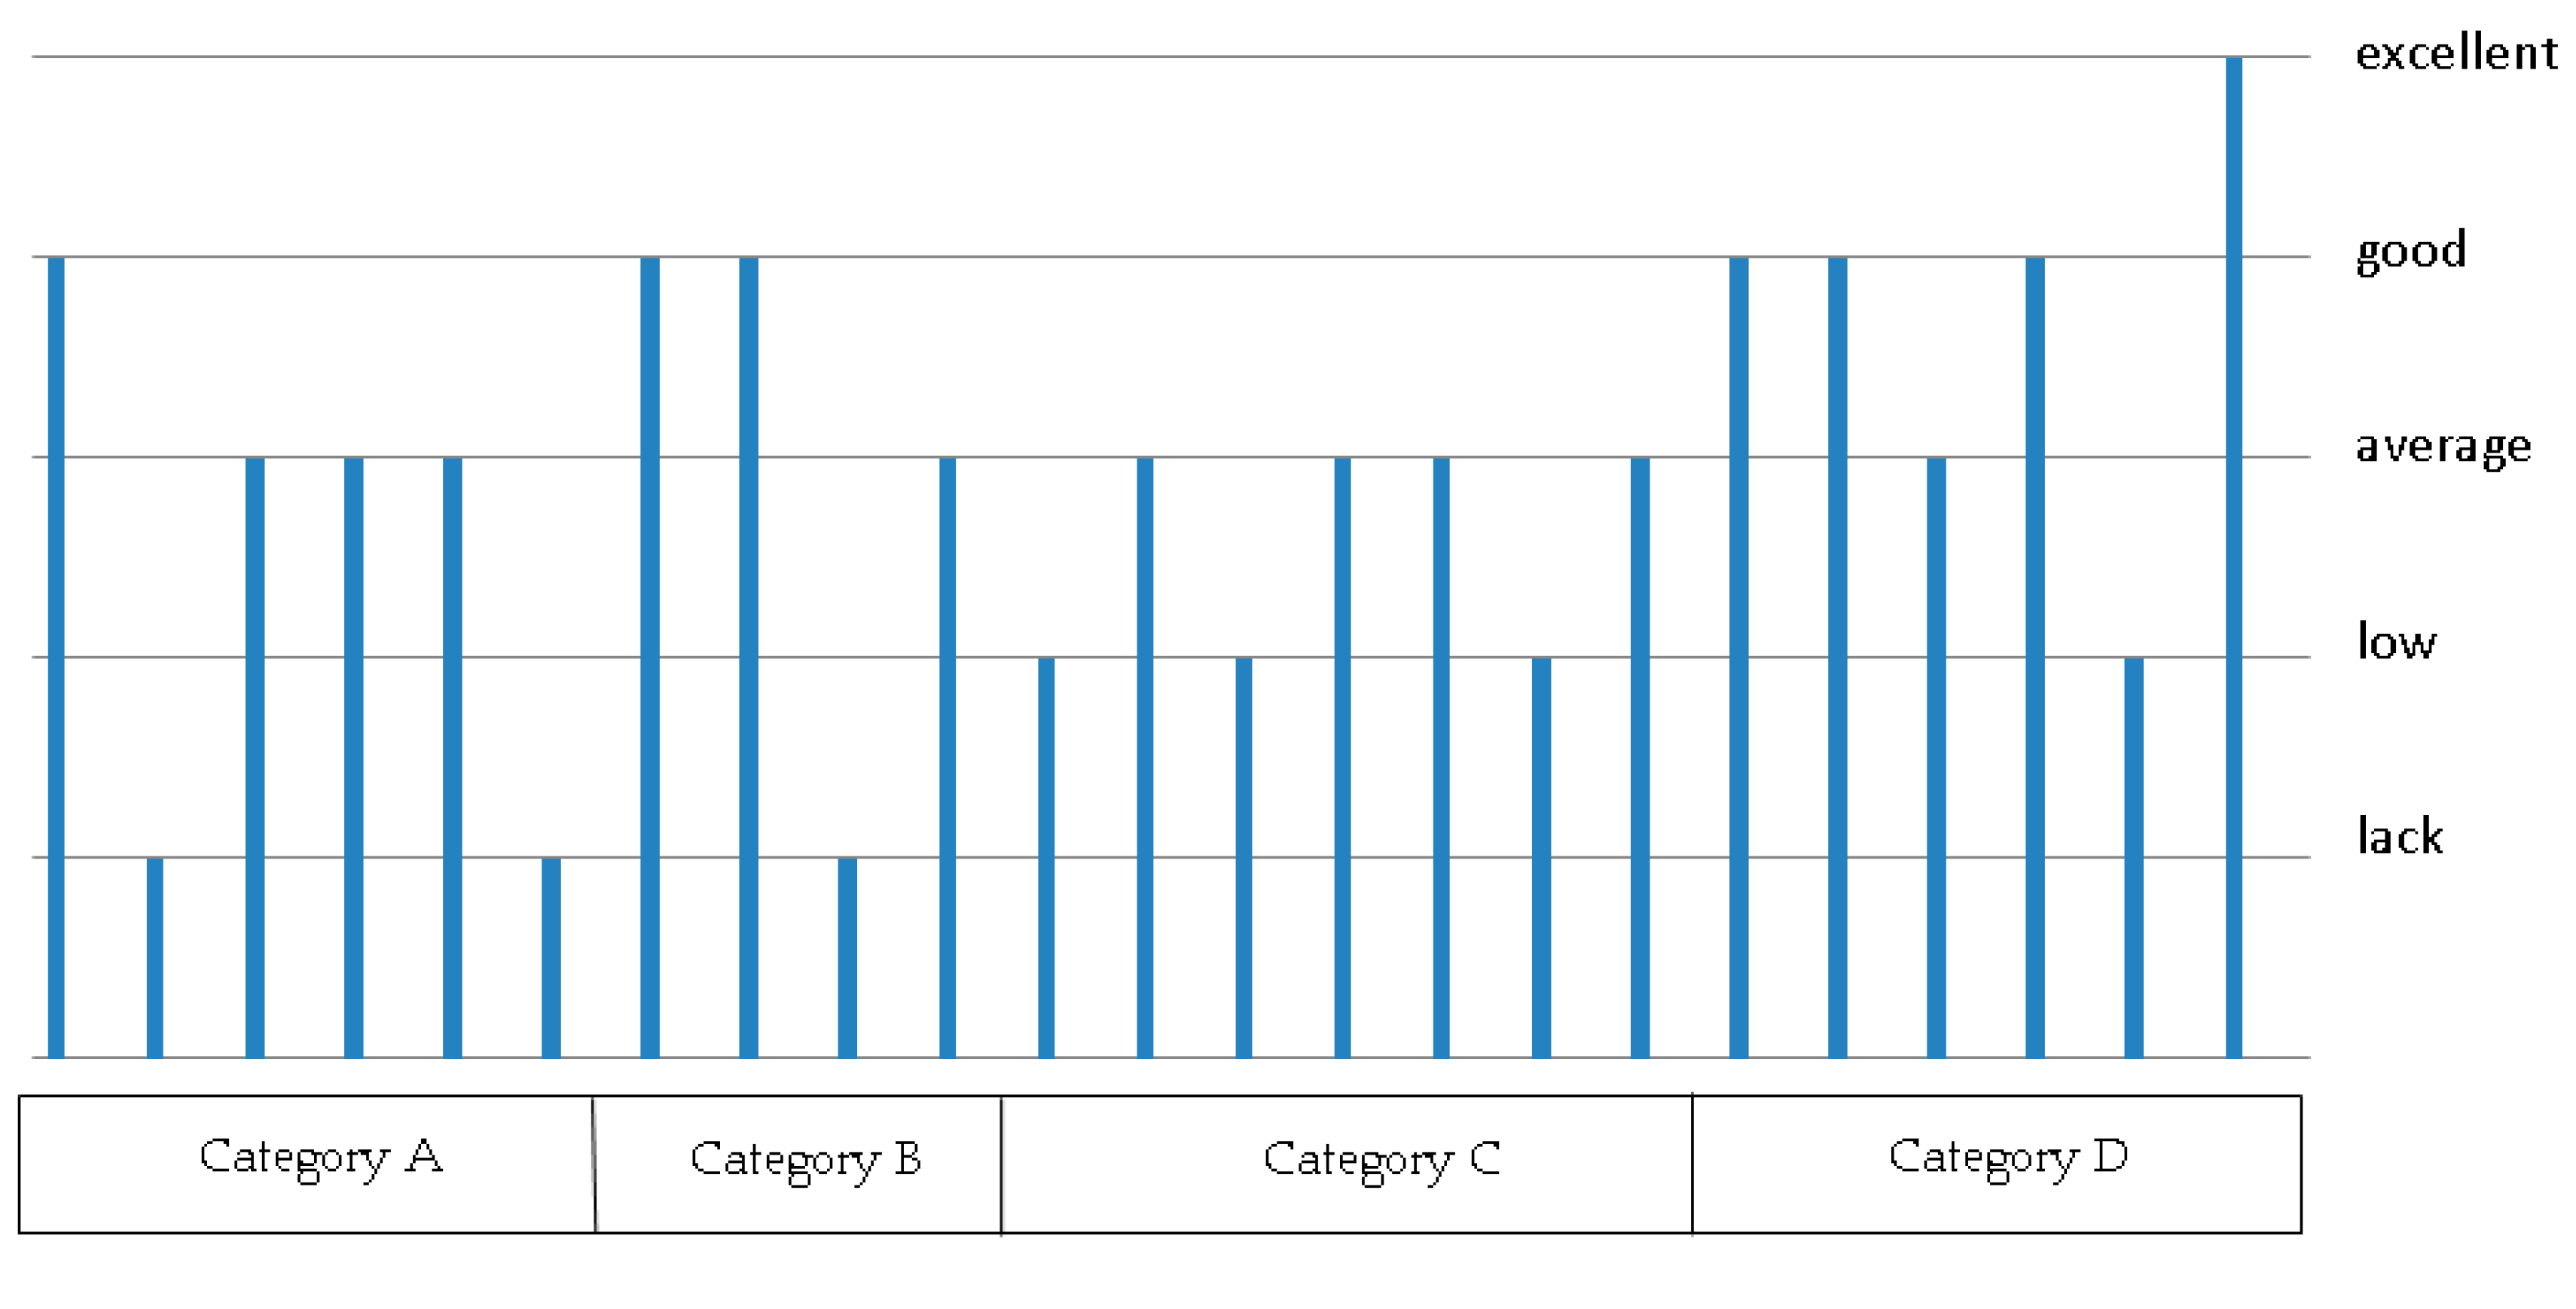
- The largest CWSSs (in category D) support the highest values for d diversification indexes;
- Categories A and B are characterised by very varied diversification (from lacking through to good);
- Only low or average diversification is present among the CWSSs of category C.
4. Conclusions
- The construction of new water intakes or tanks;
- The modernisation of selected water intakes or water tanks;
- The closure of intakes whose maintenance costs are high and whose impact on the diversification of supply is insufficient;
- Connection with the CWSSs of other local authorities or cities;
- The development of procedures for alternative water supply (e.g., involving bottled water or private wells).
Author Contributions
Funding
Conflicts of Interest
References
- Benito-Osorio, D.; Colino, A.; Guerras-Martin, L.A.; Zuniga-Vicente, J.A. The international diversification-performance link in Spain: Does firm size really matter? Int. Bus. Rev. 2016, 25, 548–558. [Google Scholar] [CrossRef]
- Markowitz, H.M. Portfolio Selection. J. Financ. 1952, 7, 77–91. [Google Scholar]
- Jacquemin, A.; Berry, C.H. Entropy Measure of Diversification and Corporate Growth. J. Ind. Econ. 1979, 27, 359–369. [Google Scholar] [CrossRef]
- Ansoff, I. Strategies for Diversification. Harv. Bus. Rev. 1957, 35, 113–124. [Google Scholar]
- Grant, R.M. Towards a knowledge-based theory of the firm. Strateg. Manag. J. 1996, 17, 109–122. [Google Scholar] [CrossRef]
- Hill, M. Diversity and Evenness: a Unifying Notation and its Consequences. Ecology 1973, 2, 427–432. [Google Scholar] [CrossRef]
- Pielou, E.C. The measurement of diversity in different types of biological collections. J. Theor. Biol. 1966, 13, 131–144. [Google Scholar] [CrossRef]
- Simpson, E.H. Measurement of diversity. Nature 1949, 163, 688. [Google Scholar] [CrossRef]
- Goodman, K.R.; Evenhuis, N.L.; Bartosova-Sojkova, P.; O’grady, P.M. Diversification in Hawaiian long-legged flies (Diptera: Dolichopodidae: Campsicnemus): Biogeographic isolation and ecological adaptation. Mol. Phylogenetics Evol. 2014, 81, 232–241. [Google Scholar] [CrossRef]
- Muller, R.; Steinert, M.; Teufel, S. Successful diversification strategies of electricity companies: An explorative empirical study on the success of different diversification strategies of German electricity companies in the wake of the European market liberalization. Energy Policy 2008, 36, 398–412. [Google Scholar] [CrossRef][Green Version]
- Ohimain, E.I. Diversification of Nigerian Electricity Generation Sources. Energy Sources Part. B Econ. Plan. Policy 2015, 10, 298–305. [Google Scholar] [CrossRef]
- Olivier, J.; Root, D. The diversification strategies of large South African contractors into southern Africa. J. South Afr. Inst. Civ. Eng. 2014, 56, 88–96. [Google Scholar]
- Ponisio, L.C.; M’gonigle, L.K.; Mace, K.C.; Palomino, J.; De Valpine, P.; Kremen, C. Diversification practices reduce organic to conventional yield gap. Proc. R. Soc. B Biol. Sci. 2015, 282, 20141396. [Google Scholar] [CrossRef] [PubMed]
- Rak, J.; Wloch, A. Models of level diversification assessment of Water Supply Subsystems. In Underground Infrastructure of Urban. Areas 3; Kolonko, A., Madryas, C., Nienartowicz, B., Szot, A., Eds.; Taylor & Francis Group: London, UK, 2015; pp. 237–244. [Google Scholar]
- Lee, K.W.K.; Yam, J.K.H.; Mukherjee, M.; Periasamy, S.; Steinberg, P.D.; Kjelleberg, S.; Rice, S.A. Interspecific diversity reduces and functionally substitutes for intraspecific variation in biofilm communities. ISME J. 2016, 10, 846–857. [Google Scholar]
- Sarbu, I.; Ostafe, G. Optimal design of urban water supply pipe networks. Urban Water J. 2016, 13, 521–535. [Google Scholar] [CrossRef]
- Farahmandfar, Z.; Piratla, K.R.; Andrus, R.D. Resilience Evaluation of Water Supply Networks against Seismic Hazards. J. Pipeline Syst. Eng. Pract. 2017, 8. [Google Scholar] [CrossRef]
- Kutylowska, M. Modelling of Failure Rate of Water-pipe Networks. Period. Polytech. Civ. Eng. 2015, 59, 37–43. [Google Scholar] [CrossRef]
- Kutylowska, M. Neural network approach for failure rate prediction. Eng. Fail. Anal. 2015, 47, 41–48. [Google Scholar] [CrossRef]
- Vieira, J.; Cunha, M.C. Nested Optimization Approach for the Capacity Expansion of Multiquality Water Supply Systems under Uncertainty. Water Resour. Manag. 2017, 31, 1381–1395. [Google Scholar] [CrossRef]
- Studzinski, A. Amount of labour of water conduit repair. In Safety, Reliability and Risk Analysis: Beyond the Horizon; Van Gelder, P.H.A.J.M., Steenbergen, R.D.J.M., Miraglia, S., Vrouwenvelder, A.C.W.M., Eds.; Taylor & Francis Group: London, UK, 2014; pp. 2081–2084. [Google Scholar]
- Szpak, D.; Tchorzewska-Cieslak, B. Water producers risk analysis connected with collective water supply system functioning. In Dependability Engineering and Complex. Systems. Advances in Intelligent Systems and Computing; Mazurkiewicz, J., Zamojski, M., Sugier, J., Walkowiak, T., Kacprzyk, J., Eds.; Springer: Cham, Switzerland, 2015; pp. 479–489. [Google Scholar]
- Ke, W.; Leia, Y.; Shaa, J.; Zhangb, G.; Yana, J.; Lind, X.; Pana, X. Dynamic simulation of water resource management focused on water allocation and water reclamation in Chinese mining cities. Water Policy 2016, 18, 844–861. [Google Scholar] [CrossRef]
- Li, F.; Wang, W.; Ramírez, L.H.G. The determinants of two-dimensional service quality in the drinking water sector—evidence from Colombia. Water Policy 2016, 18, 983–997. [Google Scholar] [CrossRef]
- Ortloff, C.R. The Water Supply and Distribution System of the Nabataean City of Petra (Jordan), 300 BC–AD 300. Camb. Archaeol. J. 2005, 15, 93–109. [Google Scholar] [CrossRef]
- Gurzau, A.E.; Borzan, C.; Lupsa, I.R.; Sfetcu, L.O.; Ivan, A.L.; Gurzau, S. Drinking Water Security in Crisis Situations from a Medical Perspective. In Threats to Global Water Security; Jones, J.A.A., Vardanian, T.G., Hakopian, C., Eds.; Springer: Dordrecht, The Netherlands, 2009; pp. 51–59. [Google Scholar]
- Hamdy, A.; Ragab, R.; Scarascia-Mugnozza, E. Coping with water scarcity: Water saving and increasing water productivity. Irrig. Drain. 2003, 52, 3–20. [Google Scholar] [CrossRef]
- Pagano, A.; Giordano, R.; Portoghese, I.; Fratino, U.; Vurro, M. A Bayesian vulnerability assessment tool for drinking water mains under extreme events. Nat. Hazards 2014, 74, 2193–2227. [Google Scholar] [CrossRef]
- Zorom, M.; Barbier, B.; Mertz, O.; Servat, E. Diversification and adaptation strategies to climate variability: A farm typology for the Sahel. Agric. Syst. 2013, 116, 7–15. [Google Scholar] [CrossRef]
- Bajer, J. Ecomical and reliability criterion for the optymization of the water supply pumping stations designs. In Environmental Engineering IV.; Dudzińska, M.R., Pawłowski, L., Pawłowski, A., Eds.; Taylor & Francis Group: London, UK, 2013; pp. 21–28. [Google Scholar]
- Bajer, J. Reliability analysis of variant solutions for water pumping stations. In Environmental Engineering; Dudzińska, M.R., Pawłowski, L., Pawłowski, A., Eds.; Taylor & Francis Group: New York, NY, USA; Singapore, 2007; pp. 253–261. [Google Scholar]
- Wieczysty, A.; Rak, J.; Lubowiecka, T. Methods of determination of the water supply system reliability. In Proceedings of the First IWSA International Conference on Master Plans for Water Utilities, Praga, Czech, 21 June 1998. [Google Scholar]
- Jussah, O.; Orabi, M.; Susnik, J.; Bichai, F.; Zevenbergen, C. Assessment of the potential contribution of alternative water supply systems in two contrasting locations: Lilongwe, Malawi and Sharm El-Sheikh, Egypt. J. Water Clim. Chang. 2020, 11, 130–149. [Google Scholar] [CrossRef]
- Rodriguez-Alarcon, R.; Lozano, S. A complex network analysis of Spanish river basins. J. Hydrol. 2019, 578, 124065. [Google Scholar] [CrossRef]
- Liu, W.; Song, Z.; Ouyang, M. Lifecycle operational resilience assessment of urban water distribution networks. Reliab. Eng. Syst. Saf. 2020, 198, 106859. [Google Scholar] [CrossRef]
- Rak, J.; Boryczko, K. Wykorzystanie wskaźnika Pielou do trójparametrycznej oceny dywersyfikacji zaopatrzenia w wodę. Instal 2017, 7, 67–70. [Google Scholar]
- Rak, J.; Boryczko, K. Assessment of water supply diversification using the Pielou index. In Environmental Engineering V.; Pawlowski, L., Pawlowska, M., Eds.; CRC Press-Balkema: Leiden, The Netherlands, 2017; pp. 53–58. [Google Scholar]
- Boryczko, K.; Rak, J. Oceny dywersyfikacji zaopatrzenia w wybranych miast w wodę metodą dwuparametryczną z wykorzystaniem wskaźnika Pielou. Instal 2016, 6, 60–63. [Google Scholar]
- Shannon, C.; Weaver, W. The Matematical Theory of Communication; University of Illionois Press: Urbana, IL, USA, 1962. [Google Scholar]
- Pielou, E.C. Ecological Diversity; John Wiley & Sons: New York, NY, USA, 1975. [Google Scholar]
- Simpson, E.H. The Interpretation of Interaction in Contingency Tables. J. R. Stat. Soc. Ser. B 1951, 13, 238–241. [Google Scholar] [CrossRef]
- Hurlbert, S.H. The Non-concept of Spiecies Diversity: A critique and alternative parameters. Ecology 1971, 4, 577–586. [Google Scholar] [CrossRef]
- Gorzelak, P.; Salamon, M.A.; Trzesiok, D.; Lach, R.; Baumiller, T.K. Diversity dynamics of post-Palaeozoic crinoids - in quest of the factors affecting crinoid macroevolution. Lethaia 2016, 49, 231–244. [Google Scholar] [CrossRef]
- Kharbach, M. Diversification criteria for power systems. Energy Policy 2016, 90, 183–186. [Google Scholar] [CrossRef]
- Rajabizadeh, M.; Nagy, Z.T.; Adriaens, D.; Avci, A.; Masroor, R.; Schmidtler, J.; Nazarov, R.; Esmaeili, H.R.; Christiaens, J. Alpine-Himalayan orogeny drove correlated morphological, molecular, and ecological diversification in the Persian dwarf snake (Squamata: Serpentes: Eirenis persicus). Zool. J. Linn. Soc. 2016, 176, 878–913. [Google Scholar] [CrossRef]
- Sadownik, J.W.; Mattia, E.; Nowak, P.; Otto, S. Diversification of self-replicating molecules. Nat. Chem. 2016, 8, 264–269. [Google Scholar] [CrossRef] [PubMed]
- Tchórzewska-Cieślak, B. Estimating the acceptance of bearing the cost of the risks associated with the management of water supply system. Ochr. Środowiska 2007, 29, 69–72. [Google Scholar]
- Shi, Q.K.; Chen, Z.Y.; Fang, C.R.; Feng, Y.; Xu, B.W. Measuring the Diversity of a Test Set With Distance Entropy. IEEE Trans. Reliab. 2016, 65, 19–27. [Google Scholar] [CrossRef]
- Bartoszek, L.; Koszelnik, P.; Gruca-Rokosz, R.; Kida, M. Assessment of Agricultural Use of the Bottom Sediments from Eutrophic Rzeszaw Reservoir. Rocz. Ochr. Srodowiska 2015, 17, 396–409. [Google Scholar]
- Kut, P.; Nowak, K. Design of Photovoltaic Systems Using Computer Software. J. Ecol. Eng. 2019, 20, 72–78. [Google Scholar] [CrossRef]
- Boryczko, K.; Bartoszek, L.; Koszelnik, P.; Rak, J. A new concept for risk analysis relating to the degradation of water reservoirs. Environ. Sci. Pollut. Res. 2018, 25, 25591–25599. [Google Scholar] [CrossRef]
- Gachlou, M.; Roozbahani, A.; Banihabib, M.E. Comprehensive risk assessment of river basins using Fault Tree Analysis. J. Hydrol. 2019, 577, 123974. [Google Scholar] [CrossRef]
- Taheriyoun, M.; Moradinejad, S. Reliability analysis of a wastewater treatment plant using fault tree analysis and Monte Carlo simulation. Environ. Monit. Assess. 2015, 187, 4186. [Google Scholar] [CrossRef] [PubMed]
- Mirshafiei, P.; Sadeghi-Niaraki, A.; Shakeri, M.; Choi, S.M. Geospatial Information System-Based Modeling Approach for Leakage Management in Urban Water Distribution Networks. Water 2019, 11, 1736. [Google Scholar] [CrossRef]
- Tang, Y.; Jing, J.J.; Zhang, Z.D.; Yang, Y. A Quantitative Risk Analysis Method for the High Hazard Mechanical System in Petroleum and Petrochemical Industry. Energies 2018, 11, 14. [Google Scholar] [CrossRef]
- Zimoch, I.; Łobos, E. Comprehensive interpretation of safety of wide water supply systems. Environ. Prot. Eng. 2012, 38, 107–117. [Google Scholar] [CrossRef]
- Iwanejko, R.; Bajer, J. Determination of the optimum number of repair units for water distribution systems. Arch. Civ. Eng. 2009, 55, 87–101. [Google Scholar]
- Szpak, D.; Tchorzewska-Cieslak, B. The Use of Grey Systems Theory to Analyze the Water Supply Systems Safety. Water Resour. Manag. 2019, 33, 4141–4155. [Google Scholar] [CrossRef]
- Piegdon, I.; Tchorzewska-Cieslak, B.; Szpak, D. The use of geographical information system in the analysis of risk of failure of water supply network. In Environmental Engineering V.; Pawlowski, L., Pawlowska, M., Eds.; CRC Press-Balkema: Leiden, The Netherlands, 2017; pp. 7–14. [Google Scholar]
- Rak, J. Propozycja oceny dywersyfikacji objętości wody w sieciowych zbiornikach wodociągowych. J. Civ. Eng. Environ. Archit. 2015, 32, 339–349. [Google Scholar]
- Pietrucha-Urbanik, K.; Studzinski, A. Qualitative analysis of the failure risk of water pipes in terms of water supply safety. Eng. Fail. Anal. 2019, 95, 371–378. [Google Scholar] [CrossRef]
- Gwozdziej-Mazur, J.; Swietochowski, K. Non-Uniformity of Water Demands in a Rural Water Supply System. J. Ecol. Eng. 2019, 20, 245–251. [Google Scholar] [CrossRef]
- World Health Organization. A Guide to Equitable Water Safety Planning: Ensuring No One Is Left Behind; World Health Organization: Geneva, Switzerland, 2019. [Google Scholar]
- Slys, D.; Stec, A. Centralized or Decentralized Rainwater Harvesting Systems: A Case Study. Resources 2020, 9, 5. [Google Scholar] [CrossRef]
- Boryczko, K.; Tchorzewska-Cieslak, B. Analysis of risk of failure in water main pipe network and of developing poor quality water. Environ. Prot. Eng. 2014, 40, 77–92. [Google Scholar]


| Shares | u1 = 0.5 u2 = 0.5 | u1 = 0.6 u2 = 0.4 | u1 = 0.7 u2 = 0.3 | u1 = 0.8 u2 = 0.2 | u1 = 0.9 u2 = 0.1 | u1 = 0.95 u2 = 0.05 | u1 = 0.99 u2 = 0.01 |
|---|---|---|---|---|---|---|---|
| dQ, dV | 0.25 | 0.24 | 0.21 | 0.16 | 0.09 | 0.0475 | 0.0099 |
| Shares | u1 = 0.33 u2 = 0.33 u3 = 0.33 | u1 = 0.4 u2 = 0.3 u3 = 0.3 | u1 = 0.5 u2 = 0.3 u3 = 0.2 | u1 = 0.6 u2 = 0.3 u3 = 0.1 | u1 = 0.6 u2 = 0.2 u3 = 0.2 | u1 = 0.7 u2 = 0.2 u3 = 0.1 | u1 =0.8 u2 = 0.1 u3 = 0.1 |
|---|---|---|---|---|---|---|---|
| dQ, dV | 0.444 | 0.438 | 0.4 | 0.324 | 0.352 | 0.272 | 0.194 |
| Shares | u1 = 0.25 u2 = 0.25 u3 = 0.25 u4 = 0.25 | u1 = 0.3 u2 = 0.3 u3 = 0.2 u4 = 0.2 | u1 = 0.4 u2 = 0.3 u3 = 0.15 u4 = 0.15 | u1 = 0.5 u2 = 0.3 u3 = 0.1 u4 = 0.1 | u1 = 0.6 u2 = 0.2 u3 = 0.1 u4 = 0.1 | u1 = 0.7 u2 = 0.1 u3 = 0.1 u4 = 0.1 |
|---|---|---|---|---|---|---|
| dQ, dV | 0.5625 | 0.55 | 0.508 | 0.434 | 0.386 | 0.306 |
| Shares | u1 =0.2 u2 = 0.2 u3 = 0.2 u4 = 0.2 u5 = 0.2 | u1 = 0.3 u2 = 0.3 u3 = 0.2 u4 = 0.1 u5 = 0.1 | u1 = 0.4 u2 = 0.3 u3 = 0.1 u4 = 0.1 u5 = 0.1 | u1 = 0.5 u2 = 0.2 u3 = 0.1 u4 = 0.1 u5 = 0.1 | u1 =0.6 u2 = 0.1 u3 = 0.1 u4 = 0.1 u5 = 0.1 |
|---|---|---|---|---|---|
| dQ, dV | 0.64 | 0.584 | 0.534 | 0.496 | 0.42 |
| m, n | 2 | 3 | 4 | 5 | 6 | 8 | 10 | 20 |
|---|---|---|---|---|---|---|---|---|
| ui, uj | 0.5 | 0.33 | 0.25 | 0.20 | 0.167 | 0.125 | 0.10 | 0.05 |
| dQ, dV | 0.25 | 0.444 | 0.563 | 0.64 | 0.695 | 0.766 | 0.81 | 0.903 |
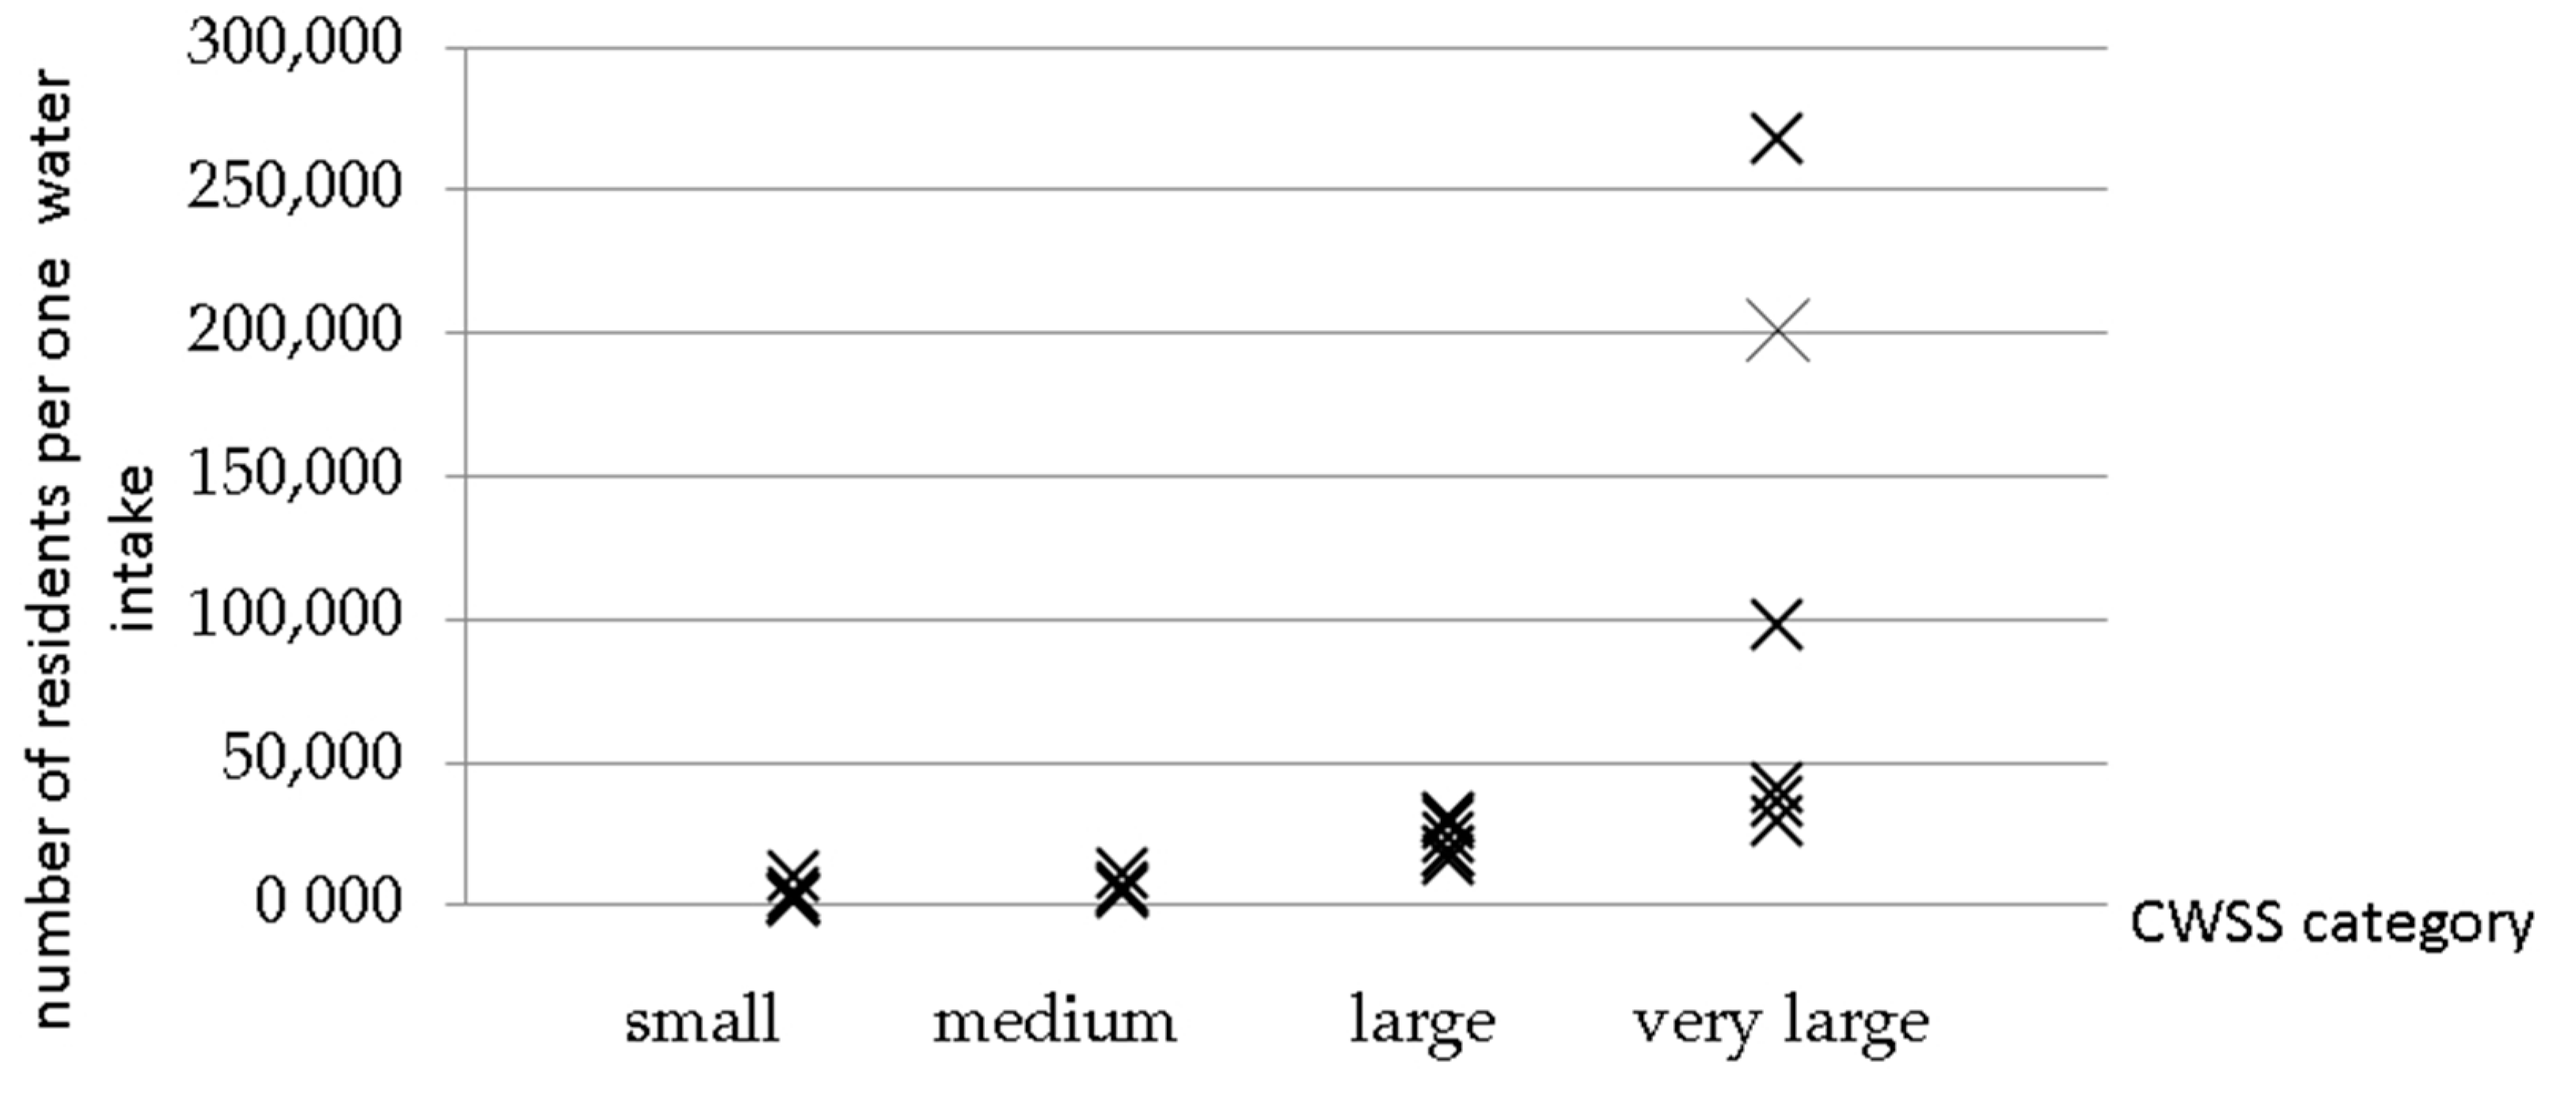
| City (Number of Residents Category) | Number of Residents | Number of Water Intakes | Number of Residents Per Intake |
|---|---|---|---|
| Biecz (A) | 4629 | 5 | 926 |
| Blazowa (A) | 2148 | 1 | 2148 |
| Brzozow (A) | 7471 | 3 | 2490 |
| Czarna (B) | 11,177 | 3 | 3726 |
| Gloglow Mlp. (A) | 6431 | 3 | 2144 |
| Gorzow Wlkp. (D) | 122,141 | 3 | 40,714 |
| Jaslo (C) | 36,641 | 2 | 18,321 |
| Kolbuszowa (A) | 9158 | 2 | 4579 |
| Krosno (C) | 46,936 | 3 | 15,645 |
| Lancut (B) | 18,067 | 3 | 6022 |
| Majdan Krolewski (A) | 9858 | 1 | 9858 |
| Mielec (C) | 60,366 | 2 | 30,183 |
| Nowa Deba (B) | 11,215 | 1 | 11,215 |
| Olsztyn (D) | 173,125 | 6 | 28,854 |
| Poznan (D) | 536,438 | 2 | 268,219 |
| Raciborz (C) | 55,818 | 2 | 27,909 |
| Rzeszow (D) | 195,734 | 2 | 97,867 |
| Sanok (C) | 37,113 | 2 | 18,557 |
| Stalowa Wola (C) | 60,799 | 2 | 30,400 |
| Staszow (B) | 14, 762 | 3 | 4921 |
| Szczecin (D) | 402,100 | 2 | 201,050 |
| Tarnobrzeg (C) | 46,907 | 2 | 23,454 |
| Tarnów (D) | 107,954 | 3 | 35,985 |
| City (Number of Residents Category) | Number of Intakes | Number of Tanks | α | dQ | dV | d | Diversification Category |
|---|---|---|---|---|---|---|---|
| Biecz (A) | 5 | 0 | 0 | 0.584 | 0 | 0.58 | good |
| Blazowa (A) | 1 | 0 | 0 | 0 | 0 | 0 | lack |
| Brzozow (A) | 3 | 0 | 0 | 0.276 | 0 | 0.28 | average |
| Czarna (B) | 3 | 0 | 0 | 0.406 | 0 | 0.41 | good |
| Gloglow Mlp. (A) | 3 | 0 | 0 | 0.397 | 0 | 0.4 | average |
| Gorzow Wlkp. (D) | 3 | 3 | 0.23 | 0.403 | 0.296 | 0.47 | good |
| Jaslo (C) | 2 | 2 | 0.39 | 0.019 | 0.192 | 0.09 | low |
| Kolbuszowa (A) | 2 | 2 | 0.43 | 0.121 | 0.25 | 0.23 | average |
| Krosno (C) | 3 | 2 | 0.05 | 0.258 | 0.25 | 0.27 | average |
| Lancut (B) | 3 | 3 | 0.55 | 0.327 | 0.444 | 0.57 | good |
| Majdan Krolewski (A) | 1 | 1 | 0 | 0 | 0 | 0 | lack |
| Mielec (C) | 2 | 0 | 0 | 0.166 | 0 | 0.17 | low |
| Nowa Deba (B) | 1 | 0 | 0 | 0 | 0 | 0 | lack |
| Olsztyn (D) | 6 | 14 | 0.33 | 0.345 | 0.656 | 0.56 | good |
| Poznan (D) | 2 | 2 | 0.39 | 0.227 | 0.222 | 0.31 | average |
| Raciborz (C) | 2 | 3 | 0.31 | 0.188 | 0.444 | 0.33 | average |
| Rzeszow (D) | 2 | 12 | 0.44 | 0.245 | 0.583 | 0.5 | good |
| Sanok (C) | 2 | 4 | 0.33 | 0.248 | 0.322 | 0.35 | average |
| Stalowa Wola (C) | 2 | 0 | 0 | 0.166 | 0 | 0.17 | low |
| Staszow (B) | 3 | 0 | 0 | 0.371 | 0 | 0.37 | average |
| Szczecin (D) | 2 | 8 | 0.23 | 0.083 | 0.296 | 0.15 | low |
| Tarnobrzeg (C) | 2 | 5 | 0.23 | 0.146 | 0.571 | 0.28 | average |
| Tarnów (D) | 3 | 14 | 0.56 | 0.237 | 0.656 | 0.61 | excellent |
© 2020 by the authors. Licensee MDPI, Basel, Switzerland. This article is an open access article distributed under the terms and conditions of the Creative Commons Attribution (CC BY) license (http://creativecommons.org/licenses/by/4.0/).
Share and Cite
Boryczko, K.; Rak, J. Method for Assessment of Water Supply Diversification. Resources 2020, 9, 87. https://doi.org/10.3390/resources9070087
Boryczko K, Rak J. Method for Assessment of Water Supply Diversification. Resources. 2020; 9(7):87. https://doi.org/10.3390/resources9070087
Chicago/Turabian StyleBoryczko, Krzysztof, and Janusz Rak. 2020. "Method for Assessment of Water Supply Diversification" Resources 9, no. 7: 87. https://doi.org/10.3390/resources9070087
APA StyleBoryczko, K., & Rak, J. (2020). Method for Assessment of Water Supply Diversification. Resources, 9(7), 87. https://doi.org/10.3390/resources9070087


