Article

Linear Programming-Based Cropland Allocation to Enhance Performance of Smallholder Crop Production: A Pilot Study in Abaro Kebele, Ethiopia

1
Wondo Genet College of Forestry and Natural Resources, Department of Natural Resource Economics and Policy, Hawassa University, P.O. Box 128, Shashemene, Ethiopia
2
Department of Community Development and Applied Economics, University of Vermont, Burlington, VT 05405, USA
*
Author to whom correspondence should be addressed.
Resources 2018, 7(4), 76; https://doi.org/10.3390/resources7040076
Submission received: 7 September 2018 / Revised: 3 November 2018 / Accepted: 6 November 2018 / Published: 23 November 2018

Abstract

:
Smallholder farmer crop production is a mainstay of the Ethiopian economy. A series of agricultural extension programs have been implemented since the 1950s in an effort to improve smallholder productivity. In this study, we argue that the limited attention that is given to cropland allocation by smallholders is one key driver of low performance of crop production as well as a key factor in environmental degradation. Drawing on data from a household survey of 75 randomly selected households in Abaro Kebele, Ethiopia, combined with focus-group discussions, key informant interviews, and secondary data sources, we use linear programming to highlight the impact of cropland allocation decisions on the performance of rural smallholder crop production systems. We find that under current land use practices households are not able to meet their consumption needs. The average profitability of farms under the current cropland allocation is also significantly below the estimated level of profit that could be realized by reallocating cropland while using linear programming. Additionally, survey results suggest that low crop production performance (in terms of meeting both household food crop production needs and profit goals) is the primary reason why households do not participate in conservation efforts and sustainable resource management practices. This study suggests that linear programming-based cropland allocation modeling might be applied to enhance the profit performance of smallholder crop production, help meet household food crop production requirements, and thereby promote the sustainable utilization of environmental resources.

1. Introduction

In Ethiopia, smallholder agriculture has long history as a major economic activity. According to the Central Statistical Agency of Ethiopia [1] and the World Bank Group [2], 85% of the Ethiopian workforce is engaged in agriculture. Smallholder agriculture contributed more than 50% to the country’s GDP in 1990, and though this share has declined somewhat in recent years, it has remained a key sector of the economy, particularly in rural areas [3]. However, in many ways commercialization and development of agriculture in Ethiopia has not yet realized its full potential, and the country remains one of the least developed economies in the world [4].
Recognizing the low productivity of agriculture and the potential contribution of smallholder agriculture to national economic growth and food security, since the 1950s the government of Ethiopia has made substantial efforts to increase smallholder production through agricultural extension service programs that are mainly focused on input supply via credit systems and training for improved crop management [5,6]. These efforts are currently pronounced in national macroeconomic plans, such as the Ethiopian Growth and Transformation Plan (GTP) [3] and the Climate Resilient Green Economy Strategy of Ethiopia launched in 2012, which sought to increase productivity in smallholder agriculture with the ultimate objective of achieving middle income economy status by 2025 by following a “green growth path” [7]. These strategies, however, mainly focus on increasing crop output—the potential for enhancing resource use efficiency through improved farm management decisions is hardly considered.
Low input supply [3] and low resource use efficiency [4] both contribute to patterns of low agricultural performance in smallholder farm systems in Ethiopia. In some cases, increased production may be achieved at the expense of high input costs; hence, a high-input strategy may not always ensure profitability and may not bring about the desired results of poverty alleviation and improved household food security [8,9,10,11]. In other cases, declining land productivity coupled with population growth has driven households to further cultivate marginal lands (such as steep slopes and forest lands) and exploit natural forests as sources of fuel wood and cash income [12,13,14,15]. Such crop cultivation practices are key contributors to soil erosion—which in turn leads to the pollution of surface and ground water through siltation and nutrient leaching [16,17]. Thus, efforts to increase production through extensive cultivation may come at the cost of reduced long-term productivity, reduced resilience to climate change, and other threats stemming from poor environmental resource management. But, as Wilson and others [18] argue, in such contexts improvements to smallholder agriculture resource use efficiency may have the potential to meet the twin objectives of large-scale poverty reduction and sustainable agricultural productivity growth.
Linear programming is a widely used optimization method for decision-making in various sectors, such as public transportation, private and state industrial activities, and other resource allocation problems, including agricultural land use [19,20,21,22,23]. This study explores the potential of linear programming-based land use modeling as a farm decision tool to increase the efficiency of smallholder crop production, thereby improving resource use efficiency and potentially enhancing profitability. Drawing on primary data from 
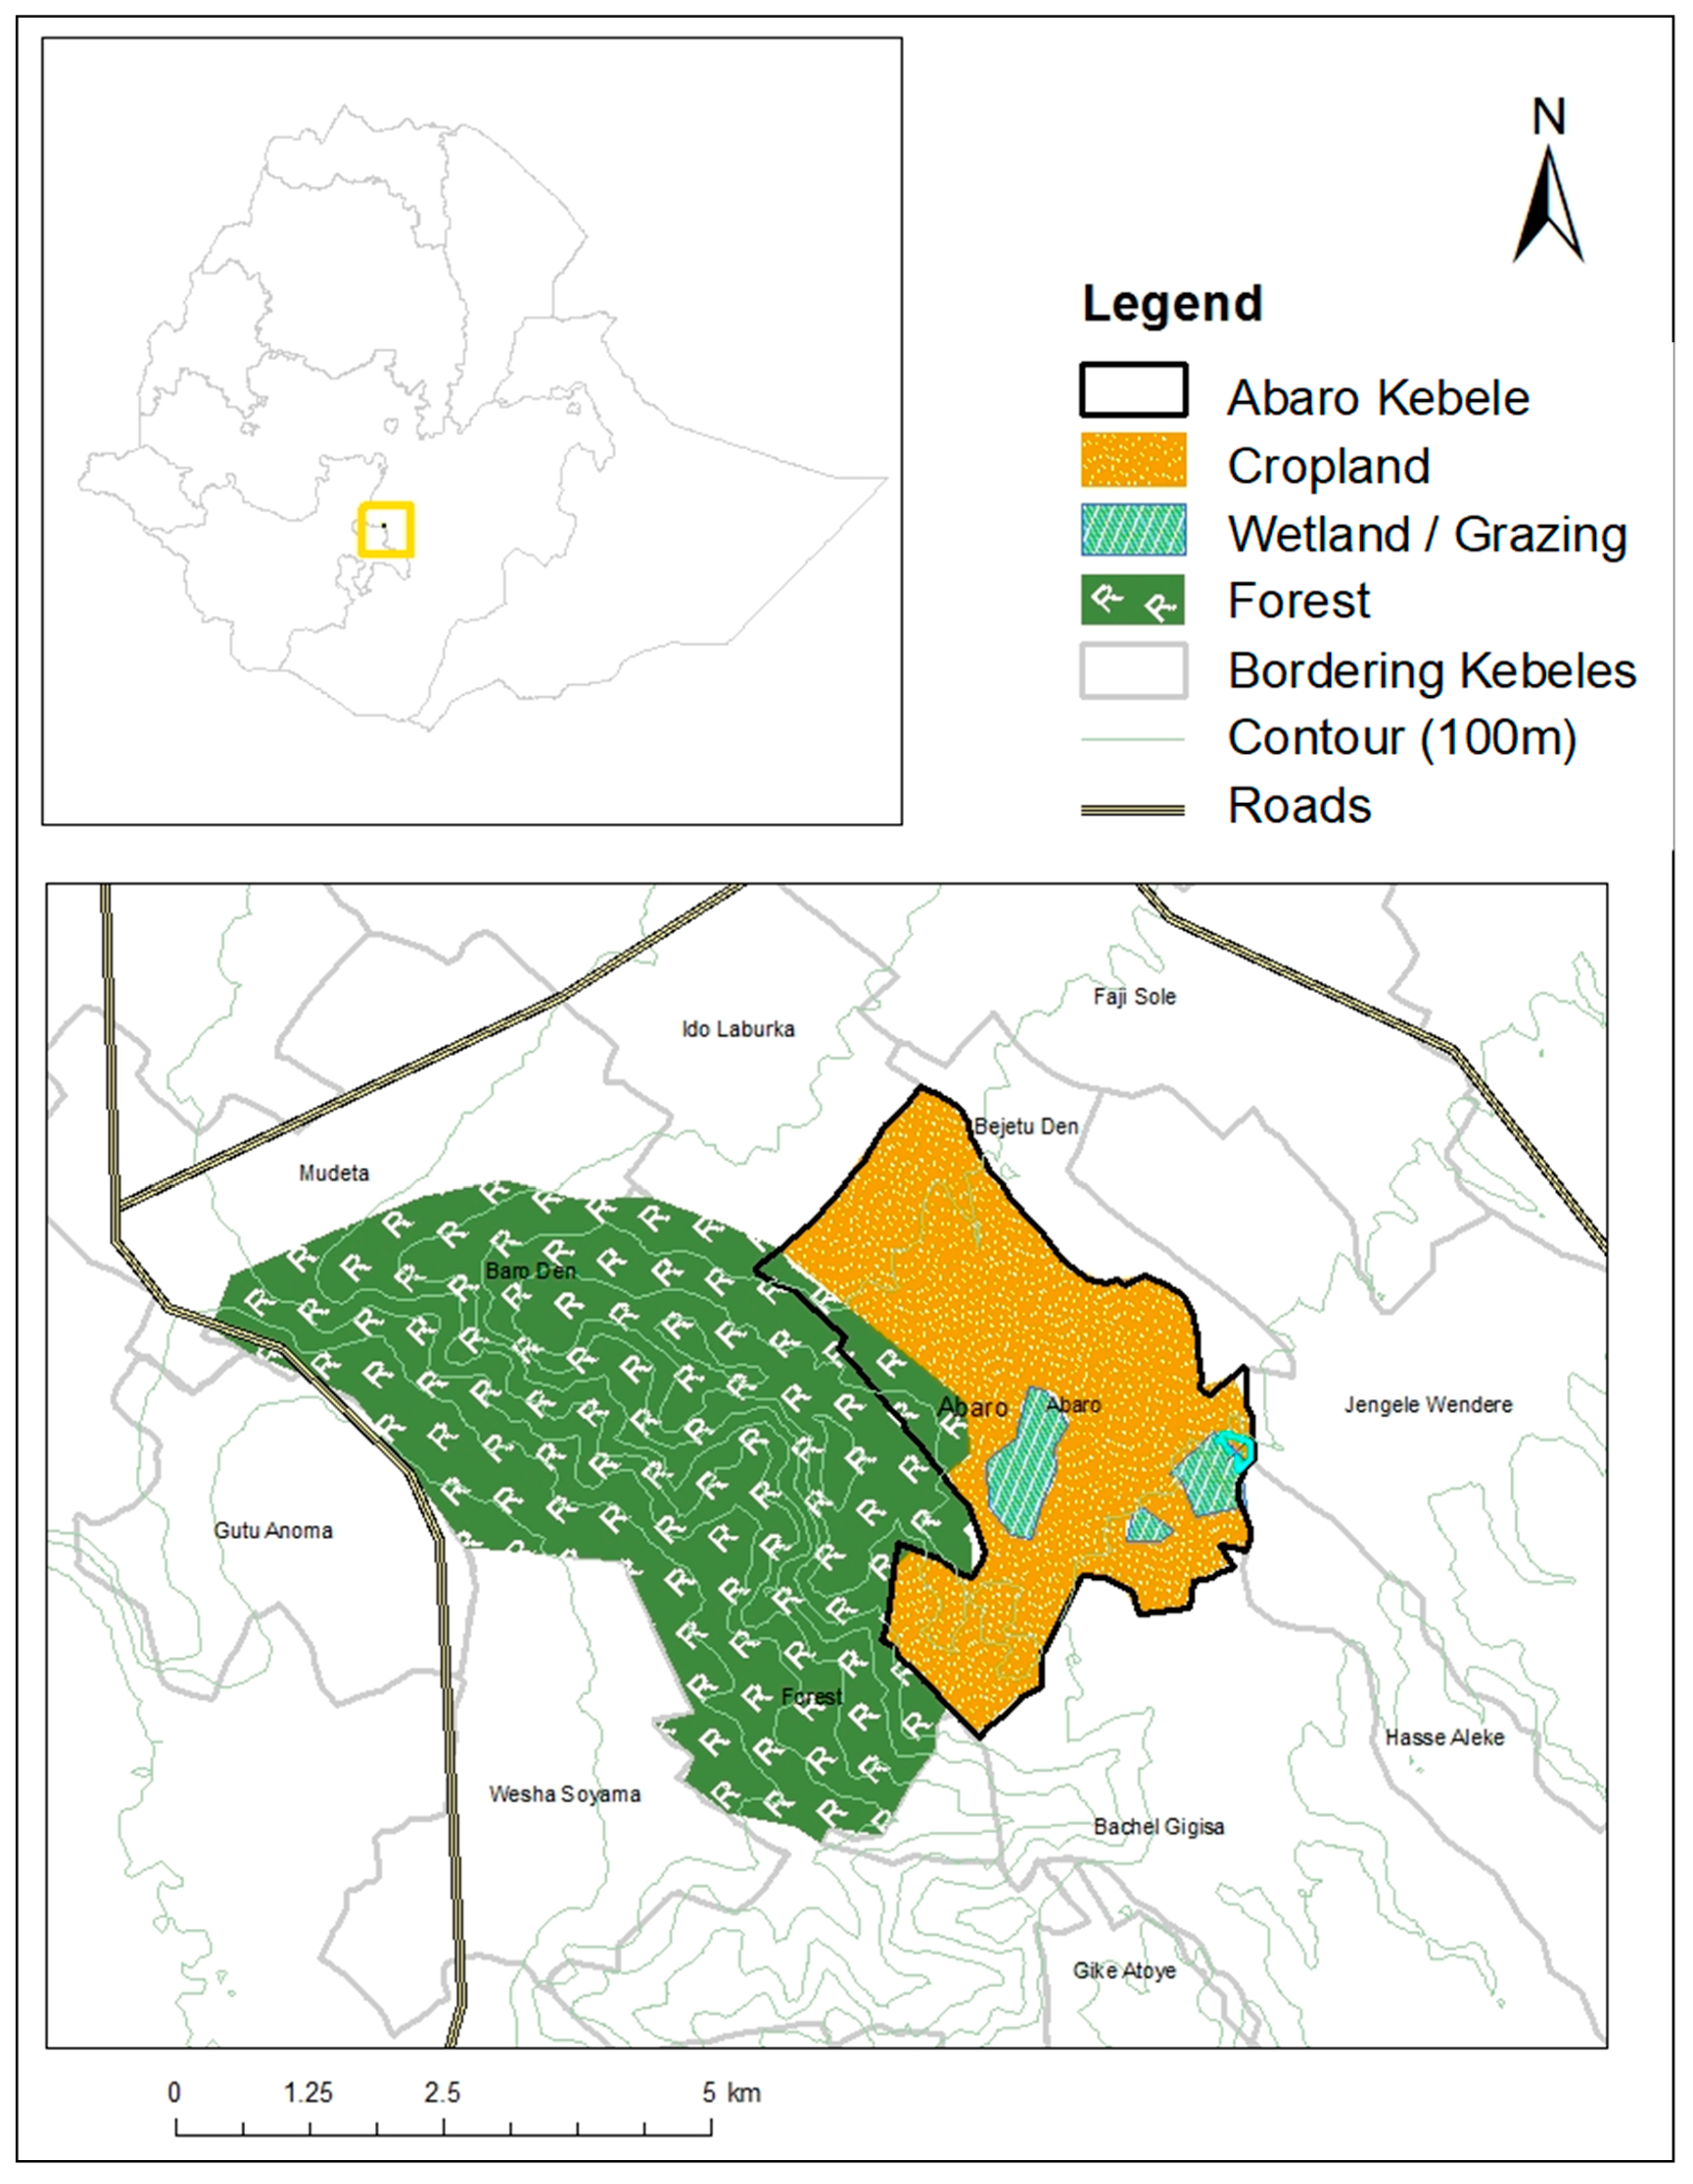
Abaro Kebele in southern Ethiopia, we apply a linear programming-based cropland allocation technique to compare production self-sufficiency and profitability outcomes under the status quo and under two alternative cropland allocation scenarios for six crops that are commonly grown in the study area. More specifically, this study seeks to (1) describe the farm-level and village-level profitability of current crop production systems; (2) estimate the annual production and profit possible from optimal cropland use allocations (defined first at the household level, and then at the village level) based on linear programming; and finally, (3) examine how the use of linear programming-based cropland allocation might be applied to positively impact the sustainable use of environmental and natural resources in smallholder agricultural systems.

2. Materials and Methods

2.1. Description of the Study Area

Abaro Kebele is located in Shashemene Zuria Woreda, Oromiya Regional State, Ethiopia at about 07°06′ N latitude and 38°37′ E longitude [14]. It is situated at an altitude ranging from 1900 to 2600 m.a.s.l [24]. It is characterized by two rainy seasons, the long rainy season (July to September) and a short rainy season (March to April). The average land holding in the study area is less than one hectare [25]. The area is bordered by the disturbed natural forests of Munessa Shashemene in the southeast (Figure 1). The livelihood practices of households in this particular kebele (a kebele is the smallest administrative unit in Ethiopia) are sedentary farming complemented by limited livestock production—as is typical in the majority of rural households in the highlands. The study area is one of the most densely populated kebeles in the local area, with an average population density of 370.4 persons per square kilometer [25].

2.2. Population and Sampling

First, key informant interviews with two local development agents, two experts from the District Office of Agriculture, and four selected farm household heads (representing typical and elderly farmers) were conducted using a pre-prepared checklist to better understand the farming practices of the community and to measure households’ overall support for environmental and natural resource conservation efforts. Following the key informant interviews, seventy five (75) households (about 5% of households in the study area) were randomly selected and surveyed using a structured questionnaire. Finally, a focus group discussion was held with two kebele extension agents, three typical farmers, and one kebele administrator being selected to qualify and standardize survey estimates, such as the local wage rate of hired labor, and labor hour requirements for the production of different crops. Participants in the focus group discussion and key informant interviews were selected based on their expertise, experience, familiarity with current annual crop production practices, and involvement in natural and environmental resource management. The socioeconomic characteristics of the 75 survey respondents are given in Table 1.

2.3. Nature and Type of Data

Both quantitative and qualitative data regarding crop production practices, such as land size, costs of crop production, current farming practices, and productivity of crops per hectare were collected through structured household survey questionnaires, a focus group discussion, and key informant interviews. Secondary data, including reports from the Ministry of Agriculture and other offices, were also used. Quantitative data collected from primary and secondary sources were used to estimate costs and revenues of crop production per hectare for each crop. The annual national average price for each crop per kilogram in 2012 were drawn from the Food and Agriculture Organization Statistical Database (FAOSTAT) [26]. Qualitative data on factors influencing cropland allocation, as well as self-assessed awareness of environmental and natural resource constraints and the involvement in natural and environmental resource management practices were collected through the key informant interviews, focus group discussions, and household surveys.

2.4. Model Description

We first estimated the profit performance and production of food crop under the status quo (current cropland allocation). A linear program (LP) with the objective of profit maximization from crop production was then used to evaluate the potential for satisfying the goals of food crop production requirements and profit maximization under two hypothetical land-allocation scenarios.
Current production and profit performance under the status quo was used as the reference scenario. The first hypothetical scenario had the objective of maximizing profit through a linearly programmed method of cropland allocation, with the assumption that the relative land productivity of different crops was equal to the current mean productivity per hectare of each crop estimated from household survey. The second hypothetical scenario also had the objective of maximizing profit through a LP method of cropland allocation, but assumed that farmers would realize the theoretical potential yield per hectare for each crop, as obtained from the 2009 annual report of Ethiopian Ministry of Agriculture and Rural Development (MoARD) [27]. In both models, profit maximization was subject to constraints, including ecological constraints (total land available cannot be exceeded), budget constraints (estimated based on prior household expenditures and assuming no access to credit or outside resources), and additional constraints relating to household- and village-level food crop production requirements (or village level food crop production self-sufficiency).

2.4.1. Profit Maximizing Objective

Since the main aim of this study was to investigate the potential production and profit performance of smallholder crop production systems under alternative cropland-allocation scenarios as compared to the present-day cropland allocation, profit maximization was taken as the objective. Given n crop choices practiced in the study area with productivity per unit of land qi, i = 1,2,3,…n and total land size L, the LP problem was to estimate the area of land Li, i = 1,2,3,…n which should be allocated for each crop selected to plant in the specific cropping season to maximize profit subject to a given set of ecological, financial, and food crop production self-sufficiency constraints.
Given the market price Pi, i = 1,2,3,…n per kilogram of each crop and the cost of production per hectare of land for each crop Ci i = 1,2,3,…n we modeled the objective function profit (Π) as:
Π = i = 1 n ( P i L i q i C i L i )

2.4.2. Constraints

The LP model was estimated for the combined sample subject to the ecological constraint [23,28] that land allocated not exceed the total land suitable for selected crops in the community (estimated from survey data) and with the financial constraint [29,30,31] that total expenditures not exceed the sum of households’ total crop budgets (the total sum of money budgeted and paid to cover the cost of production of selected crops by each individual surveyed households, except land rent and wage of family labor in the 2012 July to September cropping season). Finally, we imposed an additional food crop production self-sufficiency constraint for each of the selected crops, reflecting the aggregated minimum food crop production requirement set by each household surveyed.

Ecological Constraints

The average landholding of households in the study area is less than one hectare [14]. The opportunity for households to expand cropland is almost nonexistent; in cases where expansion does occur, it is often at the expense of neighboring forest as landowners expand their farm by illegally clearing protected areas [32,33]. Based on the results of household surveys, the total aggregated land size available for crop production (L), which is the sum of land allocated for crop production by individual households surveyed, was assumed to be the total land that is available for the selected crops (all of which were suitable to be cultivated in the particular cropping season). Though a number of other crop-specific ecological constraints, such as land gradient, adjacency to critical resources, such as forest and water bodies, and crop rotation could also be included in the model, for simplicity we included only total land size in the model (Equation (2)). Namely, the sum of land allocated among selected crops, Li, i = 1,2,3,…n, could not exceed the total land size L that is available for crop production:
i = 1 n L i L

Aggregated Crop Budget Constraint

Studies indicate that financial access is one of the major constraining factors limiting the performance of smallholder agriculture in low-income countries [34]. Based on results from the household surveys, key informant interviews, and focus group discussions, the cost per hectare of each crop was estimated. Except for a few households, crop production is practiced on farmers’ own land and with only limited use of hired labor for activities, such as insecticide application, pesticide management, and crop harvesting. Estimated crop production costs per hectare (ci) thus primarily included costs of fertilizer, seed, and pesticides, as well as some wages for labor, and costs that are associated with crop harvesting. The total crop budget Y was the sum of costs incurred for production of selected crops by each individual surveyed household (excluding land rent and value of family labor) in the 2012 July to September cropping season. Total cost paid for crop production in the LP models could not exceed this annual aggregated crop budget (Y).
i = 1 n c i L i Y

Aggregated Food Crop Production Self Sufficiency Constraint

Key informant interviews, focus group discussions, and household survey results provided detailed information on the goals of crop production and farming practices among households in the sample. According to these assessments, meeting the minimum household food crop production requirements (typically phrased in terms of consumption needs) is the primary goal of crop production in the study area. Therefore, the minimum aggregated food crop production requirement of each crop Qi, i = 1,2,3,…n, which is the sum of the minimum food crop production requirements, was included explicitly in the model.
q i L i Q i
Finally, a LP-based cropland allocation model (or a crop mix-selection model) with the objective of profit maximization subject to ecological, financial, and food production constraints was used to estimate the maximum profit that could be theoretically realized while using linear programming (Equation (5)).
Maximize   π = i = 1 n ( P i L i q i C i L i ) Subject   to   : i = 1 n c i L i Y , ( Aggregated   Crop   Budget ) L i q i Q i ,   i = 1 , 2 , 3 , 6 , ( Aggregated   Food   Crop   Production   Requirement ) i = 1 n L i L , ( Aggregated   Land ) }

2.5. Method of Data Analysis

Descriptive statistics were used to estimate model parameters from the household survey data; the LP model was solved using the Solver add-in within Microsoft Excel.

3. Results and Discussion

3.1. Crops Selected for the Purpose of this Study

Six crops (wheat (Triticum aestivum), maize (Zea mays), potato (Solanum tuberosum), beetroot (Beta vulgaris), carrot (Daucus carota), and barley (Hordeum vulgare), were selected for the purpose of this study based on their cultivation prevalence amongst surveyed households and the availability of secondary data. Other crops are also cultivated in the area but are omitted from the simulations (Table 2).
In addition to annual crops, households in the study area also cultivate perennial crops, such as enset (Ensete ventricosum), coffee (Coffea Arabica), eucalyptus (Eucalyptus sp.), and apple (Malus domestica). More than 93% of the households cultivate ensete as a major staple food, while only 2.67% cultivate coffee, 2.6% cultivate eucalyptus, and 4% cultivate apple. Ensete was cultivated on an average of 0.15(±0.09) hectares of land.
As shown in Table 3, about 68% of maize producers and 17% of wheat producers were not able to meet the minimum production levels that are needed to meet their self-reported household consumption needs through current cropland allocation practices.

3.2. Model Parameter Estimates

Based on the household survey and a review of secondary data on national average producer prices from Food and Agriculture Organization of the United Nations(FAO) [26], reports from the Ministry of Agriculture and Rural Development (MoARD) [27], and Minot & Sawyer [35], annual crop production profits for the selected six crops were estimated for three scenarios during the 2012 July–September cropping season. Mean current yield per hectare, mean theoretical farm field productivity per hectare, mean cost paid in cash per hectare, mean total cost of production per hectare, mean profit per hectare, and minimum aggregated food crop requirements for consumption were the main parameters included in the models (Table 4).

3.3. LP Models and Findings

Having estimated the parameters for the model from survey data and secondary sources, profit performance was evaluated for three scenarios: (i) current profit performance, the status quo (reference scenario or Scenario #1); (ii) simulated LP-based profit performance under an optimal cropland allocation assuming the land productivity of each crop is the mean yield per hectare estimated from survey data (Scenario #2); and, (iii) simulated LP-based profit performance under an optimal cropland allocation assuming the land productivity of each crop is the theoretical yield, as reported in a national crop variety release report from the Ethiopian Ministry of Agriculture and Rural Development (Scenario #3).

3.3.1. Profit Performance of Current Cropland Allocation (Scenario #1)

Summing up individual household realized profits that were estimated from the household survey, the aggregated profit from all crop production among households in the sample was estimated as ETB 591,324.6 from a total land area of 43.77 hectares Table 5.
The survey results uncover that under the conventional practice, the community was not able to meet the minimum aggregated food crop production requirement for maize, the most preferred food crop in the study area. As shown in the final column of Table 5, there is an aggregate production shortfall of 13.785 metric tons of maize. cropland allocation.

3.3.2. Profit Performance under Scenario #2

Using parameter estimates from Table 4 and Table 5, Scenario #2 is formulated as the following LP model (Equation (6)):
Maximize Profit ( π ) = 15635.2 * L wheat + 9571.36 * L maize + 13392.6 * L potato + 39834.6 * L beetroot + 49074.1 * L carrot + 11365.6 * L barley Subject   to : L wheat + L maize + L potato + L beetroot + L carrot + L barley 47.77 ( Aggregated   Land ) 10467.37 * L wheat + 8160.47 * L maize + 12392.22 * L potato + 5702.01 * L beetroot + 8265.88 * L carrot + 8514.31 * L barley 850636 ( Aggregated   Crop   Budget ) 4560.64 * L wheat 51250 ( Aggregated   wheat   production   required   for   consumption ) 5764.71 * L maize 36710 ( Aggregated   maize   production   required   for   consumption ) 9908.33 * L potato 30316 ( Aggregated   potato   production   required   for   consumption ) 16614.81 * L beetroot 4850 ( Aggregated   beetroot   production   required   for   consumption ) 20323.81 * L carrot 4450 ( Aggregated   carrot   production   required   for   consumption ) 4400 * L barley 7100 ( Aggregated   barley   production   required   for   consumption ) L wheat , L maize , L potato , L beetroot , L carrot , L barley 0
Land productivity (yield) per hectare of land for crops in this scenario is taken as the mean current yield estimated from survey data (Table 4). Solving this model, a total aggregated profit of 1,347,871.218 ETB or 17,971.62 ETB per household appears to be theoretically possible if linear programming were used to reallocate cropland among the selected crops on the same size of land cultivated in the 2012 July to September cropping season. This mean profit per household is more than twice the current mean profit of crop production under conventional cropland allocation practices. Moreover, in this scenario the minimum aggregate food crop production requirements for consumption of each crop are met—as shown in the surplus production column of Table 6.

3.3.3. Profit Performance of Scenario #3

Again, using parameter estimates from Table 4 and Table 5, Scenario #3 is formulated as an LP problem, as follows (Equation (7)):
Maximize Profit ( π ) = 15635.2 * L wheat + 9571.36 * L maize + 13392.6 * L potato + 39834.6 * L beetroot + 49074.1 * L carrot + 11365.6 * L barley Subject   to : L wheat + L maize + L potato + L beetroot + L carrot + L barley 47.77 ( Aggregated   Land ) 10467.37 * L wheat + 8160.47 * L maize + 12392.22 * L potato + 5702.01 * L beetroot + 8265.88 * L carrot + 8514.31 * L barley 850636 ( Aggregated   Crop   Budget ) 4500 * L wheat 51250 ( Aggregated   wheat   production   required   for   consumption ) 7000 * L maize 36710 ( Aggregated   maize   production   required   for   consumption ) 29130 * L photato 30316 ( Aggregated   potato   production   required   for   consumption ) 28000 * L beetroot 4850 ( Aggregated   beetroot   production   required   for   consumption ) 30000 * L carrot 4450 ( Aggregated   carrot   production   required   for   consumption ) 3550 * L barley 7100 ( Aggregated   barley   production   required   for   consumption ) L wheat , L maize , L potato , L beetroot , L carrot , L barley 0
Yield per hectare of land for each crop in this model is the theoretically attainable yield drawn from the national crop variety release report from the Ethiopian Ministry of Agriculture and Rural Development; the other parameters are the same as in Scenario #2.
Solving the Scenario #3 LP model results in a total profit of ETB 1,576,009.027 that could in theory be achieved from the same amount of land currently under cultivation (Table 7). The profit from Scenario #3 is again more than twofold that of the current cropland allocation (Scenario #1). Moreover, in Scenario #3, the minimum food crop production requirement for consumption is also met (like in Scenario #2). The difference in possible profit from Scenario #3 to Scenario #2 (ETB 228,137.82) is much smaller when compared to the difference between the reference scenario (Scenario #1) and either Scenario #2 (ETB 756,546.62) or Scenario #3 (ETB 984,684.4).
This result suggests that the profit performance of crop production in the study area may be relatively more compromised by inefficiencies in cropland allocation than by barriers to the realization of expected theoretical farm field yields per hectare.
In both models, Scenario #2 and Scenario #3, land was allocated to crops other than carrot only for the purpose of satisfying minimum food crop production requirement for consumption. In both models, carrot was the most economically attractive crop from among the six crops considered.

3.4. Sensitivity Analysis

Sensitivity analysis is an important aspect of decision making particularly in questions of resource allocation, including land use decisions. In addition to allowing the researcher to investigate the stability of the models in response to variation in parameter estimates used, sensitivity analyses also provide the opportunity to further highlight changes that might be observed in the value of the target objective if a constraint is relaxed or tithed.
Sensitivity analysis reports for both Scenario #2 and Scenario #3 suggest that crop budget is not currently the limiting factor in maximizing profit among farm households in the sample (Table 8). Rather, land size is the most evident common limiting factor in regards to maximizing profit from crop production; an additional hectare of land has the potential to increase aggregate profit by ETB 49,074.1 and ETB 53,480.9 in Scenario #2 and Scenario #3, respectively. The aggregated minimum food crop production requirement for consumption constraints except for carrot are binding in both scenarios, with beetroot the most profitable and barley the least profitable of the remaining crops (all are less profitable than carrot). In the absence of an expansion in the availability of cropland, the results of this study suggest that the use of decision support systems, such as linear programming-based cropland allocation, might significantly improve crop production performance in terms of both profitability and meeting local production demand for food crops for consumption. These findings coincide with other effective applications of linear programming in decision-making processes from forestry [36], waste management [19], and other instances related to land use optimization [37].

3.5. Aggregated Land Allocation Comparison in the Three Scenarios

Optimal land allocation for each of the selected crops, as determined through linear programming, is quite different from conventional methods of cropland allocation. The amount of land allocated for wheat under the status quo is at least halved under an optimal linear programming-based allocation, whereas land allocated for carrot is increased more than tenfold. This indicates that, provided all factors, such as market demand and climate variables are favorable for both crops, production of wheat is much less profitable when compared to carrot. Similar studies in Zimbabwe [38], Nigeria [39], and Egypt [40] are consistent with this finding.

3.6. Current Cropland Allocation & Crop Selection Factors

Based on key informant interviews that were conducted prior to the household surveys, four major factors hypothesized to drive cropland allocation decisions (with at least two sub-factors each) were included in the survey questionnaire so as to better understand what considerations shape cropland allocation. Household survey participants ranked household food crop consumption requirements as the most important factor in determining cropland allocation, followed by productivity per hectare and ecological factors (crop rotation, soil fertility management) as the second and third most important influences on their land use choices (Table 9). These results suggest that ecological factors, such as soil fertility management, impacts of land use choices on the land uses of adjacent areas, and the avoidance of cultivation on steep slopes may be less salient factors for cropland allocation when compared to socio-economic and production-related factors.

3.7. Implications of the Use of Linear Programming-Based Cropland Allocation for Sustainable Use of Resources and Conservation

To assess respondents’ current involvement and awareness of natural and environmental resource management, sampled household heads were asked about their involvement in forest conservation, soil fertility management, and their perception of barriers and opportunities for participation in natural and environmental resource management. Results of the household survey revealed that the role of natural resources, such as forests, land, and water are well noted among most community members. All participant households in this study indicated that leaving crop residues on crop fields significantly improves soil fertility and reduces land degradation, both of which relate to the productivity of agriculture [41]. The views of these farm households are in line with results from existing studies that find significant impacts of crop residues on soil fertility [32,33,42]. Additionally, forests in and around the locality are perceived as a fundamentally important resource in terms of various ecosystem services—particularly for promoting rainfall at the right time and in the desired quantity. However, due to the pressing problems presented by household food crop production demands and cooking energy requirements, the majority of respondents reported encroaching into natural forests to collect fuel wood (88%), and collecting crop residues from fields to burn (94.7%). A study by Simon and others in similar smallholder agriculture areas shows awareness to be a major factor in determining participation in conservation practices and environmental resource management [43]. However, in our study, the performance of livelihood practices in general and crop productivity in particular are the strongest factors limiting the active conservation of natural and environmental resources.
Results of the household survey, key informant interviews and focus group discussions indicate that households in Abaro kebele are willing to stop environmentally harmful practices, such as crop residue collection and natural forest encroachment, while instead engaging in natural and environmental resource management if crop production performance can be enhanced to meet household food crop production requirements and generate a profit. In other words, in a context where cropland allocation decisions are largely driven by short-term subsistence production goals, short-term land use choices may exacerbate long-term resource degradation—and ultimately threaten efforts to meet household food production goals. Inversely, a combination of improved technology and improved cropland allocation (potentially informed by LP-based methods) might foster improved natural resource management, and thereby help to sustain both short-term and long-term food production. Our results showing large potential land productivity gains under alternative cropland allocation scenarios based on linear programming are consistent with past findings, such as Joneydi [44] and Nwaiu et al. [45], particularly with regard to the potential for increasing returns from crop production among those households willing and able to cultivate more profitable horticulture crops alongside subsistence crops.

4. Conclusions and Recommendations

This study evaluated the performance of cropland allocation under the status quo when compared to linear programming-based cropland allocations in terms of meeting profit goals and meeting food crop production requirements, and also considered the relationship between land use efficiency and the willingness to participate in environmental resource management. The results from a single rural community in Southern Ethiopia suggest that the overall performance of linear programming-based cropland allocation offer significantly higher returns than current cropland allocation methods. Under the status quo cropland allocation, households were not even able to meet the minimum required food crop production levels for all crops—while through a linearly programmed land use allocation, the profit potential was more than doubled.
There is also some evidence that the poor performance of current cropland allocation practices may exacerbate environmentally harmful practices, such as crop residue collection and forest encroachment. Although smallholder farmers in this study generally reported recognizing forest ecosystem services and the role of natural and environmental resources as important, the decline in economic returns from crop and livestock production have led to the adaptation of environmentally damaging practices, such as collection of crop residue, illegal timber, and fuel wood from nearby forests [41]. While our LP models only imposed a constraint on total land area for cropping, other environmental factors, such as diminished cultivation in steep slopes, improved soil fertility management, and crop rotation are other important considerations for cropland allocation, which might be considered as constraints in a more complex linear programming land allocation effort.
Finally—provided that all necessary information with regard to input and output prices, land suitability, potential yield, and climate factors are in place—the result of this study support the expanded use of improved decision support tools, such as linear programming for cropland allocation specifically and in agricultural practices more generally. Doing so will help to address the twin objectives of reducing poverty and realizing the sustainable utilization of natural and environmental resources in smallholder agricultural landscapes [46]. The use of linear programming in cropland allocation might help to enhance crop production performance in terms of both maximizing profit and enhancing food security, while taking ecological, financial, and social factors into consideration.

Author Contributions

All authors contributed a lot from conceptualization to final preparation of this work. Specifically “Conceptualization, M.T.M.; Methodology, M.T.M. and T.W.R.; Software, M.T.M.; Validation, M.T.M., T.W.R. and T.W.; Formal Analysis, M.T.M.; Investigation, M.T.M.; Resources, Wondo Genet College of Forestry and Natural Resources, Hawassa University; Data Curation, M.T.M.; Writing-Original Draft Preparation, M.T.M.; Writing-Review & Editing, M.T.M., T.W.R. and T.W.; Supervision, T.W.R. and T.W.; Project Administration, M.T.M.; Funding Acquisition, M.T.M.”.

Funding

This research was funded by Wondo Genet College of Forestry and Natural Resources Research and Technology Transfer Office, Hawassa University.

Acknowledgments

We would like to acknowledge Wondo Genet College of Forestry and Natural Resources and Hawassa University for financing this study. Conor McCracken provided excellent research assistance.

Conflicts of Interest

The authors declare no conflict of interest.

References

  1. Central Statistical Agency (CSA). Summary and Statistical Report of the 2007 Population and Housing Census Results; Central Statistical Agency (CSA): Addis Ababa, Ethiopia, 2008.
  2. World Bank Open Data. Available online: https://data.worldbank.org/ (accessed on 13 November 2018).
  3. FDRE. GTP Annual Progress Report (2010–11); Ministry of Finance and Economic Development: Addis Ababa, Ethiopia, 2012.
  4. Bengtsson, B. Agricultural Research at the Crossroads: Revisited Resource-Poor Farmers and the Millennium Development Goals; Science Publishers: Enfield, NH, USA, 2007; ISBN 978-1-57808-514-9. [Google Scholar]
  5. Gebremedhin, B.; Hoekstra, D.; Tegegn, A. Commercialization of Ethiopian Agriculture: Extension Service from Input Supplier to Knowledge Broker and Facilitator. IPMS (Improving Productivity and Market Success) of Ethiopian Farmers Project Working Paper 1; ILRI (International Livestock Research Institute): Nairobi, Kenya, 2006. [Google Scholar]
  6. Berhanu, A. The Ethiopian Extension and the Farmer: A View from the Farm. In Proceedings of the 16th International Conference of Ethiopian Studies, Trondheim, Norway, 2009; pp. 751–760. [Google Scholar]
  7. FDRE. Ethiopian Climate Resilient Green Economy (CRGE) Strategy; Government of Ethiopia: Addis Ababa, Ethiopia, 2011.
  8. Trostle, R. Global Agricultural Supply and Demand: Factors Contributing to the Recent Increase in Food Commodity Prices; US Department of Agriculture, Economic Research Service: Washington, DC, USA, 2008.
  9. Esther, T.Z. Profitability of Smallholder Cowpea Production in Zambia. Bachelor’s Thesis, University of Zambia, Lusaka, Zambia, 2011. [Google Scholar]
  10. Munthali, K.; Murayama, Y. Interdependences between Smallholder Farming and Environmental Management in Rural Malawi: A Case of Agriculture-Induced Environmental Degradation in Malingunde Extension Planning Area (EPA). Land 2013, 2, 158–175. [Google Scholar] [CrossRef]
  11. Food and Agriculture Organization (FAO). Food Security for Sustainable Development and Urbanization: Inputs for FAO’s Contribution to the 2014 ECOSOC Integration Segment; FAO: Rome, Italy, 2014. [Google Scholar]
  12. Zewdie, B. Perceptions on Forest Resource Changes in and Around Wondo Genet Catchment and Its Near Future Impacts. Master’s Thesis, Sewedish University of Agricultural Sciences, Uppsala, Sweden, 2002. [Google Scholar]
  13. Lemma, A. Site Action Plan for the Conservation and Sustainable Use of the Lake Awasa Biodiversity (Rift Valley Lakes Project); Institute of Biodiversity: Addis Ababa, Ethiopia, 2005. [Google Scholar]
  14. Dessie, G. Forest Decline in South Central Ethiopia: Extent, History and Process; Stockholm University: Stockholm, Sweden, 2007. [Google Scholar]
  15. Kahsay, G.A.; Hansen, L.G. The effect of climate change and adaptation policy on agricultural production in Eastern Africa. Ecol. Econ. 2016, 121, 54–64. [Google Scholar] [CrossRef]
  16. Boatman, N.; Stoate, C.; Gooch, R.; Carvalho, C.R.; de Snoo, G.; Eden, P. The Environmental Impact of Arable Crop productionin the European Union: Practical Options for Improvement; Center of Environmental Science, Leiden University: Leiden, The Netherlands, 1999. [Google Scholar]
  17. Asefa, S.; Zegeye, T. Rural Poverty, Food Insecurity and Environmental Degradation in Ethiopia: A Case Study from South Central Ethiopia. In Proceedings of the International Conference on Development Studies in Ethiopia, Addis Ababa, Ethiopia, 11–12 July 2003. [Google Scholar]
  18. Baden, S.; Harvey, C. Small Farmers, Big Change: Scaling up Impact in Smallholder Agriculture; Wilson, D., Wilson, K., Harvey, C., Eds.; Oxfam: Oxford, UK, 2011; ISBN 978-1-85339-712-7. [Google Scholar]
  19. Chen, X.J.; Huang, G.H.; Zhu, H.; Suo, M.Q.; Dong, C. Inexact inventory theory-based waste management planning model for the city of Xiamen, China. J. Environ. Eng. 2016, 142, 1939–1955. [Google Scholar] [CrossRef]
  20. Delgado-Matas, C.; Pukkala, T. Optimisation of the traditional land-use system in the Angolan highlands using linear programming. Int. J. Sustain. Dev. World Ecol. 2014, 21, 138–148. [Google Scholar] [CrossRef]
  21. Govindrao, S.R.; Kabeer, S.J. Linear Programming Problem (LPP) and Geographic Information System. J. Stat. Math. 2011, 2, 59–62. [Google Scholar]
  22. Chamheidar, H.; Nikkami, D.; Mahdian, M.H.; Pazira, E.; Ghafouri, M. Soil Loss minimization Through Land use Optimization. World Appl. Sci. 2011, 12, 76–82. [Google Scholar]
  23. Walangitan, H.D.; Setiawan, B.; Tri Raharjo, B.; Polii, B. Optimization of land use and allocation to ensure sustainable agriculture in the catchment area of Lake Tondano, Minahasa, North Sulawesi, Indonesia. Int. J. Civ. Environ. Eng. 2012, 12, 68–75. [Google Scholar]
  24. Eshetu, Z.; Hogberg, P. Effects of land use on 15N natural abundance of soils in Ethiopian highlands. Plant Soil 2000, 222, 109–117. [Google Scholar] [CrossRef]
  25. Woldeamanuel, T. Analysis of Subsistence Farmers Rationales in Switching to Commercial Agriculture and Tradables the Case of Small Farmers in Wondo Genet, Southern Ethiopia; Wagenigen University: Wagenigen, The Netherlands, 2003. [Google Scholar]
  26. Food and Agriculture Organization of the United Nations (FAOSTAT). Producer Proces—Annual. Available online: http://www.fao.org/faostat/en/#data/PP (accessed on 5 November 2016).
  27. Ministry of Agriculture and Rural Development (MoARD). Animal and Plant Health Regulatory Directorate Crop Variety Register Issue; Ministry of Agriculture and Rural Development Animal and Plant Health Regulatory Directorate: Addis Ababa, Ethiopia, 2009.
  28. Mpandeli, S.; Maponya, P. Constraints and Challenges Facing the Small Scale Farmers in Limpopo Province, South Africa. J. Agric. Sci. 2014, 6, 135–143. [Google Scholar] [CrossRef]
  29. Wankhade, M.O.; Lunge, H.S. Allocation of agricultural land to the major crops of saline track by linear programming approach: A case study. Int. J. Sci. Technol. Res. 2012, 1, 21–25. [Google Scholar]
  30. Jaleta, M.; Gebremedhin, B.; Hoekstra, D.A. Smallholder Commercialization: Processes, Determinants and Impact; International Livestock Research Institute: Addis Ababa, Ethiopia, 2009. [Google Scholar]
  31. Mugabe, D.; Chipunza, N.; Mupaso, N.; Munyati, V.T.; Makarudze, F.V. Estimation of Optimal Land Use Allocation Among Small Holder (A1) Farmer Households in Zimbabwe. A Case Study of Long Croft Farm, in Mazowe District. J. Agric. Sci. 2014, 6, 170–181. [Google Scholar] [CrossRef]
  32. Philor, L. Erosion Impacts on Soil and Environmental Quality: Vertisols in the Highlands Region of Ethiopia; Soil and Water Science Department, University of Florida: Gainesville, FL, USA, 2011; pp. 269–274. [Google Scholar]
  33. Tefera, T.L.; Perret, S.; Kirsten, J.F. Diversity in Livelihoods and Farmers’ Strategies in the Hararghe Highlands, Eastern Ethiopia. Int. J. Agric. Sustain. 2004, 2, 133–146. [Google Scholar] [CrossRef]
  34. Maliwichi, L.L.; Pfumayaramba, T.K.; Katlego, T. An analysis of constraints that affect smallholder farmers in the production of tomatoes in Ga-Mphahlele, LepelleNkumbi Municipality, Limpopo Province, South Africa. J. Hum. Ecol. 2014, 47, 269–274. [Google Scholar] [CrossRef]
  35. Minot, N.; Sawyer, S. Input Use in Ethiopia: Results of the 2012 ATA Baseline Survey; International Food Policy Research Institute: Washington, DC, USA, 2013. [Google Scholar]
  36. Lappi, J.; Lempinen, R. A linear programming algorithm and software for forest-level planning problems including factories. Scand. J. Res. 2014, 29, 178–184. [Google Scholar] [CrossRef]
  37. Gadge, S.B.; Gorantiwar, S.D.; Kumar, V.; Kothari, M. Linear programming approach for allocation of land and water resources in Canal Command Area under surface method of irrigation—A case study. Int. J. Innov. Res. Sci. Eng. Technol. 2014, 3, 153–168. [Google Scholar]
  38. Felix, M.; Judith, M.J.; Munashe, S. Modeling a small farm livelihood system using linear programming in Bindura, Zimbabwe. Res. J. Manag. Sci. 2013, 2, 20–23. [Google Scholar]
  39. Igwe, K.C.; Onyenweaku, C.E. A Linear programming approach to food crops and livestock enterprises planning in Aba agricultural zone of Abia State, Nigeria. Am. J. Exp. Agric. 2013, 3, 412–431. [Google Scholar] [CrossRef]
  40. Ahmed, S.P.; Sayed Nawal, S. Efficient allocation of scarce water resources and irrigation water management in Egypt. Afr. J. Agric. Econ. Rural Dev. 2015, 3, 176–184. [Google Scholar]
  41. Reynolds, T.W.; Farley, J.; Huber, C. Investing in human and natural capital: An alternative paradigm for sustainable development in Awassa, Ethiopia. Ecol. Econ. 2010, 69, 2140–2150. [Google Scholar] [CrossRef]
  42. Baudron, F.; Jaleta, M.; Okitoi, O.; Tegegn, A. Conservation agriculture in African mixed crop-livestock systems: Expanding the niche. Agric. Ecosyst. Environ. 2014, 187, 171–182. [Google Scholar] [CrossRef]
  43. Simon, B.; Garba, A.; Bunu, G.M. Determinants of sustainable agricultural land management practices among arable crop farmers in northern part of Taraba State, Nigeria. ARPN J. Sci. Technol. 2013, 3, 726–730. [Google Scholar]
  44. Joneydi, M.S. Factors affecting in sustainability of agricultural production systems in Iran. Ann. Biol. Res. 2012, 3, 4578–4583. [Google Scholar]
  45. Nwaiwu, I.U.O.; Ohajianya, D.O.; Orebiyi, J.S.; Eze, C.C.; Ibekwe, U.C. Determinants of agricultural sustainability in Southeast Nigeria: The case of climate change debacle. Glob. J. Agric. Res. 2013, 1, 1–13. [Google Scholar]
  46. Ministry of Agriculture and Rural Development (MoARD). Food Security Program 2010–2014; Ministry of Agriculture and Rural Development: Addis Ababa, Ethiopia, 2009.
Figure 1. Map of the study area.
Resources 07 00076 g001
Table 1. Socioeconomic characteristics of survey respondents.
No.ParameterNMean (± SE)MinimumMaximum
1Male-headed household750.890--
2Married household head750.813--
3Divorced household head750.133
4Age (years)7540.1 (± 11.204)2470
5Education (Grades completed)752.97 (± 3.507)012 + 1
6Land holding (ha)750.77 (± 0.40)0.252.0
7Rented land for crop production (ha)750.074 (± 0.18)01
Table 2. Crops grown in the study area (July to September 2012).
No.CropScientific Name% of Households Harvesting (n = 75)
1WheatTriticum aestivum93.7%
2MaizeZea mays70.7%
3PotatoSolanum tuberosum49.3%
4BeetrootBeta vulgaris49.3%
5CarrotDaucus carota29.3%
6BarleyHordeum vulgare26.7%
7CabbageBrassica oleracea14.7%
8SorghumSorghum vulgare5.3%
9Haricot beanPhaseolus vulgaris4.0%
10GarlicAllium sativum4.0%
11Finger milletEleusine coracana1.3%
12TeffEragrostis tef1.3%
Table 3. Percentage of households not realizing minimum food crop production requirements for consumption based on current land allocation practice.
No.CropTotal Number of Producers% of Households Not Realizing Production Requirement for Consumption (n = 75)
1Wheat7317.8%
2Maize5068.0%
3Potato3625.0%
4Beetrootot234.3%
5Carrot1936.8%
6Barley310.0%
Table 4. Parameter estimates for the six study crops.
No.Crop NameMean Estimated Cost Per Hectare (ci) (ETB)Mean Estimated Current Yield Per Hectare (kg)Mean Theoretical Farm Field Yield Per Hectare (kg)Minimum Production Requirement for Consumption (kg)Mean Profit Per Hectare (ETB)
1Wheat10,461.374560.64450051,25015,635.24
2Maize8160.475764.71700036,7109571.32
3Potato12,392.229908.3329,13030,31613,392.61
4Beetroot5702.0116,614.8128,000485039,834.64
5Carrot8265.8820,323.8130,000445049,074.12
6Barley8514.3144003550710011,365.69
Sources: 2012 Household survey; FAO, 2015.
Table 5. Scenario #1 (Reference Scenario) Model Output Summary.
No.Crop Land Allocation (ha)Profit (ETB)Minimum Production Requirement for Consumption (kg)Total Harvest (kg)Surplus Production (kg)
1Wheat23.69282,082.5251,25087,60036,350
2Maize6.1931,843.8036,71022,92513,785
3Potato6.5686,270.0230,31669,00038,684
4Beetroot3.2286,651.86485042,20037,350
5Carrot1.9978,096.35445032,70028,250
6Barley2.1326,380.05710082001100
Total43.77591,324.60
Table 6. Scenario #2 Model Linear Programming Output Summary.
No.Crop Scenario #2 Land Allocation (ha)Scenario #2 Profit (ETB)Minimum Requirement for Consumption (kg)Total Harvested (kg)Surplus Production (kg)
1Wheat11.24175,700.3351,25051,2500
2Maize6.3760,950.6936,71036,7100
3Potato3.0640,976.6630,31630,3160
4Beetroot0.3011,628.06485048500
5Carrot21.201,040,275.404450430,825426,375
6Barley1.6118,340.09710071000
Total Land43.771,347,871.22
Table 7. Scenario #3 Linear Programming Model Output Summary.
No.Crop Scenario #3 Land Allocation (ha)Scenario #3 Profit (ETB)Minimum Requirement for Consumption (kg) Total Harvested (kg)Surplus Production (kg)
1Wheat11.39184,600.2251,25051,2500
2Maize5.2439,456.2036,71036,7100
3Potato1.0447,772.5430,31630,3160
4Beetroot0.178465.91485048500
5Carrot23.921,279,351.934450717,649.41713,199.4
6Barley2.0016,362.22710071000
Total43.771,576,009.03
Table 8. Summary of Sensitivity Analyses.
No.ConstraintsShadow Price
Scenario #2 Scenario #3
1Aggregated Crop Production Budget00
2Aggregated Total Land Size49,074.153,480.93
3Minimum Production Requirement for consumption of Wheat−7.33−8.28
4Minimum Production Requirement for consumption of Maize−6.85−6.57
5Minimum Production Requirement for consumption of Potato−3.60−0.26
6Minimum Production Requirement for consumption of Beetroot−0.56−0.16
7Minimum Production Requirement for consumption of Carrot00
6Minimum Production Requirement for consumption of Barley−8.57−12.76
Table 9. Summary of Key Factors Driving Cropland Allocation and Crop Choice.
RankMain FactorPercent of Respondents (n = 75)Sub FactorSub Factor Rank
1Socio-Economic Factors37.9%Household Food Crop Consumption Requirement1
Custom Food Production Requirement2
2Productivity Factors22.4%Productivity per Unit of Land1
Expected Price2
3Ecological Factors20.7%Crop Rotation1
Soil Fertility Management 2
Rain Fall3
Adjacency to different land uses4
Land Slope5
4Input Price Factors19%Price of Fertilizer1
Price of Improved Seed2
Price of Pesticide 3
Wage of Labor4

