1. Introduction
Open stope mining, particularly sublevel stoping, is widely used in underground operations due to its efficiency in ore extraction. However, this method is operationally complex and requires precise planning to ensure economic viability and safety [
1]. One of its major challenges is unplanned dilution, which occurs when waste or low-grade material is unintentionally extracted along with the ore. This issue compromises productivity, increases processing costs, and reduces metal recovery [
2]. Performance indicators such as underbreak (UB)—related to unmined ore—and overbreak (OB)—related to the unintended extraction of waste material—are commonly used to evaluate stope performance. Optimal stope performance occurs when there are minimal overbreak and underbreak rates, ensuring a balance between stability and operational efficiency [
3].
Unplanned dilution results from a combination of geomechanical and operational factors, including rock mass quality, stope geometry, and in situ stress conditions [
4]. Accurate prediction of dilution is therefore essential for optimizing production and minimizing geotechnical risk. However, current practices still struggle to reliably forecast this phenomenon, especially in variable geological settings.
The Mathews-Potvin stability graph, introduced in the 1980s by Mathews et al. [
5], remains one of the most widely used empirical tools for stope stability design. It correlates the modified stability number (N’), derived from Barton et al.’s Q’ [
6], with hydraulic radius (HR) [
7] to define stability zones and guide support decisions. Over the years, this method has been refined by various researchers, including Potvin [
8], Nickson [
9], Stewart and Forsyth [
10], Trueman et al. [
11], and Stewart, Trueman, and Kruttscnitt [
12], particularly to enhance design accuracy for cable-supported stopes. Nevertheless, its application is often based on datasets from North American and Australian mines [
13], characterized by favorable geological conditions—such as steep ore bodies and high-quality rock masses. These assumptions may not hold in mines with lower rock quality, such as those commonly found in Brazil, leading to potential over- or underestimation of dilution risks [
14].
A key advancement in dilution analysis was the development of the Equivalent Linear Overbreak/Slough (ELOS) metric, developed by Clark and Pakalnis [
15], which quantifies volumetric overbreak along stope surfaces. Later, Capes and Milne [
16] expanded the original database and applied this methodology to open stope design, incorporating the capability to predict overbreak. Despite this, many mines still lack robust statistical methods for efficiently predicting overbreak and dilution. Additional studies show that overbreak is influenced not only by traditional design parameters such as hydraulic radius, stope inclination, and rock mass quality but also by the orientation of stope walls [
17]. While ELOS is now used in many operations, it is often disconnected from empirical stability tools, and the mining industry still lacks integrated statistical approaches for reliably predicting unplanned dilution.
This study presents an empirical–statistical framework that integrates the Mathews-Potvin stability chart, ELOS calculation, and regression modeling to evaluate and predict unplanned dilution in sublevel stoping operations. It investigates three categories of stopes—cable-bolted, non-cable-bolted, and naturally stable—to assess the reliability of stability predictions and the effectiveness of support strategies.
This work represents the first Brazilian documented case study that couples Potvin analysis with ELOS back-analysis to derive a practical correction equation. The calibrated forecasts not only improve geotechnical reliability but also enhance resource accessibility: more accurate dilution estimates tighten grade-control cut-offs, reduce waste haulage, and extend mine life. The framework is straightforward to adopt wherever a mine possesses a modest back-analysis database, offering a cost-effective pathway to better extraction efficiency.
2. Literature Review
2.1. Mathews-Potvin Stability Graph
The Mathews-Potvin stability graph is an empirical method widely used for open stope design, enabling the prediction of the stability of underground excavations during ore extraction [
18]. Its formulation is based on the correlation between geotechnical data and stope performance in underground metal mines, providing a practical tool to evaluate the viability of different excavation geometries under specific geomechanical conditions.
The Mathews-Potvin stability graph [
5] remains the industry benchmark for empirical open stope design. It correlates the modified stability number (N′) with the hydraulic radius (HR) and delineates three stability zones. Subsequent expansions of the case-history database—notably Potvin [
8], Nickson [
9]) and Stewart and Forsyth [
10]—refined guidance for cable-bolted stopes. More recent studies have revisited adjustment factors for N′ (e.g., Vallejos et al. [
19]; Zhao & Zhou [
20], but the core graphical method has changed little in four decades. Crucially, the underlying database reflects hard-rock mines with steep ore bodies and relatively high rock mass quality; when transferred to lower-quality settings, the graph frequently overestimates dilution.
The stability of the stopes assessed in this study was evaluated using the modified stability number (N′) and the hydraulic radius (HR), which are the fundamental parameters of the chart.
The modified stability number (N′), represented on the y-axis of the chart, reflects the rock mass’s ability to be self-supporting under certain stress conditions. It is derived from the modified rock quality index (Q′), adjusted by factors that account for acting stress characteristics and discontinuities in the rock mass.
The hydraulic radius (HR), represented on the x-axis, is a geometric measurement related to the excavation area and perimeter. It is calculated using the following equation:
Stopes with larger HR values tend to be more susceptible to instability, as the relation between their area and perimeter influences stress redistribution around the excavation.
Equation (2) is used to determine N′:
where
N′ = modified stability number;
Q′ = modified rock quality index;
A = rock stress factor;
B = joint orientation factor;
C = gravity adjustment factor.
The Q′ is obtained from Barton, Lien, and Lunde’s [
6] original equation, modified by setting the quotient Jw/SRF equal to 1, presented in Equation (3):
The six parameters are as follows:
RQD = Rock Quality Designation, defined as the percentage ratio between the sum of core pieces equal to or greater than 100 mm and the total length drilled;
Jn = joint set number;
Jr = joint roughness number;
Ja = joint alteration number;
Jw = joint water reduction factor;
SRF = Stress Reduction Factor [
21].
The factors A, B, and C used in Equation (2) for calculating N’ are as follows:
Rock stress factor (A): it represents the stress conditions around the stope, including mining depth and rock mass strength to stress redistribution;
Joint orientation factor (B): it measures the impact of geological discontinuity orientations in relation to stope geometry, fundamental for predicting potential failure mechanisms;
Gravity adjustment factor (C): it considers the influence of stope wall inclination on excavated surface stability, evaluating processes such as spalling, block fall, and sliding [
5,
22].
2.2. Dilution in Geotechnical Perspective and Mine Planning
Dilution can be classified as planned or unplanned. Planned dilution occurs due to waste rock inclusions that cannot be separated during mining and are already considered in resource estimates. Unplanned dilution, on the other hand, results from overbreak (unintentional excavation beyond planned boundaries) or material detachment from the hanging wall (HW) and stope sidewalls during mining [
23].
Dilution can be interpreted differently by geotechnical engineering and mining planning. While geotechnical engineering assesses dilution based on stope stability and rock mass conditions, mine planning defines dilution based on compliance with designed excavation limits.
2.2.1. Dilution from Geotechnical Perspective
Geotechnical engineering considers dilution based on stope stability, using predictions derived from orebody geometry and geomechanical rock mass conditions. Geotechnical planned dilution refers to the portion of waste rock material deemed unavoidable to maintain the structural integrity of the stope. This value is determined through geomechanical analyses considering parameters such as rock strength, in situ stresses, and structural characteristics.
When dilution exceeds geotechnical predictions, it results in hanging wall overbreak, representing geotechnically unplanned dilution. Such excessive dilution indicates that rock mass conditions or mineralized body geometry failed to adequately predict stope instability, leading to the additional loss of excavation boundary control.
2.2.2. Dilution from Mine Planning Perspective
In mine planning, dilution is evaluated from an operational and economic standpoint, focusing on adherence to the mining plan. Thus, any material extracted beyond planned stope boundaries is considered unplanned dilution, regardless of geotechnical predictions. This concept is directly related to minimizing waste rock extraction and optimizing ore recovery in pursuit of higher mining efficiency.
The dilution percentage can be calculated using various methods based on mined tonnage. Two commonly used criteria were presented by Scoble and Moss [
23], as demonstrated in Equations (4) and (5):
However, Equation (4) is the most recommended and is widely adopted as the standard metric, as proposed by Akalnis, Poulin, and Hadjigeorgiou [
24].
Thus, while geotechnical predictions may deem certain dilution acceptable based on rock mass conditions, mine planning might view the same dilution as a deviation from design, as its focus lies in compliance with the mining model. This conceptual difference can directly influence decision making in dilution control, impacting both operational strategies and economic optimization criteria.
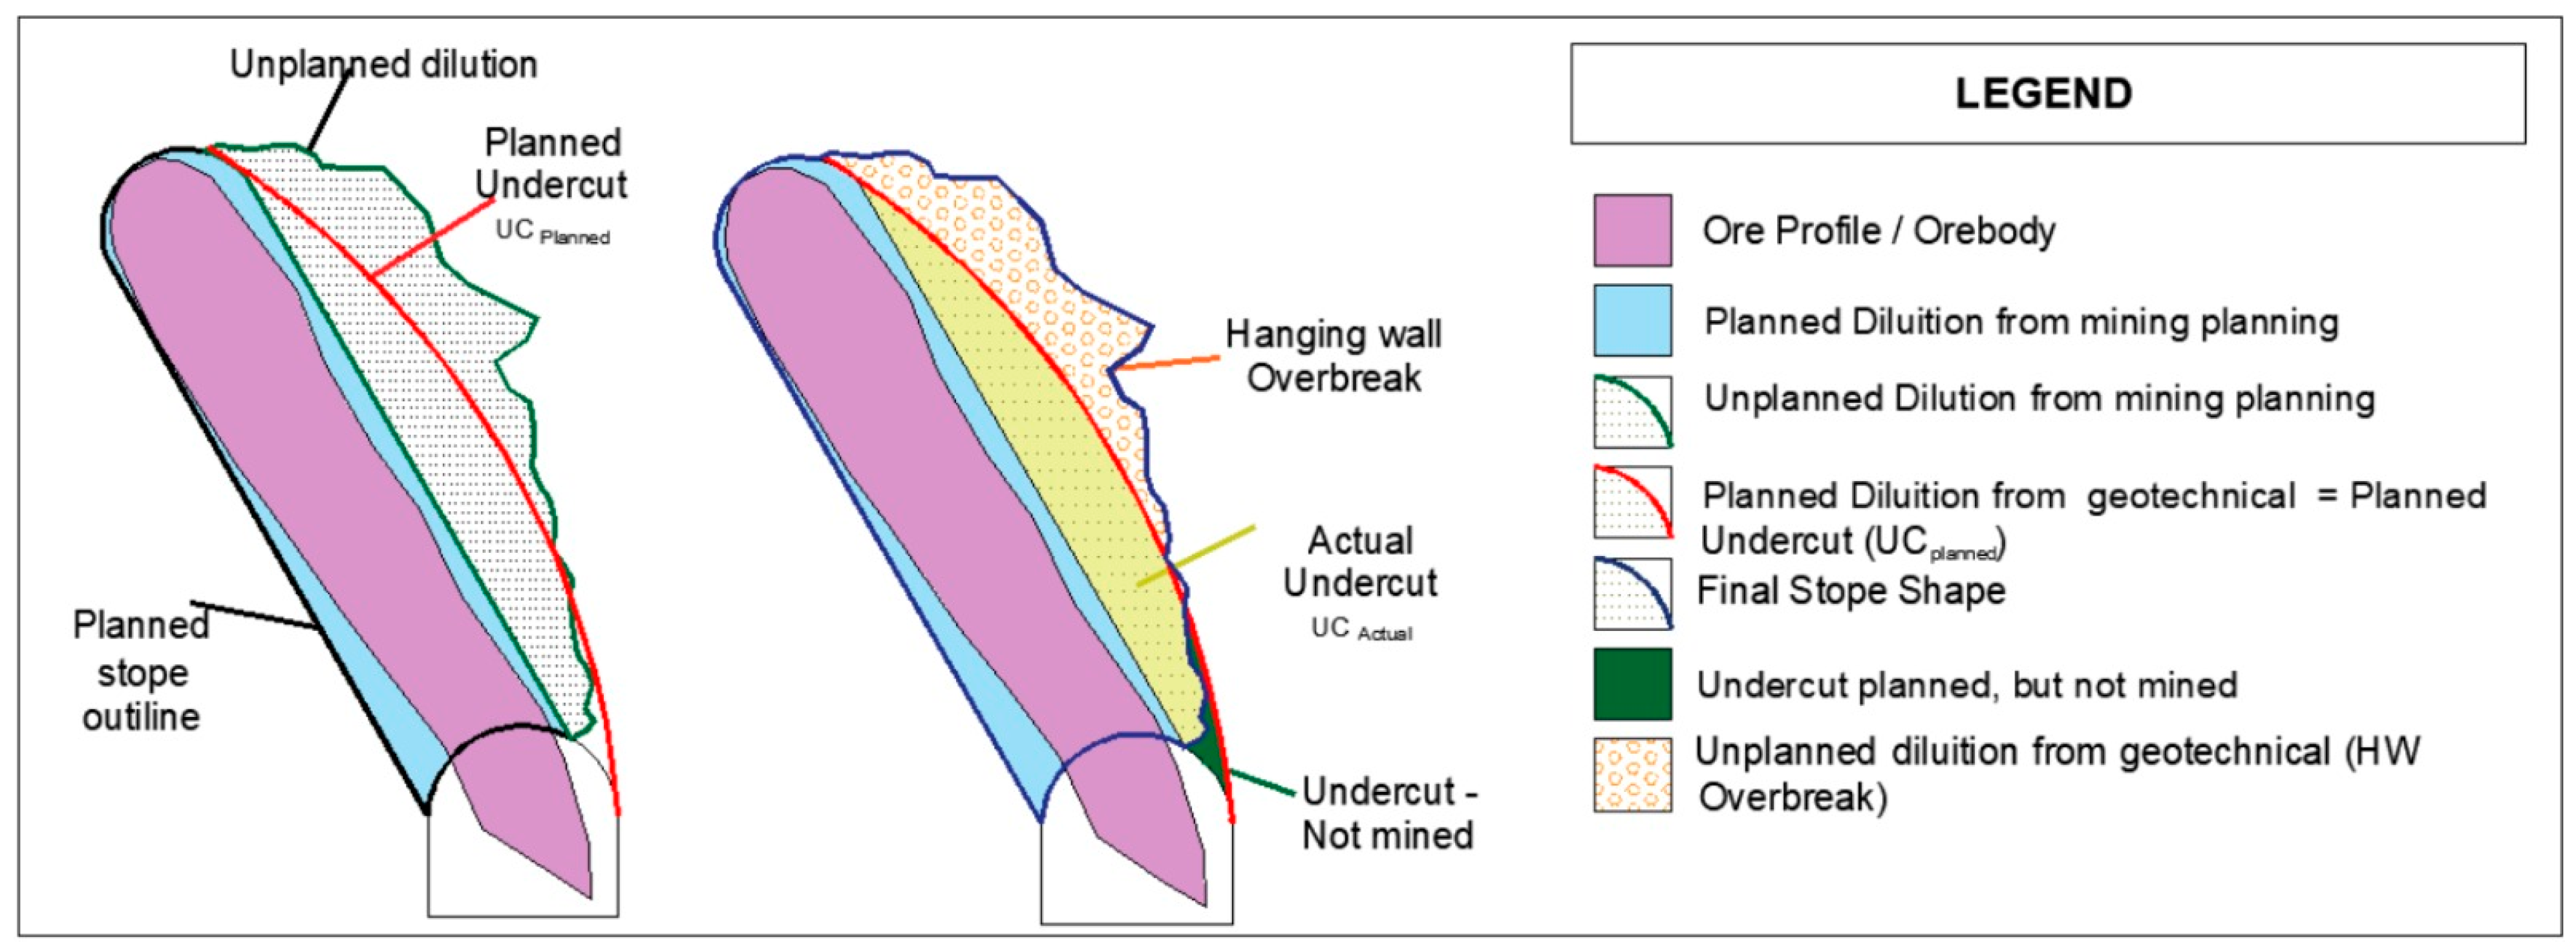
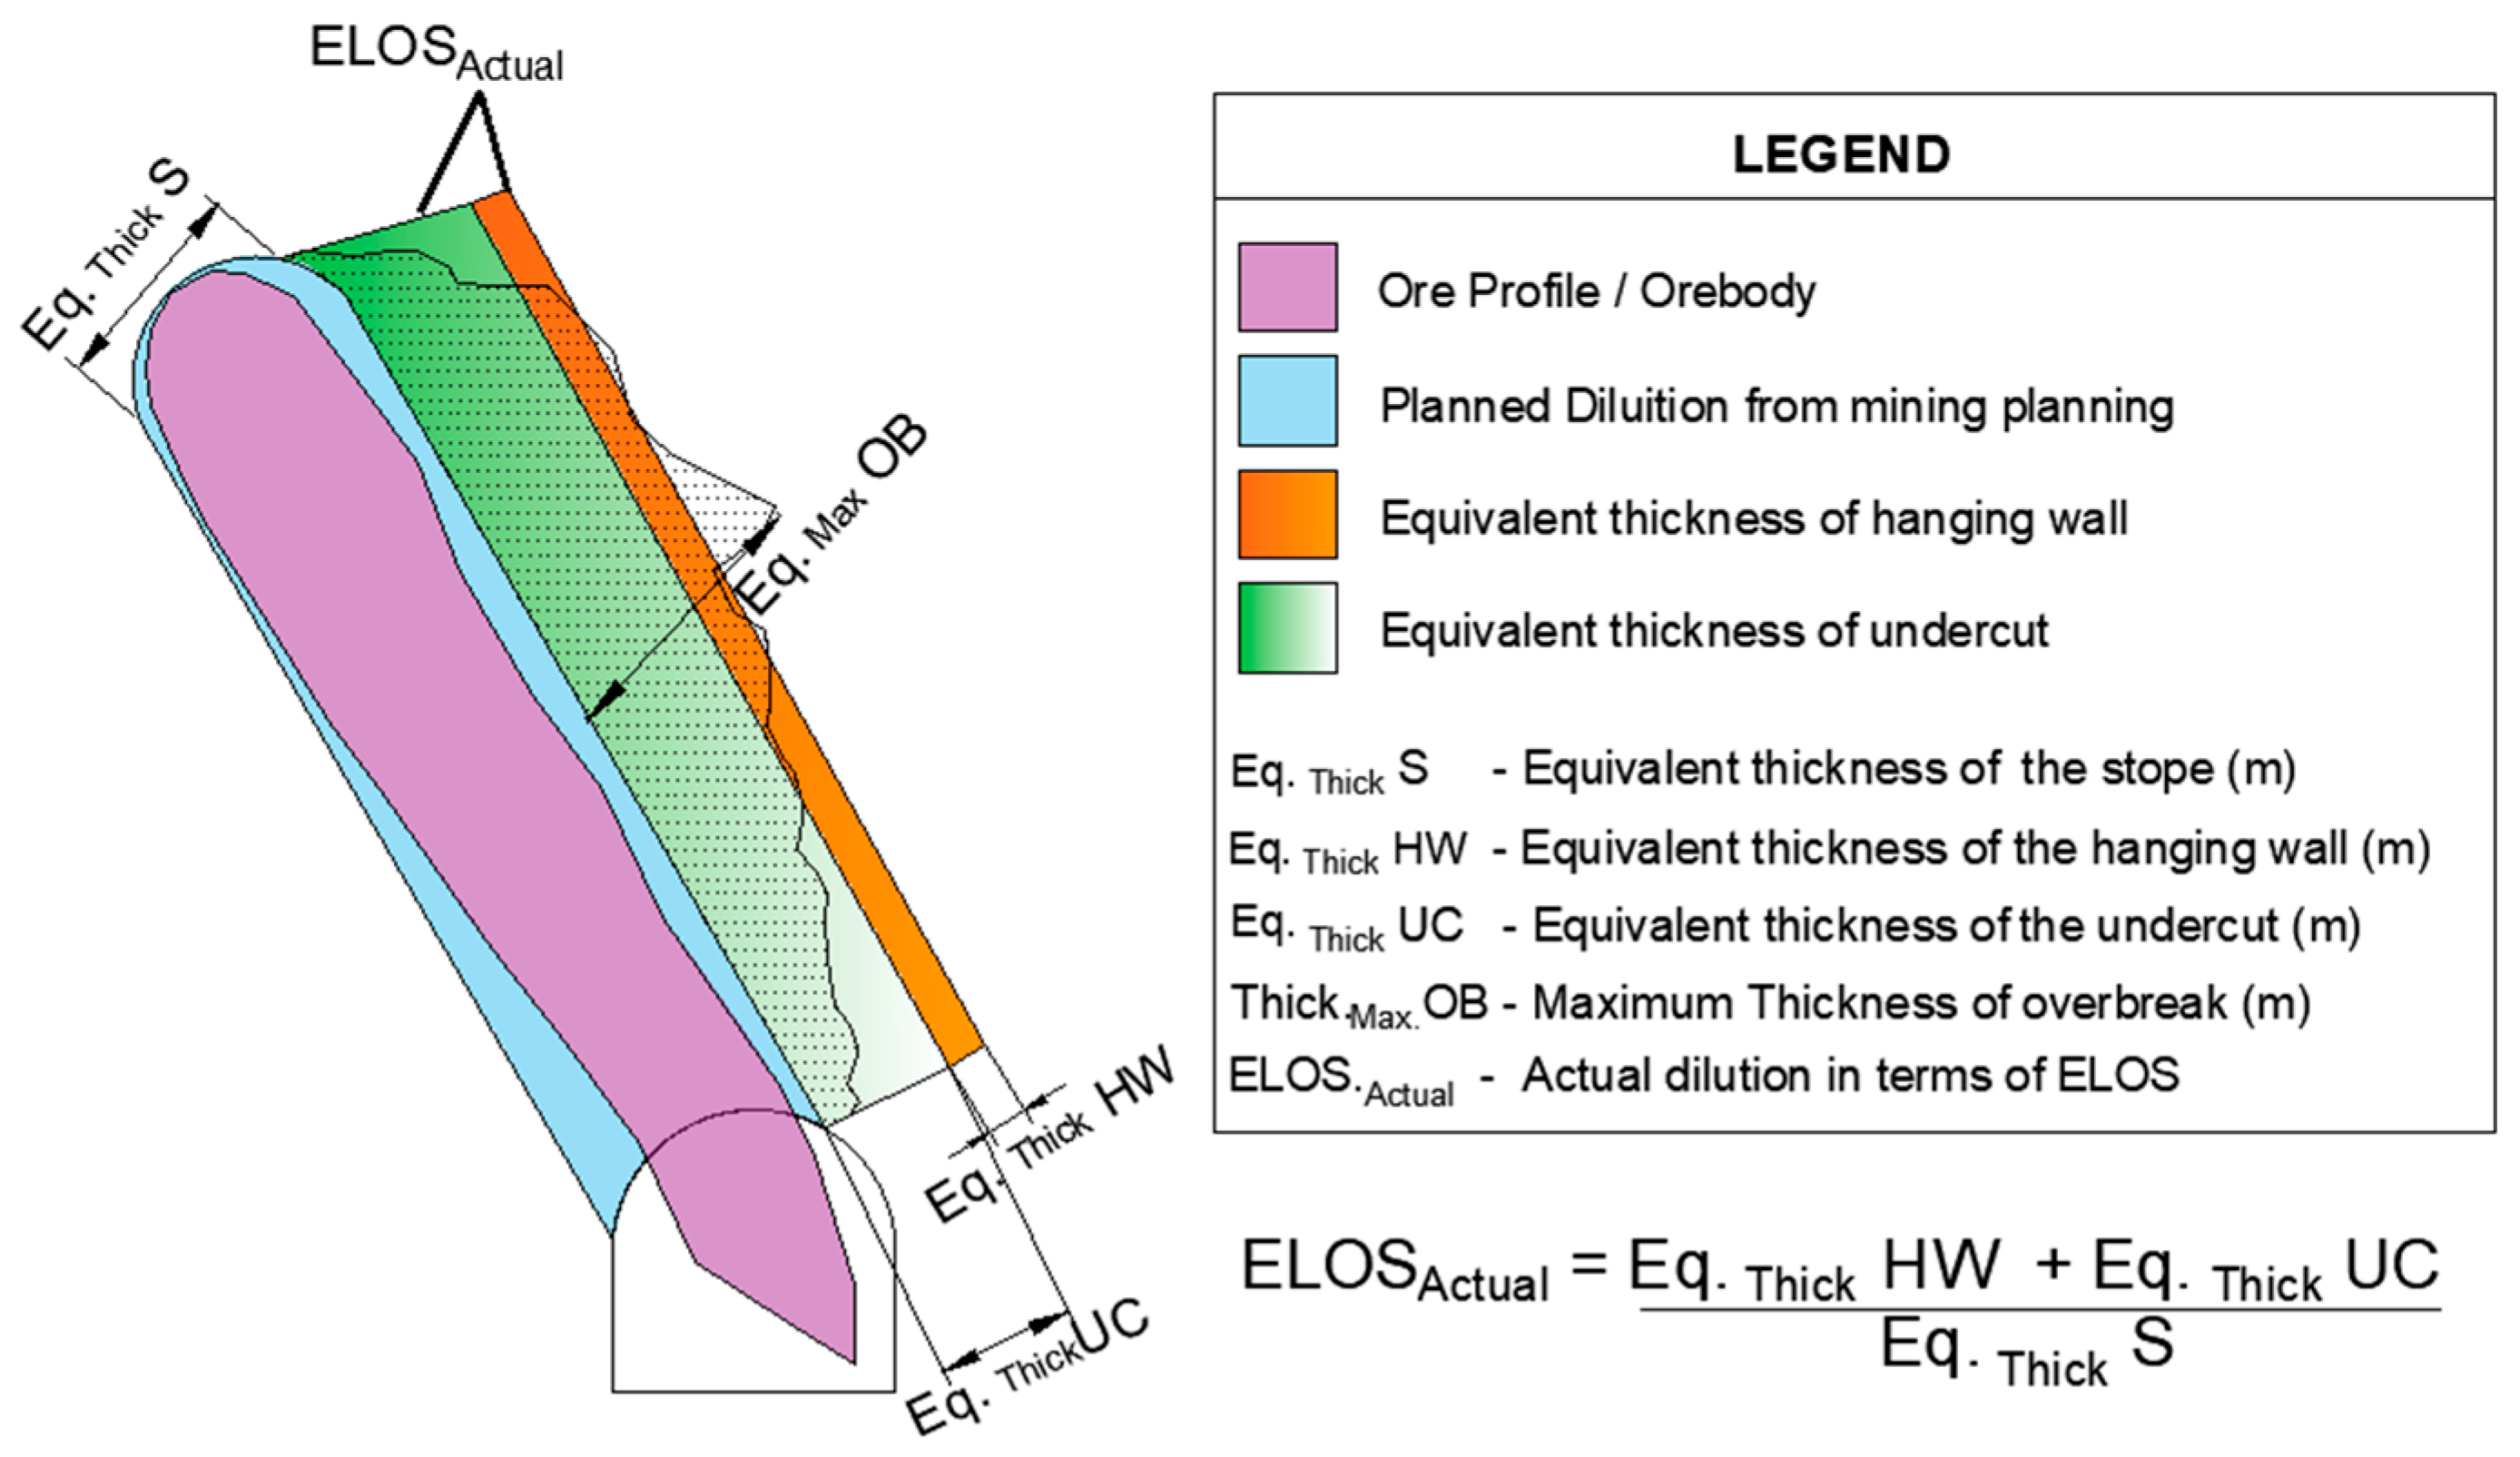
Figure 1 presents a simplified two-dimensional explanation of break definition in terms of ELOS, highlighting the distribution of overbreak and undercut along the hanging wall.
2.2.3. Dilution and ELOS
One of the most widely used metrics to quantify unplanned dilution in underground operations is Equivalent Linear Overbreak/Slough (ELOS) [
25]. ELOS, introduced by Clark and Pakalnis [
15], measures the average depth of material removed beyond the planned excavation along the entire stope surface. This metric allows a more precise quantitative assessment of stope stability and dilution in underground excavations and is widely recognized as a key indicator for evaluating stope design effectiveness.
Therefore, ELOS provides a simple method to represent volumetric breakage. It converts overbreak, which can occur at varying depths along the stope surface, into a uniform average depth equally distributed along the entire stope face [
26]. This method facilitates comparison among stopes and identifies stability and dilution patterns. Calculations are used to derive measures such as the average percentage of overbreak or underbreak per stope or total undercut (UC) [
27].
Equation (6) represents the simplified calculation of ELOS based on Clark [
25].
where
ELOS = Equivalent Linear Overbreak/Slough (m);
VOB = total volume of overbreak (m3);
Astope = total stope surface area (m2).
ELOS values are frequently categorized according to stability degree.
Table 1 presents how data are categorized in the mine under study, based on Clark [
25].
In this study, ELOS was calculated for all evaluated stopes, allowing direct comparison between planned and actual dilution. Two limitations emerge from the literature: (i) stability graphs are often applied “out of the box” in geologies that differ markedly from the original dataset, and (ii) ELOS measurements, although routinely collected, are seldom fed back into the design loop. Only isolated case studies (e.g., Cordova et al. [
7]) have combined stability graphs, ELOS and statistical modeling, and none have reported Brazilian sites. Addressing this gap, the present work develops a site-specific linear calibration that converts Potvin-predicted dilution into realistic values for a Brazilian zinc mine. The approach is readily transferable to other operations with modest back-analysis databases, offering a cost-effective route to more reliable stope design and, by extension, more efficient resource extraction.
3. Materials and Methods
The methodology adopted in this study consists of three main steps: stope data collection, the calculation of planned ELOS dilution, and the back-analysis of actual ELOS dilution. This approach aims to correlate predictive dilution values with observed field values, calibrating empirical stability prediction models.
Initially, relevant information on each stope was collected, including RQD, HR, planned volume, inclination, area, and elevation, as exemplified in
Table 2.
Based on collected data, the stability analysis provides two distinct planned ELOS dilution values:
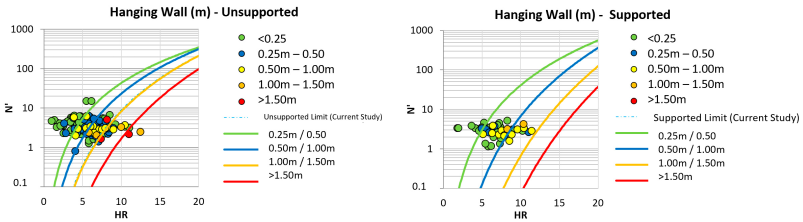
Planned ELOS without reinforcement: estimated dilution if the stope does not receive additional structural support;
Planned ELOS with reinforcement: estimated dilution considering the application of support (e.g., cable bolts).
Planned dilution values with reinforcement are typically lower than those without reinforcement, demonstrating the efficiency of structural support in reducing overbreak. However, operational constraints or resource availability may prevent supporting all stopes. Therefore, the decision to apply reinforcement should be based on stability curve analyses and mine geotechnical knowledge, allowing the better prioritization of critical areas.
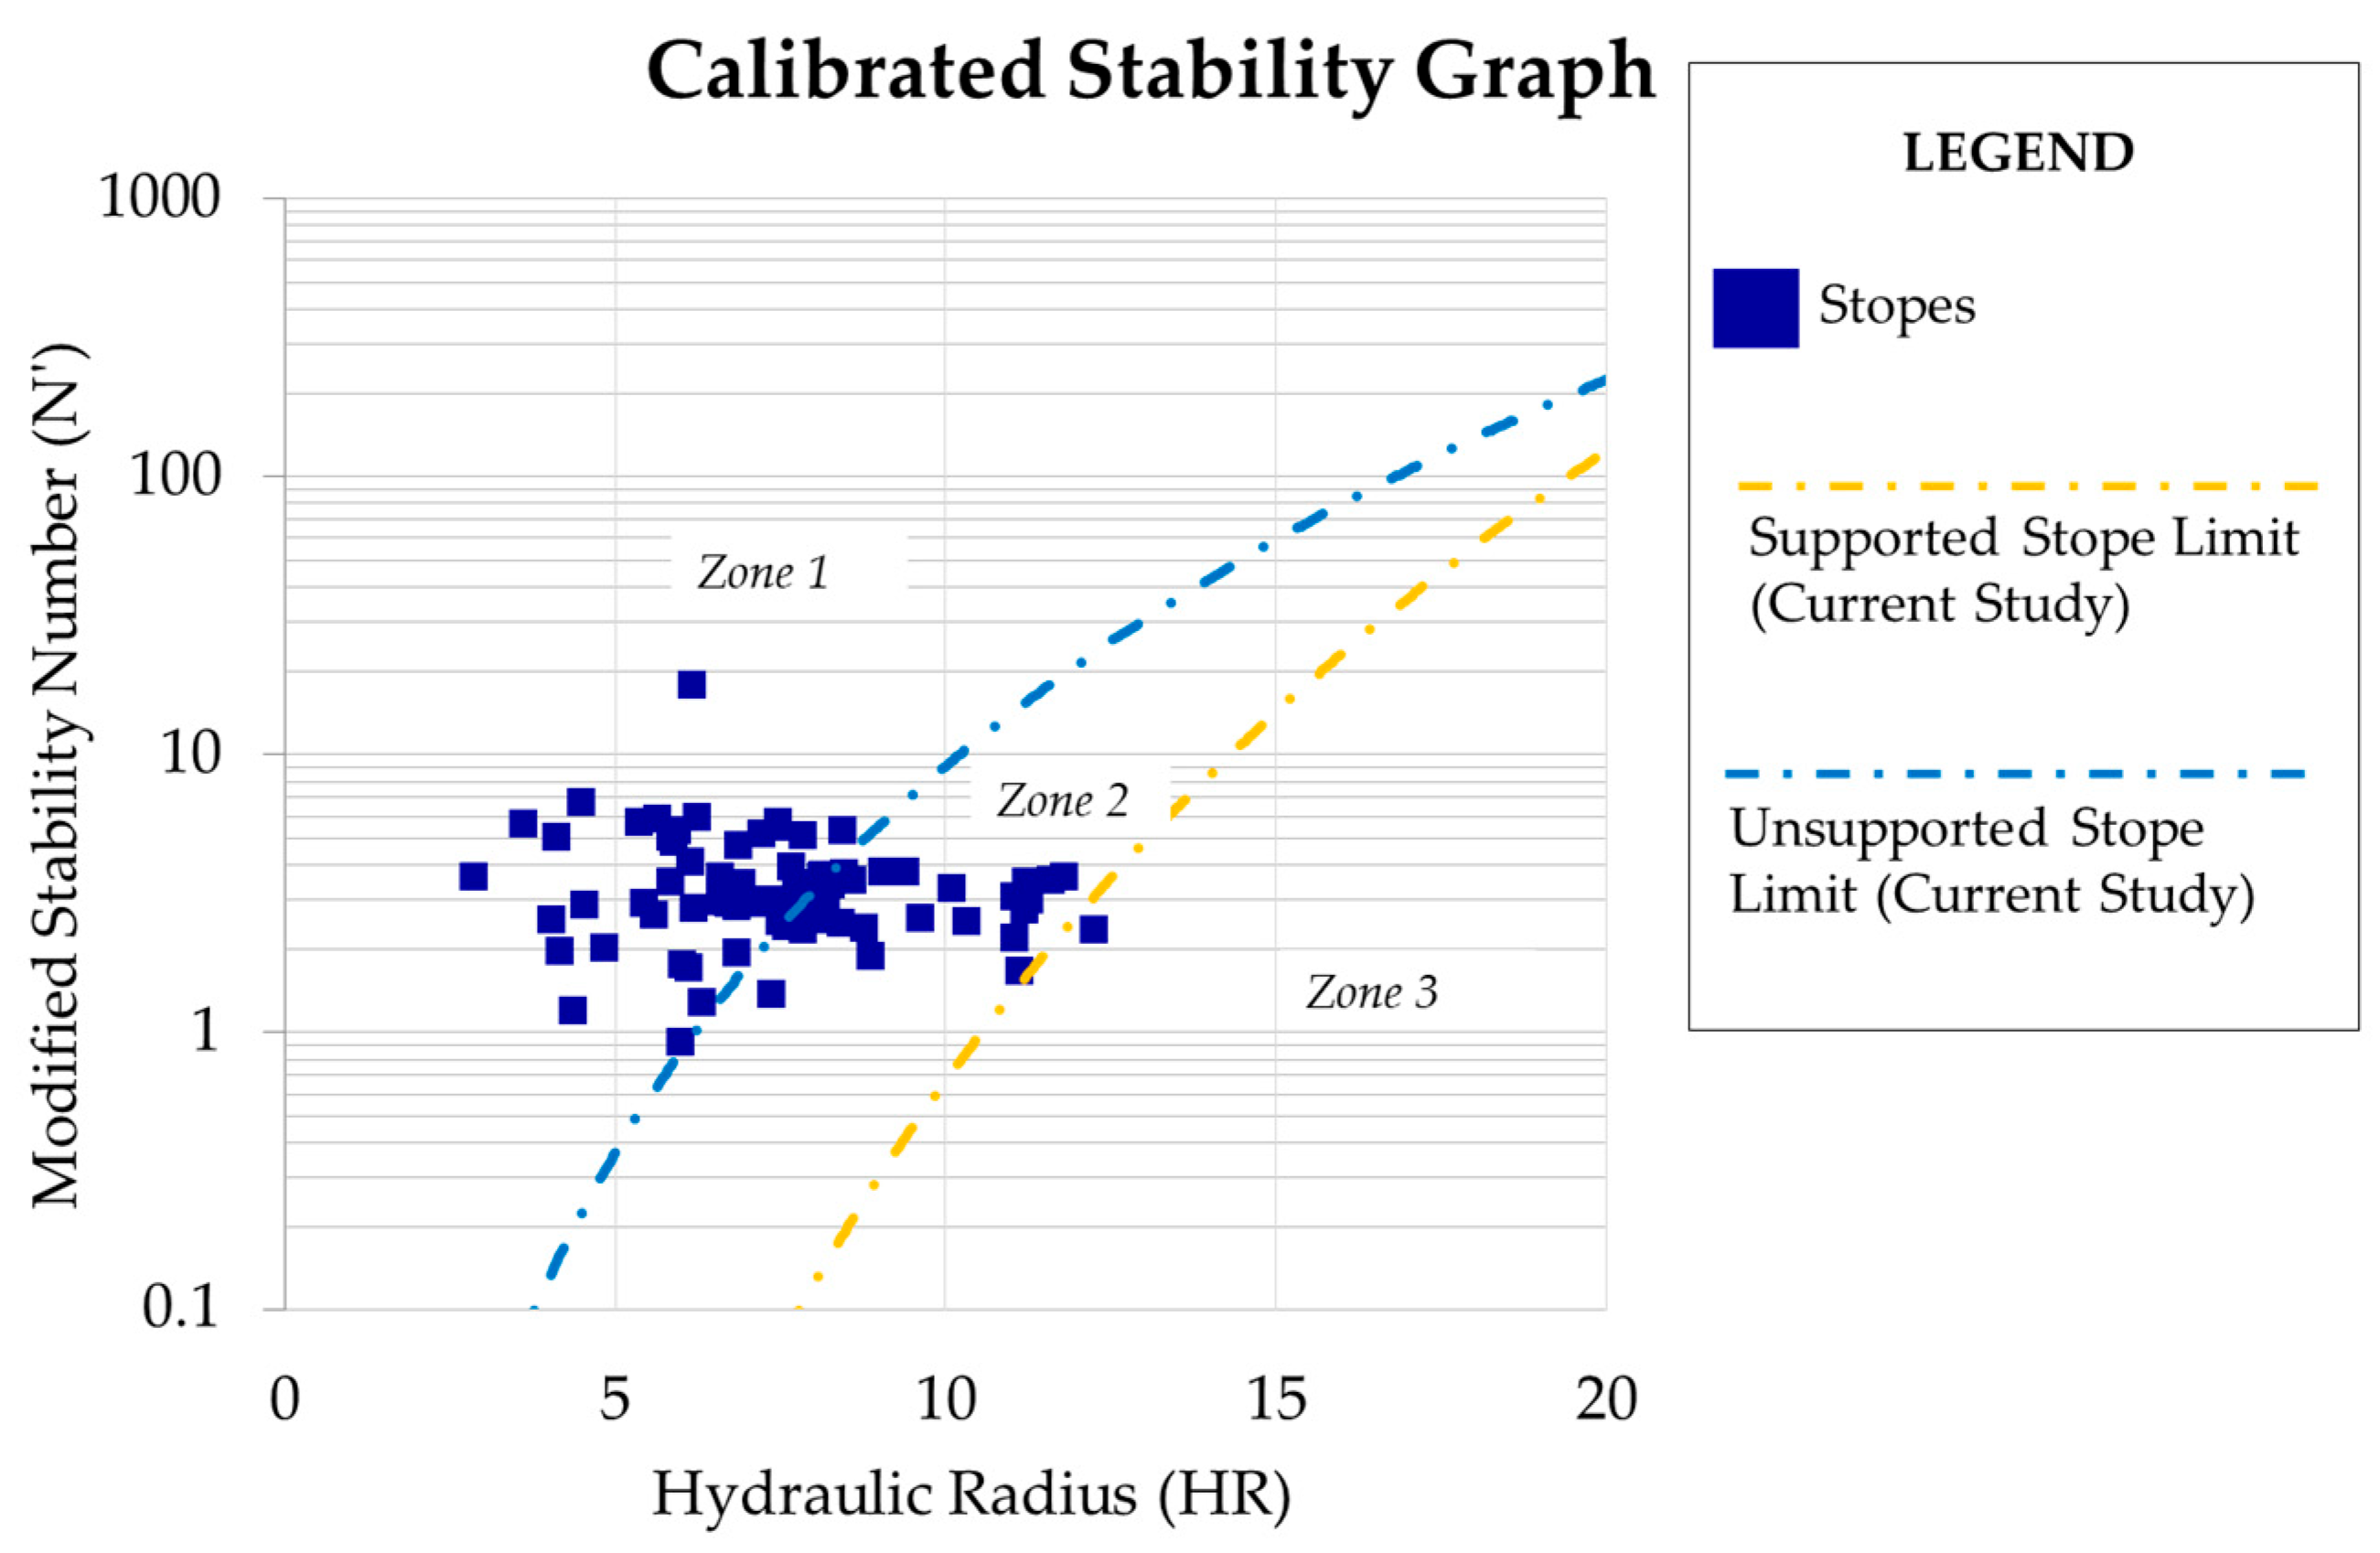
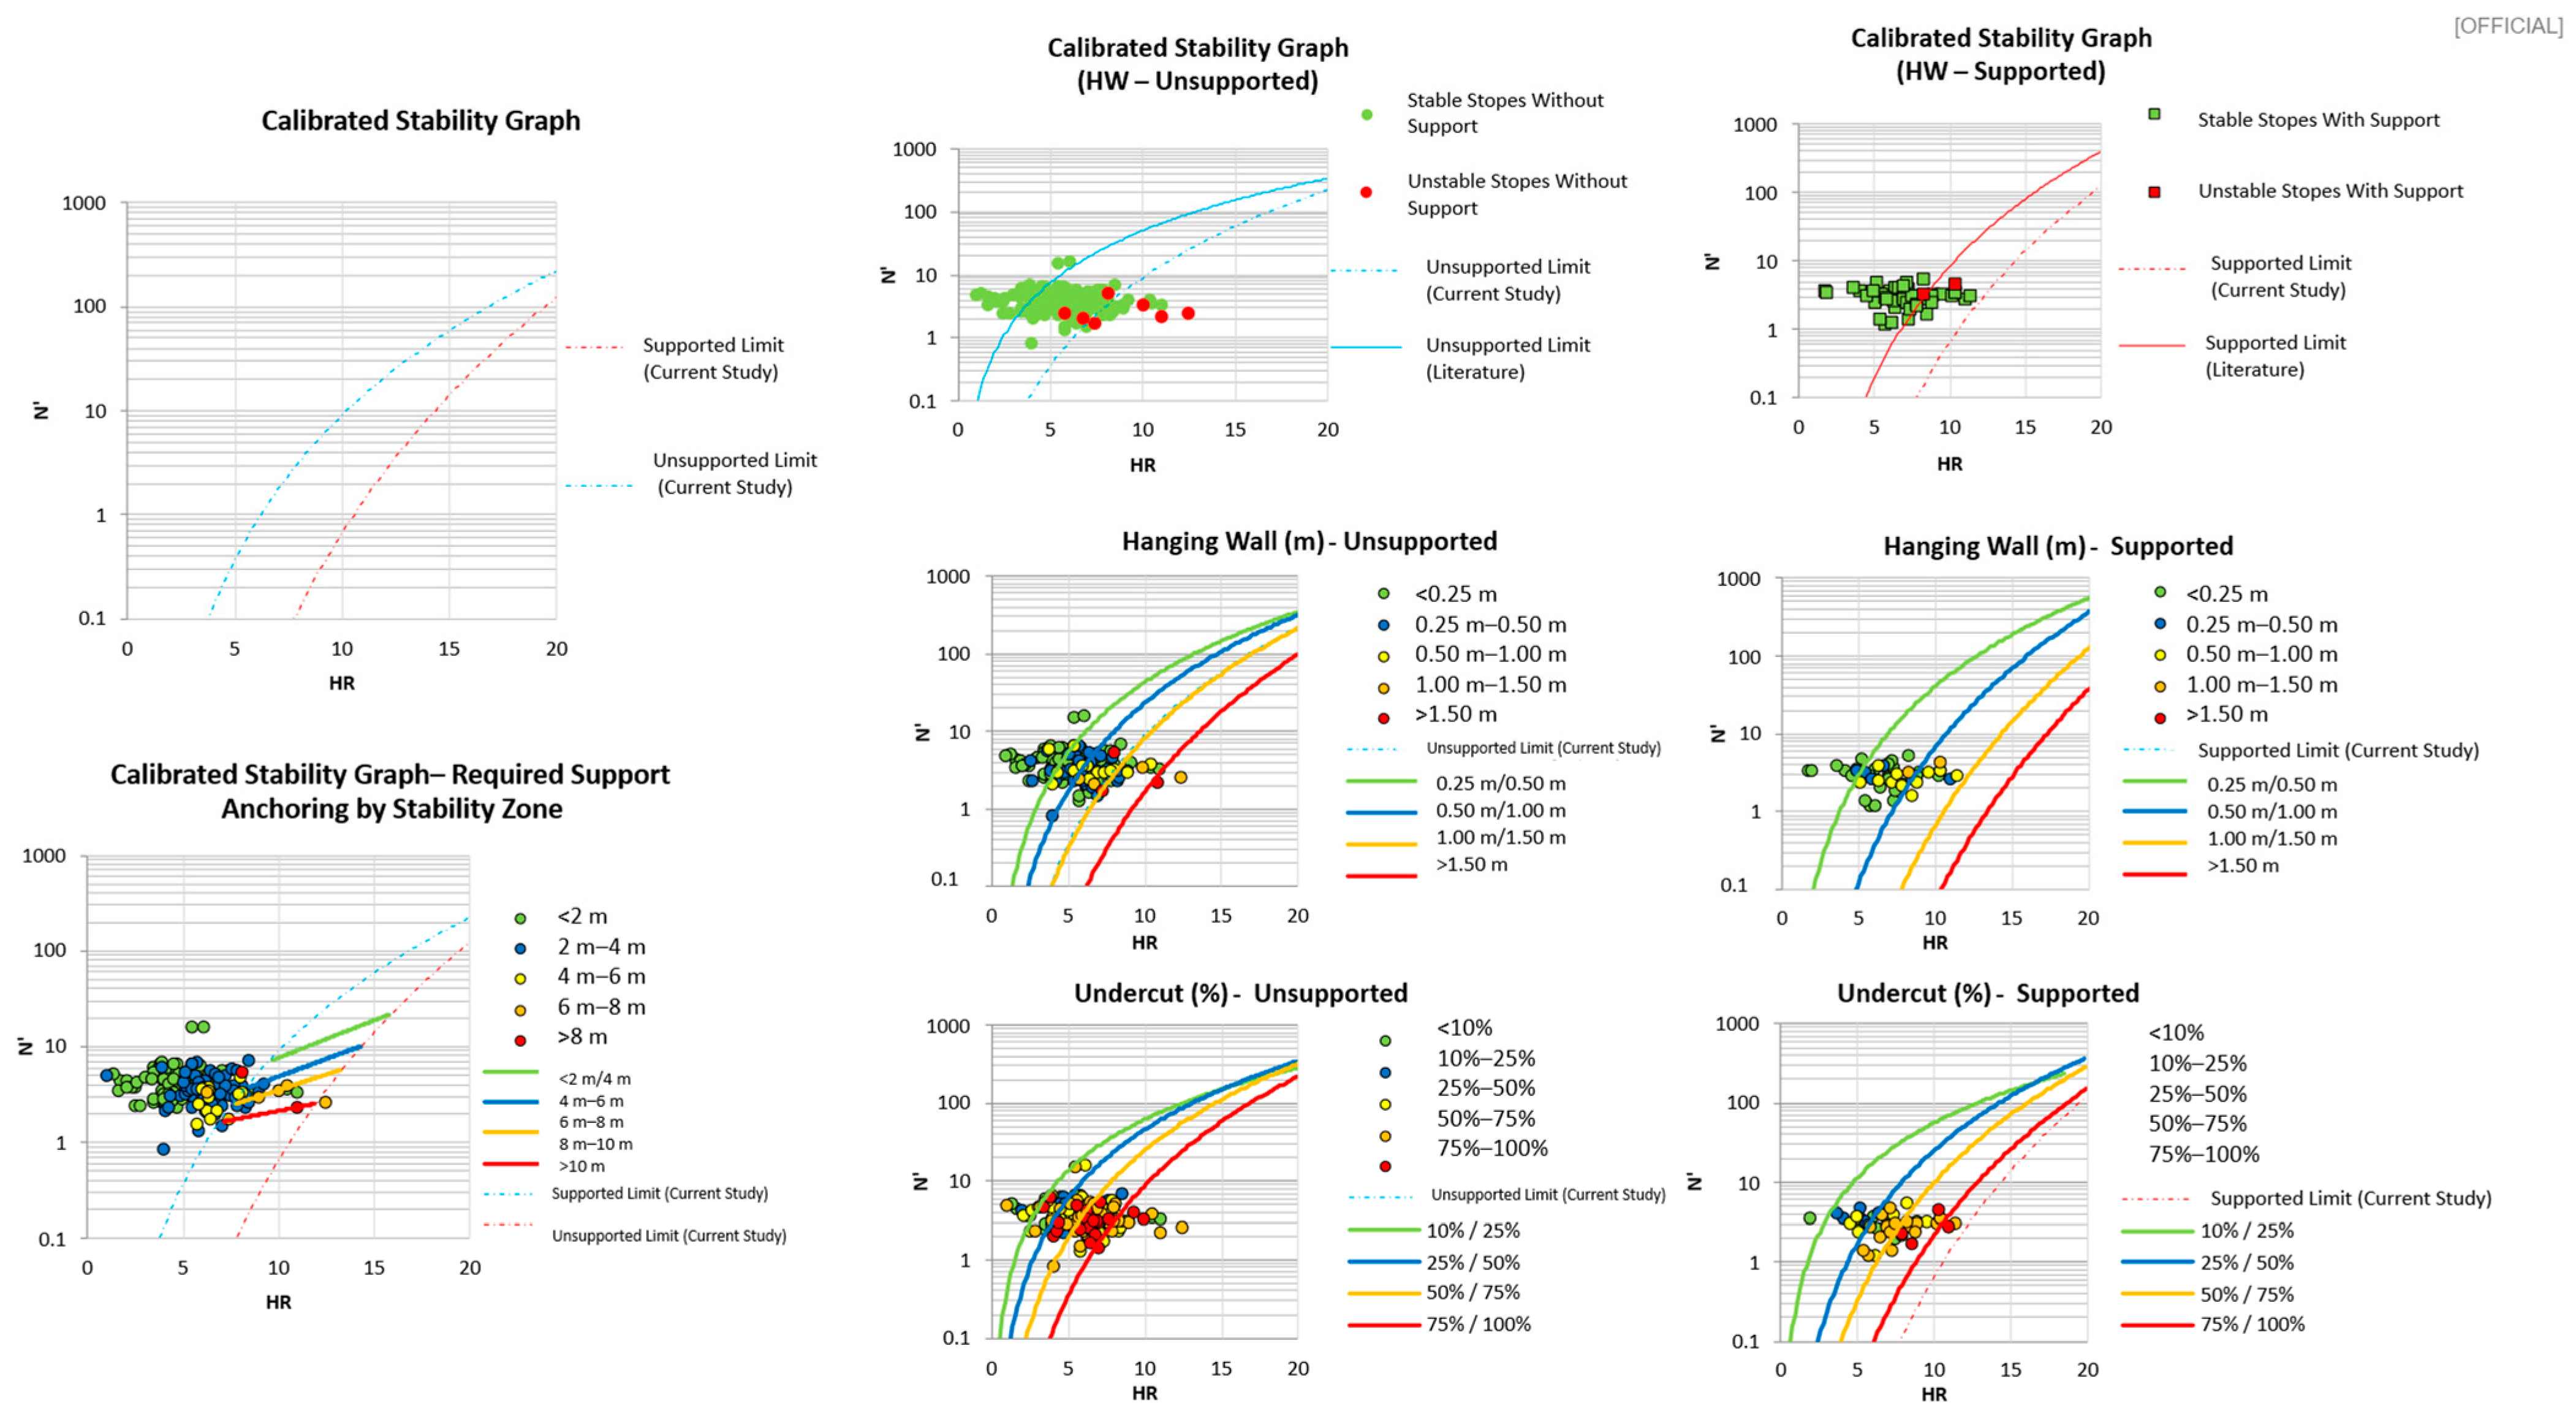
The stability graph in
Figure 2 shows three distinct zones, classifying stopes according to stability and reinforcement needs:
Zone 1: stable stopes without reinforcement, where adequate geomechanical conditions ensure stability without additional support.
Zone 2: stopes requiring reinforcement for extraction; this zone indicates essential structural support for integrity; stopes in this zone are divided into cable-bolted and non-cable-bolted.
Zone 3: collapse area, where geometry and modified stability number (N′) indicate that excavation is not feasible, even with reinforcement.
Figure 2.
Stability graph calibrated with data from studied mine.
Figure 2.
Stability graph calibrated with data from studied mine.
Back-analysis validated dilution prediction models, comparing planned and actual dilution. Cavity Monitoring System (CMS) data collected from over 400 stope scans since 2017 were processed using Deswik® version 2021.2 and GEM4D version 1.8.5.0 software. This allowed detailed dilution measurements and enhanced predictability of the stability conditions.
Statistical analyses, including linear regression and Pearson correlation, evaluated the relationship between geomechanical variables and actual dilution. The analyses distinguished cable-bolted, non-cable-bolted, and naturally stable stopes without reinforcement, allowing robust statistical modeling and assessment of dilution prediction reliability.
Based on this classification, the expected break thickness for a stope can assume two distinct values: one considering the reinforced condition and another without reinforcement. As expected, dilution values with reinforcement are always lower than those without reinforcement, reflecting the effectiveness of structural support in containing overbreak.
The reconciliation of data followed this logic:
Cable-bolted stopes (Zone 2) were reconciled using dilution values with reinforcement, as structural support directly impacts stability;
Non-cable-bolted stopes (Zone 2) were reconciled with dilution values without reinforcement, depending solely on the rock mass geomechanical conditions;
Stopes initially classified as stable without reinforcement (Zone 1) did not fit well with dilution values without reinforcement, being better reconciled with reinforced dilution values, as discussed in the results.
3.1. Geomechanical Data Collection
The database used in this study comprises more than 400 scans of stopes operated with the sublevel stoping method at the underground zinc mine in Brazil. For dilution analysis, the Mathews-Potvin stability graph was used in conjunction with back-analyses comparing conditions before and after mining. From the 400 scans conducted since 2017, 68 stopes were selected for detailed analyses, using data obtained from the Leica
® Cavity Monitoring System (CMS) to capture the three-dimensional geometry of underground excavations. These stopes were selected based on the availability of complete geomechanical and operational data, as well as representativeness in terms of rock mass quality and support conditions. The Leica CMS operates by emitting a narrow laser pulse and measuring the time taken for the reflected signal to return, thereby calculating the distance to each point in the excavation. This technique allows for high-resolution, contactless 3D mapping of complex geometries, even in challenging underground environments. The system generates a dense point cloud, which is then visualized and analyzed using Deswik ® 2021.2 software. CMS scanners typically offer high spatial accuracy (on the order of millimeters) and are equipped to function under reduced lighting and in the presence of dust and humidity, making them particularly suited for underground mining applications [
28].
CMS data were processed using the software Deswik® 2021.2 where noise filtering and excavation boundary adjustments were performed. Subsequently, models were exported in the DXF format and imported into the software GEM4D version 1.8.5.0, where detailed measurements for dilution calculations were conducted.
3.2. Back-Analysis
Back-analysis was conducted to validate the predictability of dilution models, comparing planned and actual dilution values. Collected data were used to calibrate curves and compare planned dilution with observed field values. For this purpose, the planned geometry of each stope was compared with the final geometry (scanned stope) obtained after mining through back-analyses performed using the software GEM4D. This process quantified actual dilution and validated the effectiveness of the projected parameters in predicting stope stability.
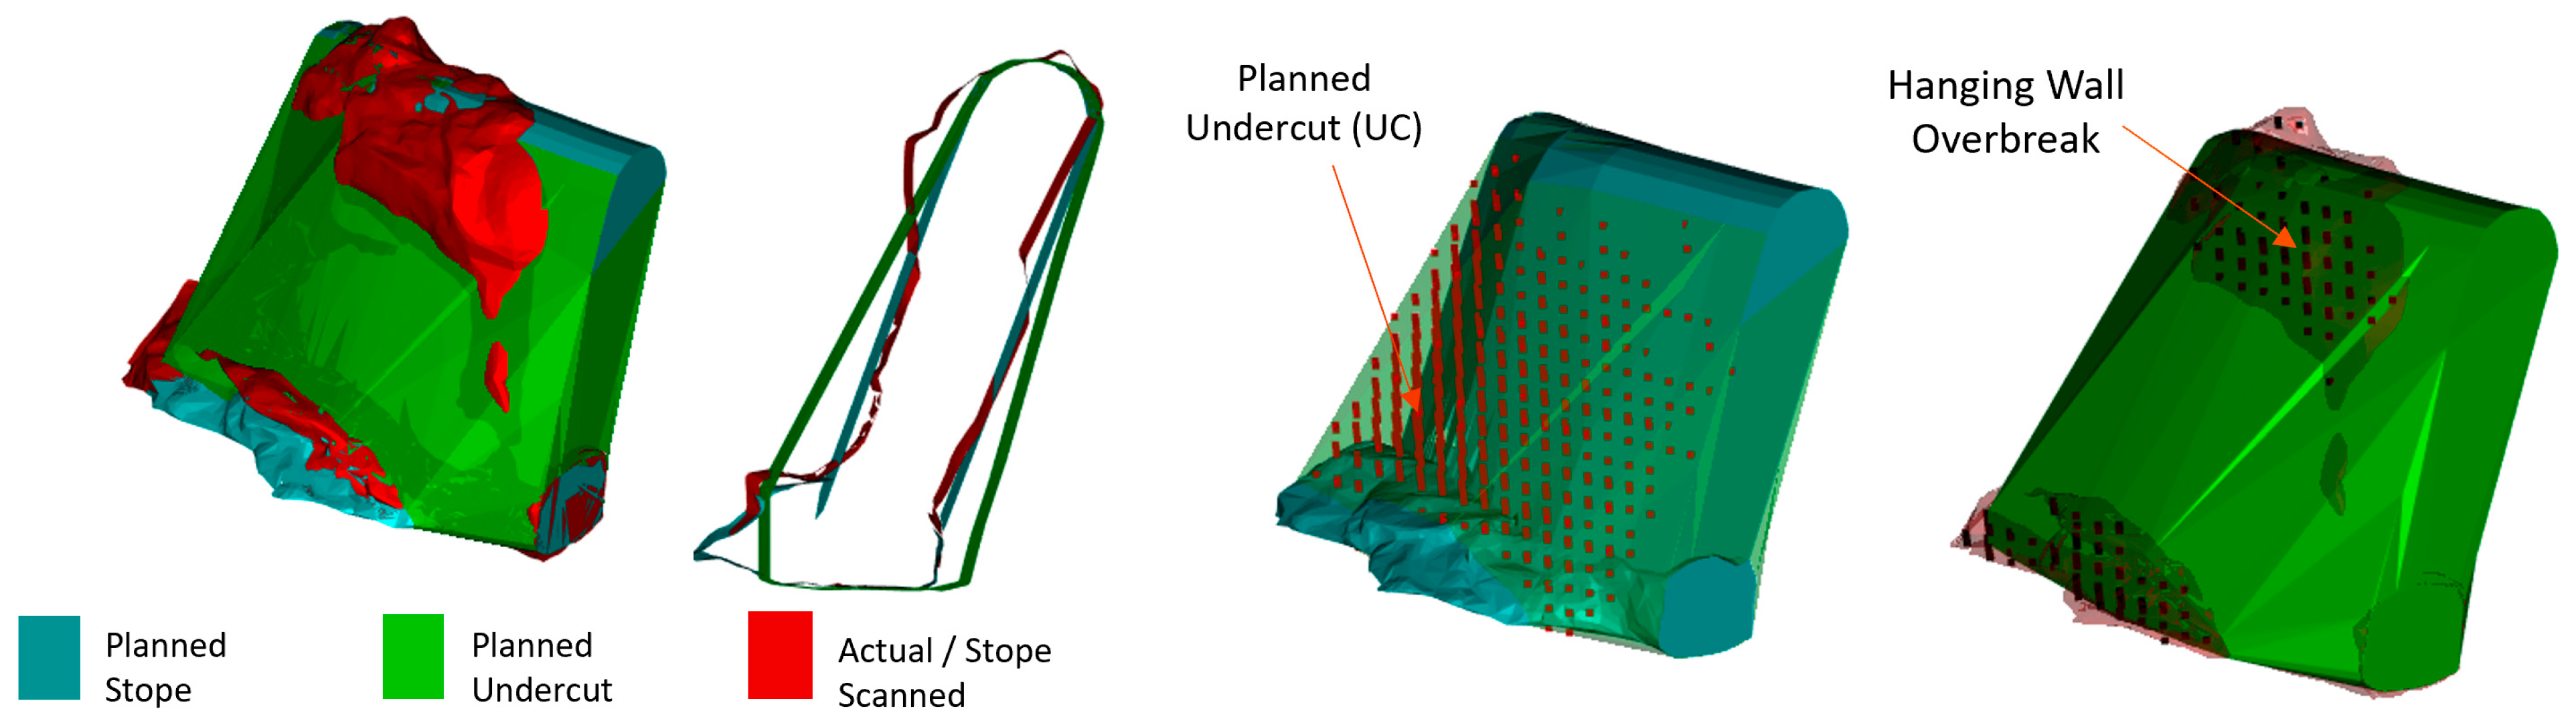
Figure 3 illustrates the volumes considered in the back-analysis.
The final geometry of the stopes was intersected with the hanging wall (HW) surface, enabling the determination of dilution volume and area associated with the HW, the key parameters for ELOS calculation. In this study, only HW volume was considered in the analysis, as overbreak predominantly occurs at the hanging wall due to gravity influence. Thus, foot wall (FW) volume was not included in the calculations.
In this context, the term “undercut” refers to rock detachment beyond planned limits but whose removal was expected based on stability analysis. Additional displacement exceeding planned limits is termed “overbreak,” as illustrated in
Figure 4. This terminology was adopted to simplify understanding dilution calculations in the mine’s operational routine.
In this study, actual ELOS (
) is calculated by dividing the sum of equivalent hanging wall thickness (Eq.
ThickHW) and undercut (Eq.
ThickUC) by the equivalent stope thickness (
), as described in Equation (7) and illustrated in
Figure 4.
where
Eq.Thick_HW = equivalent thickness of the hanging wall;
Eq.Thick_UC = equivalent thickness of the undercut;
Eq.Thick_S = equivalent thickness of the stope.
3.3. Statistical Analysis
To evaluate the relationship between geomechanical variables and actual dilution, linear regression techniques and Pearson correlation analyses were applied. Statistical modeling was conducted considering three distinct stope groups:
Cable-Bolted Stopes: excavations reinforced with cables to enhance stability, indicated as “Planned Dil. WS”;
Non-Cable-Bolted Stopes: stopes not reinforced despite stability analysis indicating the need for cable bolting, indicated as “Planned Dil. WOS”;
Stable Stopes Without Reinforcement: stopes deemed naturally stable without additional support according to stability analysis.
Linear regression identified the most influential variables for unplanned dilution, while residual analysis verified the reliability of developed models. Pearson correlation (r) assessed the strength of associations between geomechanical variables and dilution. Statistical models were evaluated using performance metrics, including the following:
ANOVA (analysis of variance): it tests statistical significance of fitted models;
Correlation Coefficient (r): it measures the linear relationship strength between variables;
p-value: it indicates the statistical significance of regression coefficients;
Determination Coefficient (R2) and Adjusted R2 (R2aj): they represent explained variability proportion and model adequacy;
Standard Error of Estimate (S): it measures residual dispersion concerning the regression line.
The 68 analyzed stopes were previously calibrated and reconciled with stability analysis results, enabling robust statistical method application. Results of these analyses are discussed in
Section 4. Results and Discussion, presenting correlation coefficients and adjustments of developed models.
4. Results and Discussion
Statistical analysis allowed for the evaluation of the accuracy of planned dilution estimates and the effectiveness of reinforcement applied to stopes requiring additional support, considering both cabled and non-cabled stopes. For this, Pearson correlation techniques and linear regression were applied to examine the relationship between actual dilution (ELOS_Actual) and planned dilution with reinforcement (Planned ELOS WS-MP) or without reinforcement (Planned Dil. WOS-MP) obtained through the Mathews-Potvin stability graph (MP).
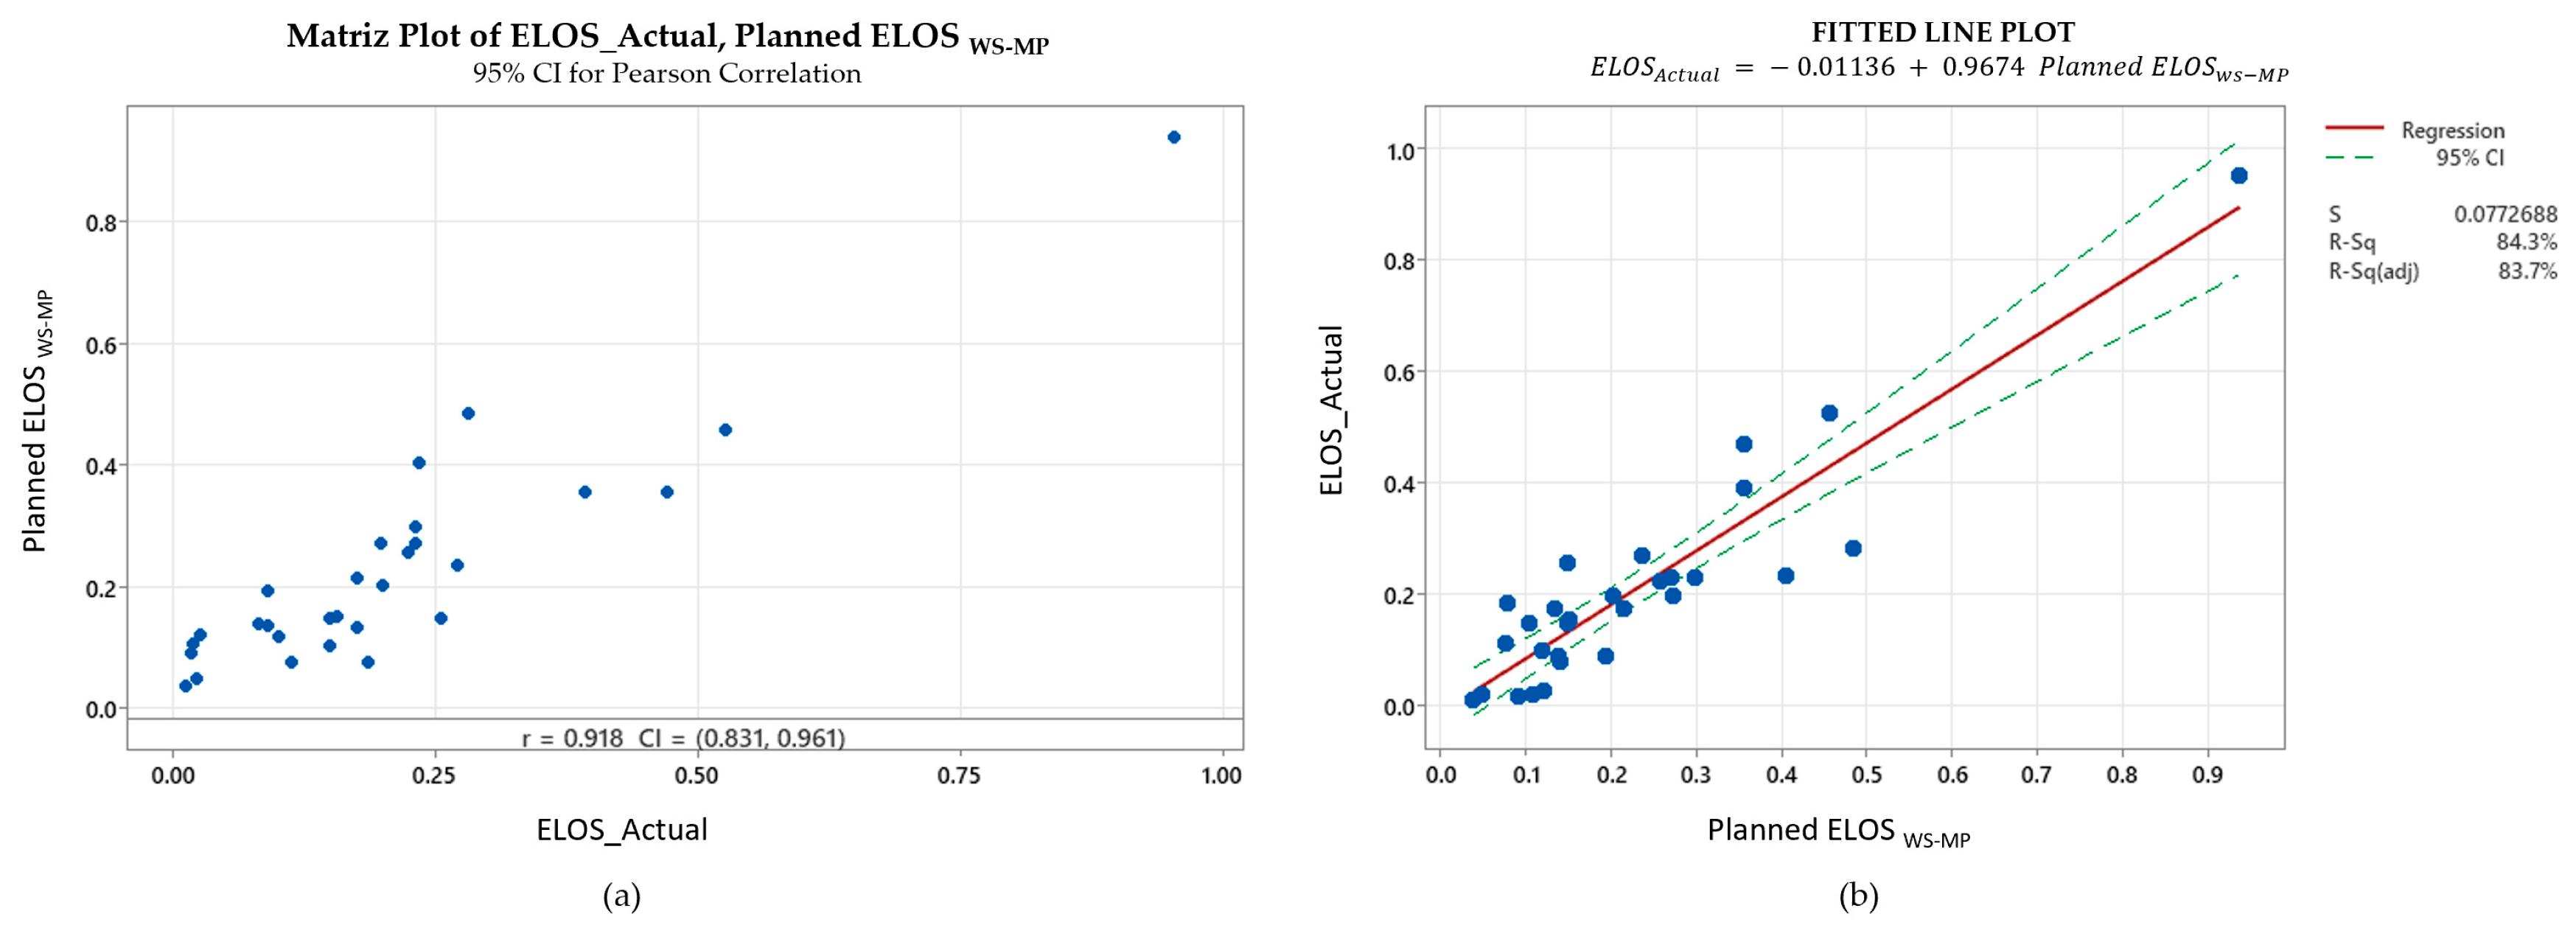
4.1. Cabled Stopes/Supported
A Pearson correlation of 0.918 (95% CI ± 0.05) with a 95% confidence interval between 0.831 and 0.961 (
Figure 5a) and an adjusted R
2 of 0.84 indicate that, once reinforcement is installed, the empirical graph already captures most of the dilution variability, 84% of the variation in actual dilution can be explained by planned dilution with reinforcement (
Table 3). The regression line has a slope of 0.967 ± 0.062 (Equation (8) in
Table 4 and
Figure 5b) and an intercept statistically indistinguishable from zero, so the calibrated model differs from the original Potvin estimate by little more than a centimeter of hanging-wall break. Residuals are randomly distributed and homoscedastic, confirming that no systematic bias remains in the reinforced dataset.
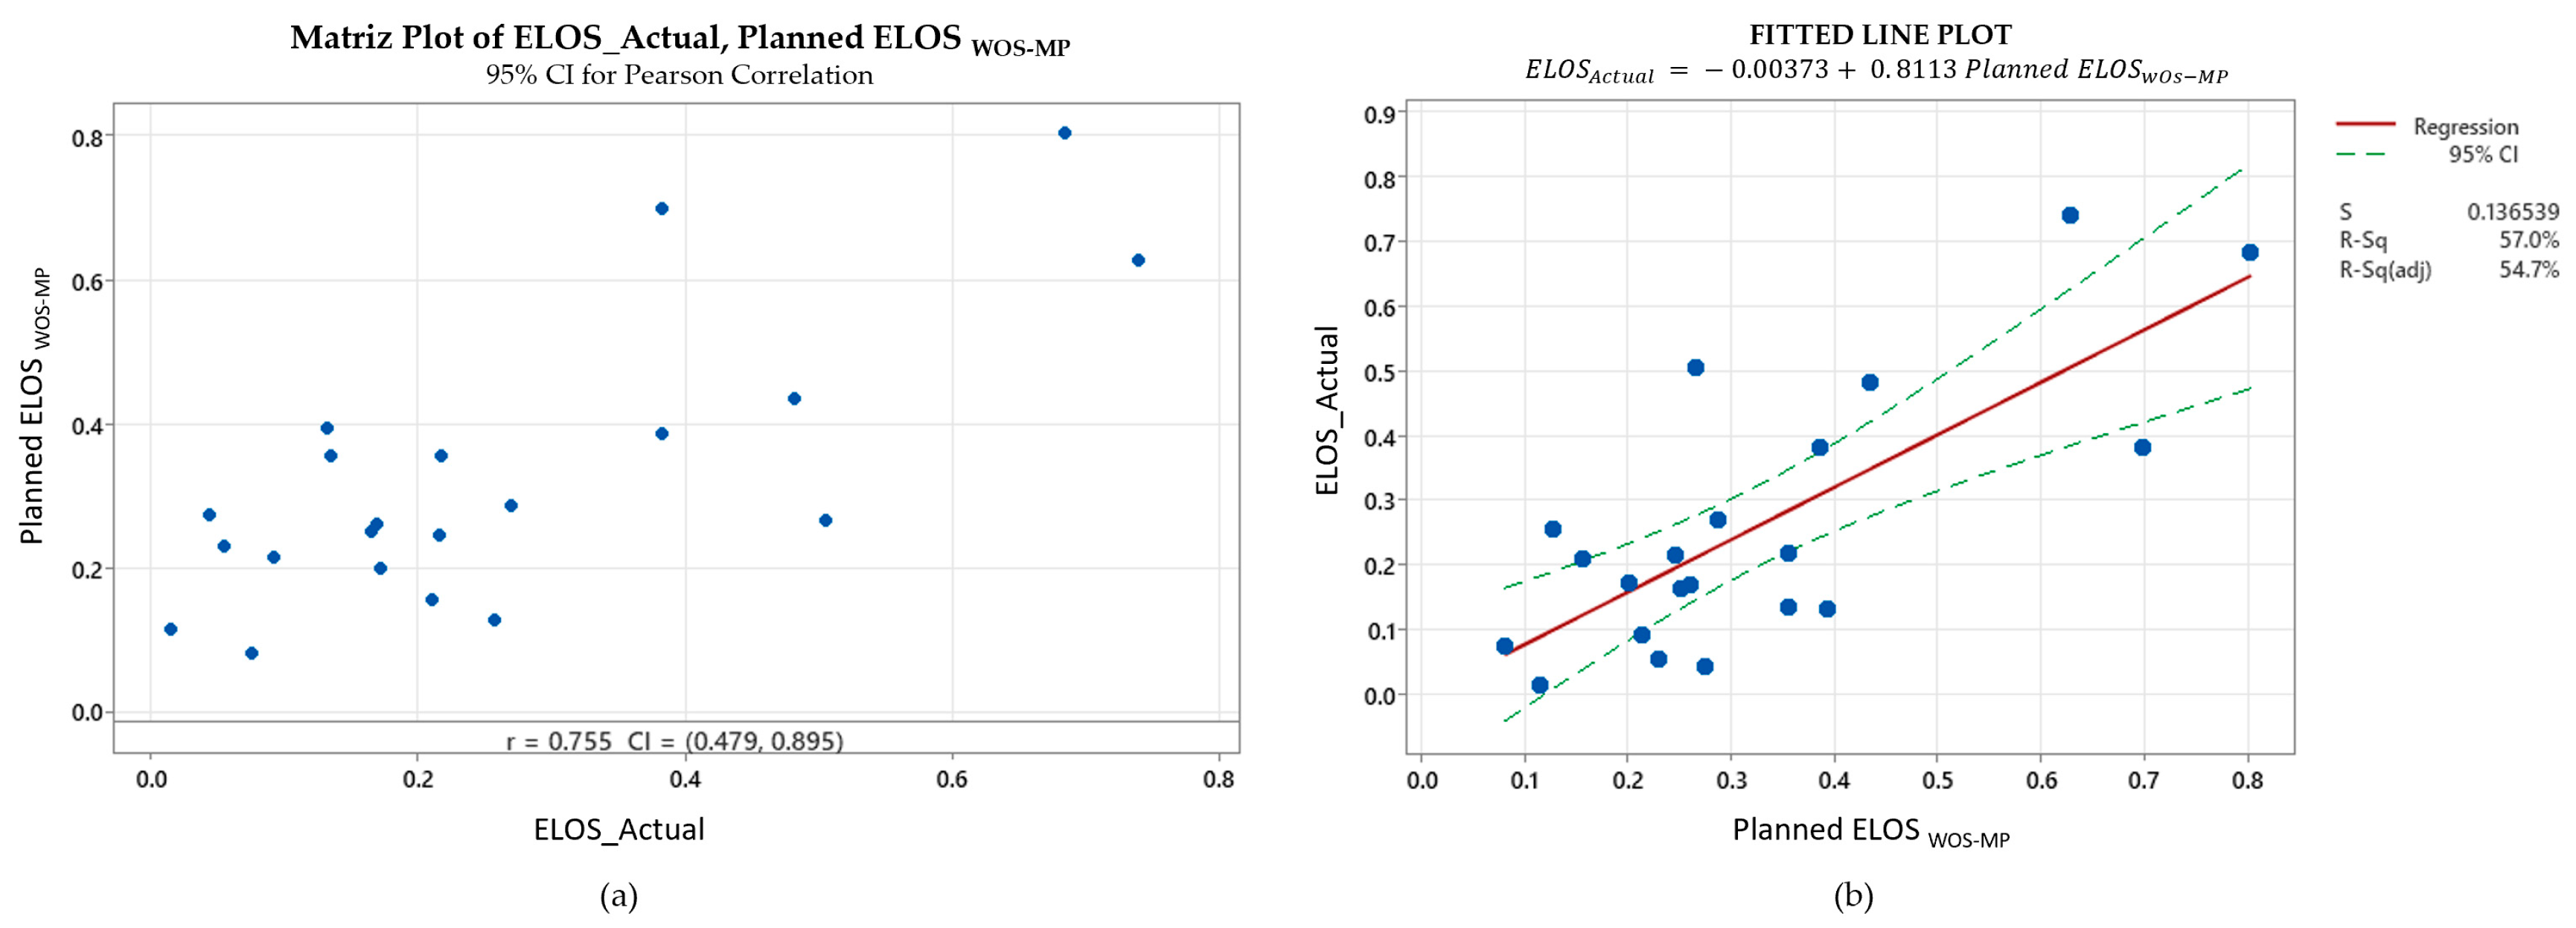
4.2. Non-Cabled Stopes/Unsupported
A contrasting picture emerges for the eighteen stopes mined without cable support. Here, the Pearson correlation falls to 0.755 and the adjusted R
2 to 0.55 as shown in
Figure 6. The regression slope drops to 0.811, showing that Potvin systematically overestimates dilution when support is absent (Equation (9) in
Table 4). Residual scatter widens for planned ELOS values above roughly 1.2 m, which coincides with wider spans and lower rock mass quality in the mine’s footwall domain. Applying the calibration equation narrows the standard error from 0.14 m to 0.07 m and removes most of the upward bias in the unreinforced data.
These results suggest that planned dilution without reinforcement is a less precise predictor of actual dilution in non-cabled stopes compared to cabled stopes, as illustrated in
Figure 6b. This may be attributed to the fact that non-cabled stopes are more susceptible to operational and geomechanical variations, such as drilling deviations and local rock mass instabilities. Structural reinforcement with cables appears to act as a stabilizing element, minimizing the impact of these external variables and improving dilution predictability.
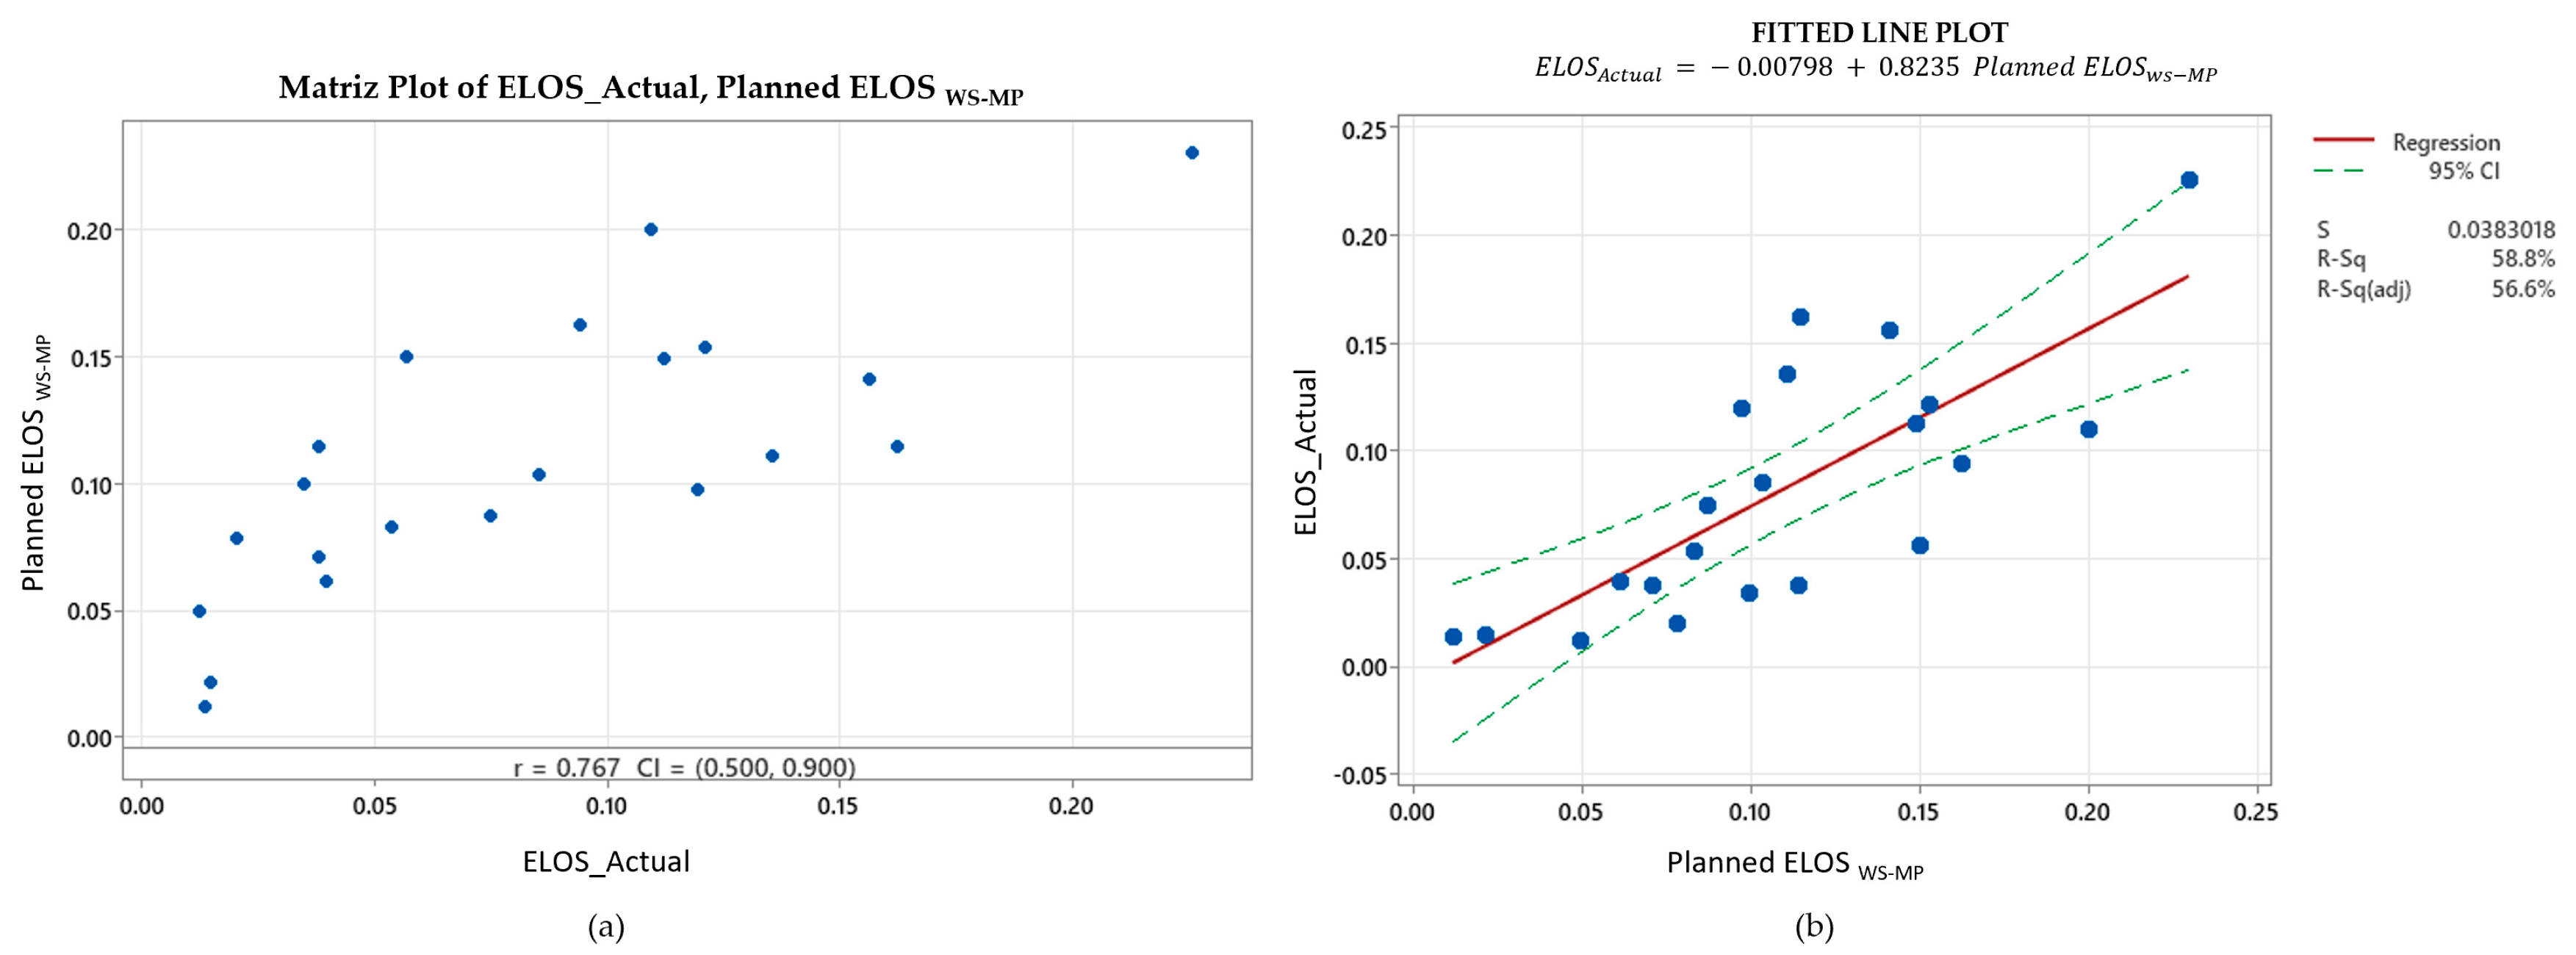
4.3. Self-Supported Stopes
The group of supposedly self-supported stopes occupies an intermediate position. Although the empirical graph classifies them as stable without reinforcement, their field behavior resembles that of lightly supported excavations. When the planned ELOS with support is used as the predictor, the correlation reaches 0.767 and the adjusted R
2 about 0.57, while the standard error tightens to 0.04 m (
Figure 7). This finding echoes earlier observations by Stewart and Forsyth [
10] that Zone 1 of the Potvin chart can be optimistic in weaker lithologies: hanging-wall break is still largely controlled by local discontinuities even where empirical criteria suggest stability.
This discrepancy may be associated with small operational uncertainties, such as drilling deviations, variations in local geomechanical conditions, and fluctuations in the mining process. The lower predictability in non-reinforced stopes reinforces the need for more refined model calibration and the consideration of additional factors impacting stability and dilution in these cases.
Statistical analysis demonstrated that the correlation between planned and actual dilution varies significantly according to support conditions.
Table 2 presents correlation coefficients and statistical model adjustments for each stope group.
Table 4 presents the adjusted regression equations for each stope type. It is observed that the slope coefficients for non-cabled and self-supported stopes are lower than those for cabled stopes, reflecting greater data dispersion and lower precision in dilution prediction.
Figure 8 presents the final calibration results of the stability curves, highlighting the zoning of stopes according to the required bolt length. The “Calibrated Stability Graph—Required Support Anchoring by Stability Zone” correlates bolt length with stability, demonstrating that the required support varies according to the stability zone in which the stope is located. Comparing the three regressions on a single plot shows that the lines diverge increasingly with larger planned ELOS values. At modest spans (ELOS ≈ 0.6 m) all three curves converge within a few centimeters, but at an ELOS of 1.5 m the gap between the cable-bolted and non-cabled predictions widens to almost 0.25 m. Because dilution and metal loss grow non-linearly with hanging-wall break, that quarter-meter difference translates into several percentage points of head-grade dilution and millions of dollars in revenue on an annual mine budget.
A worked example highlights the practical value of the calibration. One non-cabled stope in the database had a Potvin prediction of 25% dilution but delivered only 17% after mining. If the calibrated equation had been applied during the design stage, the forecast would have been 20%, reducing the absolute error from eight to three percentage points—an improvement of roughly sixty-two per cent. Across the 2021 planning schedule the new equations lowered the mean dilution allowance for unsupported stopes from 31% to 23%, which in turn permits the cut-off grade to be reduced by 0.12% Zn without compromising mill feed quality. Mine-wide simulations show that this small grade adjustment increases payable zinc production by 1.5% and defers the exhaustion of Proven Ore Reserves by seven months.
Taken together, the results confirm that the calibrated framework offers two complementary benefits. First, it restores predictive accuracy where the original Potvin chart is least reliable—namely in weaker, unsupported ground—without penalizing the cases where the graph already performs well. Second, it embeds those corrected values directly into the existing design workflow, so engineers obtain tighter forecasts early enough to influence ring design, drilling accuracy and support budgeting.
This approach demonstrates that, when supported by a robust dataset, mines can develop site-specific correction factors to refine their planning processes. Future work will explore multilinear regression and machine learning techniques to further enhance prediction under more complex geotechnical conditions.
5. Conclusions
Unplanned dilution is a persistent constraint on both the economics and the geotechnical integrity of underground mines. By coupling the Mathews-Potvin stability graph with ELOS back-analysis and a mine-specific linear calibration, this study provides a straightforward way to transform generic, empirically derived dilution forecasts into values that reliably reflect local rock mass conditions.
Across 68 stopes, the calibrated model lowers the mean absolute prediction error from 0.126 m to 0.101 m, a 20% improvement. The gain is most pronounced in stopes mined without reinforcement, where the error falls by nearly 29%, confirming that the unadjusted Potvin chart systematically overestimates dilution in weaker ground. Cable-bolted stopes, by contrast, already lie close to the one-to-one line; calibration leaves their forecasts essentially unchanged, ensuring that a tool designed to correct optimistic cases does not degrade situations that are well supported.
Sharper forecasts translate directly into planning benefits. In the mine’s 2021 schedule, replacing uncalibrated Potvin values with the corrected figures reduced the average dilution allowance for unsupported stopes from 31% to 23%. This revision allowed engineers to lower the cut-off grade by 0.12% Zn, which in turn lifted payable metal by roughly 1.5% and deferred Proven Reserve depletion by seven months. The divergence between calibrated and uncalibrated curves beyond about 30% predicted dilution now serves as an explicit trigger for cable installation, enabling support budgets to be targeted where they add greatest value.
The calibration itself is intentionally linear so that it can be embedded in existing Deswik® design templates; generating a corrected dilution estimate adds less than one minute per stope and requires no specialized software. Future work will explore multilinear and machine-learning approaches to capture non-linear interactions among rock quality, stress, and stope geometry, and will evaluate real-time calibration using CMS.
In sum, the study delivers a low-cost, data-driven correction that enhances grade-control precision, reduces unnecessary waste haulage, and extends resource life, thus offering a practical contribution to more efficient and sustainable underground mining operations.


