Article

Enhancing Small Dam Performance in Wadi Horan: A Hydrological Modelling Study for Rainwater Harvesting

1
College of Engineering, Dams and Water Resources Engineering, University of Anbar, Ramadi 31001, Iraq
2
Anbar Technical Institute, Middle Technical University, Baghdad 10074, Iraq
3
Soil Physics and Land Management Group, Wageningen University, 6700 AA Wageningen, The Netherlands
*
Author to whom correspondence should be addressed.
Resources 2025, 14(10), 150; https://doi.org/10.3390/resources14100150
Submission received: 28 July 2025 / Revised: 20 September 2025 / Accepted: 22 September 2025 / Published: 24 September 2025

Abstract

Water resources are a crucial foundation, and their importance increases in dry and semi-arid environments. Given the constraints of water resources, increasing population needs, and the processes of evaporation and infiltration, it is imperative to explore strategies to optimise rainfall, noted for its abruptness and quick accessibility. Constructing small dams is one of the most effective methods for harvesting rainwater in the Iraqi Western Desert. This will conserve water throughout the arid season. The study’s goal was to assess and enhance rainwater harvesting (RWH) performance across diverse design and management scenarios, utilising a novel water-harvesting model (WHCatch) for testing at the sub-catchment level. Rainfall data from two dams in Wadi Horan from 1990 to 2019 were included in the model. This study emphasises the advantages of modelling long-term water balances at the sub-catchment level and proposes strategies for optimising rainwater harvesting to enhance understanding of the hydrological processes inside the rainwater harvesting system. Substantial enhancements in RWH performance were attained by modifying the heights of the spillway (2 m) and the flow directions, yielding 90% and 85% increased storage for the Horan/2 dam and the Horan/3 dam, respectively. In practice, this provides guidelines for creating and implementing low-cost, minor dam modifications as well as for establishing seasonal release schedules that satisfy downstream and storage requirements. The findings are consistent with policy-level support for sustainable development goals in arid regions.

1. Introduction

Climate-change-induced increases in water demand exacerbate pressure on water resources for urban and agricultural development. In arid and semi-arid environments, the primary issues are aridity and climatic unpredictability. The temporal and spatial distribution of precipitation in these areas is very varied, and the mean annual rainfall is moderate. Residents of arid locations have established numerous rainwater harvesting (RWH) techniques to augment water accessibility for domestic purposes, agriculture, and cattle [1]. RWH is a method for generating, collecting, storing, and conserving local surface runoff [2]. Concerns persist about the prediction of precipitation and water flow, as well as the management of resultant water volumes [3,4].
Small dams and rainwater harvesting systems might be regarded as localised Nature-based Solutions (NbS) for water security in arid regions, alongside their hydrological functions. Recent research on Nature-based Solutions (NbS) indicates that the intentional implementation of green infrastructure enhances resilience to climate variability, especially in urban flood management within densely populated areas [5]. In the same way, tiny dams in sparsely inhabited dry areas help ecosystems adapt by catching runoff that happens only seldom, reducing drought stress, and allowing groundwater to replenish. Putting rainwater collection in the context of this global NbS conversation shows that it may be a long-term, low-carbon alternative to big, expensive infrastructure.
Hydrological engineers aim to understand rainwater harvesting performance, catchment input, and flood flows to design structures for rainwater collection. Adham et al. [1,6] assert that rainwater harvesting structures are designed to fulfil water demands while maximising the collection of expected runoff within a specified recurrence interval. The water balance equation for a region or aquatic system delineates the inflow, outflow, and variations in water storage [7]. Ouessar et al. [8] created and used a straightforward tool to assess the structural stability of 12 locations in Tunisia. The structures were evaluated by physical examination, resulting in a rating and an overall score. This research evaluated the hydrological effects of water harvesting systems using the adaptation and assessment of the Soil and Water Assessment Tool (SWAT).
Al-Adamat [9] asserts that the technical design and selection of suitable locations are essential for the efficacy of water collection systems. There is often insufficient comprehension of hydrological processes at the sub-catchment scale. Jothiprakash and Mandar [6,7] used the Analytical Hierarchy Process to assess several Rainwater Harvesting systems to determine the best suitable method and the necessary number of buildings to satisfy the daily water requirements of a large-scale industrial zone. Adham et al. [6] examined a RWH model to optimise rainwater collection in the Wadi Oum Zessar basin in Tunisia. The WHCatch model was utilised for 25 sub-catchments using rainfall data from 1980 to 2004. Three distinct year classifications were employed for the RWH analysis: arid, average, and humid. This study highlighted the hydrological functions of the water collecting system and provided various recommendations for improving its efficacy. Ninety-two percent of the sub-catchments exhibited improved performance attributable to rainwater harvesting, as demonstrated by the alteration in the spillway’s elevation according to the water flow direction.
Previous research has improved site selection (e.g., GIS/SCS-CN overlays) and runoff forecasting at extensive or catchment levels; however, there has been inadequate quantification, at the sub-catchment scale over multi-decadal records, of how particular, low-cost structural and operational modifications to existing small dams influence water balance components and usable storage in data-deficient desert environments.
This study sought to assess and improve rainwater harvesting (RWH) efficacy under various design and management scenarios by evaluating an economical WHCatch model at the sub-catchment scale. The model was utilised on rainfall data from 1990 to 2019 in Wadi Horan.
The WHCatch model is a simple tool for collecting water that was first developed for North Africa’s semi-arid areas. We picked WHCatch because it does not need much input—just rainfall, catchment characteristics, and CN values—and it gives reliable water-balance simulations at the sub-catchment level. There are other strong hydrological models, such as SWAT and HEC-HMS; however, they require a lot of hydro-meteorological data and calibration records, which Wadi Horan does not have. WHCatch, on the other hand, is perfect for places where there is not a lot of data; therefore, it is the best approach to see how well a little dam works in this case.
This research provides relevant evidence that targeted improvements of existing small dams may substantially improve storage capacity at little cost, hence increasing reliability for residential, livestock, and additional irrigation requirements. This method helps dry areas reach their long-term development goals by reducing accidental leaks and making it easier to intentionally refill groundwater. This makes it easier for farmers to obtain water when there is a drought.

2. Study Area

The whole northwest of the Euphrates River is occupied by the western Iraqi desert region, which is around latitudes 29° N and 34° N and longitudes 39° E to 48° E [10]. Wadi Horan is a large valley with a total area of around 13,107 km2 that is situated in the western desert of Iraq, as shown in Figure 1. It originates at the Iraqi–Saudi border and travels northeast, where it passes past the city of Al Rutba before emptying into the Euphrates River close to Al Baghdadi city, which is located south of Haditha (1) [11]. There are four existing small dams in Wadi Horan: Horan/1, 2, and 3, and Abila. This study was conducted on two existing dam sites (Horan/2 and Horan/3). Horan/2 is located 15 km east of Rutba city, and Horan/3 is located 58 km northeast of Rutba city. The characteristics and coordinates of the dams are shown in Table 1.
The rainy seasons are usually winter and spring, whereas the dry season is summer. The research region had an average of 120 mm of rain each year, with 49% falling in the winter, 36% in the spring, and 15% in the autumn. June, July, August, and September are the warmest months of the year, with the least amount of precipitation [11]. The average annual temperature is around 20 °C, the average annual evaporation is 3000 mm, and the average annual wind speed is 2.64 m/s. December saw the highest percentage of relative humidity (76%) [12].
The geology and the shape of the land both have a huge impact on whether or not a dam can be erected. The proposed site is in the Quaternary valley-fill deposits, which lie on top of Cretaceous carbonate bedrock [13]. The valley fill is made up of 2 to 5 m of sandy-gravelly alluvium. This lets water seep in and replenish the groundwater, but it has to be cleaned to prevent water from seeping out. The carbonate bedrock produces solid abutments; however, other parts may be more permeable because of karstic characteristics. These traits show that the site is good for building a dam, but rigorous geotechnical tests are needed to make sure the dam will work well in the long run [14].

3. Materials and Methods

3.1. Data Collection

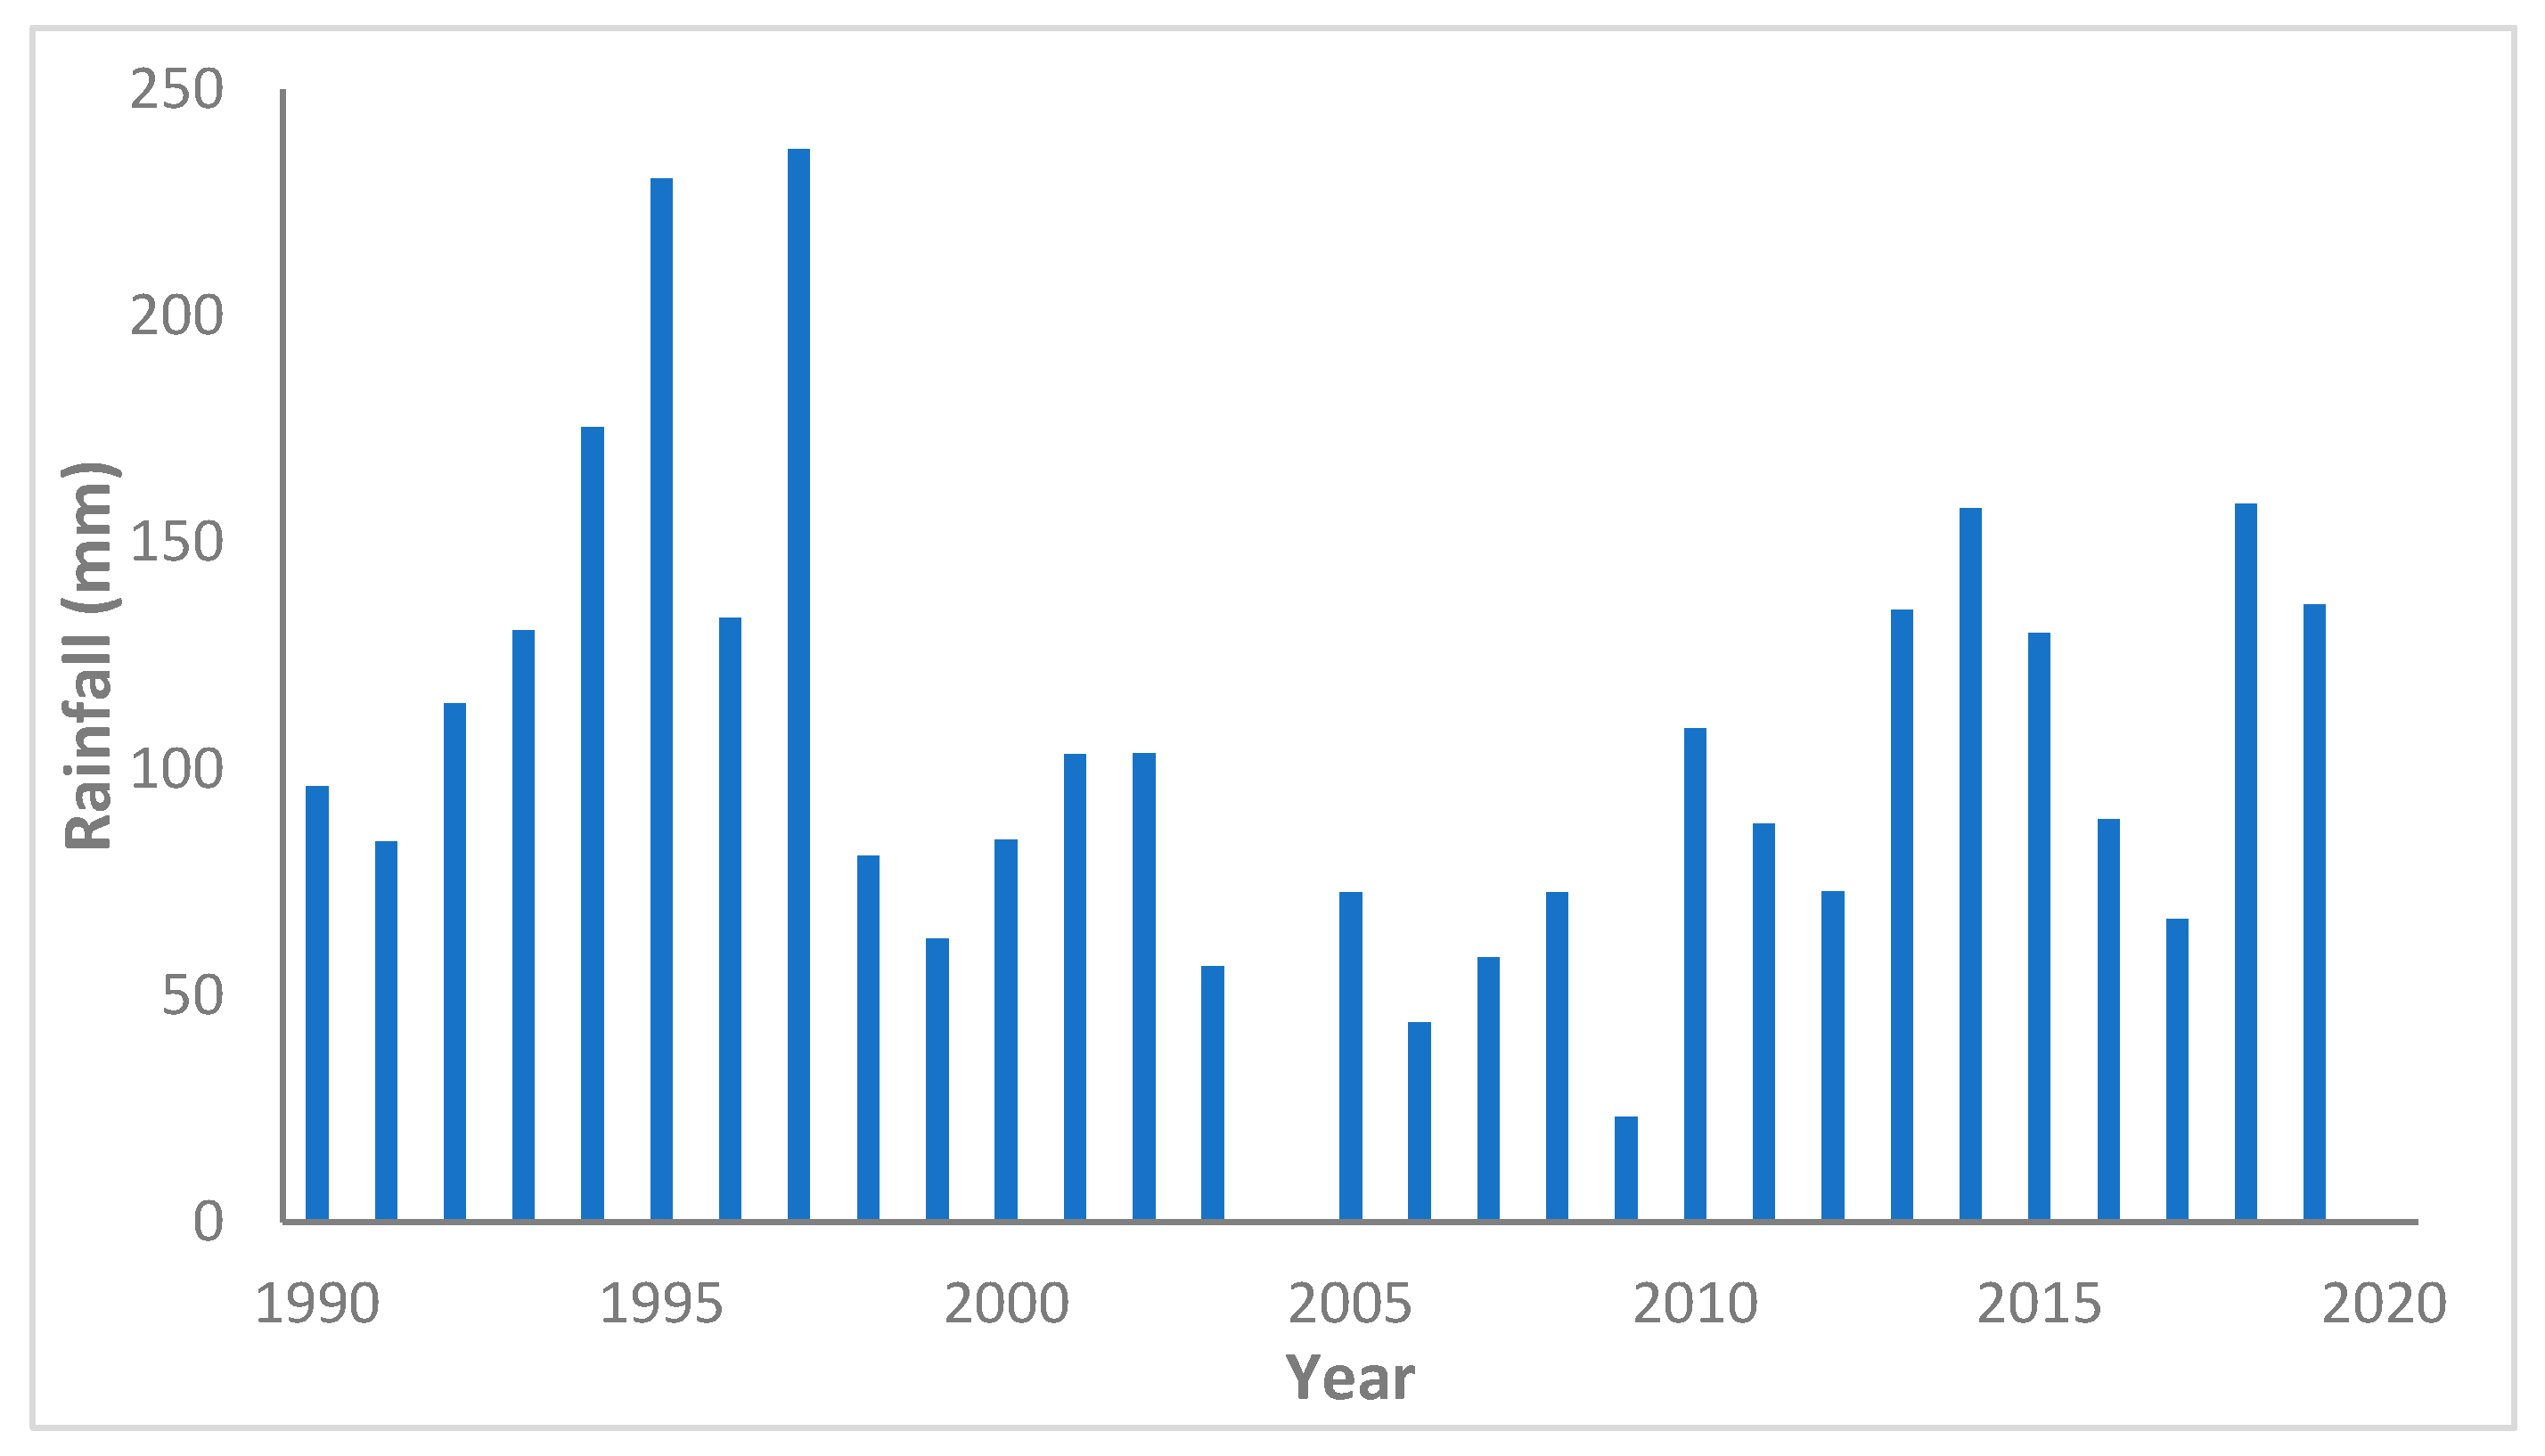
Yearly rainfall data for 30 years (1990–2019) from the Al-Rutba station were used. As shown in Figure 2, Wadi Horan catchments show significant fluctuations in rainfall amounts, with Table 2 displaying the highest daily rainfall depth of the year.
The characteristics of each dam, the information of the dams under study, were collected from the Water Resources Department in Al-Anbar Governorate, based on the design plans and design reports for each dam.

3.2. Runoff Depth

One crucial factor in choosing appropriate RWH locations is runoff depth [15]. The run-off depth was calculated using the SCS technique. The SCS technique, created in 1969 by the United States’ Soil Conservation Services (SCS), is a straightforward, reliable, and stable conceptual approach for estimating the depth of direct runoff based on the depth of storm rainfall. It only uses CN as a parameter.
For the whole storm, the volume of extra rainfall or runoff Q remains smaller or equivalent to the volume of rainfall P; similarly, once runoff starts, the extra volume of water held in the catchment is smaller than or equivalent to a certain theoretical storage (SMax). There exists a certain quantity of rainfall (initial abstraction prior to ponding) that will result in no runoff, so the possibility of runoff is P-Ia. The SCS technique posits that the proportions of the two real quantities to the two prospective quantities are equivalent, as stated by [16].
Q = ( P 0.2 S ) 2 P + 0.8 S w h e r e   I a > 0.2   S
S = 25,400 C N 254
Volume of Runoff = Q × (Ac − As)
where Q represents the directed runoff (mm), P denotes rainfall depth (mm), S indicates the theoretical maximum retention (mm), CN refers to the Curve Number, and A signifies the entire area of the watershed. Ac is the catchment area, and As represents the reservoir area.
Ia represents the initial abstraction, and S is the greatest volume of water that may be temporarily held or stored.
Nonetheless, the theoretical maximum retention fluctuates between storms owing to variations in soil moisture, mostly influenced by antecedent precipitation [17]. CN ranges from 0 to 100 and signifies the runoff reaction to a certain rainfall event. Elevated CN values represent that a substantial fraction of the precipitation will convert to direct runoff [18]. This approach relies on:

3.2.1. Land Use/Land Cover (LU/LC) Map

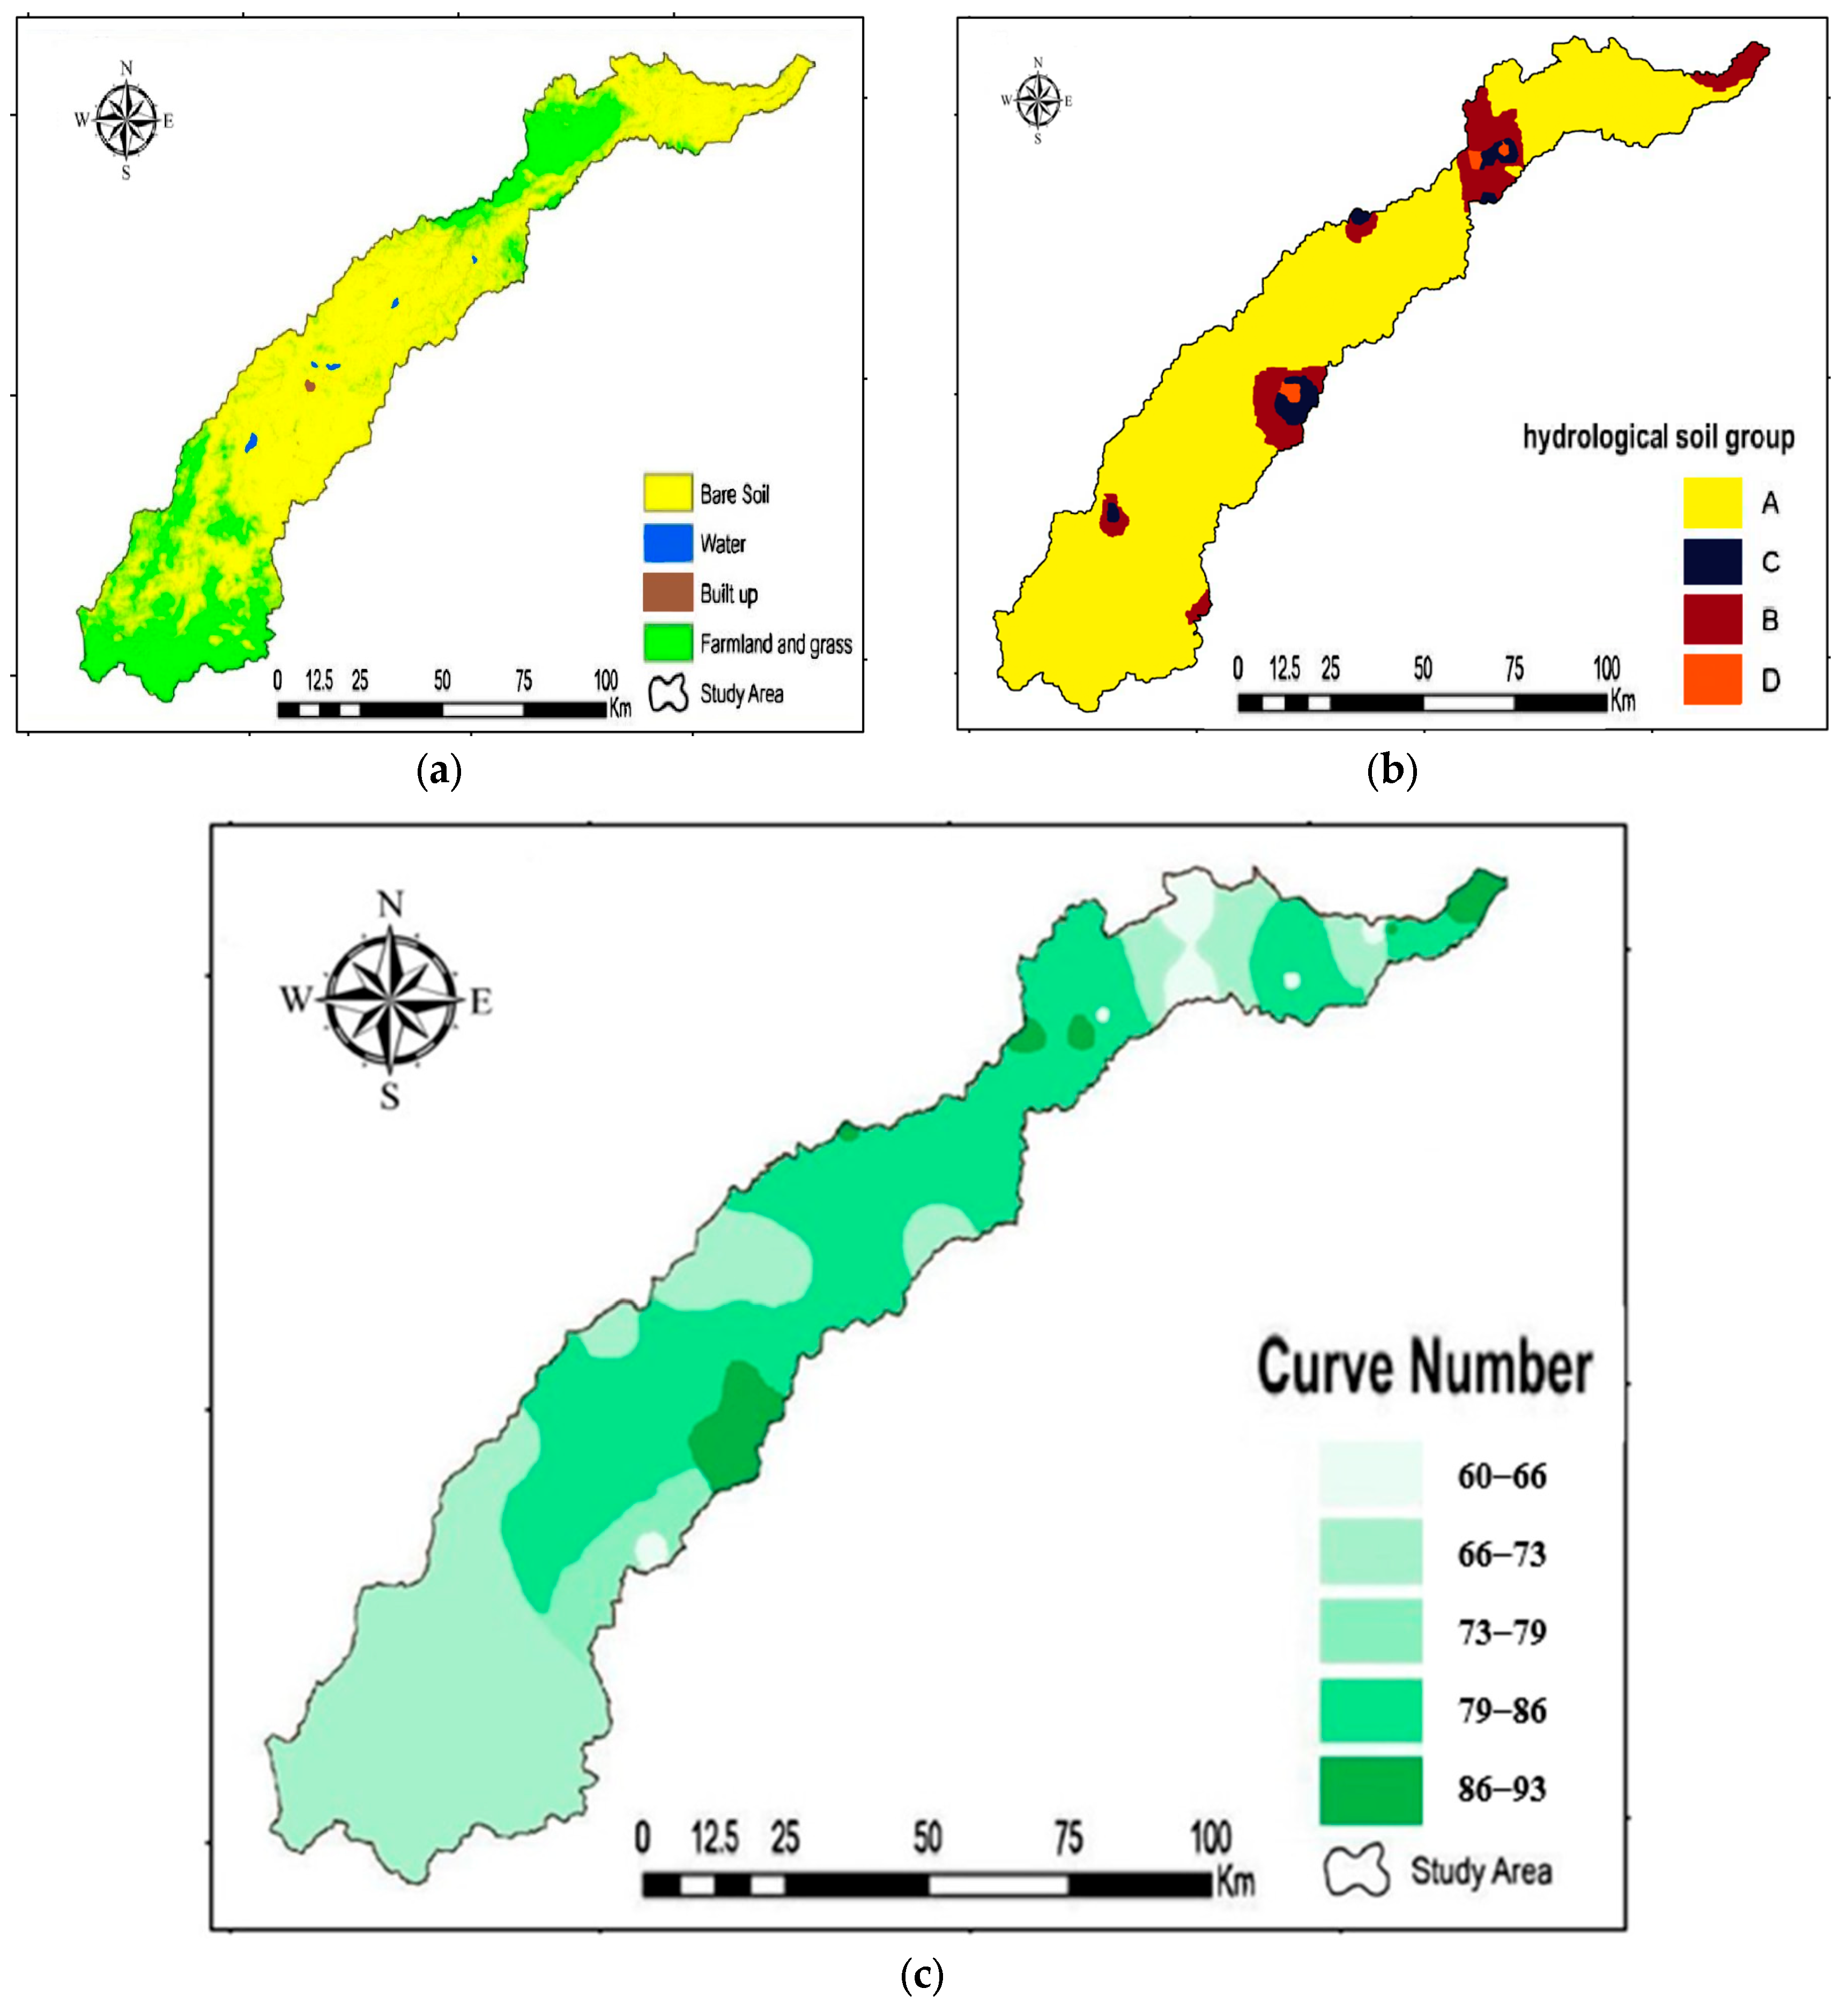
The LU/LC map of Wadi Horan used a Landsat 8 image from December 2021, with a resolution of 30 m, for mapping purposes. The LU/LC map has been created by applying ArcGIS 10.0 software. The LU/LC categories in the research region include bare soil, built-up land, water bodies, farmland, and grass, as seen in Figure 3a and detailed in Table 3.

3.2.2. Hydrological Soil Group Map

The hydrological soil group (H.S.G) map derived from prior investigations [19] was used. Soil properties were analysed using the ArcGIS 10.0 software, and a GIS map was created (H.S.G). The research area has four kinds of soil, designated as groups A, B, C, and D, as seen in Figure 3b.

3.2.3. Curve Number (CN)

A CN map was acquired for the Wadi Horan basin. The (H.S.G) map superimposed on the land use map. After that, a new map was created with new polygons to represent the combined land use and H.S.G. Following this process, each polygon on the land-soil map had its corresponding Curve Number value determined using the classification method (USGS), as shown in Figure 3c.
When the SCS-CN approach is used to estimate surface runoff, Equation (1) states that it relies on the quantity of rainfall that occurs each day and the value of S, which is determined by Equation (2). Equation (3) then determines the total runoff based on the value of CN. Following the intersection of the H.S.G. map and the land use map, a map of curve number Figure 3c was produced. All of the Horan Wadi’s CN values fell between 60 and 93. Table 4 displays the characteristics of every watershed in the research region.
The CN parameter performs an excellent job of linking the potential for runoff to the types of land cover and soil. For example, hydrologic group D soils with bare soil areas have CN values that are quite high (>85), which suggests that precipitation rapidly converts into runoff. In contrast, group B soils used for grassland or farming have lower CN values (around 65–70), which indicates that more water may penetrate into the ground. Because CN values directly impact the projected depth of runoff, they are particularly significant for understanding which sub-catchments should be prioritised for rainwater collection. In actuality, this means that actions performed to manage a watershed, such as restoring vegetation or improving soil, would lower CN and, as a result, lower runoff. This would go nicely with changes to the structure.

3.3. Water Harvesting at Sub-Catchment Level Model (WHCatch)

The WHCatch is a programme implemented as a basic Visual Basic for Applications (VBA) macro inside Excel. This concept was originally used by Adham et al. [6] for rainwater collection in the Oum Zessar catchment in southern Tunisia. This model uses the rational technique to predict surface runoff. The advantages of this paradigm are:
  • Providing various solutions to enhance and comprehend the water balance across all watersheds.
  • The capacity to input extensive data and execute analyses and computations rapidly and with little effort.
  • It shows how raising or lowering the spillway height affects storage area and volume, affecting the water balance equation parameters for each sub-catchment.
A new worksheet in the modelling model for SCS-CN direct runoff calculations was created. For each dam, this worksheet implements the equation of water balance and SCS-CN technique parameters. Each data change is represented in both ways since this worksheet is linked to the Rational method worksheet. After entering daily rainfall events for the study period, the maximum surface runoff value was calculated.
It organises, saves time, and maintains large amounts of data. After entering SCS-CN and catchment parameters, calculate surface runoff depth. The simulation will be based on runoff (when the largest rainfall event exceeds Ia) or zero runoff.

3.4. Water Balance

The water balance for the two constructed reservoirs of water harvesting was assessed, calculating the direct runoff and then determining the variation in water storage by evaluating the variation between total input and output. A watershed typically has two primary components: an area of direct runoff and a storage area (reservoir). The water-balance equation for a region may be expressed in volume units (m3) as stated by Boers et al. [20].
Δ𝑆 = 𝐼 − 𝑂
where
  • Δ represents the variation in storage through a certain time interval, measured in cubic metres (m3).
  • I = inflow, measured in cubic metres (m3).
  • O = represents the outflow, measured in cubic metres (m3).

3.5. Water Losses

3.5.1. Evaporation Losses

Evaporation is often regarded as the primary source of water loss for several ponds and reservoirs; it plays a crucial role in controlling the global water balance within the hydrological cycle and results in significant losses from aquatic systems. Despite significant investment of work, time, and resources in the storage of water inside these reservoirs, substantial evaporation often transpires. In the late 1950s, total evaporation from water surfaces in the United States exceeded the total volume of water extracted for household use by cities and towns [21].
Evaporation measurements of lakes are quite uncommon and mostly restricted to brief intervals. Research including all lakes and dams in Iraq indicated that an evaporation rate of 22% was applied to dams in the Western Desert [22]. Dawood et al. [23] indicated that, owing to evaporation, yearly water losses may surpass 40% of the water held in current dams at all times. This analysis utilised a yearly evaporation loss rate of 40% from the entire store.

3.5.2. Infiltration Losses

Infiltration is influenced by soil texture and structure; soil type significantly impacts the infiltration rate. Sandy loam soil has the greatest infiltration rates owing to its coarse texture and big pores that facilitate rapid infiltration, whereas sandy clay and loamy clay possess a medium to fine texture [24]. The studies on dam design in the Western Desert indicate that losses of infiltration in the reservoirs exceed 20% [10]; this proportion was utilised in the research.

4. Results and Discussion

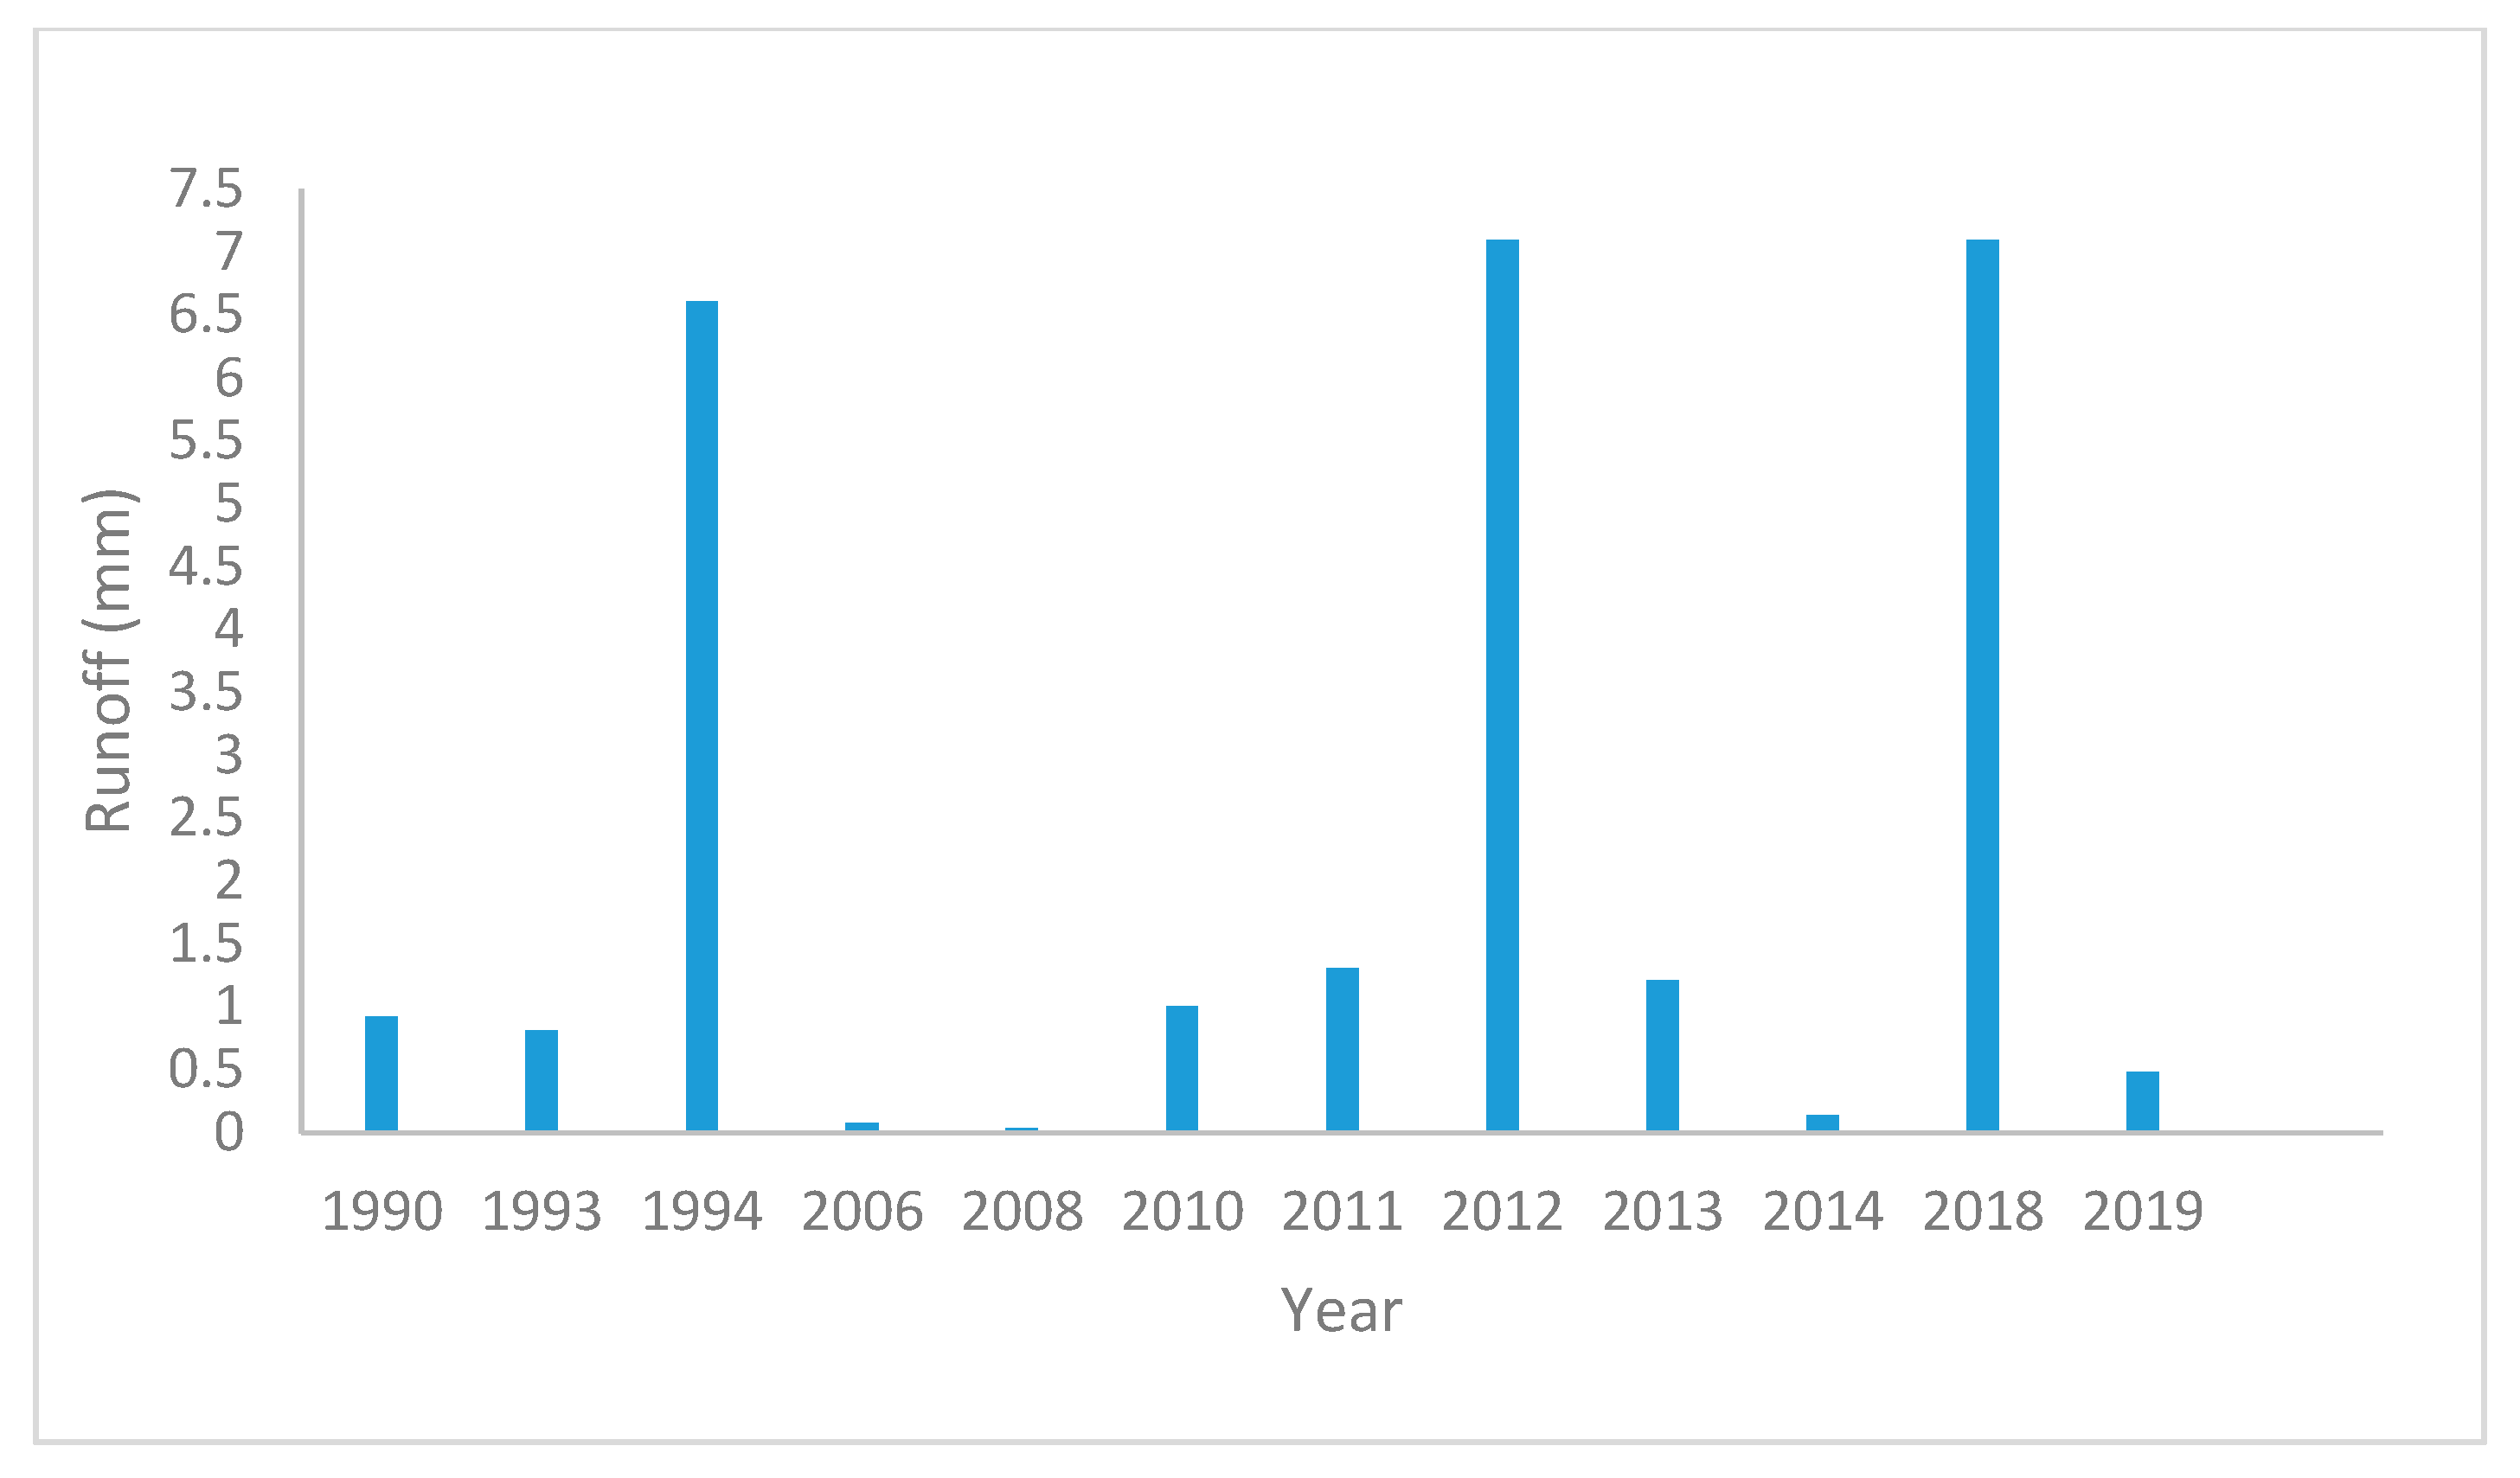
Equation (1) was utilised to determine the depth of surface runoff based on the maximum daily rainfall data throughout a 30-year period from 1990 to 2019. Surface runoff occurred in 12 years, representing 40% of the total years in the research period. The greatest depth of surface runoff was 7.09 mm at a rainfall depth of 43 mm, while the minimum depth of surface runoff was 0.034 mm at a rainfall depth of 17.3 mm, as seen in Figure 4. The water balance equation for the two dams was utilised and applied to 60% of evaporation and infiltration losses.

4.1. The Volume of Runoff for (Horan/2 Dam)

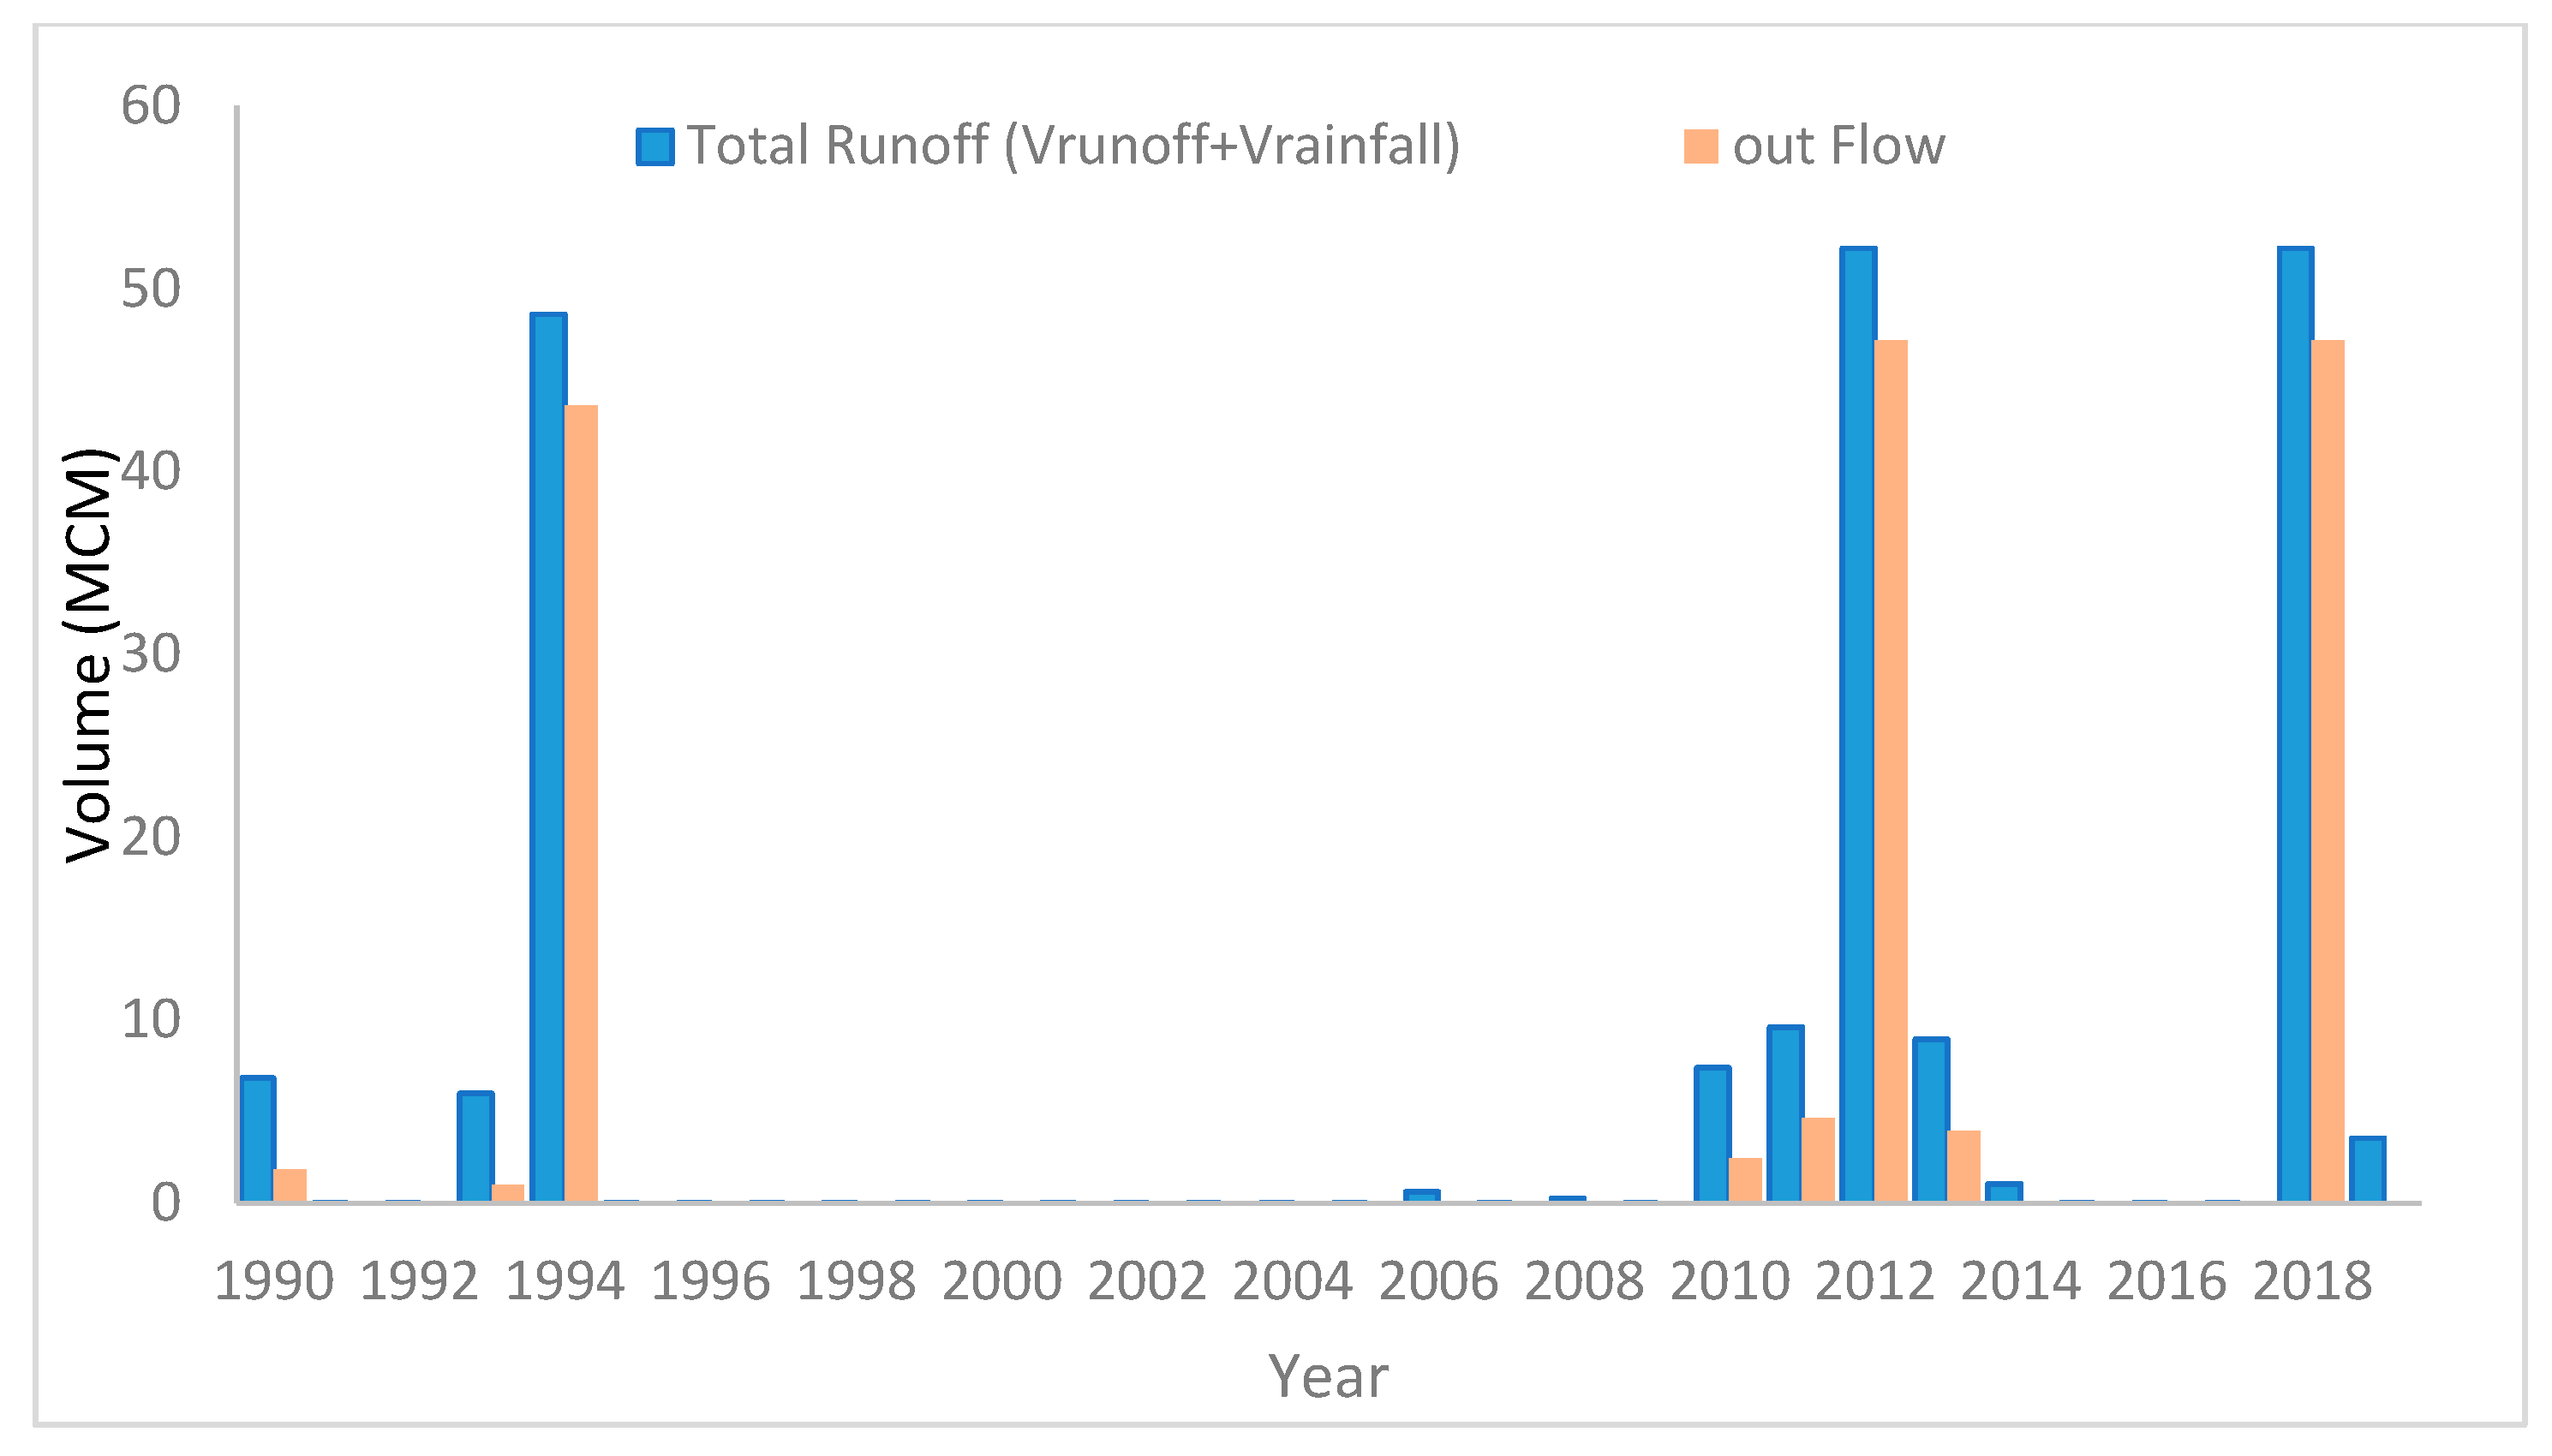
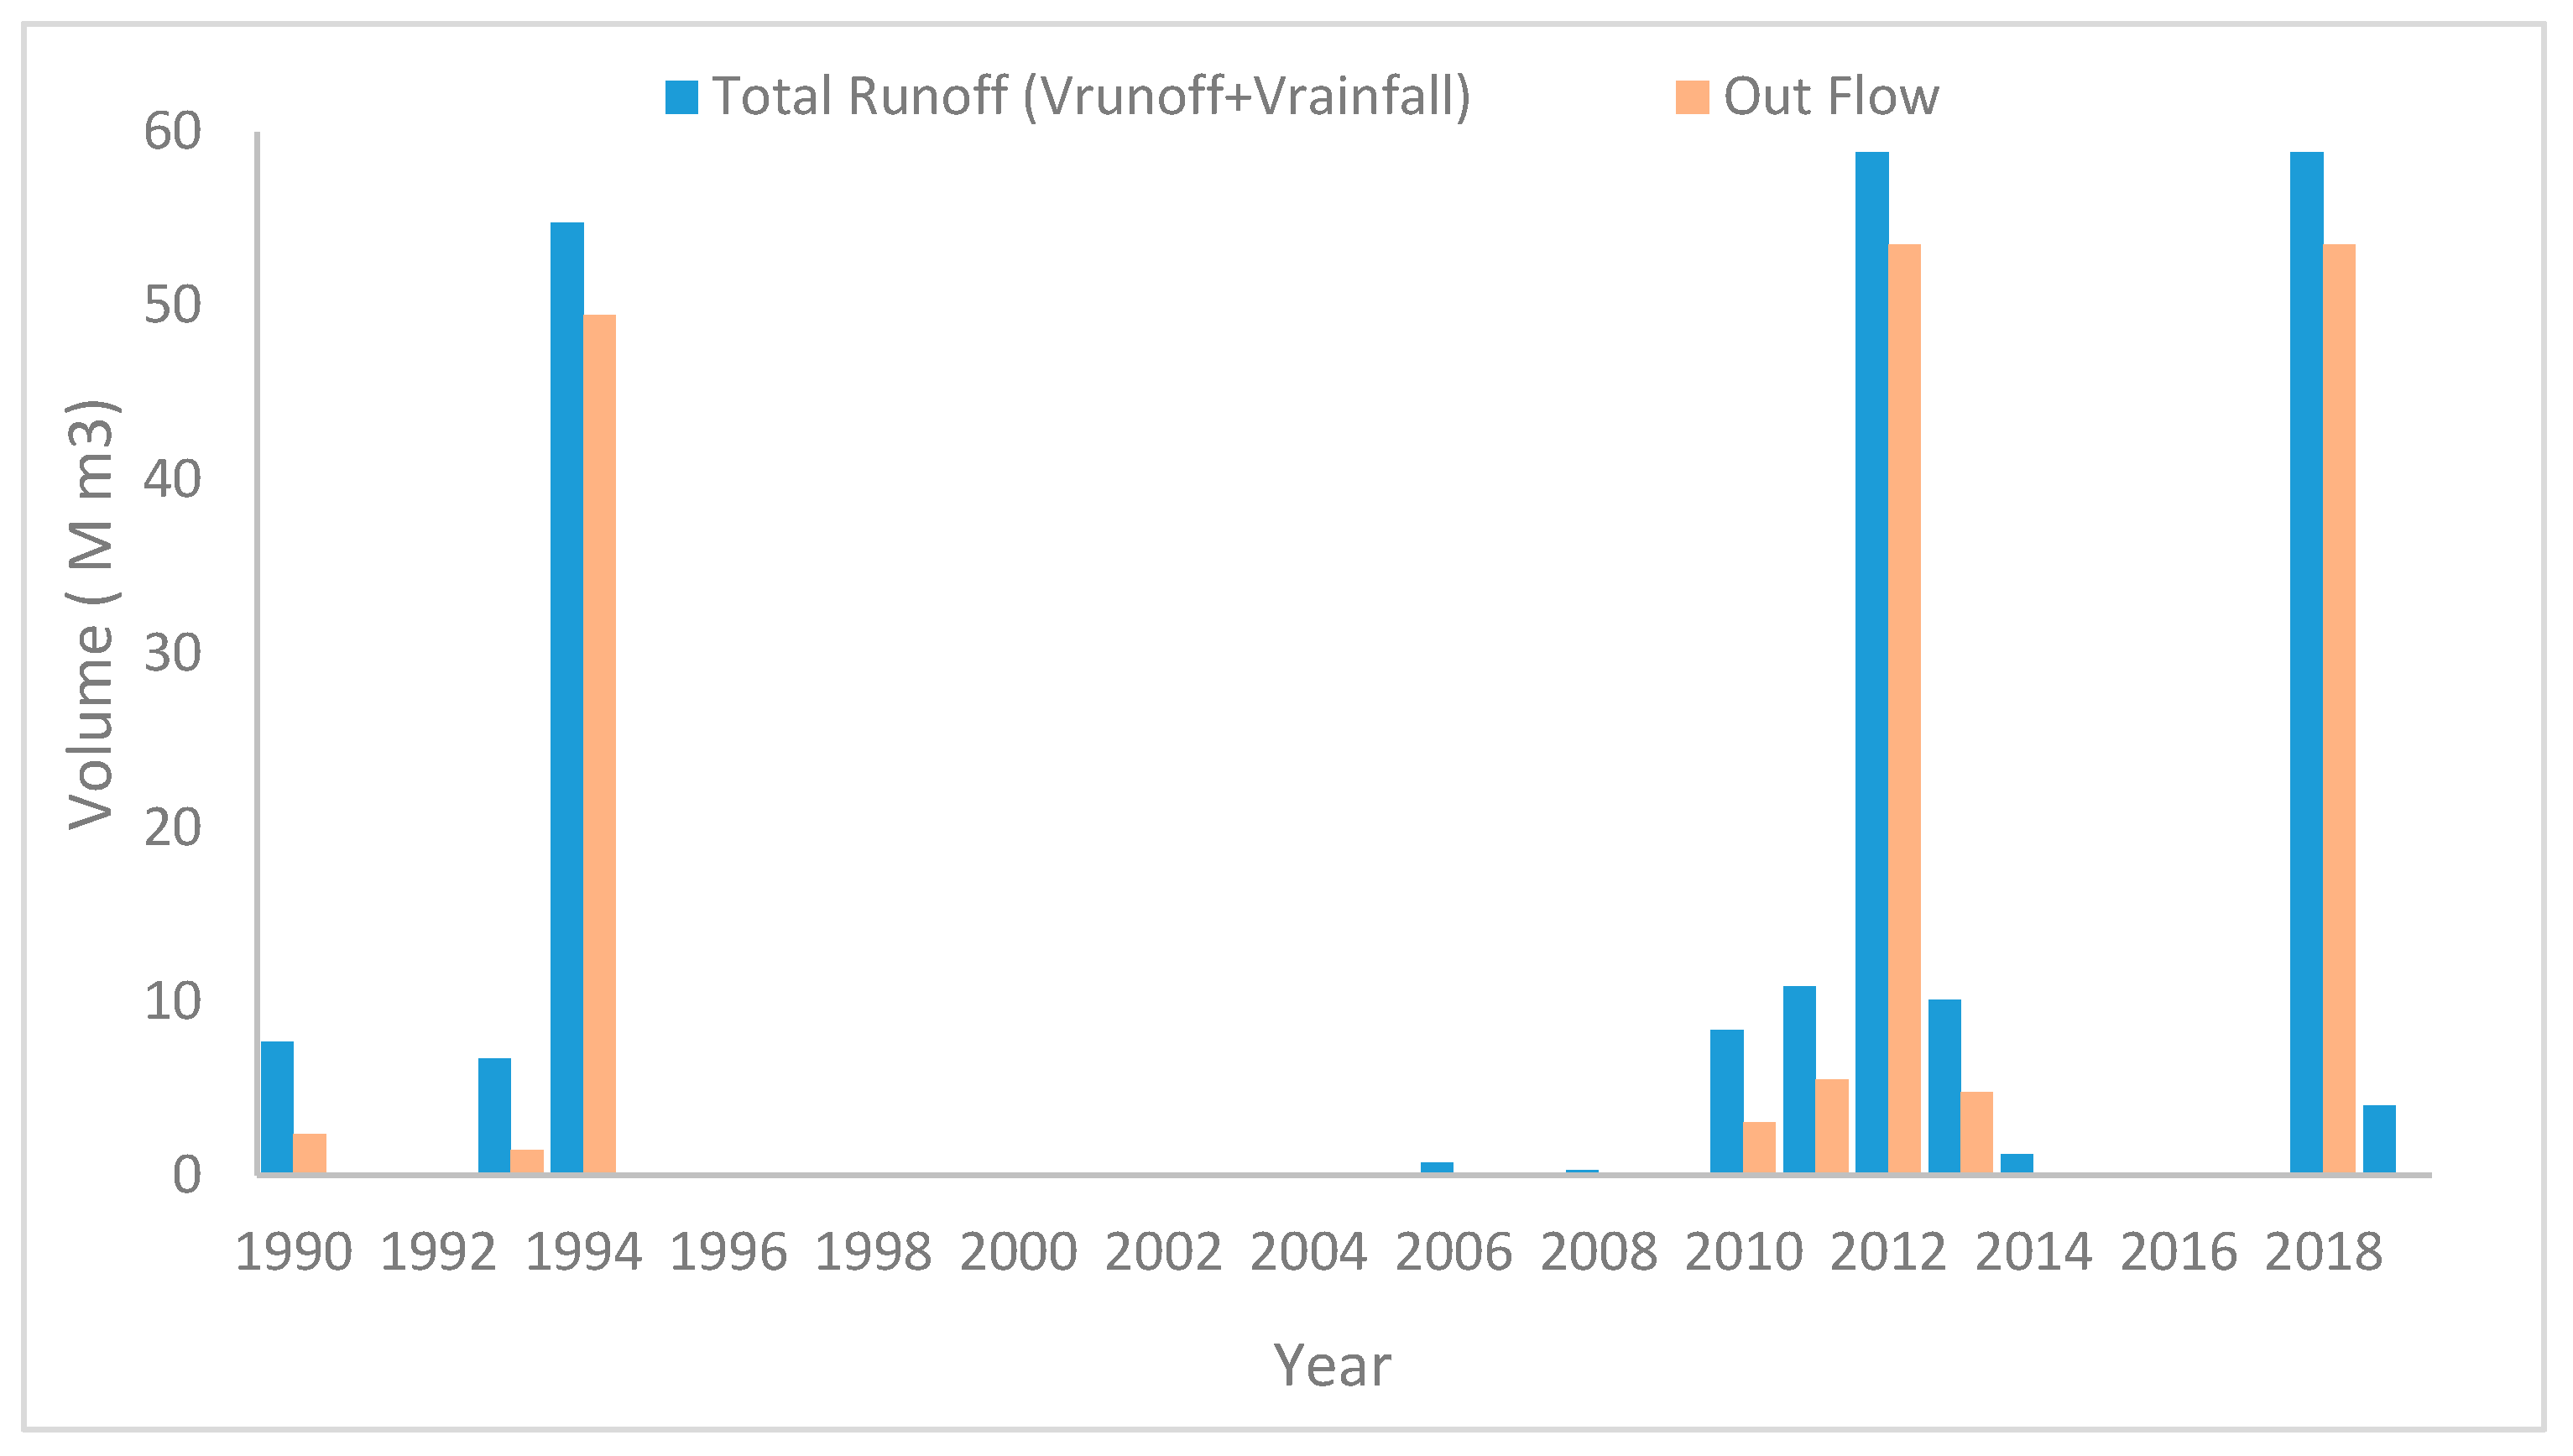
The constraints of the used approach are as follows: CN = 76.47, S = 78.156, Ia = 15.631, catchment area of Horan/2 = 7350 km2, and maximum storage area = 1,884,000 m2. The volume of surface runoff into the Horan/2 dam, which led to the dam reaching its maximum capacity for storage, was 197.65 MCM, with runoff discharge across the spillway occurring over a duration of 8 years, as seen in Figure 5. The overall storage years of the dam represent 67% of the direct runoff.
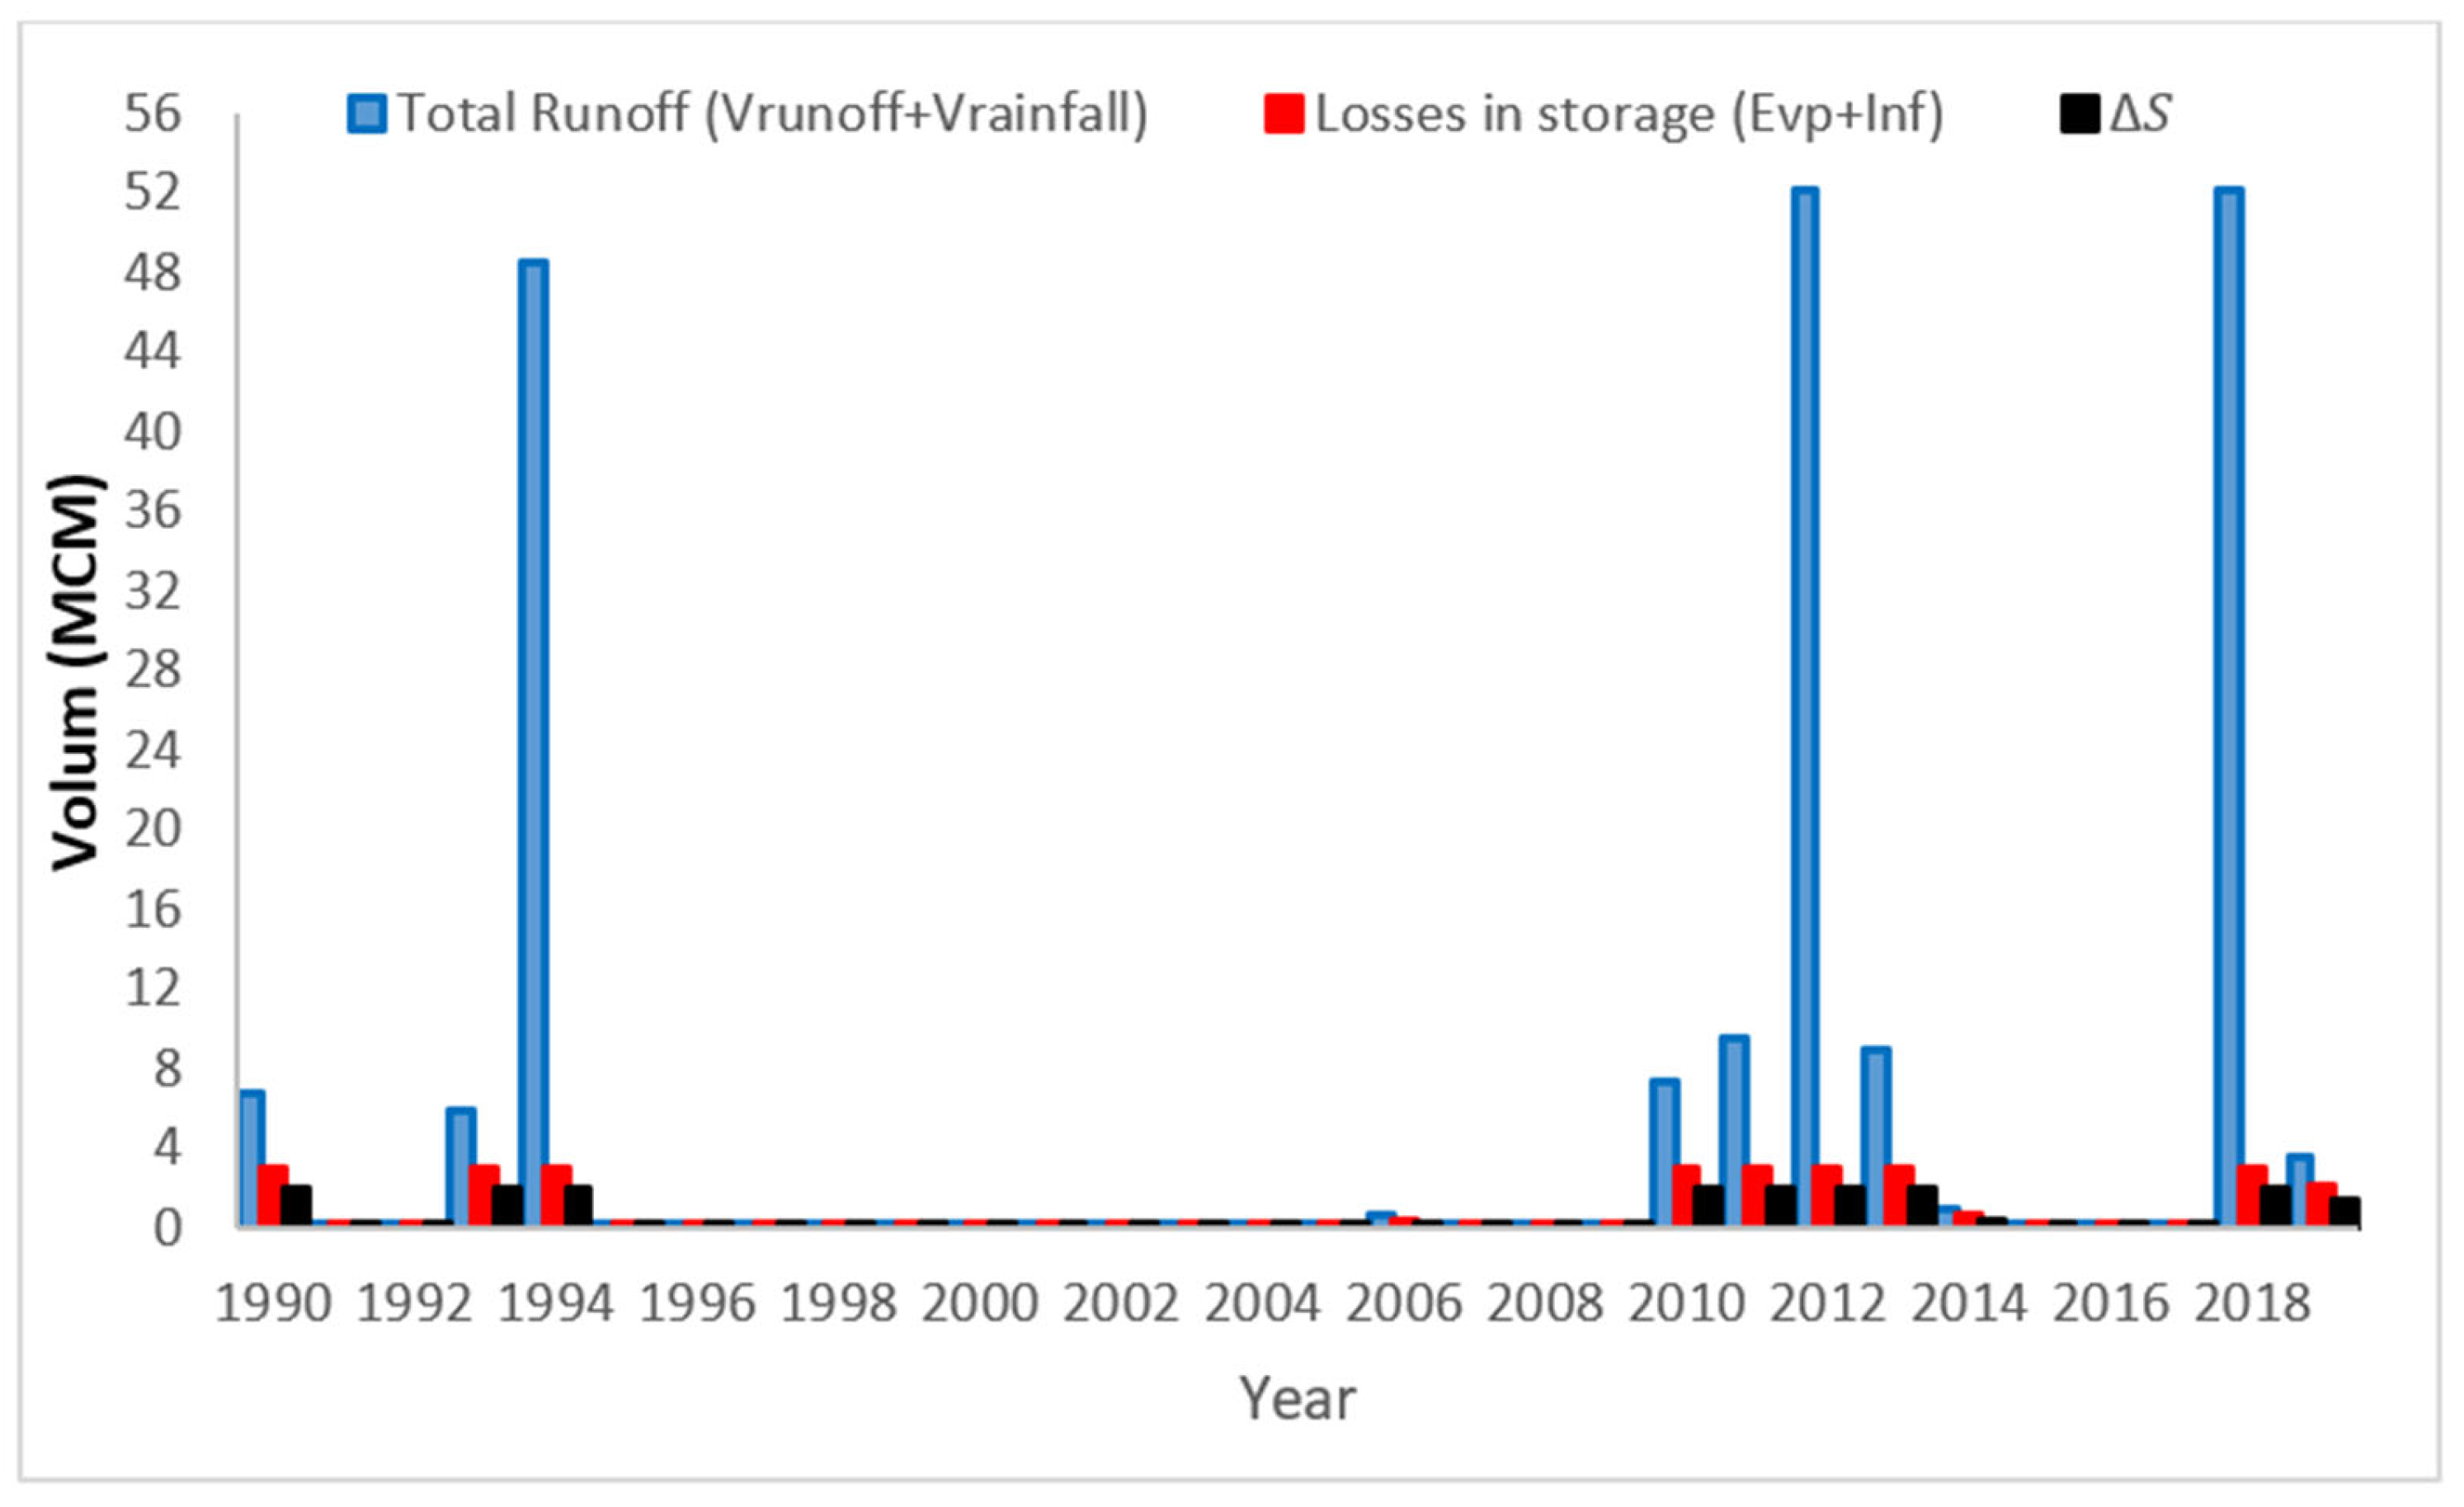
Through those periods, the output flow across the dam’s spillway was 151.85 MCM, as seen in Figure 5, representing 76% of the water inflow into the Horan/2 dam. When contrasting with the losses incurred from water storage in the dam due to evaporation and infiltration, totalling 27.48 MCM, as illustrated in Figure 6, the quantities of unutilised water during years devoid of surface runoff are substantial. Consequently, the net storage amounts to 18.32 MCM.
Furthermore, the volumes of water that may flow in during the runoff years from the upstream of Wadi Horan and Wadi Al-Masad might represent substantial amounts that can be utilised to offset deficiencies, particularly in the absence of surface runoff. Maximising rainwater harvesting during the rainy season in Wadi Horan is essential to mitigate the water deficit in the dry season, ensuring sustainable water availability for agricultural and domestic purposes, hence fostering a conducive living environment. The results indicate that the volume of the Horan/2 dam reservoir is relatively minor compared to the amounts of water arriving that were not retained throughout the runoff years for optimal use.

The Suggested Solutions

To augment rainwater collection, increasing the spillway height of the Horan/2 dam by two metres will result in a storage capacity of 9.5 million cubic metres and a surface area of 2.62 square kilometres. This enhances storage capacity by approximately 90% of the present volume, lowers water outflow over the spillway, and accommodates a greater volume of water from the upstream area. This minimises the expenses associated with the construction of several minor dams by decreasing the costs of excavations required for the spillway, the foundation of the dam, and the fill, hence reducing the overall time needed.

4.2. The Runoff Volume for (Horan/3 Dam)

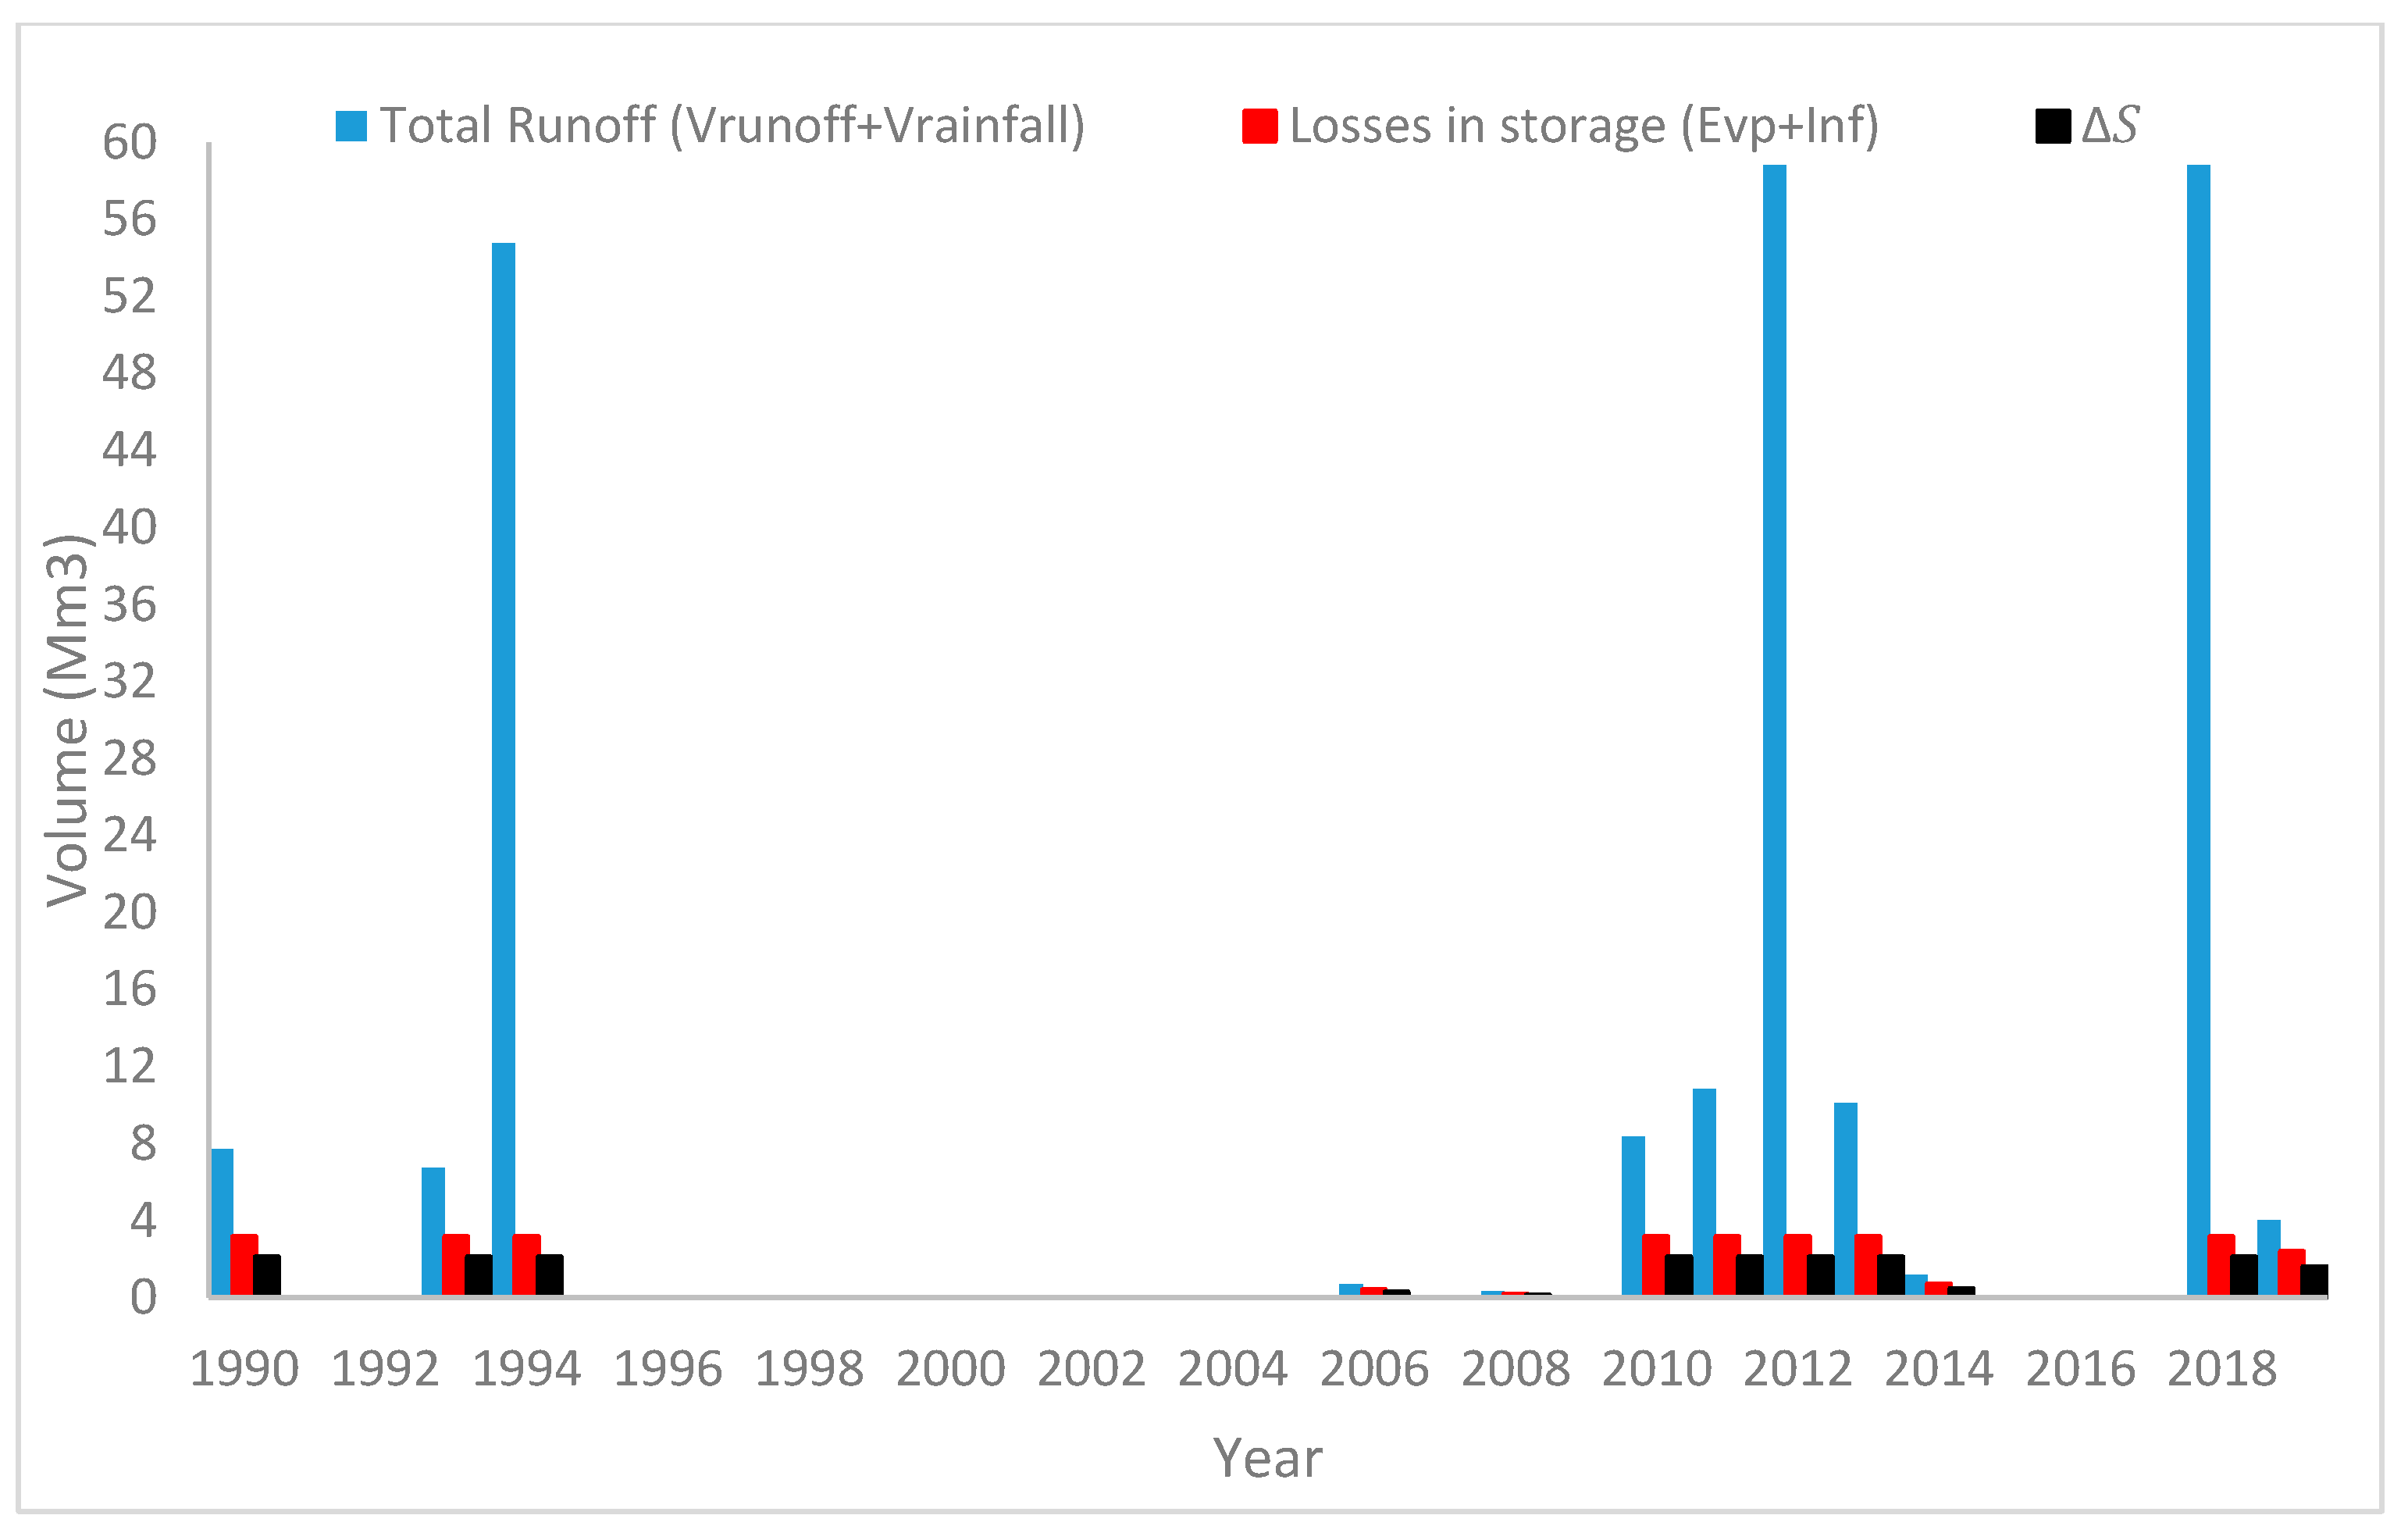
The constraints of the employed approach are as follows: CN = 76.47, S = 78.156, Ia = 15.631, catchment area of Horan/3 = 8277 km2, and maximum storage area = 2,226,000 m2. The water output across the spillway totalled 173.78 MCM over the 8-year flood period, as seen in Figure 7. This volume of water was 78% of the entire surface runoff over a period of 30 years. The use of this volume of water to replenish groundwater and mitigate losses due to evaporation and depressions storage. The infiltration and evaporation losses amounted to 29.37 MCM, but the net storage was 19.58 MCM, as seen in Figure 8.
Conducting research and strategising for the maximisation of rainwater collection is beneficial during the dry season, given the fluctuations in precipitation in the Wadi Horan. Owing to the absence of preparatory scientific and financial viability assessments for dams. The General Commission of Dams and Reservoirs has failed to execute 23 water harvesting dams since 2013 [25,26]. The storage capacity of the Horan/3 dam is minimal in relation to the volume of incoming water.

The Suggest Solution

Assuming that the Horan/3 dam’s spillway height is increased by two metres to enhance rainwater harvesting, the corresponding increase in storage capacity and surface area would be 3.17 km2 and 9.8 MCM, respectively. This contributes to an increase in storage capacity by approximately 85% relative to the current storage levels.
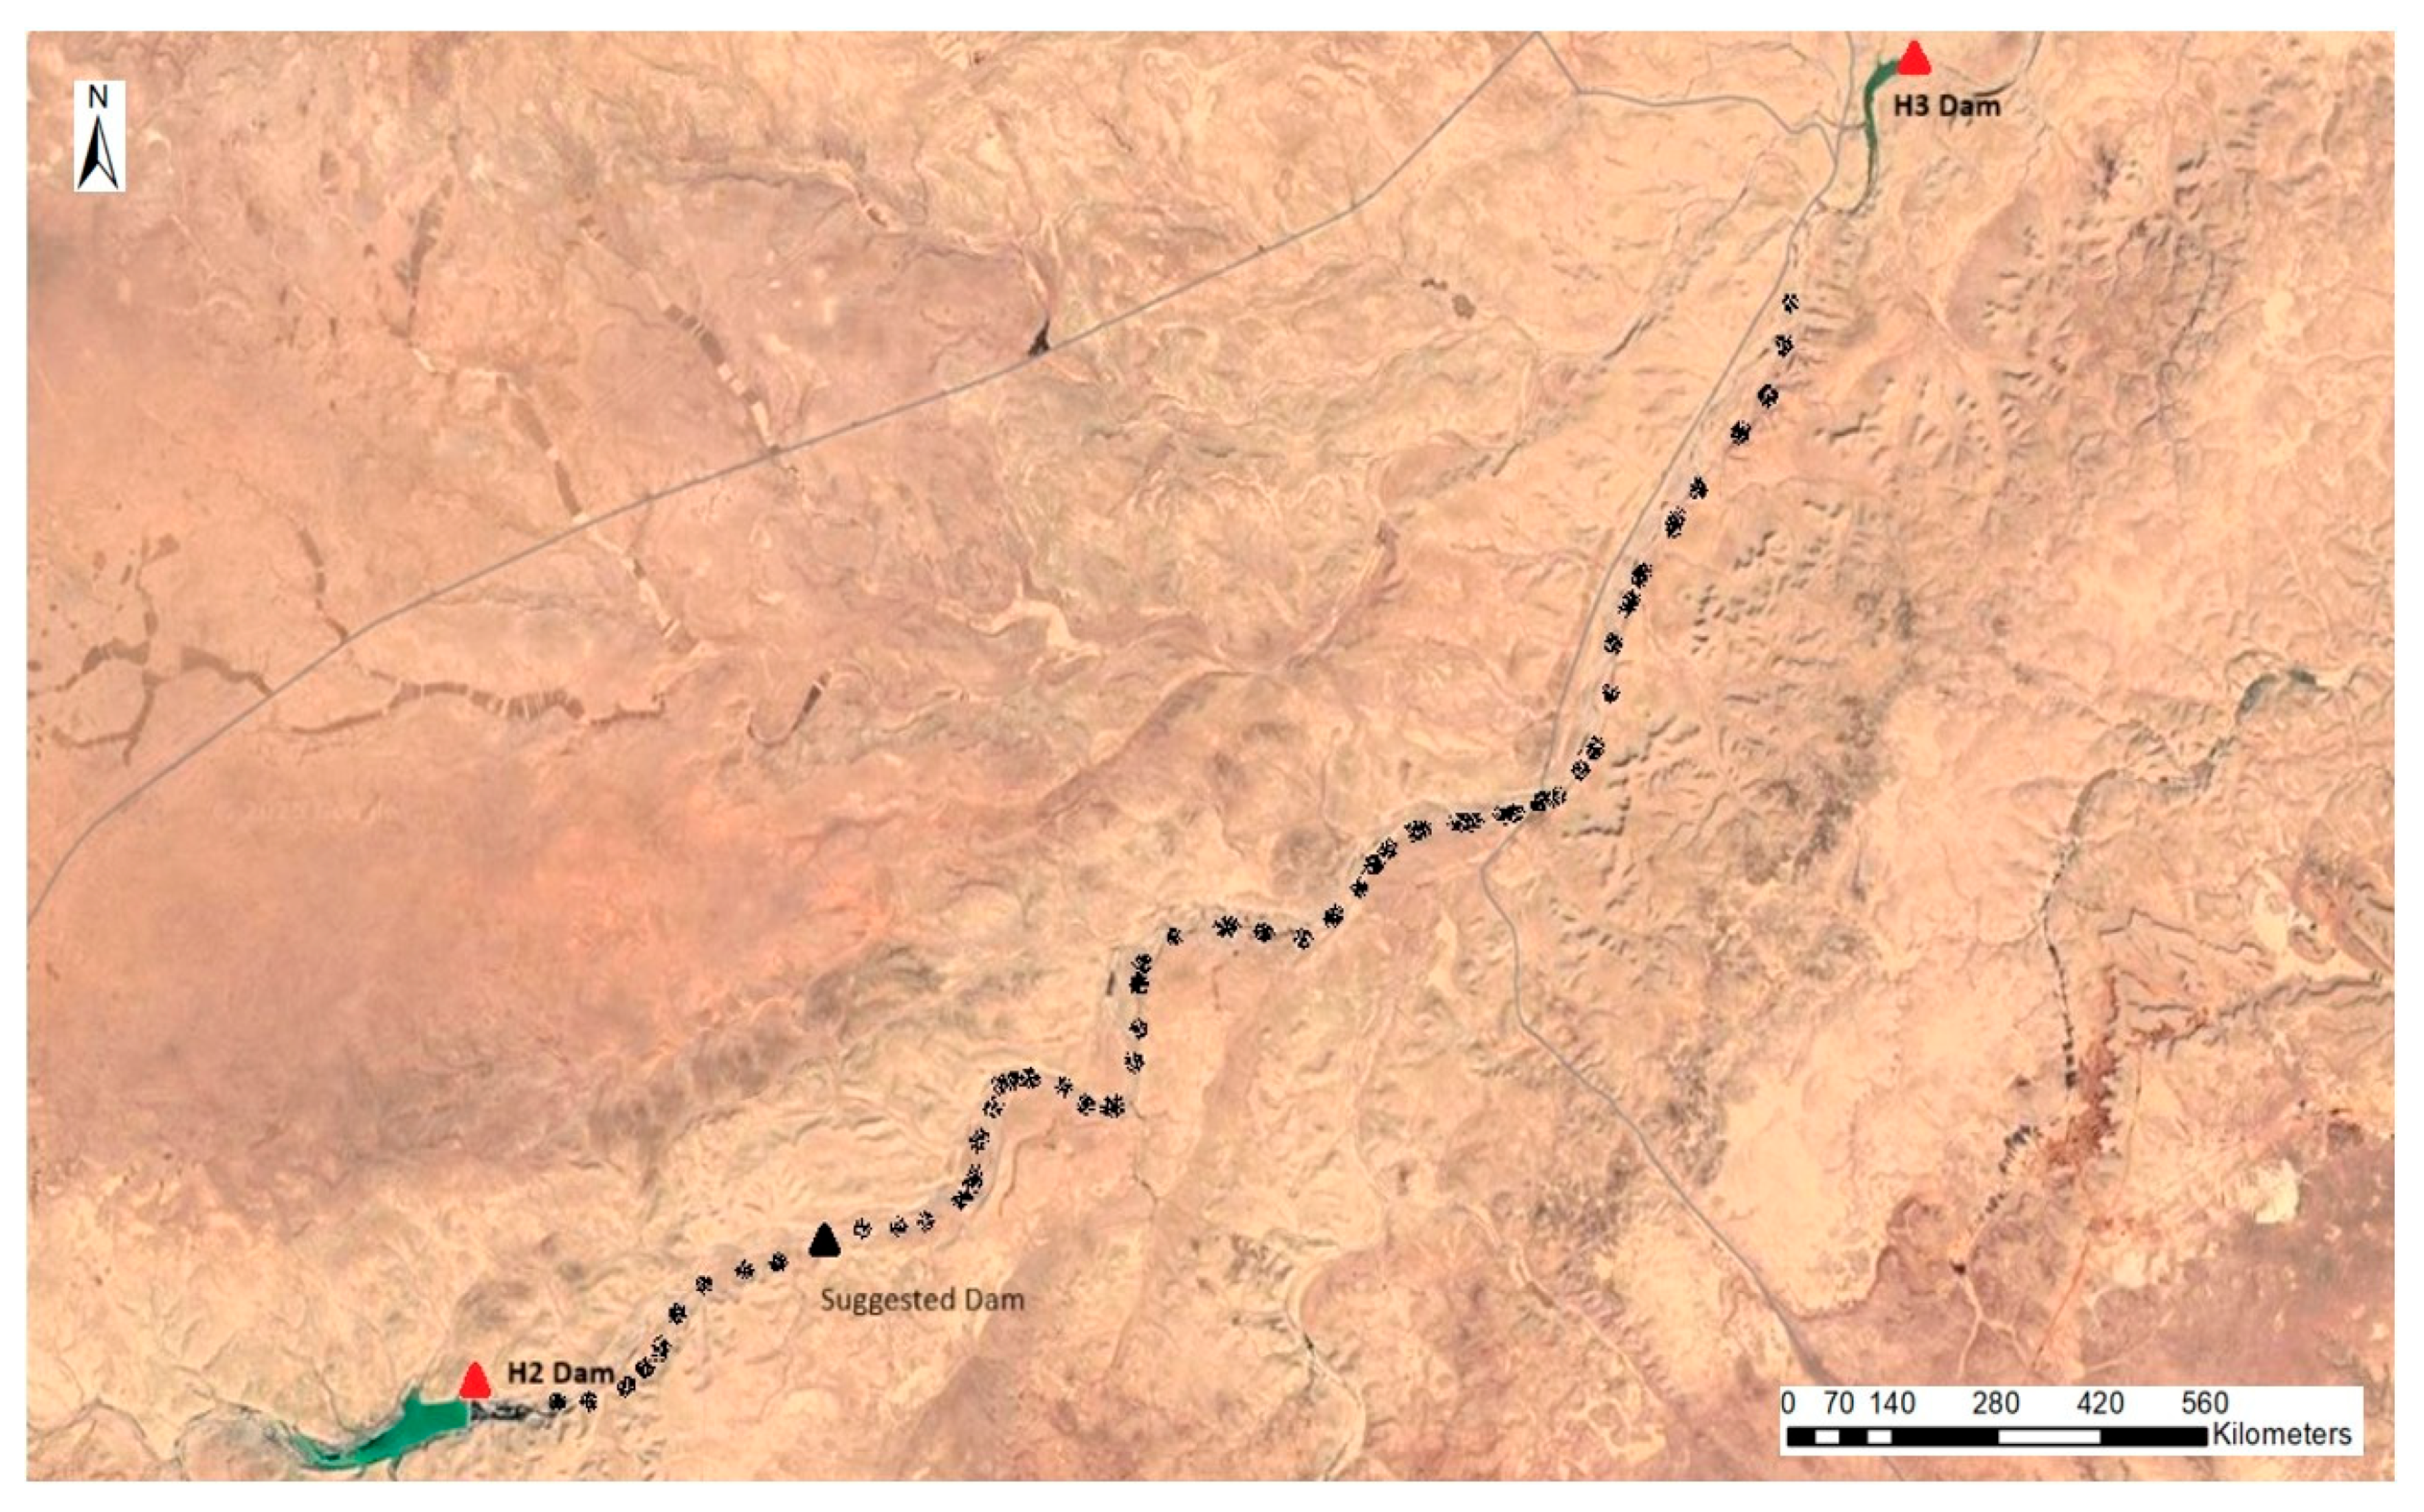
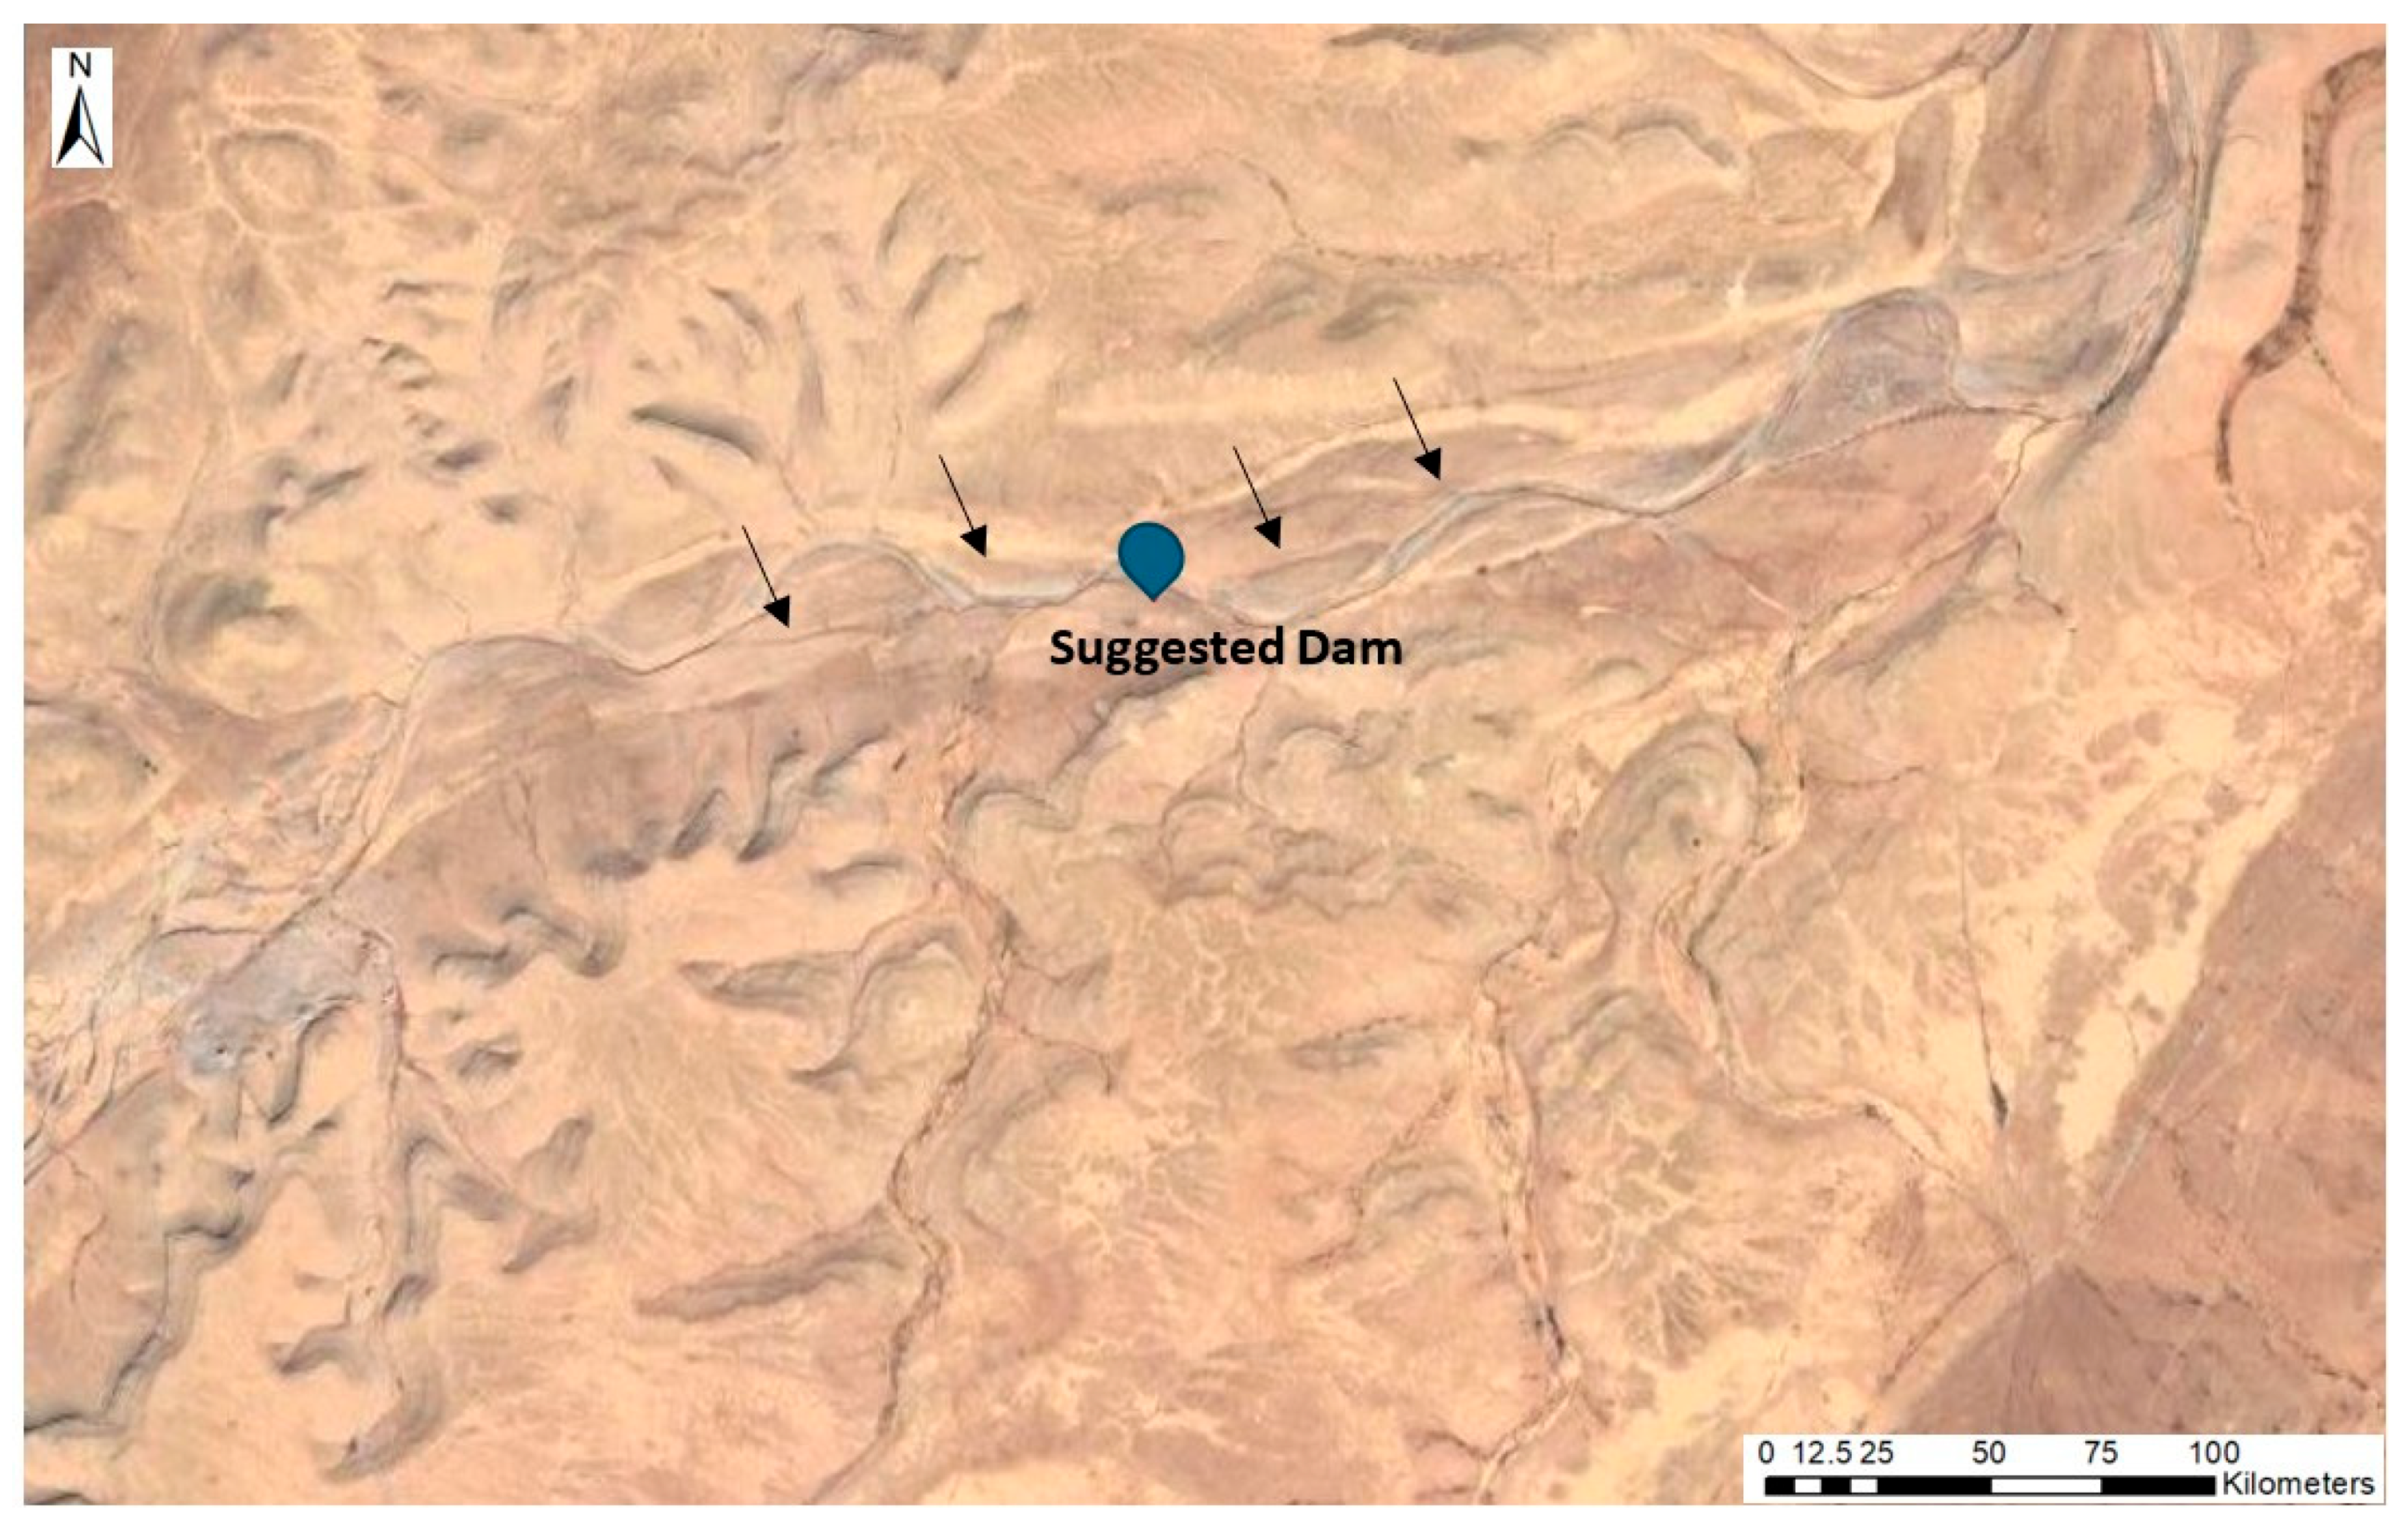
These findings are mostly in line with the ideas of climate adaptation and nature-based remedies. In dry areas, small-scale rainwater collecting systems help ecosystems adapt in a more decentralised fashion, much like urban green infrastructure makes cities safer and stronger against floods. This study indicates that incorporating nature-based solutions into dam retrofits, such as enhancing local recharge and using natural hydrological processes, may provide specific technical modifications that improve the local climate. Micro dams are becoming more and more essential to policy since they match the national commitments made under the Sustainable Development Goals (SDGs) and the global adaptation frameworks when they are considered as Nature-based Solutions (NbS). Elevating the height diminishes both construction costs and time for a new dam intended for water harvesting, as the expenditure for building an earth dam is projected to range from 6 to 13 billion Iraqi Dinars [10]. Horan/3, a new dam, has been proposed, about 40 km away from Horan/2, as seen in Figure 9. The volume of water discharged from Horan/2, exceeding its planned capacity throughout the rainy season, does not entirely reach the Horan/3 dam due to infiltration and storage depressions, as seen in Figure 10. The outflow water requires some days to arrive at Horan/3, with the arrival time contingent upon the volume of outflowing water [10]. Utilising the outflow water during arid seasons and conserving it for groundwater replenishment is essential to mitigate water losses.
The dimensions of Wadi Horan, along with its primary branches and tributaries, serve as an effective mechanism for groundwater recharge during periods of precipitation. The thickness of the contemporary sediments varies between 2 and 5 m within the valley course, while the gentle slope ranges from 1.72% to 2.34%. This configuration contributes to a reduction in surface runoff, enhances seepage, and facilitates groundwater recharge [24].
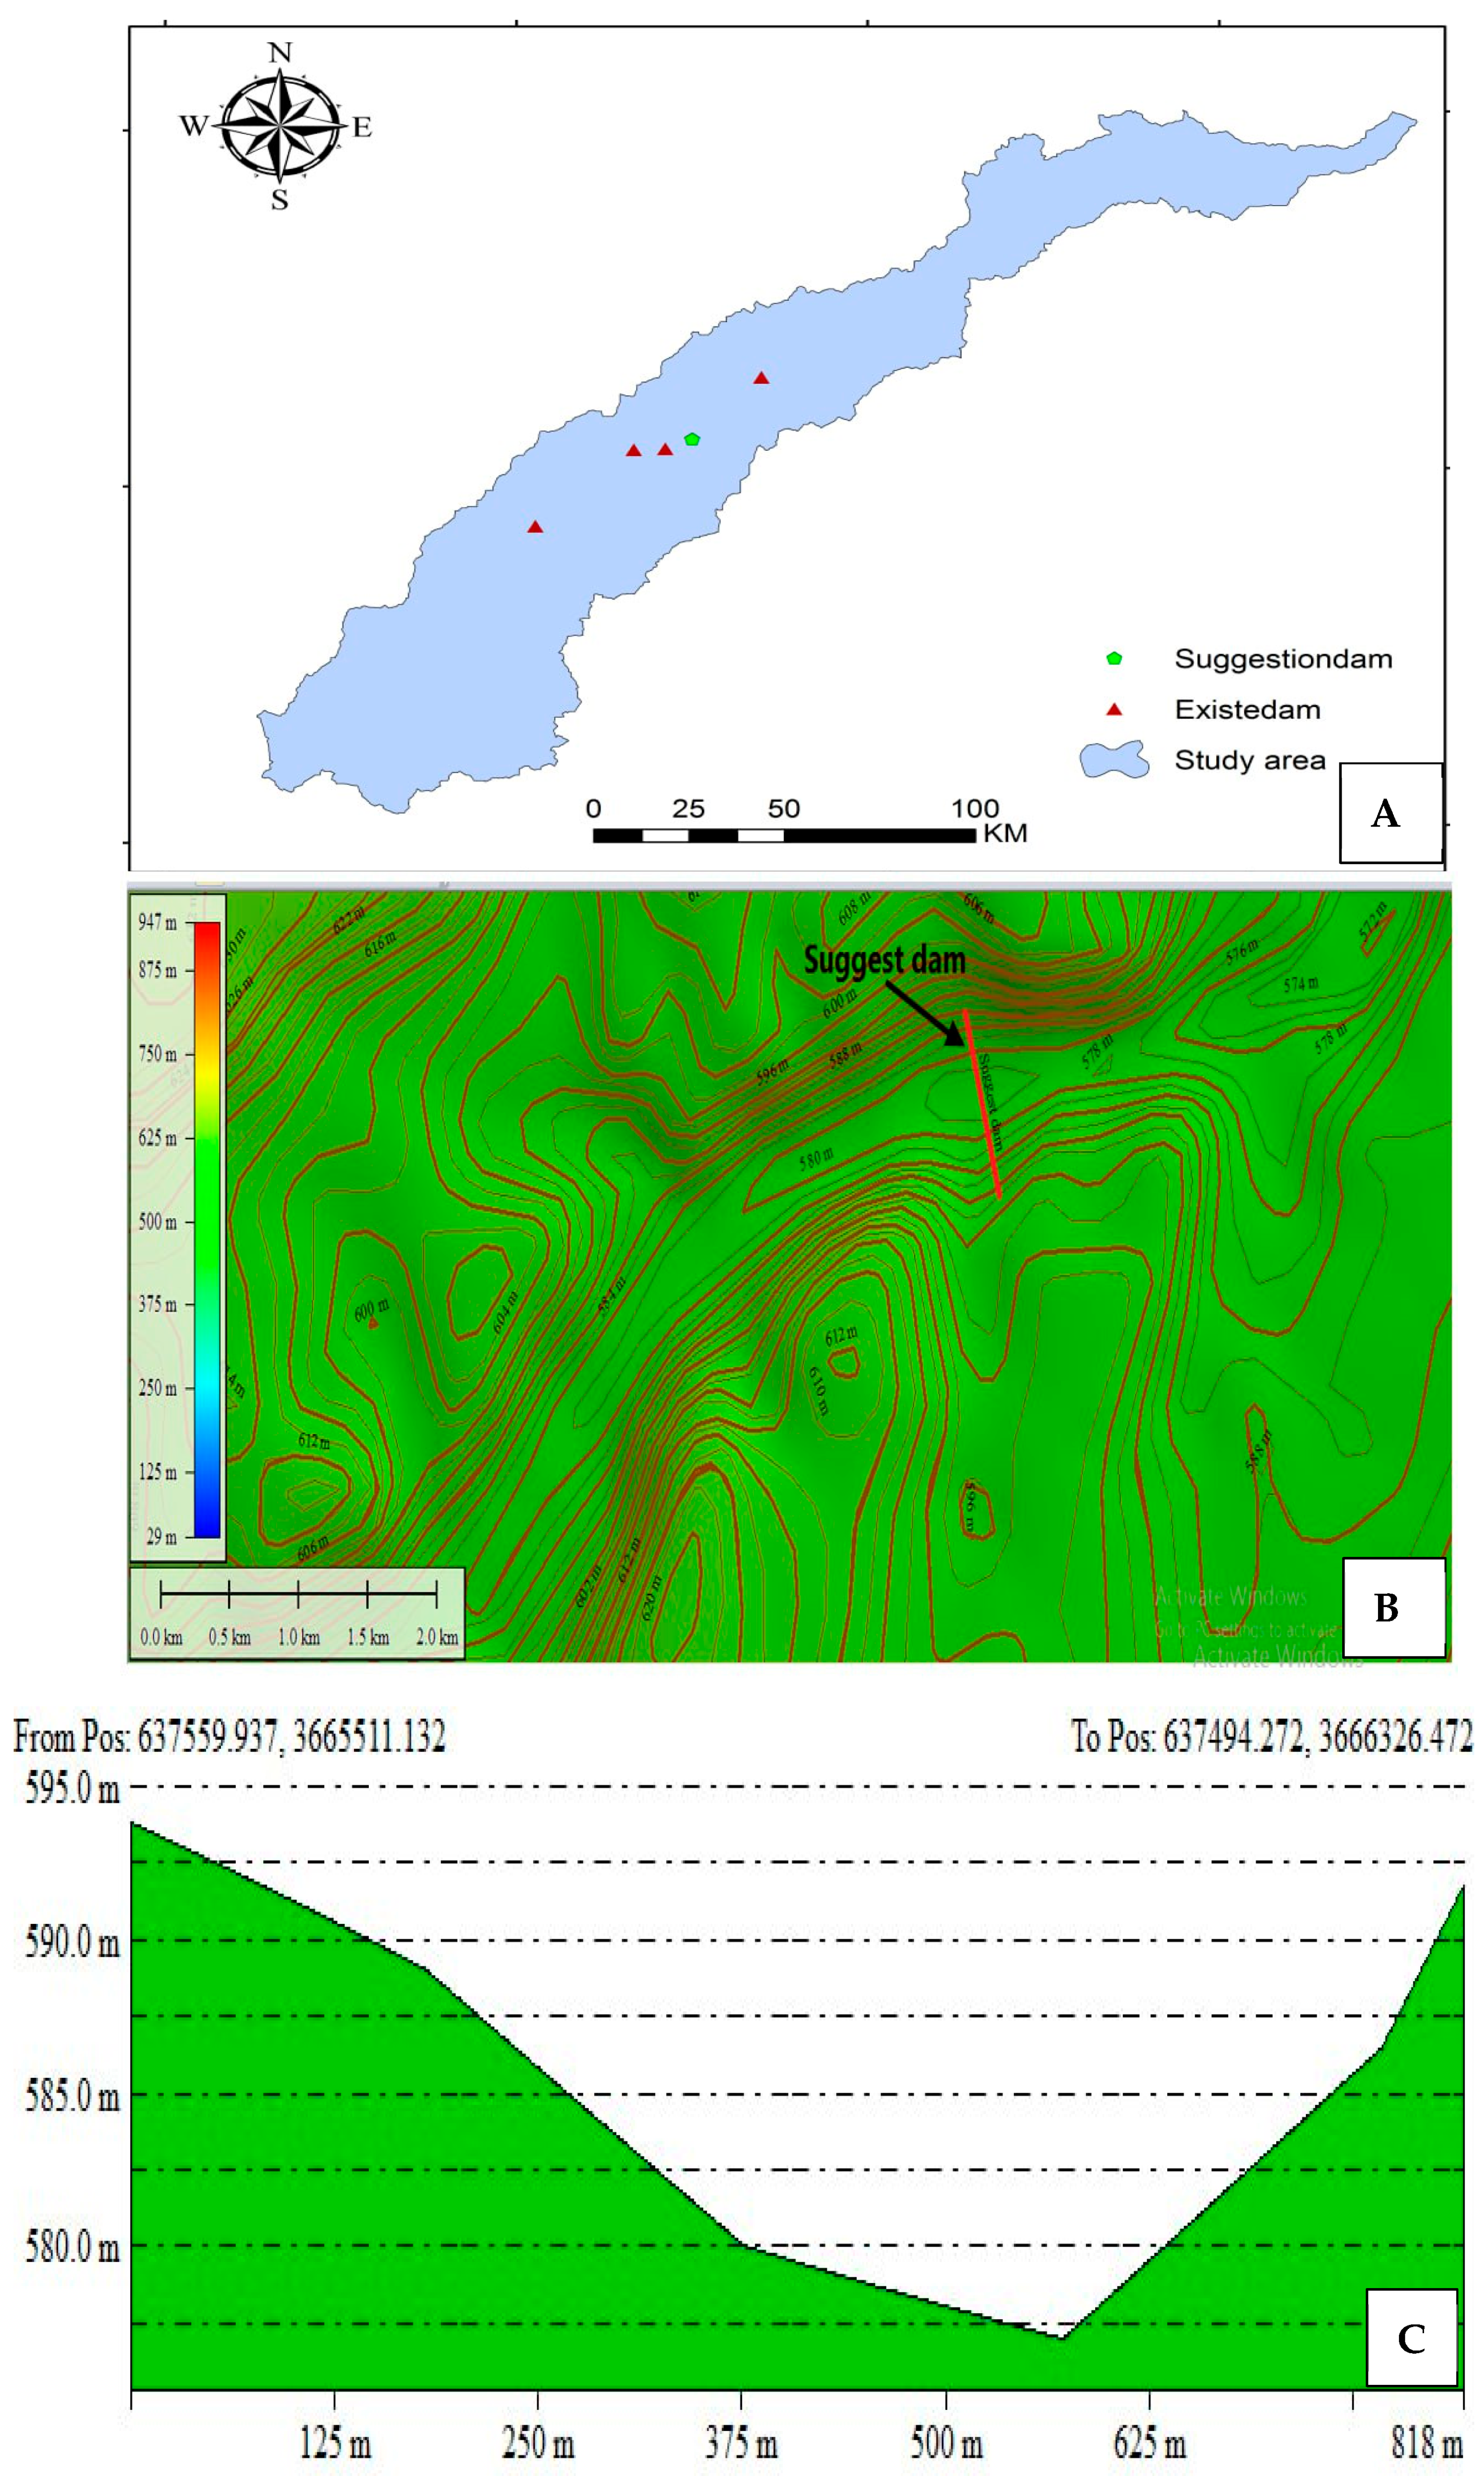
A dam was suggested to mitigate losses from spillway runoff, facilitate groundwater recharge, and alleviate water scarcity during the dry season, utilising ArcGIS 10.0 to determine the valley’s minimum width. Following the identification of the appropriate site for the planned dam situated downstream of the Horan/2 dam at coordinates (E 40°28′26.57″, N 33°07′22.98″) as seen in Figure 11.
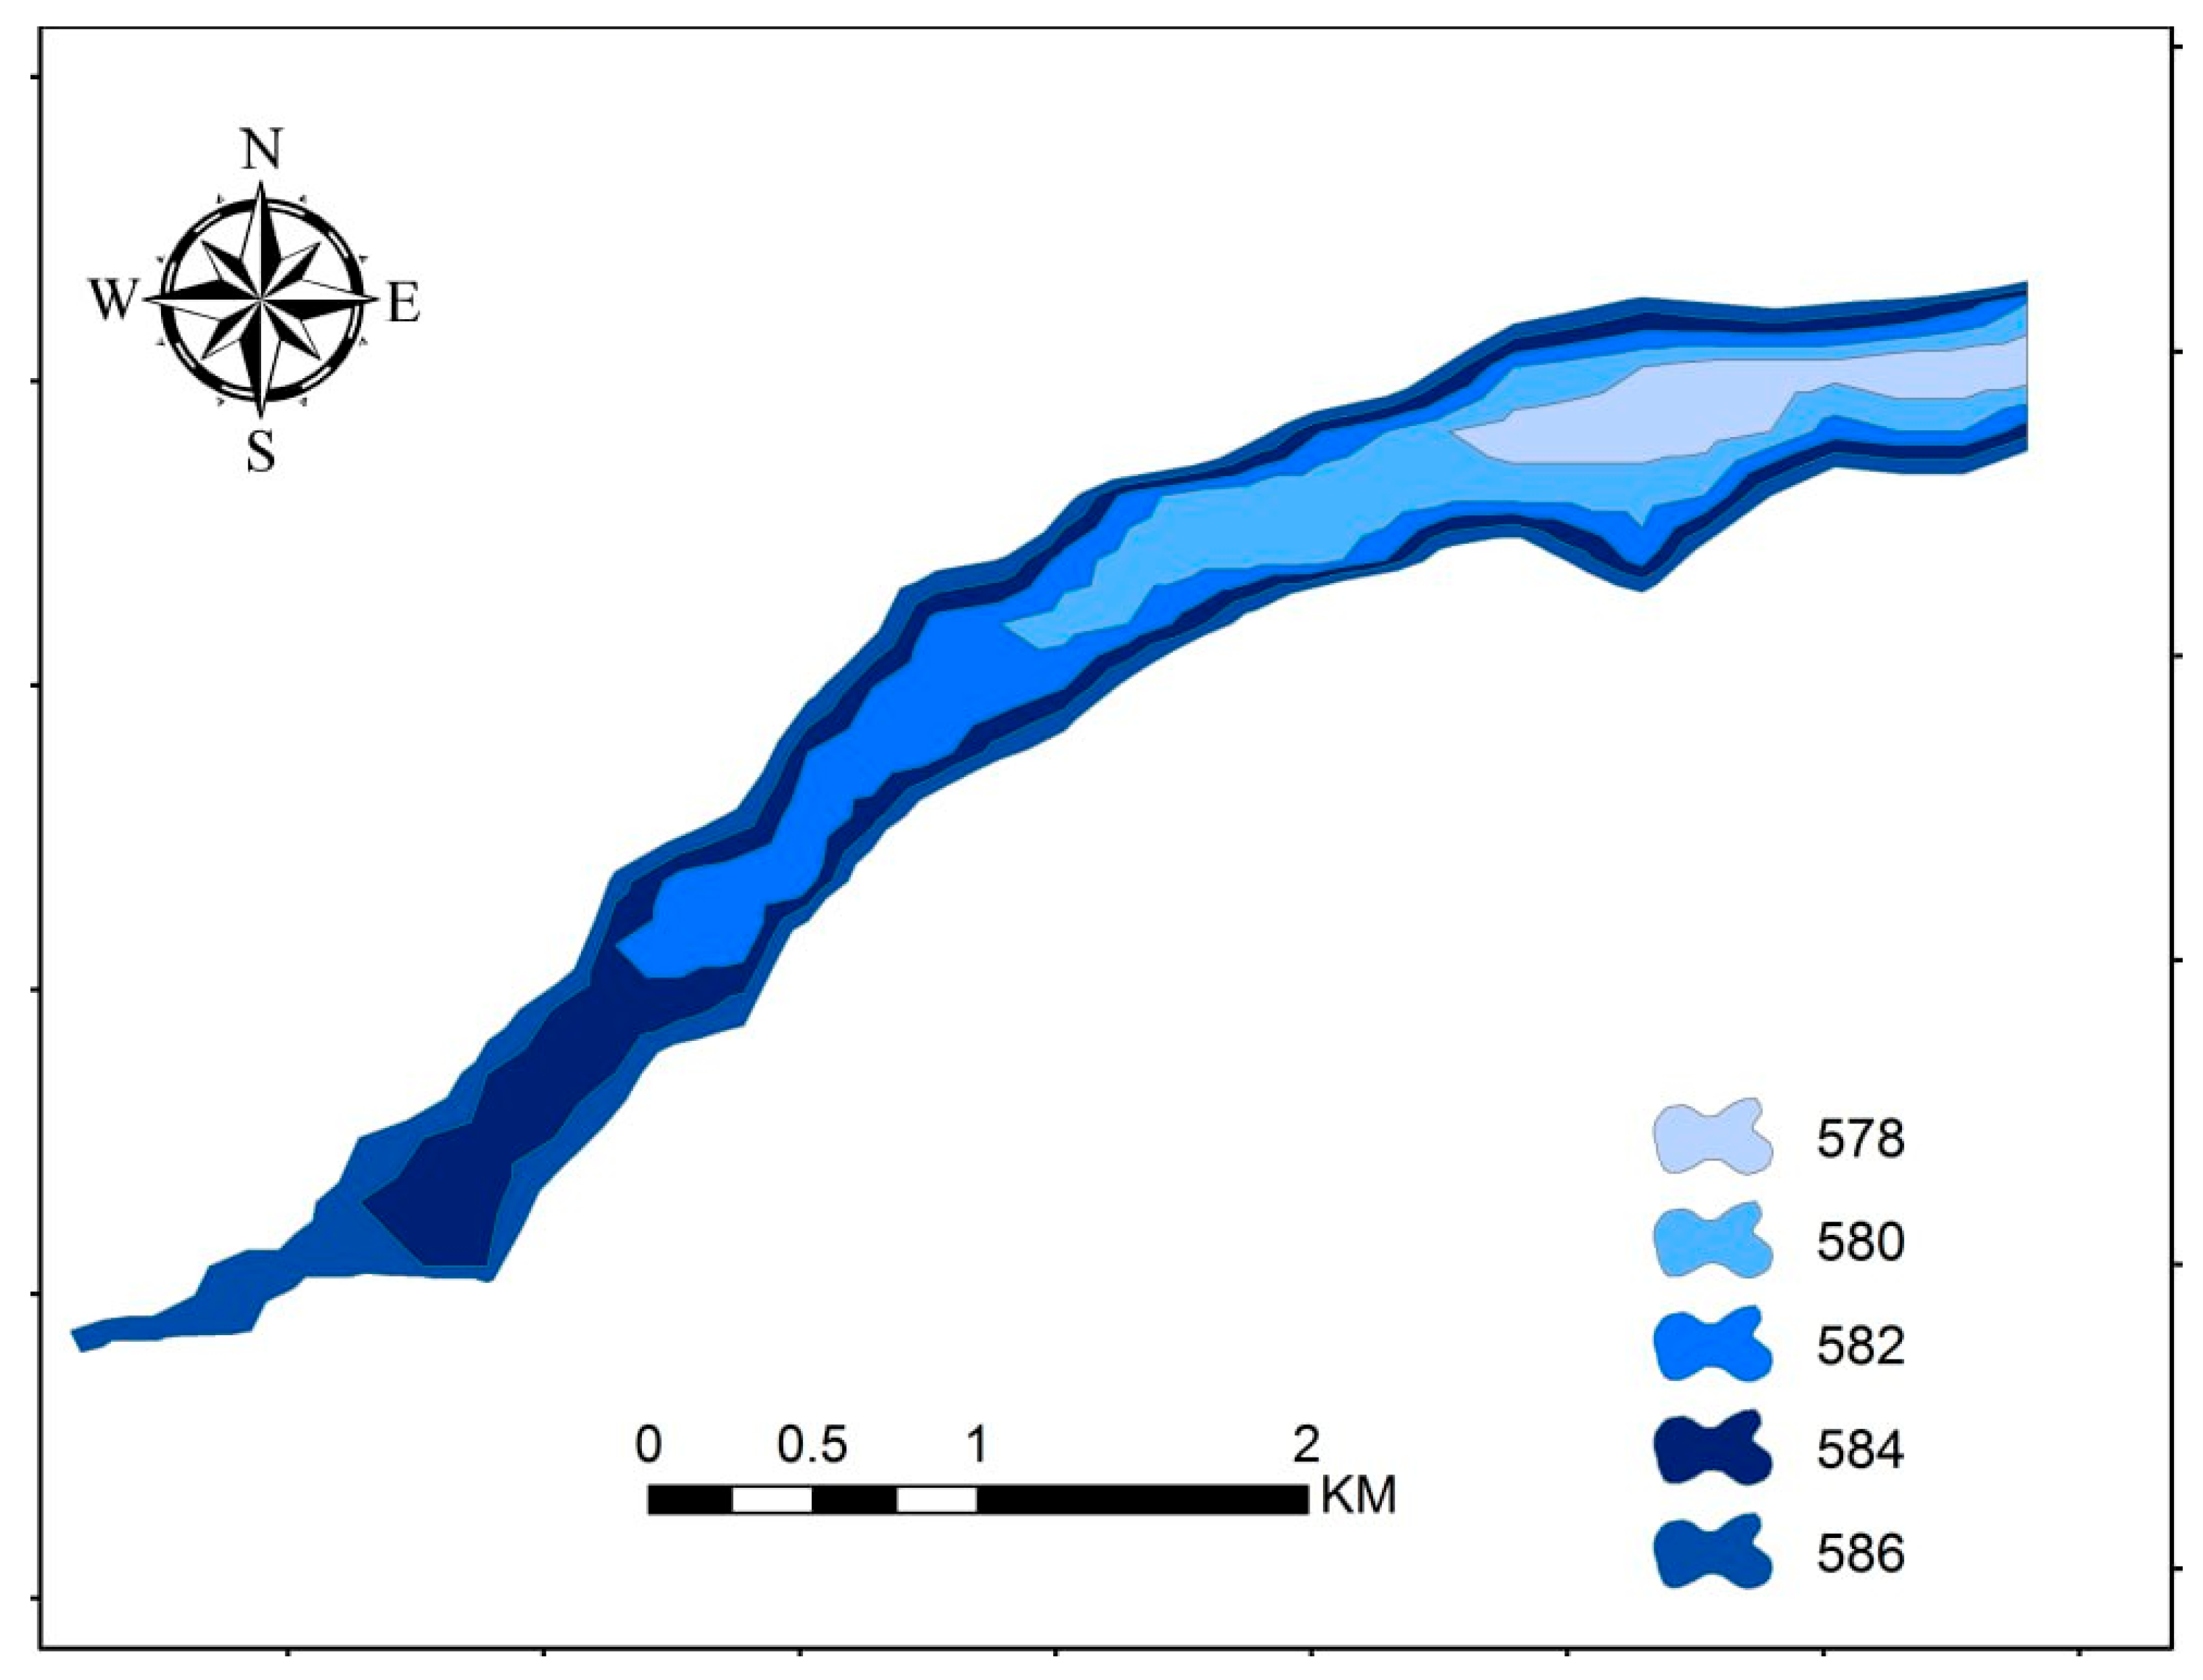
The Watershed Modelling System (WMS 10.1) programme was utilised to ascertain the watershed’s area, which amounted to 333 km3. The primary criterion for selecting a suitable site was to minimise the valley’s cross-section, given that its breadth extended to 888 m. The examination and assessment of the region upstream of the dam, following its completion and subsequent storage, are crucial for identifying possible threats to adjacent communities and understanding the magnitude of the economic and social repercussions stemming from floods. Figure 12 illustrates several strata corresponding to the levels of water at distinct depths for the dam’s location.
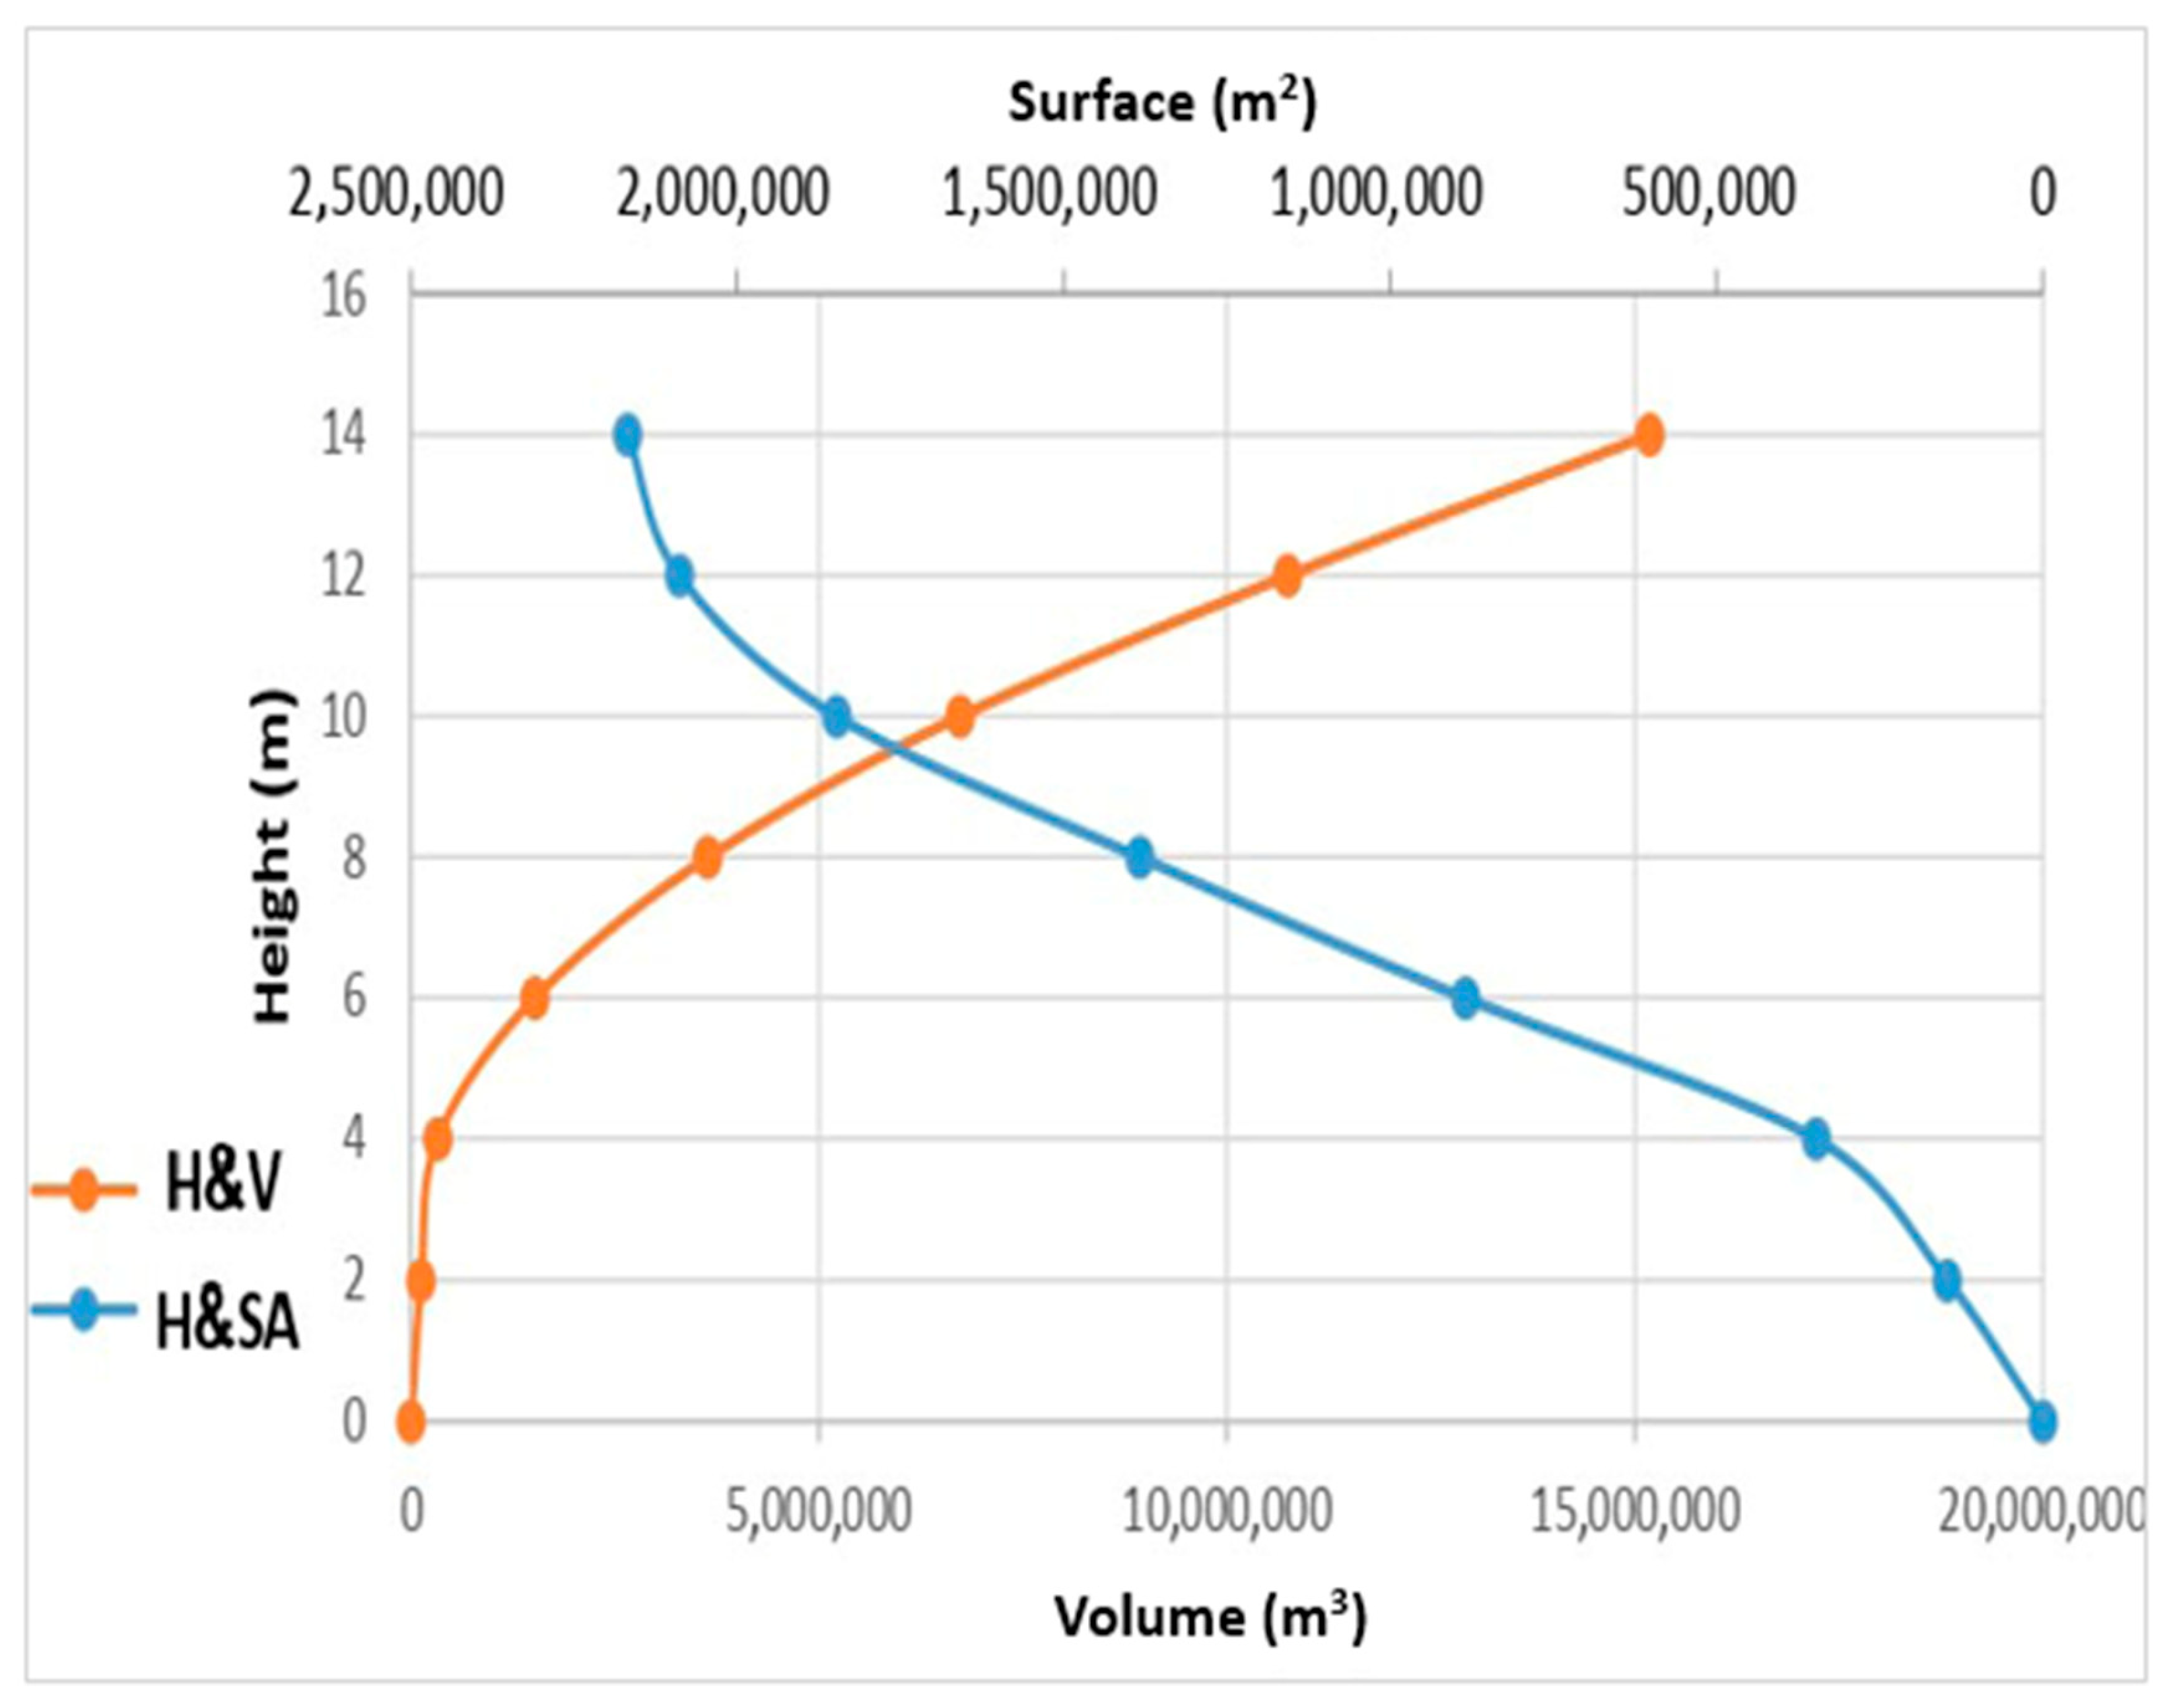
The construction of many dams in suitable sites to capture the mean yearly direct runoff in Wadi Horan could yield around 400 MCM [14], whereas the cumulative capacity of storage for the four existing dams in Wadi Horan is 46 MCM. The calculation of surface area and storage volume was performed utilising ArcGIS 10.0 software through the spatial analyst model, as illustrated in Figure 13. Figure 13 illustrates that the dam’s maximum storage height reaches 9.6 m, with a dam length of 1.755 km and a total storage capacity of 6 MCM.
Our models demonstrate that making simple improvements to the tops of spillways at small dams that are already there may dramatically boost storage capacity while lowering the risk of uncontrolled release. The findings corroborate previous research: minor modifications to the structure, informed by sub-catchment hydrology, may significantly enhance water availability in desert basins.
Figure 5, Figure 6, Figure 7 and Figure 8 demonstrate how much water comes in, overflows, and finally is lost. But the most important thing about Figure 5, Figure 6, Figure 7 and Figure 8 is what they suggest for how to manage resources. The fact that so much water is lost via spills and evaporation shows that the existing storage is not working well. This shows how important targeted retrofits are. The changes that are being suggested for the spillway will increase storage by 85 to 90%. This would help reduce flows that are not used and make water available during the dry season. The result has real-world effects on groundwater recharge, drought resistance, and the need for new dam projects that cost a lot of money. This will help Iraq utilise water more wisely in dry areas. The current results are model-based forecasts. The lack of ongoing gauging and reservoir monitoring data hindered direct verification. However, for the Al-Rutba and Western Desert wadis, the modelled runoff depths are consistent with the documented flood occurrences. Kamel [11] and Sissakian [14] have also published comparable runoff estimates. Still, there are issues with determining the CN value, estimating evaporation loss, and determining how rainfall varies. To improve the reliability of scenario testing for management and policy applications, future work should use instrumental monitoring at existing dams to calibrate and validate WHCatch results.

5. Conclusions

Examining significant hydrological factors and forecasting reservoir behaviour, particularly with regard to water management, are the objectives. The parameters of the water-balance equation for sub-catchments were established and evaluated in a variety of scenarios and time periods using the water harvesting model (WHCatch model). The study shows how the WHCatch model helped us learn more about hydrological processes in regions where there is not much data, while also accurately measuring the water balance components at the sub-catchment level with very little input data. The results also revealed that changing the spillway heights by 2 m made RWH work much better. For the Horan/2 dam, the storage capacity went up by 90% and the construction expenses and water outflow went down. For the Horan/3 dam, the storage capacity went up by 85%. The study also found that building a number of small dams and using GIS methods to find the optimal places to put them might catch about 400 million cubic metres (MCM) of runoff per year. This amount would be a lot more than the 46 MCM that Wadi Horan can already hold.
In the end, this method is a cheap way for dry areas to make water last longer. It helps with home and farm needs by making rainwater harvesting (RWH) systems better. The results support the promotion of sustainable development objectives in dry locations; including small-dam retrofits into provincial water programmes may provide immediate resilience at a relatively modest cost.
For practice, we suggest (1) prioritising retrofits at locations where modelled inflows consistently surpass existing capacity, (2) implementing seasonal operating protocols that preserve post-storm volumes for drought mitigation, and (3) combining storage enhancements with managed aquifer recharge where valley topography allows.

Author Contributions

Conceptualization, A.A. and R.A.; methodology, A.A.; software, A.A. and R.A.; validation, A.A. and H.S.; formal analysis, A.A. and H.S.; investigation, A.A. and R.A.; resources, A.A. and C.R.; data curation, R.A.; writing—original draft preparation, A.A. and R.A.; writing—review and editing, C.R.; visualisation, A.A. and H.S.; supervision, C.R.; project administration, C.R. and A.A. All authors have read and agreed to the published version of the manuscript.

Funding

This research received no external funding.

Data Availability Statement

The original contributions presented in this study are included in the article. Further inquiries can be directed to the corresponding author.

Conflicts of Interest

The authors declare no conflicts of interest.

References

  1. Ammar, A.; Riksen, M.; Ouessar, M.; Ritsema, C. Identification of suitable sites for rainwater harvesting structures in arid and semi-arid regions: A review. Int. Soil Water Conserv. Res. 2016, 4, 108–120. [Google Scholar] [CrossRef]
  2. Gutpa, K.K.; Deelstra, J.; Sharma, K.D. Estimation of water harvesting potential for a semiarid area using GIS and remote sensing. In Proceedings of the Rabat Symposium S3 (April 1997) “Remote Sensing and Geographic Information Systems for Design and Operation of Water Resources Systems, Rabat, Morocco, 23 April–3 May 1997; Volume 242. [Google Scholar]
  3. Toebes, C.; Ouryvaev, V. Representative and Experimental Basins, an International Guide for Research and Practice; UNESCO: Paris, France, 1970; p. 348. [Google Scholar]
  4. Dubreuil, P.; Chaperon, P.; Guiscafré, J.; Herbaud, J. Recueil des Données de Base des Bassins Représentatifs et Expérimentaux; Office de la Recherche Sceintifique et Technique Outre-Mer: Paris, France, 1972. [Google Scholar]
  5. Dengler, J.; Jansen, F.; Chusova, O.; Hüllbusch, E.; Nobis, M.P.; Van Meerbeek, K.; Axmanová, I.; Bruun, H.H.; Chytrý, M.; Guarino, R.; et al. Ecological Indicator Values for Europe (EIVE) 1.0. Veg. Classif. Surv. 2023, 4, 7–29. [Google Scholar] [CrossRef]
  6. Adham, A.; Riksen, M.; Abed, R.; Shadeed, S.; Ritsema, C. Assessing suitable techniques for rainwater harvesting using analytical hierarchy process (AHP) methods and GIS techniques. Water 2022, 14, 2110. [Google Scholar] [CrossRef]
  7. Jothiprakash, V.; Sathe, M.V. Evaluation of rainwater harvesting methods and structures using analytical hierarchy process for a large-scale industrial area. J. Water Resour. Prot. 2009, 1, 427–4388. [Google Scholar] [CrossRef]
  8. Ouessar, M.; Bruggeman, A.; Mohtar, R.; Ouerchefani, D.; Abdelli, F.; Boufelgha, M. Future of drylands—An overview of evaluation and Impact Assessment Tools for water harvesting. In The Future of Drylands; Lee, C., Schaaf, T., Eds.; Springer: Berlin, Germany, 2009; pp. 255–267. [Google Scholar]
  9. Al-Adamat, R. GIS as a decision support system for siting water harvesting ponds in the Basalt Aquifer/NE Jordan. J. Environ. Assess. Policy Manag. 2008, 10, 189–206. [Google Scholar] [CrossRef]
  10. Ministry of Water Resources State Commission for Dams and Reservoirs. Design Report of Dam (2020); (H/2, H/3, Apila); Al Furat Center for Studies and Designs of Irrigation Projects: Baghdad, Iraq, 2020; Volume 1, unpublished data. [Google Scholar]
  11. Abdullah, O.S.; Kamel, A.H.; Khalil, W.H.; Al-damook, A. Estimation of Hydropower Harvesting from the Hydraulic Structures on Rivers: Ramadi Barrage, Iraq as a Case Study. Iraqi J. Civ. Eng. 2020, 14, 37–43. [Google Scholar]
  12. Adham, A.; Abed, R.; Mahdi, K.; Hassan, W.H.; Riksen, M.; Ritsema, C. Rainwater catchment system reliability analysis for Al Abila Dam in Iraq’s western desert. Water 2023, 15, 944. [Google Scholar] [CrossRef]
  13. Jassim, S.Z.; Goff, J.C. Geology of Iraq; Dolin, Prague and Morravian Museum: Brno, Czech Republic, 2006. [Google Scholar]
  14. Sissakian, V.; Ahad, A.A.; Al-Ansari, N.; Knutsson, S. Geology of wadi hauran, the largest valley in iraqi western desert. J. Earth Sci. Geo. Eng. 2017, 7, 103–132. [Google Scholar]
  15. Adham, A.; Sayl, K.N.; Abed, R.; Abdeladhim, M.A.; Wesseling, J.G.; Riksen, M.; Fleskens, L.; Karim, U.; Ritsema, C.J. A GIS-based approach for identifying potential sites for harvesting rainwater in the Western Desert of Iraq. Int. Soil Water Conserv. Res. 2018, 6, 297–304. [Google Scholar] [CrossRef]
  16. Chow, V.T.; Maidment, D.R.; Mays, L.W. Applied Hydrology; McGraw-Hill Book Company: New York, NY, USA, 1988; pp. 99–147. [Google Scholar]
  17. Yuan, Y.; Mitchell, J.K.; Hirschi, M.C.; Cooke, R.A. Modified SCS curve number method for predicting subsurface drainage flow. Trans. ASAE 2001, 44, 1673. [Google Scholar] [CrossRef]
  18. Krois, J.; Schulte, A. GIS-based multi-criteria evaluation to identify potential sites for soil and water conservation techniques in the Ronquillo watershed, northern Peru. Appl. Geogr. 2014, 51, 131–142. [Google Scholar] [CrossRef]
  19. Sayl, K.N.; AL-Ani, A.; Oliwi, S. Hydrologic Study for Iraqi Western Desert to Assessment of Water Harvesting Projects. Iraqi J. Civ. Eng. 2012, 7. [Google Scholar] [CrossRef]
  20. Boers, T.M.; Zondervan, K.; Ben-Asher, J. Micro-catchment-water-harvesting (MCWH) for arid zone development. Agric. Water Manag. 1986, 12, 21–39. [Google Scholar] [CrossRef]
  21. Eaton, E.D. Control of Evaporation Losses; United States Government Printing Office: Washington, DC, USA, 1958. [Google Scholar]
  22. Hussein, A.H. Study the Effect of Evaporation on Water Quality to the Iraq Reservoirs; Al_Musaib Institute Technique: Al_Musaib, Iraq, 2017; pp. 1–14. [Google Scholar]
  23. Dawood, K.A.; Rashid, F.L.; Hashim, A. Reduced evaporation losses from water reservoirs. Int. J. Energy Env. Res. 2013, 1, 23–29. [Google Scholar]
  24. Gregory, J.H.; Dukes, M.D.; Miller, G.L.; Jones, P.H. Analysis of double-ring infiltration techniques and development of a simple automatic water delivery system. Appl. Turfgrass Sci. 2005, 2, 1–7. [Google Scholar] [CrossRef]
  25. Federal Board of Supreme Audit. A Detailed Report on the Work of Monitoring and Specialized Auditing on the Policy of the Ministry of Water Resources in Implementing Dams and Reservoirs Projects for the Period From (2014–2017); Federal Board of Supreme Audit: Baghdad, Iraq, 2017. [Google Scholar]
  26. Adham, A.; Seeyan, S.; Abed, R.; Mahdi, K.; Riksen, M.; Ritsema, C. Sustainability of the Al-Abila Dam in the western desert of Iraq. Water 2022, 14, 586. [Google Scholar] [CrossRef]
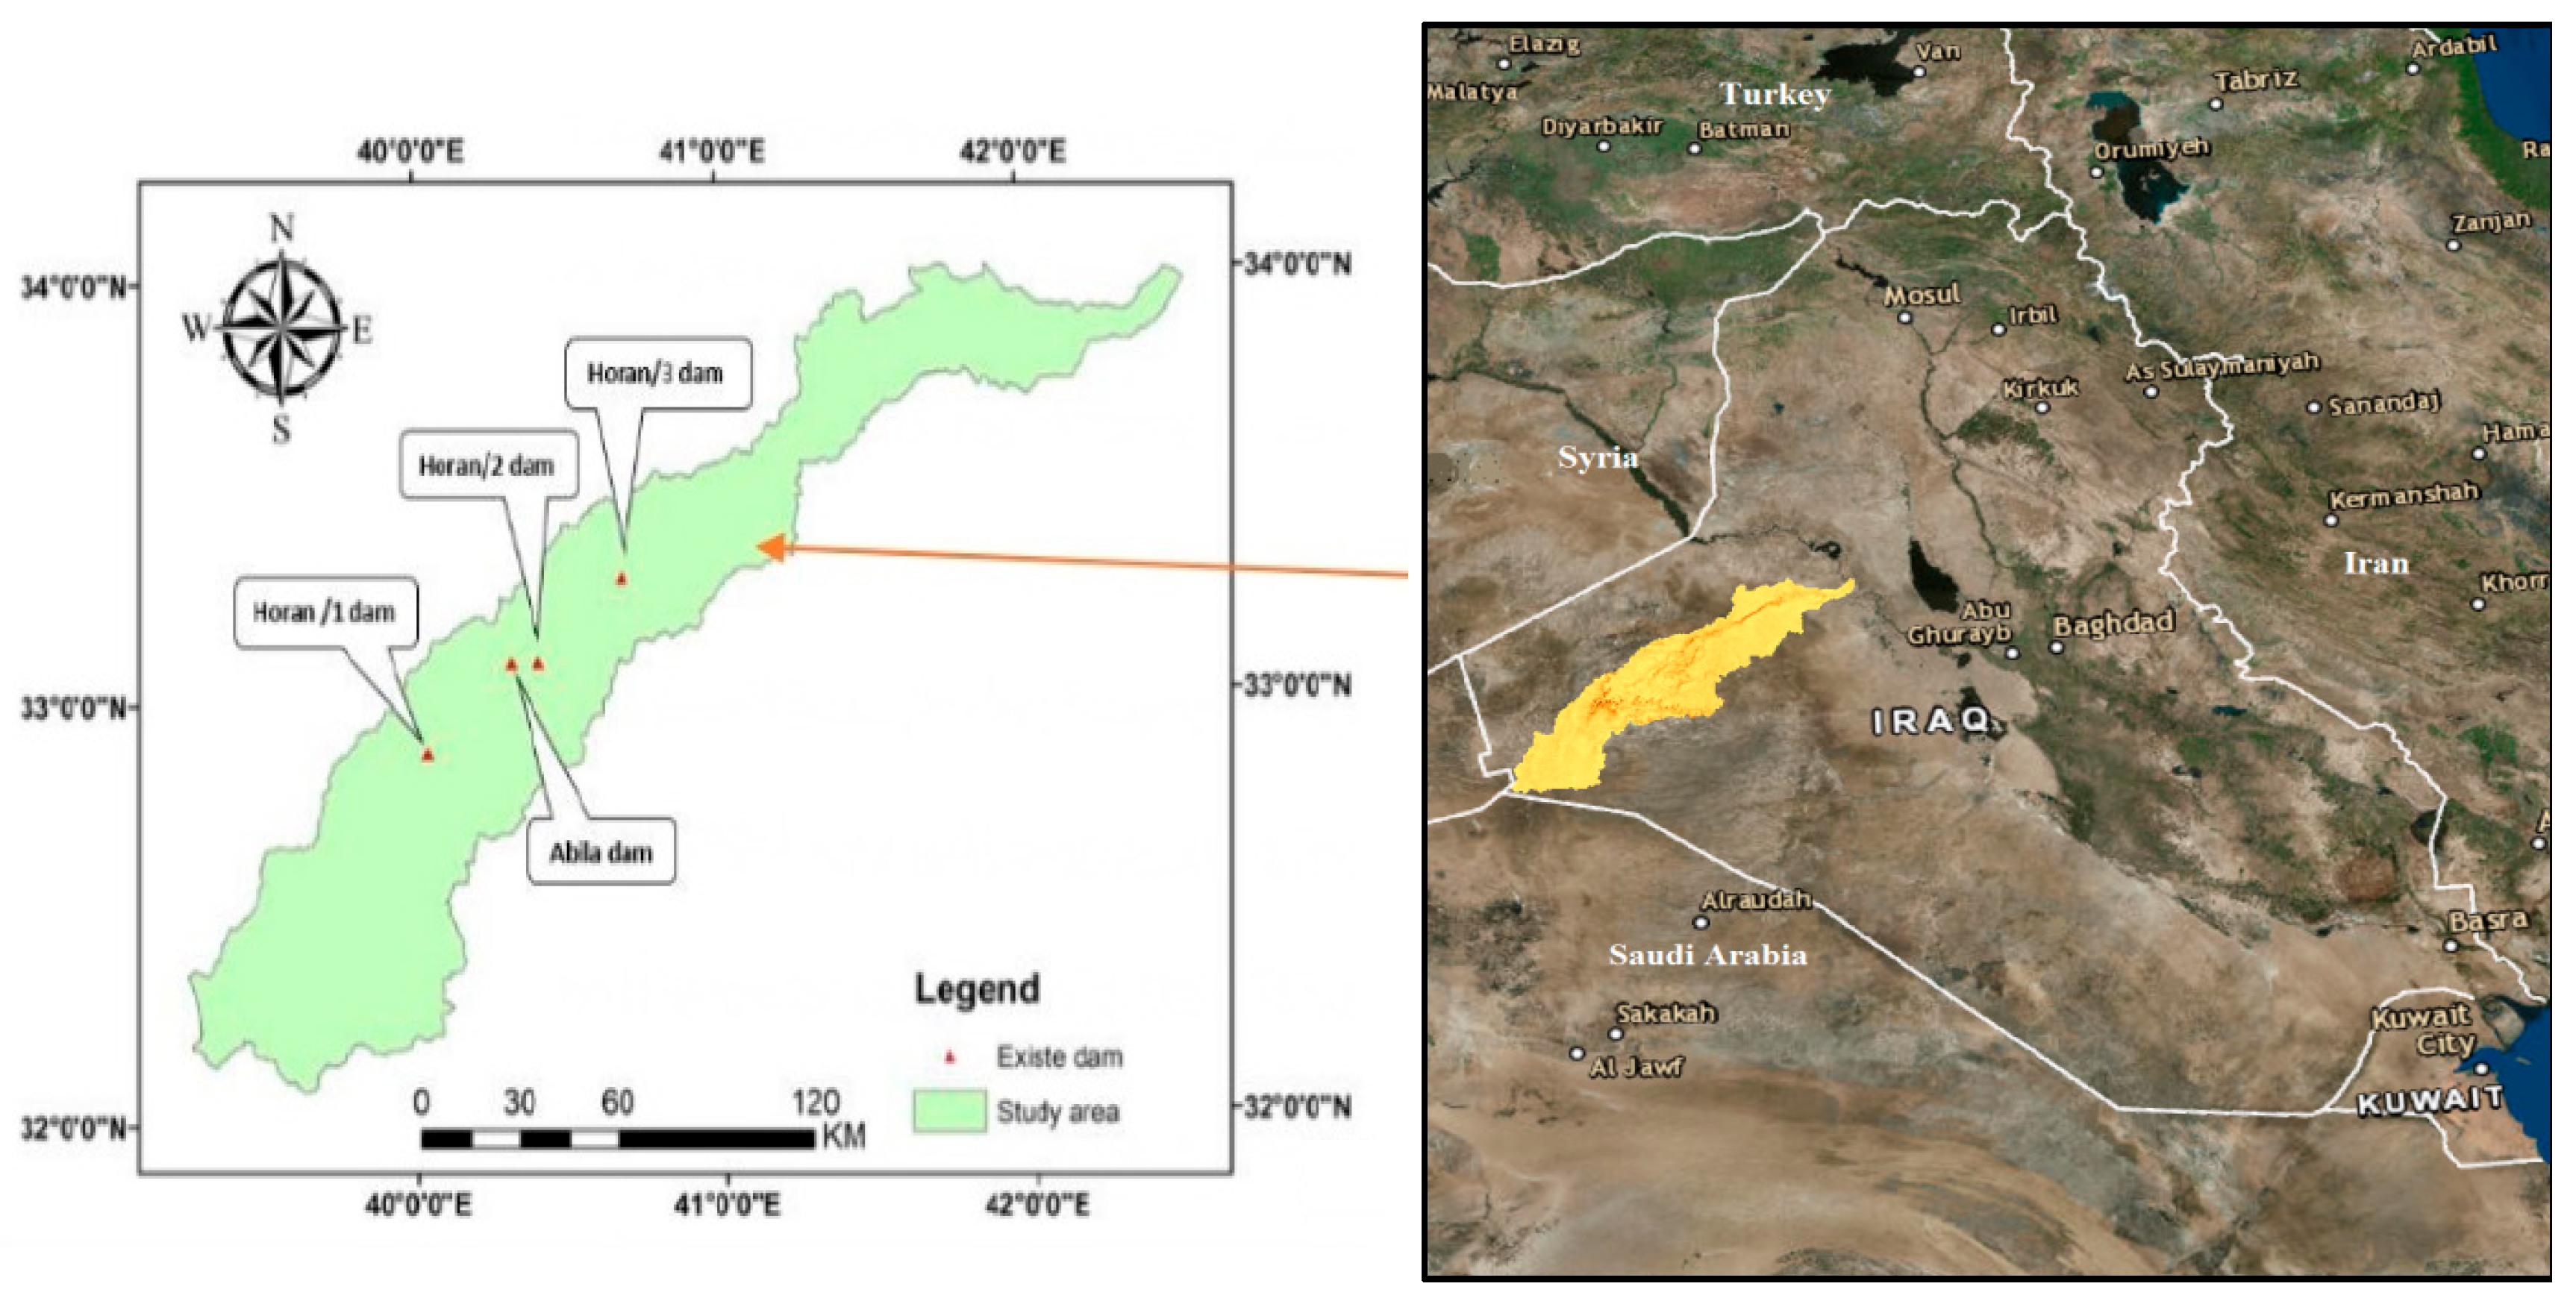
Figure 1. The Iraqi Western Desert and Wadi Horan locations.
Resources 14 00150 g001
Figure 2. Changes in the amount of rain that falls each year in the study area at Rutba Station.
Resources 14 00150 g002
Figure 3. Wadi Horan Land Use/Land Cover Map (a), Hydrological Soil Group Map (b), and Curve Number Map (c).
Resources 14 00150 g003
Figure 4. Runoff depth across the years.
Resources 14 00150 g004
Figure 5. Total runoff and outflow over spillway in Horan/2 Dam.
Resources 14 00150 g005
Figure 6. Total runoff, losses in storage, and change in storage in Horan/2 Dam.
Resources 14 00150 g006
Figure 7. Total runoff and outflow over spillway in Horan/3 Dam.
Resources 14 00150 g007
Figure 8. Total runoff, losses in storage, and change in storage in Horan/3 Dam.
Resources 14 00150 g008
Figure 9. The location of the proposed dam in Wadi Horan and the distance between dams H2 and H3 are displayed in the Google Earth picture.
Resources 14 00150 g009
Figure 10. Wadi Horan’s storage depressions (black arrows) are visible in this Google Earth view.
Resources 14 00150 g010
Figure 11. Geomorphic Features of the Proposed Location Information: (A) the proposed dam’s location; (B) the proposed dam’s topographic map; and (C) the Wadi cross-section for the dam location.
Resources 14 00150 g011
Figure 12. Water levels for the proposed dam at various depths.
Resources 14 00150 g012
Figure 13. Area volume elevation curve for the suggested dam.
Resources 14 00150 g013
Table 1. The dams’ characteristics and coordinates [10].
No.DamsDam CoordinatesDate of ConstructionStorage Capacity
(M m3)
Dam Length (m)Dam Height (m)
1Horan/2E 40°24′19.62″
N 33° 5′51.90″
2007450015
2Horan/3E 40°40′45.94″
N 33° 17′ 44.91″
20035.344815
Table 2. Maximum daily rainfall depth in Rutba Station.
Year Max. Depth of Daily Rainfall (mm)Year Max. Depth of Daily Rainfall (mm)Year Max. Depth of Daily Rainfall (mm)
199024.620006.9201025
19914.420015.8201126.4
199215.520027.4201243
19932420033.4201326
199441.920042.5201419
19957.2200515.220154
19968.8200618.220165
19979.7200710.920176
199810.5200817.3201843
19993.220097201922
Table 3. Types of Land Use and Cover.
LU/LCArea (km2)% Of Total Area
Bare Soil 10,068.877
Built-up area326.92.5
Water bodies418.43.2
Grass and Farm Land 2262.217.3
Total area13,076.4100
Table 4. Watershed parameters for the whole study area.
No.Dam’s NameWatershed Area km2Max. Surface Area of Storage (km2)CNS
1Horan/2 dam73501.88476.4778.156
2Horan/3 dam82772.22676.4778.156
Disclaimer/Publisher’s Note: The statements, opinions and data contained in all publications are solely those of the individual author(s) and contributor(s) and not of MDPI and/or the editor(s). MDPI and/or the editor(s) disclaim responsibility for any injury to people or property resulting from any ideas, methods, instructions or products referred to in the content.