Article

Aboveground Biomass and Carbon Storage in Mangrove Forests in Southeastern Mexico

by
Carlos Roberto Ávila-Acosta
1,
Marivel Domínguez-Domínguez
2,*,
César Jesús Vázquez-Navarrete
2,
Rocío Guadalupe Acosta-Pech
3 and
Pablo Martínez-Zurimendi
4,5
1
Colegio de Postgraduados, Campus Tabasco, Programa de Doctorado de Ciencias Agrícolas en el Trópico, H. Cárdenas CP 86500, Tabasco, Mexico
2
Colegio de Postgraduados, Campus Tabasco, Área Ambiente, H. Cárdenas CP 86500, Tabasco, Mexico
3
Colegio de Postgraduados, Campus Tabasco, Área Agricultura, H. Cárdenas CP 86500, Tabasco, Mexico
4
El Colegio de la Frontera Sur, Departamento de Agricultura, Sociedad y Ambiente, Unidad Villahermosa, Villahermosa CP 86280, Tabasco, Mexico
5
Instituto de Investigación en Gestión Forestal Sostenible UVa-INIA (IUFOR), ETS Ingenierías Agrarias, Universidad de Valladolid, Avenida de Madrid, Núm. 57, CP 34071 Palencia, Spain
*
Author to whom correspondence should be addressed.
Resources 2024, 13(3), 41; https://doi.org/10.3390/resources13030041
Submission received: 1 January 2024 / Revised: 22 February 2024 / Accepted: 7 March 2024 / Published: 12 March 2024

Abstract

:
The aboveground contributions of mangroves to global carbon sequestration reinforce the need to estimate biomass in these systems. The objective was to determine the aboveground biomass storage and quantify the carbon and CO2e content in Rhizophora mangle, Avicennia germinans, and Laguncularia racemosa present in southeastern Mexico. Based on the Forest Protocol for Mexico Version 2.0 methodology, published by Climate Action Reserve, 130 circular plots were randomly selected and established in an area of 930 ha of mangrove vegetation, and the aboveground biomass and stored carbon were determined. The mangrove had a density of 3515 ± 428.5 individuals per hectare. The aboveground biomass of the three species was 120.5 Mg ha−1. The biomass of L. racemosa was 99.5 Mg ha−1, which represents 82.6% of the total biomass. The biomass of R. mangle was 20.33 Mg ha−1, and that of A. germinans was 0.32 Mg ha−1. The total carbon retained in the trees was 60.25 Mg C ha−1 and 221.1 Mg CO2e ha−1. Laguncularia racemosa generated the highest contributions of CO2e. The area of mangroves accumulated 112,065 Mg of aboveground biomass. The carbon contained in this biomass corresponds to 205,623 Mg CO2e. This mangrove contributes to mitigating the effects of climate change globally through the reduction in greenhouse gases.

1. Introduction

Carbon storage in habitats with plant species that grow in coastal strips and offshore environments (mangroves, seagrasses, and marshes) is called blue carbon and is essential to mitigate the effects of global climate change [1,2,3]. Mangrove ecosystems are considered highly productive due to their high carbon storage capacity [4]. The aboveground and underground contributions of mangroves to global carbon sequestration reinforce the need for a better understanding of the estimation of their biomass [5].
Blue carbon is distributed but not limited to two regions of greater importance. The first region, Southeast Asia Pacific, has the largest area, with 11,860,561 ha distributed in Indonesia, the Philippines, Papua New Guinea, Myanmar, Malaysia, Thailand, tropical China, Vietnam, and Cambodia [6]. The second region, the Greater Caribbean Sea (including the Gulf of Mexico), covers an area of 2,161,444 ha [7]. The mangrove forests of Mexico are located in 17 coastal states, have a total area of 905,086 ha, and cover the fourth largest surface area globally. Quintana Roo is the state with the largest mangrove area, with 247,017 ha, while Tabasco ranks sixth, with 49,225 ha [8].
The elements comprising mangroves (living and dead trees, seedlings, and even fallen dead wood) represent potential aboveground carbon storage [9,10]. In undisturbed mangroves of Central Africa, an aboveground biomass carbon amount of 538 Mg C ha−1 has been reported [11]. In Asia, the state of Kerala, located in southwestern India, has an average vegetation carbon reserve of 58.56 Mg C ha−1 [12]. In mangroves in South America, in southeastern Brazil, 1.46 Mg C ha−1 of carbon was reported [13]. In Mexico, the average carbon stock for Chiapas, Tabasco, Campeche, and Veracruz is 70 Mg C ha−1 [14]. In Nayarit, the average carbon stock is 36.22 Mg C ha−1 [15]. At a global level, the aboveground biomass of mangroves has been estimated at 2.83 Pg (dry weight), with 184.8 Mg ha−1 being the average per unit area [4,16].
The determination of aboveground biomass is an important step in planning the protection and sustainable use of mangrove resources [17,18] because it provides a valuable means to compare ecosystems and evaluate their productivity, nutrient cycling, and energy flow [19]; this step also has potential to contribute to carbon valuation schemes and initiatives that revolve around payments for ecosystem services as a route to the conservation, protection, and restoration of these ecosystems [20]. In aboveground biomass estimates, field measurements are important since their precise determination ensures an accurate estimate of the amount of carbon accumulated in mangrove forests [21]. However, estimating biomass and carbon in mangroves through routine field inventories represents a challenging task [22]. The specific allometric equations for species and sites [23] can be used to generate accurate, fast, and efficient information in places such as mangrove forests that present muddy and flooded soils; however, in addition, at a practical level, methodologies are required that allow owners to subsequently obtain timely and verifiable information to access payment programs for ecosystem services. This dilemma has been little studied thus far, and in Mexico, such investigations are incipient [24].
Allometry is a nondestructive sampling method that can be applied to estimate the weight of a tree from independent variables that are quantifiable in the field, such as the diameter and height of the stem [19,25]. It must be noted that the allometric equations developed must be applied to the species and region of the study area or very similar conditions to achieve greater precision in the estimates [8] because the equations constructed for other sites are an important source of uncertainty [26]. Henry et al. [27] recommend the use of specific equations for each species instead of general equations, while Rodríguez-Zúñiga et al. [28] suggest applying general equations only when they include wood density as a predictor variable.
Tree biomass is affected by the state of health of the tree since tree death generates a loss in biomass that must be accounted for. In this sense, tree vigor is a variable that distinguishes living trees from dead trees and is related to well-nourished trees with a live crown [29]. Determination of vigor is based on considerations of foliage color, crown ratio and appearance, leaf retention, the appearance of apical growth, the presence of cavities, and fungal growth [30]. On the other hand, the loss of tree sections modifies the biomass value obtained from the allometric equation. According to the Forestry Protocol for Mexico [30], defects correspond to the portion of biomass missing from the trees.
There are differences in biomass storage according to the physiological type of the mangrove [31]. This is because mangroves present variability in their structure due to the environmental, physical, and chemical parameters of the water and the substrate in which they grow [15]. According to Lugo and Snedaker [32], mangrove physiognomic types are classified as Riverine, Fringe, Basin, Overwash, and Dwarf. Riverine mangroves are located on the edges of river mouths and deltaic channels and are dominated by rainfall and fluvial inputs, estuarine salinity of 15 ups, and availability of nutrients from rivers [31,32]. Fringe mangroves are found at the edge of coastal lagoons, estuaries, and bays where the elevations are higher than the mean high tide [31,32]. They are exposed to a wide range of salinities and nutrient conditions, from values that exceed those of seawater and oligotrophic conditions to freshwater and high nutrient conditions [33]. Basin mangroves occur in inland areas along drainage depressions at the back of the fringe or riverine mangrove and are characterized by a periodic inundation by tidal flooding that is less frequent than for the fringe and riverine mangroves [31,32]. Overwash mangroves are located on bars, islands, and isolated islets and are constantly affected by tidal currents. The dwarf mangrove type is characterized by its scant structural development as a consequence of being removed from sources of nutrients from rivers or being found in areas of intense evaporation, which generates hypersalinity in the sediment [15].
The objective of this study was to determine the aboveground biomass, carbon content, and CO2e in Rhizophora mangle, Avicennia germinans, and Laguncularia racemosa in the mangrove forest in southeastern Mexico, using the standardized methodology of the Climate Action Reserve. This methodology has been applied for forest carbon inventories in a pine–oak forest and mountain mesophyll forest in a humid temperate climate zone in Oaxaca and for a pine and oyamel forest in a subhumid temperate climate in Puebla [34,35]; however, it has not been applied to mangrove ecosystems, although the methodology permits its application in Mexican mangroves. The standardized methodology will allow us to estimate the carbon stored in the mangrove ecosystem, giving the owners of the mangroves of the Environmental Management Unit (UMA, acronym in Spanish) in Mexico practical tools that provide verifiable evidence not only for better decision-making in the sustainable management of their resources but also for the successful management leading to greater economic benefits from payment programs for ecosystem services.

2. Materials and Methods
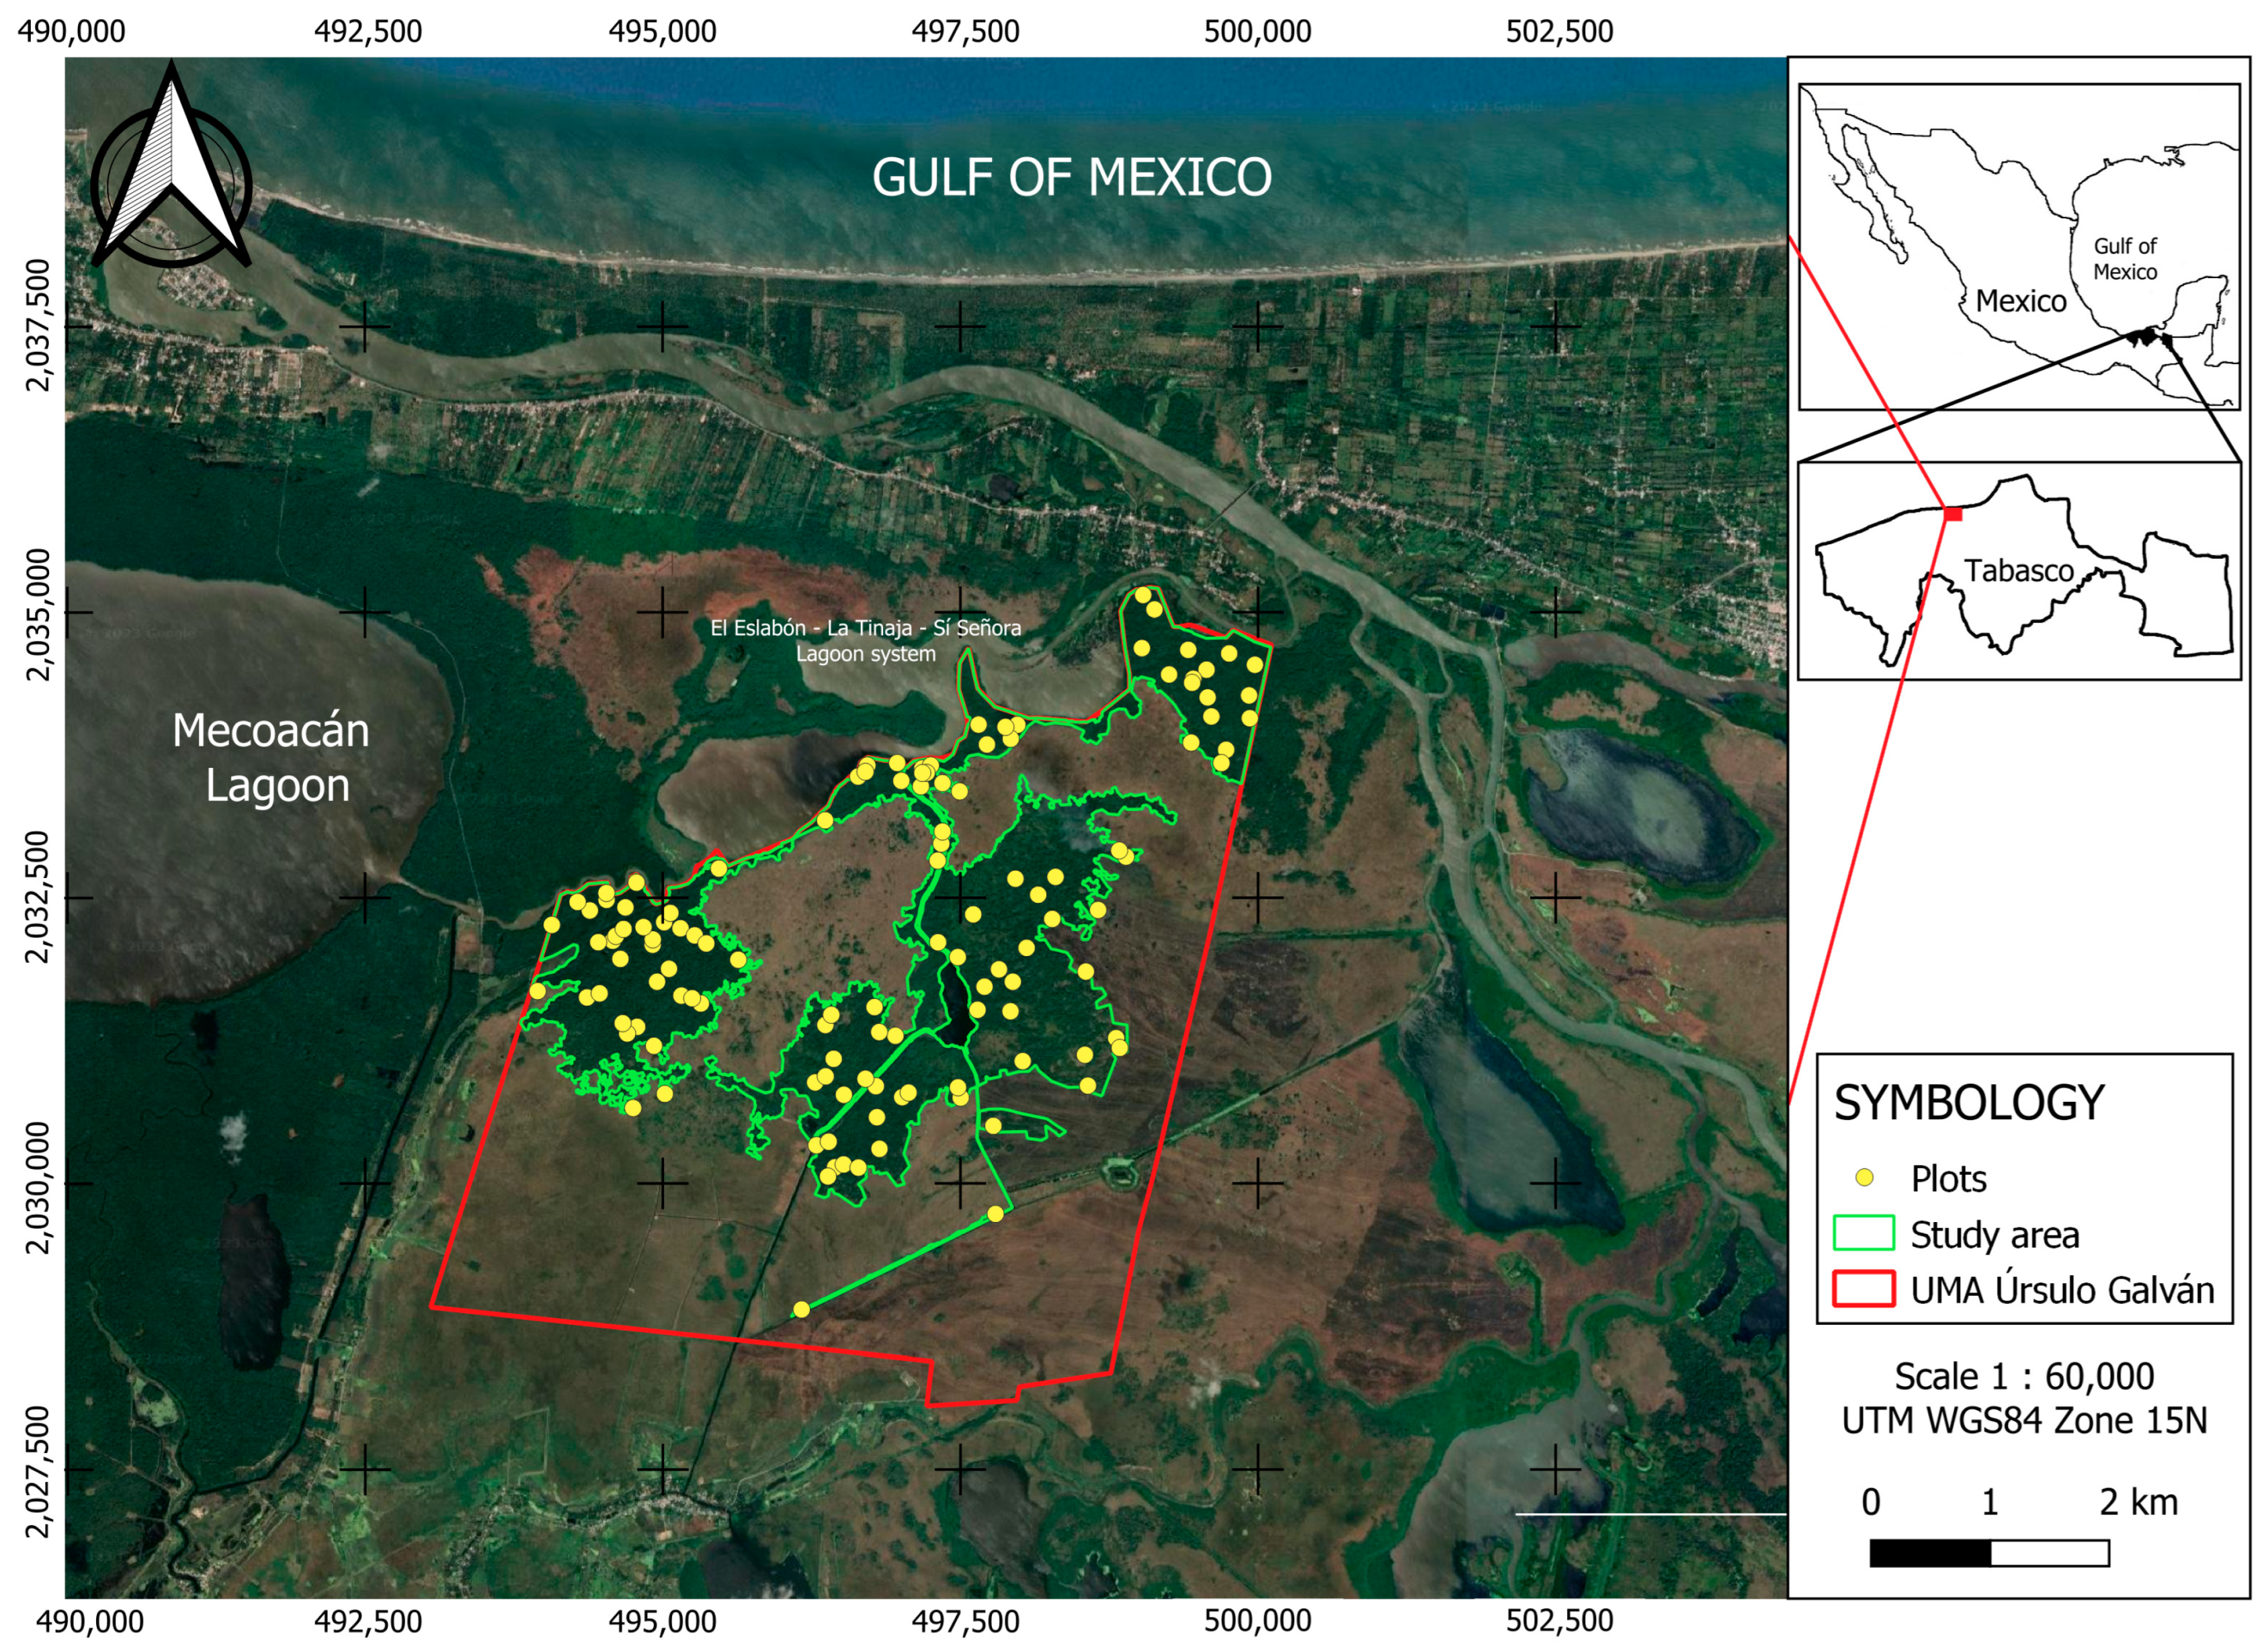
2.1. The Study Area

The study area is located in the Úrsulo Galván public land in Tabasco, Mexico. The public land has an area of 28 km2, and its geographical location is 18°20′12″ N and 93°2′30″ W. It is located in the Grijalva–Mezcalapa delta system, bordered to the north by the El Eslabón—La Tinaja—Sí Señora lakes system; to the south by the Reforma Segunda Sección public land; to the east by the Cuauhtémoc and Cruz Méndez Jalapita public lands; and to the west by the Lázaro Cárdenas public land [36]. The Úrsulo Galván public land has a warm-humid climate, abundant summer rains, precipitation between 1500 and 2000 mm, and temperatures between 24 and 26 °C. The soils correspond to the Histosol classification but also include Solonchak soil in mangrove areas [37,38,39]. The population of the Ranchería Reforma 2da Sección is 1620 people, of whom 805 are women [40].
The Úrsulo Galván public land was declared an Environmental Management Unit (UMA) in 2011, forming part of the protected natural area “Parque Estatal Laguna Mecoacán” (Laguna Mecoacán State Park), and in 2016, it received the “José Narciso Rovirosa” State Prize for Ecology in the category of Conservation and Sustainable Use of Natural Resources. The mangroves of Úrsulo Galván public land are found at a minimum of 2750 m from the sea and are crossed by the Los Caballos River and influenced by the El Eslabón—La Tinaja—Sí Señora lakes system, for which reason, according to the classification of Lugo y Snedaker [32], they comprise riverine and basin type mangroves. The study area presents sites with a high degree of conservation, with L. racemosa being the predominant species by density, structure, and surface distribution and, therefore, the most heavily exploited mangrove species [36].

2.2. Sampling Desing

The methodology for estimating aboveground biomass, carbon, and CO2e is based on the Forest Protocol for Mexico (Protocolo Forestal para México—PFM) Version 2.0 published by the Climate Action Reserve [30]. The PFM methodology was designed to achieve an estimated inventory of CO2e at the level of the area of activity, with a sampling error that does not exceed ±20% of the average and a confidence interval of 90% for living and dead-standing trees [30].
The UMA area of the Úrsulo Galván public land is 2914 ha, comprising mangroves, livestock areas, urban areas, and other plant covers. The 930 ha study area corresponds to the area of activity defined by the PFM and covers the area where carbon sequestration was quantified. The study area was obtained by delimiting the mangrove surface of the Úrsulo Galván public land using the polygon obtained from the National Agrarian Registry [41] and avoiding overlap with the surfaces of the neighboring public lands.
The forest inventory was carried out by gridding the study area in 25 × 25 m plots with the open access program QGIS, and the coordinates of each grid cell were identified [30]. A total of 130 grid cells with mangrove vegetation were selected at random with the randomness tool in CALCBOSK software (version 2.0, a database application developed by PFM). In the selected grids, nested-design plots were established using the DBH threshold values proposed by the PFM, which are used for all types of forests in Mexico (Figure 1): the first had a fixed radius of 11.28 m (surface of 1/25 = 0.04 ha), in which trees with DBH ≥ 30 cm and height ≥ 3 m were measured, and the second had a fixed radius of 5.64 m (surface area of 1/100 ha = 0.01 ha), in which trees with DBH ≥ 5 and <30 cm were measured. The inventoried trees were those that had more than 50% of their main stem within the circumference of the plot.
The basic data recorded in the mangrove forest monitoring were as follows: for each plot, the inventory date (month, day, and year), latitude (degree, minute, and second), and longitude (degree, minute, and second) measured with a Garmin 64s GPS, plot number, and personnel conducting the forest inventory were recorded; and for each tree, the tree number, identification of the species (scientific name of the species), diameter at breast height (DBH, cm) measured with diameter tape to the nearest millimeter, vigor (%), and defects (%) of the tree were recorded [30].

2.3. Determination of Tree Density

Tree density was estimated by summing the number of trees in the nested plots: the number of trees with DBH ≥ 30 cm in the larger plot was determined and multiplied by 25 to scale up to a hectare (since this plot area is 0.04 ha = 1/25). The number of trees with DBH ≥ 5 and <30 cm in the smaller plot was then determined and multiplied by 100 (since this plot area is 0.01 ha = 1/100). The values of both nested plots were then added together, and finally, the average value of the 130 plots was calculated to obtain the average density of the study area.

2.4. Determination of Aboveground Biomass

The aboveground biomass of the mangrove area was determined based on the allometric equations proposed in the PFM methodology, which make use of diameter measurements for the mangrove species (Table 1).
Based on the PFM methodology, the equations to determine the aboveground biomass in R. mangle and L. racemosa were developed and validated by Day et al. [42] in mangroves of Campeche, Mexico, and the equation for A. germinans was developed and validated by Smith and Whelan [43] in mangroves of Florida, USA.
The measurement of DBH in A. germinans and L. racemosa was carried out at a height of 1.30 m from the bottom of the stem. In R. mangle, the diameter measurement was carried out at 30 cm above the last aboveground root [8]. Since the PFM methodology has as a special consideration not to measure the height of mangrove species, this study did not include it.
The vigor of the tree was determined by direct observation, identifying the presence and color of the foliage (alive, alive in decay, and absent), the presence of fungal bodies, and the state of the branches and bark. Vigor adjustments (Table 2) were made according to the classification presented by Kessler et al. [30].
The estimation of the tree defects was performed by dividing the tree into three sections and observing the extent of the defects in each section of the tree. Adjustments for defects (Table 3) were made according to the classification presented by Kessler et al. [30].
The estimation of the area biomass of each tree (kg tree−1) took into account the adjustment according to the defects and the vigor of the tree.

2.5. Determination of Carbon and CO2 Equivalent

To determine the aboveground carbon per tree (Mg C tree−1), the aboveground biomass of each tree (including the adjustments for vigor and default values for the tree) in Mg [8] was multiplied by the amount of carbon using the conversion factor 0.5 (Equation (1)). Subsequently, the aboveground carbon data per tree were converted to CO2 equivalent per tree (Mg CO2e tree−1) by multiplying the aboveground carbon value by a factor of 3.67 [30] (Equation (2)).
C = B 1000 × ( 0.5 )
C O 2 e = ( C ) × ( 3.67 )
where C is the carbon per tree in Mg; B is the aboveground biomass per tree in kg, adjusted for vigor and defects; and CO2e is the CO2 equivalent per tree in Mg.
The aboveground carbon estimate of each nested plot was obtained by adding the aboveground carbon values of each tree. The aboveground carbon values of each tree in the largest plot with DBH ≥ 30 cm were added and multiplied by 25 to convert it to hectares (area of 1/25 = 0.04 ha). Subsequently, the aboveground carbon values of each tree with DBH ≥ 5 and <30 cm were added and multiplied by 100 (surface area of 1/100 = 0.01 ha). The carbon estimated in both plots in each nested plot was summed (Equation (3)). A total of 130 values corresponding to the same number of plots were used to obtain the average value of aboveground carbon per hectare of the study area (Equation (4)). In a similar way, the estimation of CO2e per hectare was made for each plot.
x i = ( P C i × 100 ) + ( P G i × 25 )
x ¯ = i = 1 n x i n
where x i is the aboveground biomass in the trees per plot,   P C i is the sum of the biomass in Mg in a small plot,   P G i is the sum of the biomass in Mg in a large plot, x ¯ is the average value of aboveground carbon per hectare, and n is the total number of plots.
The total number of plots, n, was obtained from Equation (5) [8].
n = t 2 s 2 E
where t = statistic of distribution t for the 95% confidence interval, s = known standard deviation of previous data, and E = admissible error in the first half of the confidence interval obtained by multiplying the mean carbon reserve by the desired precision. Thus, the size of the estimation error adjusted by the finite population correction factor at 95% confidence was obtained with Equation (6):
2 V ( y ¯ ) = 2 s 2 n ( N n N )
where 2 V ( y ¯ ) is two times the variance of the mean, N is the population size, and n is the sample size. Since ( 1 n N ) was lower than 0.05, the correction factor for a finite population did not represent a significant adjustment in the average carbon estimate.

3. Results

3.1. Tree Density

The mangrove in all tree sizes between 5 and 66 cm in DBH had a density of 3515 ± 428.5 individuals per hectare (ind ha−1, p-value > 0.05). The density by tree species is presented in Table 4. The species with the highest number of specimens per unit area was L. racemosa, accounting for 90.3% of the total number of individuals reported. R. mangle was second at 7.4%, while A. germinans only represented 0.4% of the total. Species other than mangroves represented 1.8% of the total number of individuals.
The density of trees in Úrsulo Galván, Tabasco (3515 ind ha−1, DBH ≥ 5 cm) was higher than that reported for mangroves on the Tabasco coast (1184 ind ha−1, DBH > 10 cm) [33], for the Pantanos de Centla and Campeche (2875 ind ha−1, DBH > 5 cm) [49], for Laguna de Términos (3095 ind ha−1, DBH ≥ 2.5) [50], for the La Encrucijada Reserve, Chiapas (2103 ind ha−1, DBH > 2.5 cm) [10], and for Ciudad del Carmen, Campeche (1400 ind ha−1, DBH > 2.5 cm) [51]. The mangrove species recorded in Úrsulo Galván public land are similar in density to those reported by Agraz-Hernández et al. [15] for basin-type mangroves (3580 ind ha−1), greater than that reported for riverine mangroves (1730 ind ha−1), and lower that for fringe mangroves (5930 ind ha−1). The higher density of L. racemosa coincides with that found in basin mangroves where, with greater distance inland, the tidal influence decreases, and the density of R. mangle diminishes, while that of L. racemosa and A. germinans increases [32]. The mangrove species were consistent with those recorded in Tabasco by Torres et al. [52] and Torres et al. [53] and in Veracruz by Carmona-Díaz et al. [54] and Moreno-Casasola et al. [55], comprising three of the six mangrove species recorded in Mexico. The density of mangroves is a function of growth and developmental stage due to competition for crown space [52]. The highest density associated with L. racemosa is consistent with that reported in Colima, Mexico, by Téllez-García et al. [56] and by Torres-Fernández et al. [54], who reported it as the species with the highest density. The low density of A. germinans coincides with that found by Torres et al. [52], who reported that in Laguna Mecoacán, Tabasco, Mexico, A. germinans covers physiologically unfavorable areas (high salinity) and has a negative correlation with the densities of R. mangle and L. racemosa. The species A. germinans is found in conditions of lower soil submergence and higher salinity, having tolerance limits of up to 100 ups [15] and thriving in depressions prone to hyperhaline conditions [52]. On the other hand, L. racemosa is found in conditions of higher soil submergence, water residence time, and lower salinity (0 to 42 ups, with a tolerance up to 80 ups), while R. mangle is found in conditions of lower salinity (0 to 37 ups, with a tolerance up to 65 ups) and soils with high degrees of anoxia. The latter is considered a pioneer species at the terrestrial and marine limits since it develops in the mouths of rivers where shallow lagoons are formed with brackish water subject to tidal activity [15,52].
In mangroves, there are some plant species that inhabit areas together [54] bordering the mangrove. Torres-Fernández et al. [57] classified the species Ficus insipida Willd as a species associated with mangroves. Romero-Berny et al. [58] reported the presence of the species P. aquatica, P. dulce, and Coccoloba barbadensis in association with mangroves of R. mangle, A. germinans, and L. racemosa, with P. aquatica having the highest density. The species P. aquatica forms associations with mangroves of R. mangle, A. germinans, and L. racemosa; it is present along a salinity gradient, mixed with species that occur in flooded forests and mangroves, and its distribution may be limited to mangroves [59]. Adame et al. [60] reported the presence of P. aquatica in La Encrucijada, Chiapas, a site characterized by large areas of wetlands that include mangroves, swamps, and peat swamp forests. In Tabasco, coconut plantations and cattle pastures are found in small, isolated patches within mangrove forests [38].
The distribution of mangrove species depends largely on geographic location (seashore or inland), tidal flooding, and freshwater inflows [61], as well as on companion species such as P. aquatica, P. dulce, and A. glabra. According to Torres-Fernández et al. [57], the floristic composition and structure of mangrove vegetation are influenced by the salinity of interstitial water. The relationship of mangrove vegetation with water is restricted by the low osmotic potential of saline soils. The structural distribution is also determined by dissolved oxygen, especially in the rainy season when the soil is saturated with water and anoxic conditions occur.

3.2. Woodland Diameter

The average DBH of A. germinans was 11.6 ± 1.3 cm; R. mangle, 9.5 ± 0.8 cm; and L. racemosa, 9.2 ± 0.7 cm. The frequency of the trees of each species by diameter class is presented in Table 5. For all species, the diameter class with the highest number of individuals was 5.0–10 cm, representing 68.7% of L. racemosa, 65.8% of R. mangle, and 55.0% of A. germinans individuals. As the DBH increased, a decrease in the number of individuals was observed, resulting in the typical reverse j-shaped distribution, a characteristic pattern of juvenile stands of unequal age [56], and a balanced forest structure [62].
The average DBH of the trees in this study in Tabasco was lower than that recorded in Colima, Mexico (18.5 cm) [56], Campeche, Mexico (12.1 cm) [51], Sarawak, Malaysia (20.83 cm) [63], and Indonesia (12.67 cm) [64]. The DBH was similar to that recorded on Ishigaki Island, Japan, with a value of 10.9–11.2 cm [65], and higher than that observed in Peninsular Malaysia, with a value of 5.0–11.6 cm at a density of 753–2034 ind ha−1 [19]. According to Torres-Fernández et al. [57], salinity is one of the main factors that influence the growth of DBH in the rainy season, while pH, salinity, and dissolved oxygen influence DBH during the dry season.

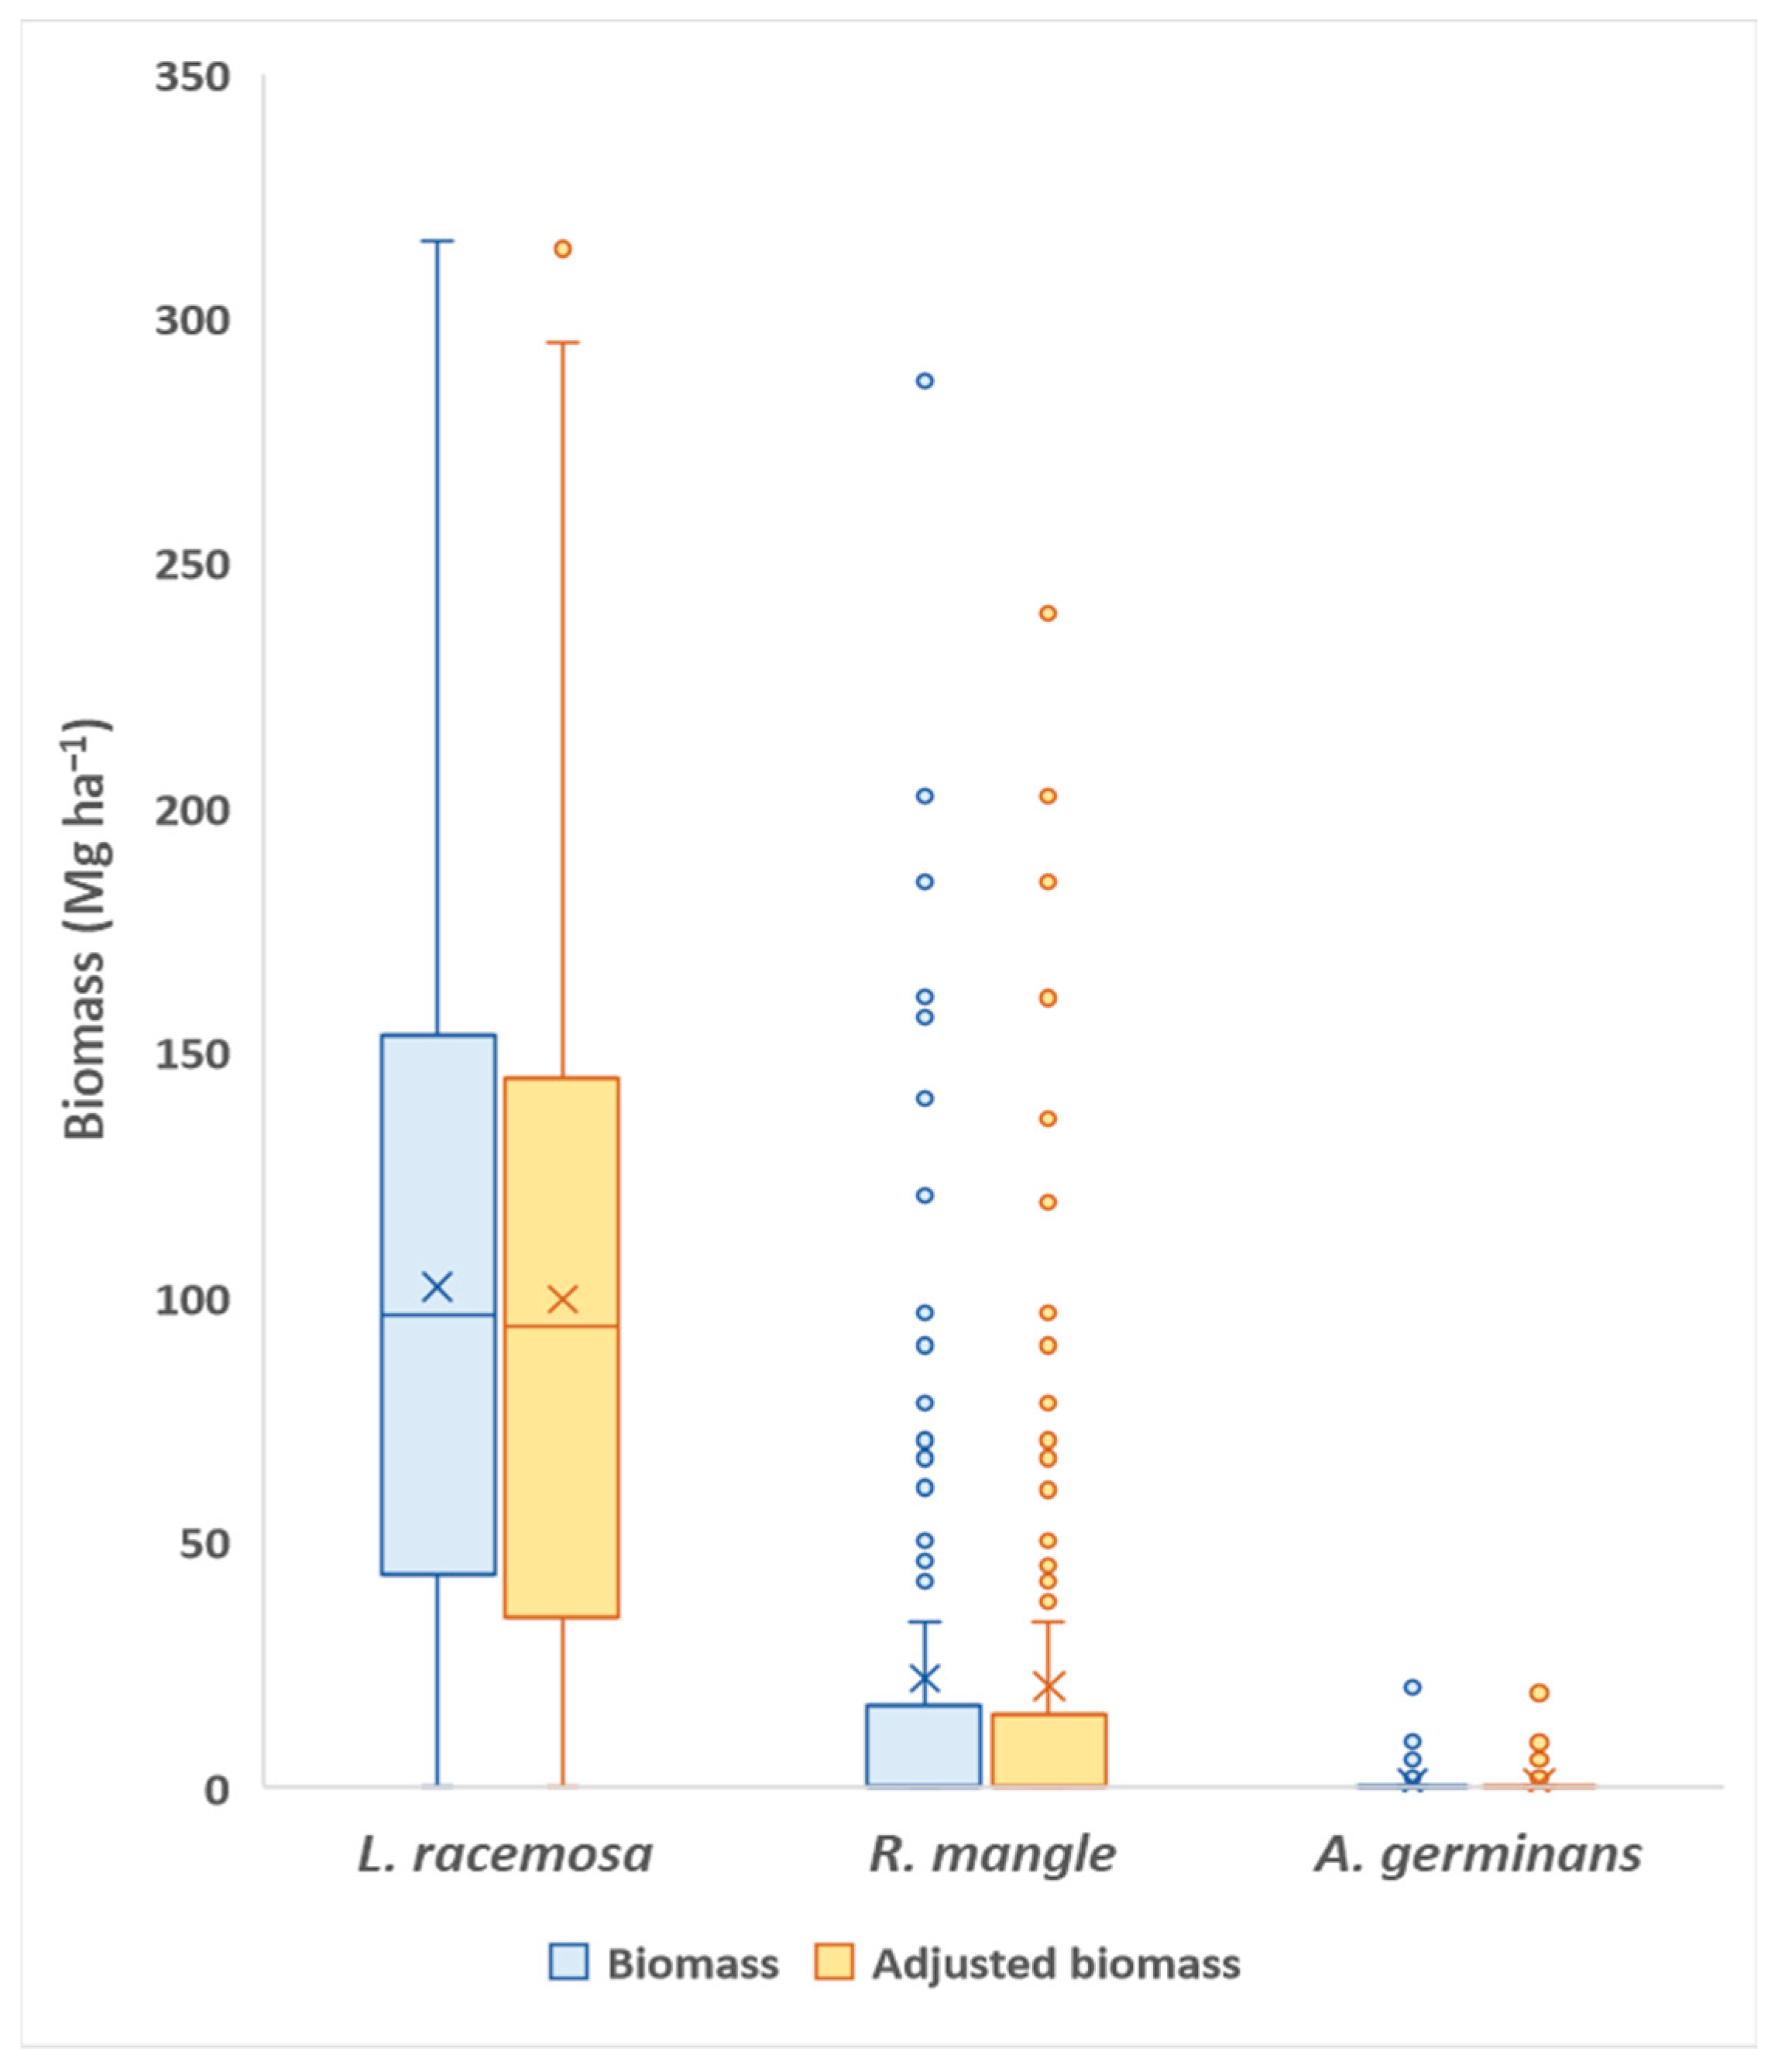
3.3. Aboveground Biomass

The unadjusted aboveground biomass was estimated for the three mangrove species, with a value of 124.8 Mg ha−1; the value for the companion species was 2.2 Mg ha−1. The mangrove species with the highest biomass contribution (102.2 Mg ha−1) was L. racemosa, with 82.6% of the total, followed by R. mangle, with 16.8%. The contribution of A. germinans was very small (0.5%) due to the few individuals present in the study area. With the adjustments for the defects and the decline of the trees of the three mangrove species (Figure 2), the aboveground biomass was estimated at 120.5 Mg ha−1, which represents a decrease of 4.2 Mg ha−1 (3.4% with respect to the total), where 3.6 Mg ha−1 (2.9%) corresponds to tree defects and 0.6 Mg ha−1 (0.5%) corresponds to their vigor. In L. racemosa, the average decrease in biomass due to adjustments was 2.4 Mg ha−1 (2.4%), where 2.0 Mg ha−1 (2.0%) was due to defects and 0.4 Mg ha−1 (0.4%) was due to vigor. In R. mangle, the average decrease was 1.71 Mg ha−1 (7.8%), where 1.5 Mg ha−1 (6.8%) was due to defects and 0.21 Mg ha−1 (1.0%) was due to vigor. In A. germinans, the average adjustment was 0.08 Mg ha−1 (11.0%), where 0.07 Mg ha−1 (9.8%) corresponds to the defects and 0.01 Mg ha−1 (1.2%) corresponds to the vigor. The small loss of biomass due to tree vigor indicates the presence of a few dead trees, suggesting that the environmental conditions of the site have not been altered since changes in these conditions are generally followed by alterations in tree vigor and can lead to widespread vegetation mortality [66].
The biomass generated in the mangroves of Úrsulo Galván (120.5 Mg ha−1 at a density of 3515 ind ha−1) was lower than that reported in the Gulf of Montijo, Panama (176 Mg ha−1 at a density of 8267 ind ha−1) [67], the Andaman Islands, India (469.20 Mg ha−1 at a density of 1767 ind ha−1) [68], in Bangladesh (157 Mg ha−1 at a density of 255 ind ha−1) [69], and in the Amazon region, Brazil (145 Mg ha−1) [70]. The results are close to those recorded in the La Encrucijada Biosphere Reserve, Chiapas, of 131.8 Mg ha−1 [14] and Peninsular Malaysia of 108.27–155.58 Mg ha−1 [19] and higher than those found in Kelantan, Malaysia, of 2.66 Mg ha−1 at a density of 1170 ind ha−1 [71]. According to Gross et al. [67] and Shaltout et al. [72], the density of trees is positively correlated with biomass; that is, it increases linearly with the increase in the density of stems. In mangroves, the influence of fresh water, low salinity, and a continuous supply of nutrients have a positive influence, increasing the biomass and carbon content and increasing with age [15]; however, the average biomass and carbon content become more variable as the age of the trees increases [73].
The biomass equations used in this study consider maximum diameters: the equation of Day et al. [42] was developed with maximum diameters of 10 cm for both L. racemosa and R. mangle, while that of Smith and Whelan [43] used for A. germinans was developed with maximum diameters of 21.5 cm. In this context, it is important to consider the size of the trees for which the equation was generated since estimates can be affected if the equations are applied to diameter ranges beyond those that were used to generate them [26]. For example, Kauffman et al. [8] consider that the use of equations with larger diameter trees than those for which they were developed may produce an overestimation of biomass values. According to Vorster et al. [74], large trees are a common problem for biomass allometry since they present the greatest amount of biomass and greatest variation in the form of growth but are rarely measured because they are the most difficult and expensive to inventory, leading to the difficulty of predicting outside the diameter range of the sampled trees. This practice is common in biomass assessments since there are few alternatives for most species, and there is great difficulty in accessing inventory sites.

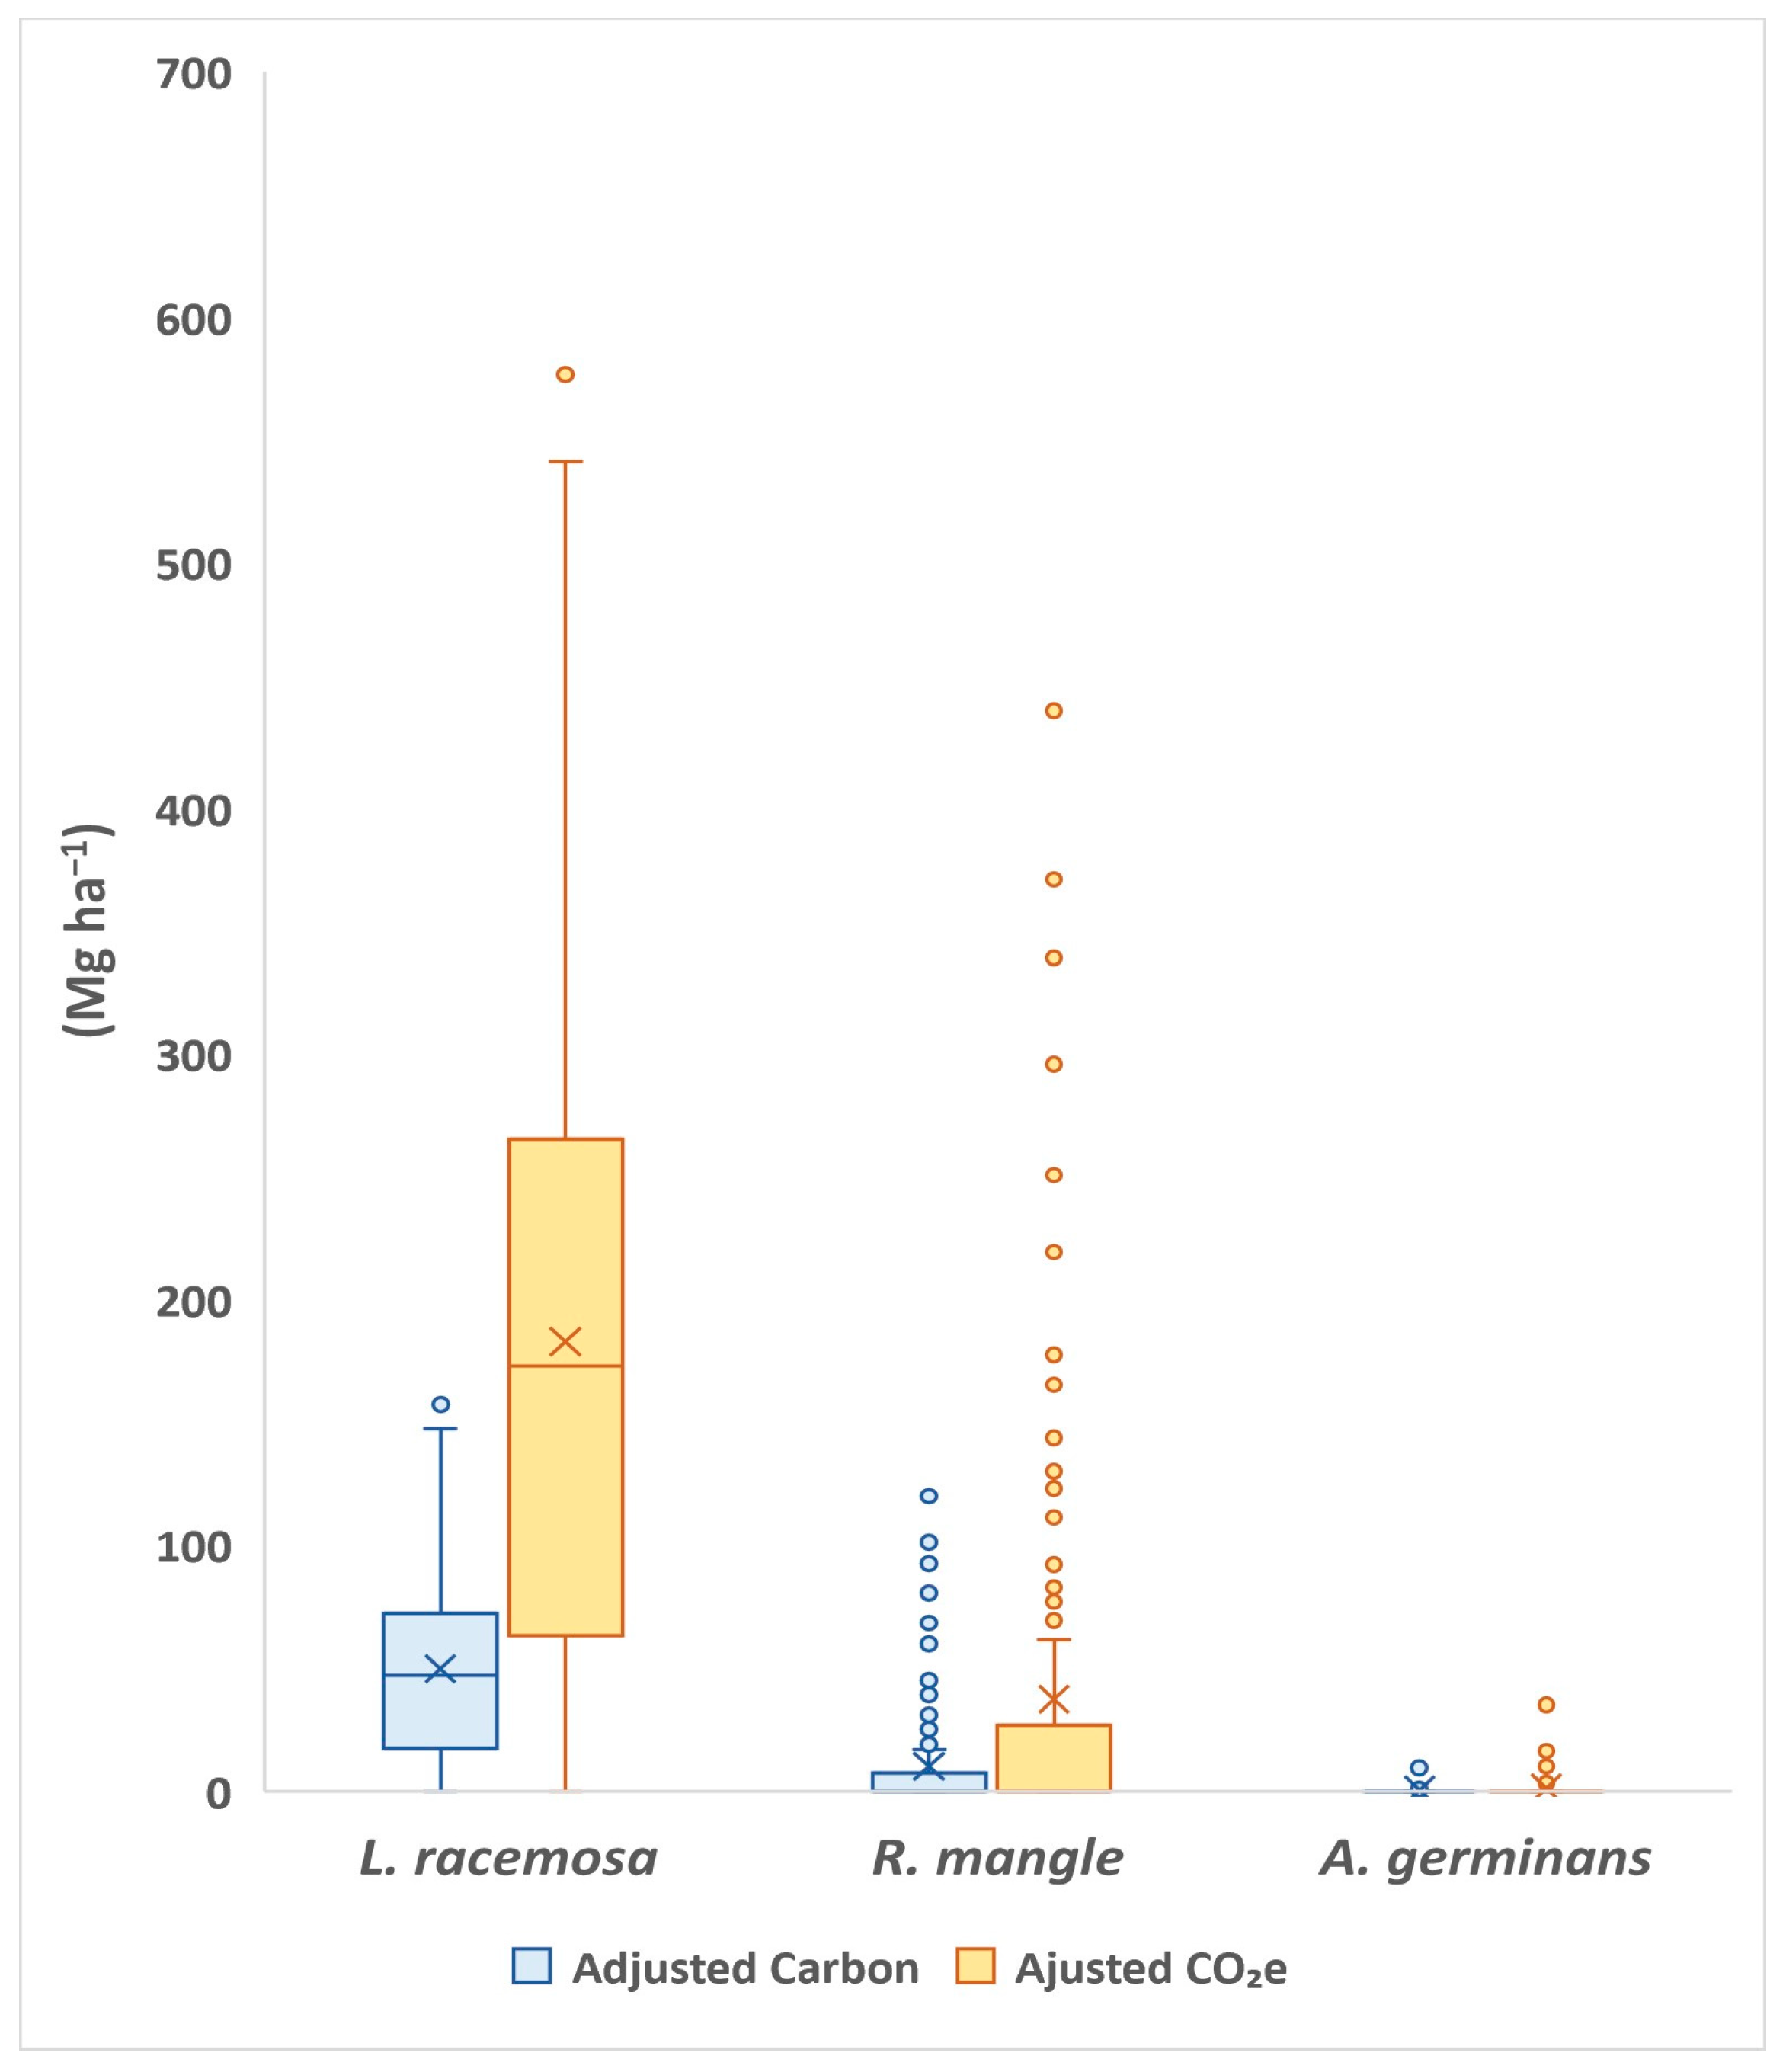
3.4. Aboveground Carbon

The carbon stored per unit area of the three mangrove species was 60.25 Mg C ha−1, and CO2e per unit area was 221.1 Mg CO2e ha−1. The carbon stored in the other companion species was 1.13 Mg C ha−1, and the CO2e was 3.95 Mg CO2e ha−1. The sampling error based on the estimates of CO2e in the study area was 7.8%, which is within the range required by the methodology (±20%). Therefore, the estimates are within the norm of the PFM methodology (Figure 3).
The amount of aboveground carbon (60.25 Mg C ha−1) stored in mangroves in this study at DBH > 5 cm and a density of 3515 ind ha−1 and with a conversion factor of 0.5 is similar to the average value of 69.69 Mg C ha−1 in basin-type mangroves in Mexico, but it is less than that reported in riverine-type mangroves (183.32 Mg C ha−1) [34], as well that reported for the Gulf of Mexico coast, at 221.9 Mg C ha−1 [75]. The aboveground carbon content was lower than that present in La Encrucijada, Chiapas (87.0 Mg C ha−1, DBH > 2.5 cm) [10], and in Campeche, Mexico (76–91 Mg C ha−1 DBH ≥ 2.5 cm) [51]. However, in these two sites, individuals with lower DBH were measured, which led to the inclusion of more trees per hectare and an increase in the density of trees and biomass with respect to this study. Furthermore, the aboveground carbon content was lower than that present in Kerala, India (94.63 Mg C ha−1 with a conversion factor of 0.5 at density 2452 ind ha−1) [76] and in Sri Lanka (75.5–189.1 Mg C ha−1 at density 8594 ind ha−1 with a conversion factor of 0.48) [20]. De Jong et al. [77] found that the use of a 5.0 cm or 10 cm diameter threshold influences estimates of aboveground carbon; however, the difference may be small. According to Velázquez-Pérez et al. [10], increases in biomass are influenced by the presence of mature and declining trees, which at the stand level implies a higher carbon content. On the other hand, the aboveground carbon data generated in this study are lower (3.4%) than those reported for other investigations because the PFM methodology considers the loss of biomass due to the presence of dead trees (vigor) or tree defects, while other studies have not considered these variables. The aboveground carbon results are similar to those recorded in Indonesia (57.16 Mg C ha−1) [63]. On the other hand, the aboveground carbon content was double that reported in Nayarit, Mexico, for fringe and riverine mangroves (36.22 Mg C ha−1) [15] and 48 to 77% higher than that reported in Baja California Sur, Mexico, dwarf mangroves of R. mangle, L. racemosa, and A. germinans (13.6–31.6 Mg C ha−1) [78]. The lower carbon contents at these sites could be because they were inhabited by species with small DBHs and low densities, agreeing with Ragavan et al. [68], who mentioned that larger diameter trees contain more carbon reserves due to the positive correlation between the density of trees with biomass and carbon, while Velázquez-Pérez et al. [10] concluded that a higher number of juvenile trees is associated with lower carbon content. Carbon storage also varies with climatic conditions, hydrogeomorphic configurations, and mangrove species [79]. According to Velázquez-Pérez et al. [10], the differences between the different mangrove species may be due to the growth dynamics between species; for example, R. mangle, generally has greater structural development than other species because it is located in areas rich in nutrients, while A. germinans abound in salt flats with low nutrient contents. In this sense, Torres et al. [52] identified that interspecific interactions among mangrove species change with salinity, finding greater structural development of A. germinans in basin mangroves associated with high levels of interstitial salinity while observing a greater density of R. mangle in fringe mangroves with low interstitial salinity.

4. Conclusions

The mangrove forest of the UMA in Tabasco presented a density of 3515 ind ha−1 in a basin and riverine mangroves. The species with the highest density was L. racemosa, representing 90.3% of the total number of individuals reported. The average diameter of A. germinans was 11.6 ± 8.0 cm, that of R. mangle was 9.5 ± 4.7 cm, and that of L. racemosa was 9.2 ± 3.9 cm. The 5.0–10 cm diameter class had the highest number of individuals, a characteristic pattern of mangroves with juvenile trees.
The total aboveground biomass in the mangroves was 120.5 Mg ha−1. Laguncularia racemosa generated the highest biomass contributions, accounting for 82.6% of the total biomass. The total carbon content was 60.25 Mg ha−1, with 221.1 Mg CO2e ha−1. Laguncularia racemosa generated the highest contribution of CO2e, accounting for 82.6% of the total. The 930 ha of mangrove area of the UMA stored 112,065 Mg of aboveground biomass. The carbon contained in this biomass was 56,032.5 Mg, which corresponds to 205,623 Mg CO2e.

Author Contributions

C.R.Á.-A.: research, methodology, data curation, writing of the original draft, formal analysis, and visualization. M.D.-D.: conceptualization, resources, revision of writing and editing, supervision, and acquisition of funds. C.J.V.-N., R.G.A.-P. and P.M.-Z.: formal analysis, editorial review, and editing. All authors have read and agreed to the published version of the manuscript.

Funding

Thanks to the Consejo Nacional de Ciencia y Tecnología (CONACYT) for the Doctorate scholarship awarded to the first author No. 441771 (CVU).

Data Availability Statement

The data that support this study are available from the corresponding author upon reasonable request. The data are not publicly available due to privacy.

Acknowledgments

We thank the Postgraduate College, Campus Tabasco, for the opportunity to carry out postgraduate studies; the ejidatarios of the UMA Úrsulo Galván for their support in the mangrove forest inventory.

Conflicts of Interest

The authors declare no conflicts of interest.

References

  1. Bautista-Olivas, A.L.; Mendoza-Cariño, M.; Rodríguez, J.C.; Colado-Amador, C.E.; Robles-Zazueta, C.A.; Meling-López, A.E. Above-ground biomass and carbon sequestration in mangroves in the arid area of the northwest of Mexico: Bahía del Tóbari and Estero El Sargento, Sonora. Rev. Chapingo Ser. Cienc. For. Ambient. 2018, 24, 387–403. [Google Scholar] [CrossRef]
  2. Comisión para la Cooperación Ambiental. Carbono Azul en América del Norte: Evaluación de la Distribución de los Lechos de Pasto Marino, Marismas y Manglares, y su Papel Como Sumideros de Carbono; Comisión para la Cooperación Ambiental: Montreal, QC, Canadá, 2016; ISBN 978-2-89700-141-4. [Google Scholar]
  3. Jennerjahn, T.C. Relevance and magnitude of ‘Blue Carbon’ storage in mangrove sediments: Carbon accumulation rates vs. stocks, sources vs. Sinks. Estuar. Coast. Shelf Sci. 2021, 248, 107027. [Google Scholar] [CrossRef]
  4. Inoue, T. Carbon Sequestration in Mangroves. In Blue Carbon in Shallow Coastal Ecosystems; Kuwae, T., Hori, M., Eds.; Springer: Singapore, 2019; pp. 73–99. [Google Scholar] [CrossRef]
  5. Twilley, R.R.; Castañeda-Moya, E.; Rivera-Monroy, V.H.; Rovai, A. Productivity and Carbon Dynamics in Mangrove Wetlands. In Mangrove Ecosystems: A Global Biogeographic Perspective; Rivera-Monroy, V., Lee, S., Kristensen, E., Twilley, R., Eds.; Springer: Cham, Switzerland, 2017; pp. 113–162. [Google Scholar] [CrossRef]
  6. Thorhaug, A.; Gallagher, J.B.; Kiswara, W.; Prathep, A.; Huang, X.; Yap, T.K.; Dorward, S.; Berlyn, G. Coastal and estuarine blue carbon stocks in the greater Southeast Asia region: Seagrasses and mangroves per nation and sum of total. Mar. Pollut. Bull. 2020, 160, 111168. [Google Scholar] [CrossRef]
  7. Thorhaug, A.L.; Poulos, H.M.; López-Portillo, J.; Barr, J.; Lara-Domínguez, A.L.; Ku, T.C.; Berlyn, G.P. Gulf of Mexico estuarine blue carbon stock, extent and flux: Mangroves, marshes, and seagrasses: A North American hotspot. Sci. Total Environ. 2019, 653, 1253–1261. [Google Scholar] [CrossRef]
  8. Velázquez-Salazar, S.; Rodríguez-Zúñiga, M.T.; Alcántara-Maya, J.A.; Villeda-Chávez, E.; Valderrama-Landeros, L.; Troche-Souza, C.; Vázquez-Balderas, B.; Pérez-Espinosa, I.; Cruz-López, M.I.; Ressl, R.; et al. Manglares de México. Actualización y Análisis de los Datos 2020; Comisión Nacional para el Conocimiento y Uso de la Biodiversidad: Ciudad de México, México, 2021; ISBN 978-607-8570-50-8. [Google Scholar]
  9. Kauffman, J.B.; Donato, D.; Adame, M.F. Protocolo Para la Medición, Monitoreo y Reporte de la Estructura, Biomasa y Reservas de Carbono de los Manglares. Documento de Trabajo 117; Cifor: Bogor, Indonesia, 2013. [Google Scholar] [CrossRef]
  10. Velázquez-Pérez, C.; Tovilla-Hernández, C.; Romero-Berny, E.I.; De Jesús-Navarrete, A. Estructura del manglar y su influencia en el almacén de carbono en la Reserva La Encrucijada, Chiapas, México. Madera Bosques 2019, 25, e2531885. [Google Scholar] [CrossRef]
  11. Ajonina, G.N.; Kairo, J.; Grimsditch, G.; Sembres, T.; Chuyong, G.; Diyouke, E. Assessment of Mangrove Carbon Stocks in Cameroon, Gabon, the Republic of Congo (RoC) and the Democratic Republic of Congo (DRC) Including their Potential for Reducing Emissions from Deforestation and Forest Degradation (REDD+). In The Land/Ocean Interactions in the Coastal Zone of West and Central Africa. Estuaries of the World; Diop, S., Barusseau, J.P., Descamps, C., Eds.; Springer: Cham, Switzerland, 2014; pp. 177–189. [Google Scholar] [CrossRef]
  12. Harishma, K.M.; Sandeep, S.; Sreekumar, V.B. Biomass and carbon stocks in mangrove ecosystems of Kerala, southwest coast of India. Ecol. Process. 2020, 9, 31. [Google Scholar] [CrossRef]
  13. da Motta Portillo, J.T.; Londe, V.; Moreira, F.W.A. Aboveground biomass and carbon stock are related with soil humidity in a mangrove at the Piraquê-Açu River, Southeastern Brazil. J. Coast. Conserv. 2017, 21, 139–144. [Google Scholar] [CrossRef]
  14. Sjögersten, S.; Barreda-Bautista, B.; Brown, C.; Boyd, D.; López-Rosas, H.; Hernández, E.; Monroy, R.; Rincón, M.; Vane, C.; Moss-Hayes, V.; et al. Coastal wetland ecosystems deliver large carbon stocks in tropical Mexico. Geoderma 2021, 403, 115173. [Google Scholar] [CrossRef]
  15. Agraz-Hernández, C.M.; Chan-Keb, C.A.; Chávez-Barrera, J.; Osti-Sáenz, J.; Expósito-Díaz, G.; Alonso-Campos, V.A.; Muñiz-Salazar, R.; Ruiz-Fernández, A.C.; Pérez-Bernal, L.H.; Sánchez-Cabeza, J.A.; et al. Reserva de carbono en un ecosistema de manglar al norte de México: Cambios ambientales durante 35 años. Rev. Mex. Biodivers. 2020, 91, e912910. [Google Scholar] [CrossRef]
  16. Hutchison, J.; Manica, A.; Swetnam, R.; Balmfold, A.; Spalding, M. Predicting global patterns in mangrove forest biomass. Conserv. Lett. 2014, 7, 233–240. [Google Scholar] [CrossRef]
  17. Medeiros, T.C.C.; Sampaio, E.V.S.B. Allometry of aboveground biomasses in mangrove species in Itamaracá, Pernambuco, Brazil. Wetl. Ecol. Manag. 2008, 16, 323–330. [Google Scholar] [CrossRef]
  18. Fu, W.; Wu, Y. Estimation of aboveground biomass of different mangrove trees based on canopy diameter and tree height. Procedia Environ. Sci. 2011, 10, 2189–2194. [Google Scholar] [CrossRef]
  19. Rozainah, M.Z.; Sofawi, A.B.; Joharee, N.A.; Ahmad, Z.P. Stand structure and biomass estimation in the Klang Islands Mangrove Forest, Peninsular Malaysia. Environ. Earth Sci. 2018, 77, 486. [Google Scholar] [CrossRef]
  20. Cooray, P.L.I.G.M.; Kodikara, K.A.S.; Kumara, M.P.; Jayasinghe, U.I.; Madarasinghe, S.K.; Dahdouh-Guebas, F.; Gorman, D.; Huxham, M.; Jayatissa, L.P. Climate and intertidal zonation drive variability in the carbon stocks of Sri Lankan mangrove forests. Geoderma 2021, 389, 114929. [Google Scholar] [CrossRef]
  21. De la Peña, A.; Rojas, C.A.; De la Peña, M. Valoración económica del manglar por el almacenamiento de carbono, Ciénaga Grande de Santa Marta. Clío América 2010, 4, 133–150. [Google Scholar]
  22. Tang, W.; Feng, W.; Jia, M.; Shi, J.; Zuo, H.; Trettin, C.C. The assessment of mangrove biomass and carbon in West Africa: A spatially explicit analytical framework. Wetl. Ecol. Manag. 2016, 24, 153–171. [Google Scholar] [CrossRef]
  23. Estrada, G.C.D.; Soares, M.L.G.; Santos, D.M.C.; Fernandez, V.; de Almeida, P.M.M.; Estevam, M.R.M.; Machado, M.R.O. Allometric models for aboveground biomass estimation of the mangrove Avicennia schaueriana. Hydrobiologia 2014, 734, 171–185. [Google Scholar] [CrossRef]
  24. Jakovac, C.C.; Latawiec, A.E.; Lacerda, E.; Lucas, I.L.; Korys, K.A.; Iribarrem, A.; Malaguti, G.A.; Turner, R.K.; Luisetti, T.; Strassburg, B.B.N. Costs and Carbon Benefits of Mangrove Conservation and Restoration: A Global Analysis. Ecol. Econ. 2020, 176, 106758. [Google Scholar] [CrossRef]
  25. Komiyama, A.; Poungparn, S.; Kato, S. Common allometric equations for estimating the tree weight of mangroves. J. Trop. Ecol. 2005, 21, 471–477. [Google Scholar] [CrossRef]
  26. Yuen, J.Q.; Fung, T.; Ziegler, A.D. Review of allometric equations for major land covers in SE Asia: Uncertainty and implications for above- and below-ground carbon estimates. For. Ecol. Manag. 2016, 360, 323–340. [Google Scholar] [CrossRef]
  27. Henry, M.; Picard, N.; Trotta, C.; Manlay, R.J.; Valentini, R.; Bernoux, M.; Saint-André, L. Estimating tree biomass of sub-Saharan African forests: A review of available allometric equations. Silva Fenn. 2011, 45, 477–569. [Google Scholar] [CrossRef]
  28. Rodríguez-Zúñiga, M.T.; Villeda-Chávez, E.; Vázquez-Lule, A.D.; Bejarano, M.; Cruz-López, M.I.; Olguín, M.; Villela Gaytán, S.A.; Flores, R. Métodos Para la Caracterización de los Manglares Mexicanos: Un Enfoque Espacial Multiescala; Comisión Nacional para el Conocimiento y Uso de la Biodiversidad: Ciudad de México, México, 2018; ISBN 978-607-8570-03-4. [Google Scholar]
  29. Martins, N.E.; dos Santos, L.M.; Konig Brun, F.G.; Brun, E.J.; Krefta, S.M.; Grisi Macedo, R.L. Condiciones de los árboles urbanos: Un estudio de revisión. RECyT 2018, 20, 56–61. [Google Scholar]
  30. Protocolo Forestal para México Versión 2.0 [Internet]. Climate Action Reserve. Available online: https://www.climateactionreserve.org/how/protocols/mexico-forest/ (accessed on 27 January 2022).
  31. Herrera Silveira, J.A.; Camacho, R.A.; Pech, E.; Pech, M.; Ramírez, R.J.; Teutli, H.C. Dinámica del carbono (almacenes y flujos) en manglares de México. Terra Latinoam 2016, 34, 61–72. [Google Scholar]
  32. Lugo, A.E.; Snedaker, S.C. The Ecology of Mangroves. Annu. Rev. Ecol. Syst. 1974, 5, 39–64. [Google Scholar] [CrossRef]
  33. Schaeffer-Novelli, Y.; Cintrón-Molero, G.; Soares, M.L.G.; De-Rosa, T. Brazilian mangroves. Aquat. Ecosyst. Health Manag. 2000, 3, 561–570. [Google Scholar] [CrossRef]
  34. Mora-Carvajal, M.J.; Bustamante-González, A.; Cajuste-Bontemps, L.; Vargas-López, S.; Cruz Bello, G.M.; Ramírez-Juárez, J. Pago por servicios ambientales hidrológicos y dinámica de la cobertura arbórea en la región Iztaccíhuatl-Popocatépetl, Puebla, México. Acta Agron 2019, 68, 84–91. [Google Scholar] [CrossRef]
  35. Rontard, B.; Reyes, H.; Aguilar, M. Pagos por captura de carbono en el mercado voluntario en México: Diversidad y complejidad de su aplicación en Chiapas y Oaxaca. Soc. Ambient. 2020, 22, 212–236. [Google Scholar] [CrossRef]
  36. Tovilla-Hernández, C.; Infante-Mata, D.M.; Ovalle-Estrada, F.; De la Presa-Pérez, J.C.; García-Alfaro, J.R.; De la Cruz-Montes, G. Informe: Inventario del Manglar y Avance de la Intrusión Salina en el Ejido Úrsulo Galván, Municipio de Jalpa de Méndez, Tabasco, México; Fondo Institucional de Fomento Regional para el Desarrollo Científico, Tecnológico y de Innovación, El Colegio de la Frontera Sur, Consejo Nacional de Ciencia y Tecnología: Tapachula, México, 2013. [Google Scholar]
  37. Palma-López, D.J.; Jiménez-Ramírez, R.; Zavala-Cruz, J.; Bautista-Zúñiga, F.; Gavi-Reyes, F.; Palma-Cancino, D.Y. Actualización de la clasificación de suelos de Tabasco, México. Agroproductividad 2017, 10, 29–35. [Google Scholar]
  38. Domínguez-Domínguez, M.; Zavala-Cruz, J.; Rincón-Ramírez, J.A.; Nartínez-Zurimendi, P. Management Strategies for the Conservation, Restoration and Utilization of Mangroves in Southeastern Mexico. Wetlands 2019, 39, 907–919. [Google Scholar] [CrossRef]
  39. Domínguez-Domínguez, M.; Zavala-Cruz, J.; Martínez-Zurimendi, P. Manejo Forestal Sustentable de los Manglares de Tabasco; Secretaría de Recursos Naturales y Protección Ambiental. Colegio de Postgraduados: Villahermosa, México, 2011. [Google Scholar]
  40. Censo de Población y Vivienda 2020. México: Instituto Nacional de Estadística y Geografía. Available online: https://www.inegi.org.mx/programas/ccpv/2020/default.html#Datos_abiertos (accessed on 28 March 2023).
  41. Datos Geográficos Perimetrales de los Núcleos Agrarios Certificados, por Estado—Formato SHAPE. México: Gobierno de México. Available online: https://datos.gob.mx/busca/dataset/datos-geograficos-perimetrales-de-los-nucleos-agrarios-certificados-por-estado--formato-shape (accessed on 28 November 2021).
  42. Day, J.W., Jr.; Conner, W.H.; Ley-Lou, F.; Day, R.H.; Machado-Navarro, A. The productivity and composition of mangrove forests, Laguna de Términos, México. Aquat. Bot. 1987, 27, 267–284. [Google Scholar] [CrossRef]
  43. Smith, T.J.; Whelan, K.R.T. Development of allometric relations for three mangrove species in South Florida for use in the Greater Everglades Ecosystem restoration. Wetl. Ecol. Manag. 2006, 14, 409–419. [Google Scholar] [CrossRef]
  44. Rodríguez, R.; Jiménez, J.; Meza, J.; Aguirre, O.; Razo, R. Carbono contenido en un bosque tropical subcaducifolio en la reserva de la biosfera el cielo, Tamaulipas, México. Rev. Latinoam. Recur. Nat. 2008, 4, 215–222. [Google Scholar]
  45. Hughes, F.; Kauffman, B.; Jaramillo, V. Biomass, Carbon, and Nutrient Dynamics of Secondary Forests in a humid Tropical Region of Mexico. Ecology 1999, 80, 1892–1907. [Google Scholar] [CrossRef]
  46. Rodríguez, R.; Jiménez, J.; Aguirre, O.; Treviño, E.; Treviño, E. Estimación de carbono almacenado de niebla en Tamaulipas, México. Ciencia UANL 2006, 9, 179–188. [Google Scholar]
  47. Hung, D.N.; Son, N.V.; Hung, N.P. Tree allometric equation development for estimation of forest above-ground biomass in Viet Nam—Evergreen broadleaf forests in Quang Binh Province. In Tree Allometric Equation Development for Estimation of Forest Above-Ground Biomass in Viet Nam; Inoguchi, A., Henry, M., Birigazzi, L., Sola, G., Eds.; UN-REDD Programme: Hanoi, Vietnam, 2012. [Google Scholar]
  48. Krisnawati, H.; Adinugroho, W.C.; Imanuddin, R. Monograph Allometric Models for Estimating Tree Biomass at Various Forest Ecosystem Types in Indonesia; Research and Development Center for Conservation and Rehabilitation, Forestry Research and Development Agency, Ministry of Forestry: Bogor, Indonesia, 2012; ISBN 978-979-3145-93-8. [Google Scholar]
  49. Návar, J. Allometric equations for tree species and carbon stocks for forests of northwestern Mexico. For. Ecol. Manag. 2009, 257, 427–434. [Google Scholar] [CrossRef]
  50. Coronado-Molina, C.; Álvarez-Guillén, H.; Day, J.W.; Reyes, E.; Pérez, B.C.; Vera-Herrera, F.; Twilley, R. Litterfall dynamics in carbonate and deltaic mangrove ecosystems in the Gulf of Mexico. Wetl. Ecol. Manag. 2012, 20, 123–136. [Google Scholar] [CrossRef]
  51. Hernández-Nava, J.; Pascual-Barrera, A.E.; Zaldívar-Jiménez, A.; Pérez-Ceballos, R. Estructura y secuestro de carbono en manglares urbanos, fundamentos para su conservación en Isla del Carmen, Campeche, México. Bot. Sci. 2022, 100, 899–911. [Google Scholar] [CrossRef]
  52. Torres, J.R.; Infante-Mata, D.; Sánchez, A.J.; Espinoza-Tenorio, A.; Barba, E. Atributos estructurales, productividad (hojarasca) y fenología del manglar en la Laguna Mecoacán, Golfo de México. Rev. Biol. Trop. 2017, 65, 1592–1608. [Google Scholar] [CrossRef]
  53. Torres, J.R.; Barba, E.; Choix, F.J. Mangrove Productivity and Phenology in Relation to Hydroperiod and Physical–Chemistry Properties of Water and Sediment in Biosphere Reserve, Centla Wetland, Mexico. Trop. Conserv. Sci. 2018, 11, 14. [Google Scholar] [CrossRef]
  54. Carmona-Díaz, G.; Morales-Mávil, J.E.; Rodríguez-Luna, E. 2004. Plan de manejo para el manglar de Sontecomapan, Catemaco, Veracruz, México: Una estrategia para la conservación de sus recursos naturales. Madera Bosques 2004, 10, 5–23. [Google Scholar] [CrossRef]
  55. Moreno-Casasola, P.; Hernández, M.E.; Campos, C.A. Hydrology, Soil Carbon Sequestration and Water Retention along a Coastal Wetland Gradient in the Alvarado Lagoon System, Veracruz, Mexico. J. Coast. Res. 2017, 77 (Suppl. S1), 104–115. [Google Scholar] [CrossRef]
  56. Téllez-García, C.P.; Valdez-Hernández, J.I. Caracterización estructural del manglar en el Estero Palo Verde, laguna de Cuyutlán, Colima. Rev. Chapingo Ser. Cienc. For. Ambient. 2012, 18, 395–408. [Google Scholar] [CrossRef]
  57. Torres-Fernández del Campo, J.; Olvera-Vargas, M.; Figueroa-Rangel, B.L.; Cuevas-Guzmán, R.; Iñiguez-Dávalos, L.I. Patterns of Spatial Diversity and Structure of Mangrove Vegetation in Pacific West-Central Mexico. Wetlands 2018, 38, 919–931. [Google Scholar] [CrossRef]
  58. Romero-Berny, E.I.; Tovilla-Hernández, C.; Torrescano-Valle, N.; Schmook, B. Heterogeneidad estructural del manglar como respuesta a factores ambientales y antrópicos en el Soconusco, Chiapas, México. Polibotánica 2019, 47, 39–58. [Google Scholar] [CrossRef]
  59. Infante-Mata, D.; Moreno-Casasola, P.; Madero-Vega, C. Pachira aquatica, un indicador del límite del manglar? Rev. Mex. Biodivers. 2014, 85, 143–160. [Google Scholar] [CrossRef]
  60. Adame, M.F.; Santini, N.S.; Tovilla, C.; Vázquez-Lule, A.; Castro, L.; Guevara, M. Carbon stocks and soil sequestration rates of tropical riverine wetlands. Biogeosciences 2015, 12, 3805–3818. [Google Scholar] [CrossRef]
  61. Sreelekshmi, S.; Preethy, C.M.; Varghese, R.; Joseph, P.; Asha, C.V.; Nandan, S.B.; Radhakrishnan, C.K. Diversity, stand structure, and zonation pattern of mangroves in southwest coast of India. J. Asia-Pac. Biodivers. 2018, 11, 573–582. [Google Scholar] [CrossRef]
  62. Grinson, G.; Krishnan, P.; Mini, K.G.; Salim, S.S.; Ragavan, P.; Tenjing, S.Y.; Muruganandam, R.; Dubey, S.K.; Gopalakrishnan, A.; Purvaja, R.; et al. Structure and regeneration status of mangrove patches along the estuarine and coastal stretches of Kerala, India. J. For. Res. 2019, 30, 507–518. [Google Scholar] [CrossRef]
  63. Shah, K.; Kamal, A.H.M.; Rosli, Z.; Hakeem, R.K.; Hoque, M.M. Composition and diversity of plants in Sibuti mangrove forest, Sarawak, Malaysia. For. Sci. Technol. 2016, 12, 70–76. [Google Scholar] [CrossRef]
  64. Rijal, S.S.; Pham, T.D.; Noer’Aulia, S.; Putera, M.I.; Saintilan, N. Mapping Mangrove Above-Ground Carbon Using Multi-Source Remote Sensing Data and Machine Learning Approach in Loh Buaya, Komodo National Park, Indonesia. Forests 2023, 14, 94. [Google Scholar] [CrossRef]
  65. Iimura, Y.; Kinjo, K.; Kondo, M.; Ohtsuka, T. Soil carbon stocks and their primary origin at mature mangrove ecosystems in the estuary of Fukido River, Ishigaki Island, southwestern Japan. Soil Sci. Plant Nutr. 2019, 65, 435–443. [Google Scholar] [CrossRef]
  66. Jiménez, J.A.; Lugo, A.E.; Cintron, G. Tree Mortality in Mangrove Forests. Biotropica 1985, 17, 177–185. [Google Scholar] [CrossRef]
  67. Gross, J.; Flores, E.E.; Schwendenmann, L. Stand Structure and Aboveground Biomass of a Pelliciera rhizophorae Mangrove Forest, Gulf of Monitjo Ramsar Site, Pacific Coast, Panama. Wetlands 2014, 34, 55–65. [Google Scholar] [CrossRef]
  68. Ragavan, P.; Kumar, S.; Kathiresan, K.; Mohan, P.M.; Jayaraj, R.S.C.; Ravichandaran, K.; Rana, T.S. Biomass and vegetation carbon stock in mangrove forests of the Andaman Islands, India. Hydrobiologia 2021, 848, 4673–4693. [Google Scholar] [CrossRef]
  69. Uddin, M.M.; Hossain, M.M.; Aziz, A.A.; Lovelock, C.E. Ecological development of mangrove plantations in the Bangladesh Delta. For. Ecol. Manag. 2022, 517, 120269. [Google Scholar] [CrossRef]
  70. Kauffman, J.B.; Bernardino, A.F.; Ferreira, T.O.; Giovannoni, L.R.; de, O. Gomes, L.E.; Romero, D.J.; Jimenez, L.C.Z.; Ruiz, F. Carbon stocks of mangroves and salt marshes of the Amazon region, Brazil. Biol. Lett. 2018, 14, 20180208. [Google Scholar] [CrossRef]
  71. Kasawani, I.; Kamaruzaman, J.; Nurun-nadhirah, M.I. A Study of Forest Structure, Diversity Index and Above-ground Biomass at Tok Bali Mangrove Forest, Kelantan, Malaysia. In Proceedings of the 5th WSEAS International Conference on Environment, Ecosystems and Development, Tenerife, Spain, 14–16 December 2007; pp. 269–276. [Google Scholar]
  72. Shaltout, K.H.; Ahmed, M.T.; Alrumman, S.A.; Ahmed, D.A.; Eid, E.M. Standing Crop Biomass and Carbon Content of Mangrove Avicennia marina (Forssk.) Vierh. along the Red Sea Coast of Saudi Arabia. Sustainability 2021, 13, 13996. [Google Scholar] [CrossRef]
  73. Phan, S.M.; Thi, N.H.T.; Nguyen, T.K.; Lovelock, C. Modelling above ground biomass accumulation of mangrove plantations in Vietnam. For. Ecol. Manag. 2019, 432, 376–386. [Google Scholar] [CrossRef]
  74. Vorster, A.G.; Evangelista, P.H.; Stovall, A.E.L.; Ex, S. Variability and uncertainty in forest biomass estimates from the tree to landscape scale: The role of allometric equations. Carbon Balance Manag. 2020, 15, 8. [Google Scholar] [CrossRef] [PubMed]
  75. Vázquez-Lule, A.; Colditz, R.; Herrera-Silveira, J.; Guevara, M.; Rodríguez-Zúñiga, M.T.; Cruz, I.; Ressl, R.; Vargas, R. Greenness trends and carbon stocks of mangroves across Mexico. Environ. Res. Leton. 2019, 14, 075010. [Google Scholar] [CrossRef]
  76. Vinod, K.; Asokan, P.K.; Zacharia, P.U.; Ansar, C.P.; Vijayan, G.; Anasukoya, A.; Kunhi Koya, V.A.; Nikhiljith, M.K. Assessment of biomass and carbon stocks in mangroves of Thalassery estuarine wetland of Kerala, south-west coast of India. J. Coast. Res. 2019, 86 (Suppl. S1), 209–217. [Google Scholar] [CrossRef]
  77. de Jong Cleyndert, G.; Cuni-Sanchez, A.; Seki, H.A.; Shirima, D.D.; Munishi, P.K.T.; Burgess, N.; Calders, K.; Marchant, R. The effects of seaward distance on above and below ground carbon stocks in estuarine mangrove ecosystems. Carbon Balance Manag. 2020, 15, 27. [Google Scholar] [CrossRef] [PubMed]
  78. Ochoa-Gómez, J.G.; Lluch-Cota, S.E.; Rivera-Monroy, V.H.; Lluch-Cota, D.B.; Troyo-Diéguez, E.; Oechel, W.; Serviere-Zaragoza, E. Mangrove wetland productivity and carbon stocks in an arid zone of the Gulf of California (La Paz Bay, Mexico). For. Ecol. Manag. 2019, 442, 135–147. [Google Scholar] [CrossRef]
  79. Wang, G.; Guan, D.; Xiao, L.; Peart, M.R. Ecosystem carbon storage affected by intertidal locations and climatic factors in three estuarine mangrove forests of South China. Reg. Environ. Chang. 2019, 19, 1701–1712. [Google Scholar] [CrossRef]
Figure 1. Mangrove plots inventoried in Environmental Management Unit (UMA) Úrsulo Galván Tabasco, Mexico.
Resources 13 00041 g001
Figure 2. Aboveground biomass and adjusted aboveground biomass (with defects and vigor) by mangrove species. The boxes extend from the lower quartile to the upper quartile, covering the middle half of each sample. The centerlines within each box show the locations of the sample medians. The cross signs indicate the locations of the sample means. The whiskers extend from the box to the minimum and maximum values of each sample.
Resources 13 00041 g002
Figure 3. Carbon from aboveground biomass and CO2e by mangrove species. The boxes extend from the lower quartile to the upper quartile, covering the middle half of each sample. The centerlines within each box show the locations of the sample medians. The cross signs indicate the locations of the sample means. The whiskers extend from the box to the minimum and maximum values of each sample.
Resources 13 00041 g003
Table 1. Allometric equations to determine the aboveground biomass of the trees recorded in the study area [30].
Species GroupAboveground Biomass EquationSource
R. mangle l o g e B = 2.5072 × l o g e D R 1.5605 Day et al. [42]
A. germinans l o g 10 B = 1.934 × l o g 10 D B H 0.395 Smith and Whelan [43]
L. racemosa l o g e B = 2.1924 × l o g e D B H 1.5919 Day et al. [42]
Pachira aquatica B = 0.0447 × D B H 2.16175 Rodríguez et al. [44]
Lonchocarpus luteomaculatus B = ( e 4.9375 × D B H 2.1166 × 0.00000114 ) × 1000 Hughes et al. [45]
Ficus maxima B = 0.027059 × D B H 2.86357 Rodríguez et al. [46]
Annona glabra B = 0.1245 × D B H 2.4163 Hung et al. [47]
Cocos nucifera B = 6.666 + 12.826 × H 0.5   × l o g e H Krisnawati et al. [48]
Pithecellobium dulce B = 0.5825 × D B H 1.6178 Návar [49]
B = total biomass (kg), DBH = diameter at breast height (cm), DR = stem diameter measured above the highest aboveground root in trees of R. mangle (cm), H = tree height.
Table 2. Codes used to assign the vigor of the inventoried trees [30].
CodeDescriptionDecay Adjustment (%)Biomass Considered (%)
1Very healthy/dominant: The crown is full on all sides. The crown of the tree is generally above those of other trees around it and has minimal competition.0100
2Healthy/codominant: The crown is not full on all sides due to competition with annex trees but has a proportion of the crown that receives full sunlight.0100
3Suppressed: The crown is usually under those of other trees and has live but decaying foliage.0100
4Dead with some deterioration: The tree has no foliage. The branches and the upper part are intact, and the bark is retained to the tree.2575
5Dead with advanced deterioration: The tree may not have the upper part, it has fungal bodies, and the bark is not present. The tree no longer has foliage in the crown.5050
Table 3. Tree defect estimation [30].
Tree SectionStandardized Portion of Biomass in Each Section of the Tree (%)Current Portion of Defect in Each Section of the Tree (%)
Upper 1/3100–100
Middle 1/3300–100
Lower 1/3600–100
Table 4. Average tree density of the mangrove.
SpeciesIndividuals ha−1Number of Plots with the Species
L. racemosa3178.1108
R. mangle258.451
Pachira aquatica29.217
A. germinans15.410
Lonchocarpus luteomaculatus15.47
Cocos nucifera12.33
Annona glabra3.82
Ficus maxima2.33
Pithecellobium dulce1.51
Table 5. Frequency of the tree species present in the study area by diameter class.
Species5.0–1010.1–1515.1–2020.1–2525.1–3030.1–3535.1–40>40
cm
L. racemosa285310631692818846
R. mangle220951341011
P. aquatica2810000000
L. luteomaculatus181100000
A. germinans124200200
C. nucifera00384100
A. glabra50000000
F. maxima30000000
P. dulce20000000
Plots with the diameter class117108702110833
Disclaimer/Publisher’s Note: The statements, opinions and data contained in all publications are solely those of the individual author(s) and contributor(s) and not of MDPI and/or the editor(s). MDPI and/or the editor(s) disclaim responsibility for any injury to people or property resulting from any ideas, methods, instructions or products referred to in the content.

