Article

Comparison of Mixed and Door-to-Door Systems for Urban Waste Collection in Terms of Effectiveness and Greenhouse Gas Emissions: A Case Study from Two Mountainous Italian Valleys

by
Alberto Pietro Damiano Baltrocchi
*,
Lucrezia Maggi
,
Marco Carnevale Miino
,
Vincenzo Torretta
and
Elena Cristina Rada
Department of Theoretical and Applied Sciences (DiSTA), University of Insubria, Via G.B. Vico 46, 21100 Varese, Italy
*
Author to whom correspondence should be addressed.
Resources 2024, 13(1), 17; https://doi.org/10.3390/resources13010017
Submission received: 16 November 2023 / Revised: 12 January 2024 / Accepted: 18 January 2024 / Published: 22 January 2024

Abstract

:
Collecting urban solid waste (USW) is a critical and essential phase for proper waste management and valorization. To date, many data are available for large cities, but few studies have focused on low-density areas, such as mountainous regions. Considering this lack in the literature, this study aimed to compare two separate waste collection systems in two mountainous valleys in terms of effectiveness and GHG emissions. In the first scenario, a mixed collection system (door-to-door + centers) was used, while in the other, waste was separately collected by a full door-to-door system. The results suggested that the full door-to-door system achieved better performance than the mixed collection system (door-to-door + centers), with a fraction of separate waste collection compared to the unit equals (0.84 ± 0.01 vs. 0.79 ± 0.02). Moreover, the full door-to-door system represented the best option for collecting separate waste in mountainous areas in terms of GHG emissions, with 11.21 kgCO2, eq twaste−1 emitted vs. 15.62 kgCO2, eq twaste−1 in the case of the mixed system. Despite utilities emitting a higher amount of GHGs in the door-to-door scenario (4.66 kgCO2, eq inh−1 y−1), they were fully compensated for by the low GHG emissions from citizens in the mixed scenario (1.77 kgCO2, eq inh−1 y−1 vs. 6.65 kgCO2, eq inh−1 y−1). Given the low amount of data on this topic, this work could be considered as a pioneer study of waste management in mountainous areas by comparing the results of two systems regarding effectiveness and GHG emissions. The outcomes of this study could be helpful for waste utilities, institutional agencies, and local communities and also serve as a tool for decision-making in the case of comparing the different options for USW collection systems.

1. Introduction

The increase in population and rapid urbanization have increased the quantity of urban solid waste (USW) produced by the population. According to Shah et al. [1], more than 2 billion tons of USW are produced annually around the globe. This amount is expected to double by 2100 [2]. Therefore, developing structured waste management systems is essential to prevent issues regarding public and environmental health and the depletion of natural resources [3].
In this context, the Circular Economy (CE) concept has also gained importance in accordance with the Sustainable Development Goals (SDGs) and FIT for 55 proposals. According to these principles, USW must first be regarded as a source of material to be recovered and reused; then, the useable portions of remaining waste (residual waste) should be considered as a source of energy [4]. This is closely linked with the concept of waste hierarchy that is promoted by the European Union, according to which after an initial minimization of waste, the recovery of matter and energy is preferential to disposal in landfills [5].
In terms of legislation, the current European Directive 2008/98/EC [6] focuses on waste management while an additional “Circular Economy Package”, which was published in 2018, contains four new directives regarding several fields of waste management (e.g., electronic waste, packaging, and batteries) [7,8,9,10]. The legislation regulating waste management in Italy is the Legislative Decree 152/2006 and its subsequent amendments [11].
In order to reach the goals imposed by these directives (EC, SDGs and Fit for 55), the separate collection (SC) of USW is necessary before the potential recovery of matter [12,13,14] and energy [15,16,17,18]. In recent years, many cities have transitioned from traditional curbside systems to door-to-door systems to increase the effectiveness of separate waste collection and enhance the quality of collected materials [19,20,21,22]. However, the effectiveness of these systems can vary depending on the specific characteristics of the area and the differences to other systems in terms of cost–benefit ratio, which are not necessarily marked. For instance, Gadaleta et al. [23] applied a multicriteria decision analysis (MCDA) and life cycle assessment (LCA) to compare door-to-door and mixed (centers and door-to-door) systems for the collection of waste in a large metropolitan area. They found that the deviation between the two systems in terms of environmental and socio-technical criteria was less than 10% (in favor of the door-to-door system), highlighting the intense competitiveness of the mixed collection model [23].
In the literature, many studies on the SC of USW are available; however, they have mainly focused on significant communities and metropolitan areas, while only a few have considered rural areas and mountain territories. High waste transportation costs due to long distances and logistical inefficiencies (i.e., low density) are the most important drawbacks in waste management in rural areas [24].
In addition, mountainous areas present significant morphological challenges that are not evident in plain rural areas. The problem of long distances is joined by other factors (e.g., the steepness of roads and the limited accessibility of some areas), which also influence the means by which waste collections are removed. The particular orographic and morphological characteristics of areas can also influence the effectiveness of collection systems. Among the few available studies, Agovino and Musella [25] focused on the impact of land characteristics on separate waste collection in Campania, a region in southern Italy, 23% of which comprises mountainous areas. They highlighted that collection in these areas can be complex due to several factors, such as (i) the large distances that need to be covered by the population and/or waste utilities and (ii) the higher costs [25].
Moreover, during the collection of USW, greenhouse gases (GHGs) are produced and released into the atmosphere, although emissions levels depend on many factors, such as (i) the collection system, (ii) the frequency of USW collection, and (iii) the type of fuel used by collection vehicles [26,27,28,29]. Transportation is an essential factor that should be considered in studies on GHG emissions within the waste management sector [30,31]. Generally, when long distances do not need to be covered, emissions from transport are low compared to those from the subsequent waste treatment phases [32]. However, in the case of mountainous areas, the low population density can enhance the quantity of emissions. For instance, Korkut et al. [33] estimated the emissions of a USW collection system in the city of Istanbul and found that in less populated areas, where larger distances needed to be covered by the collection trucks, the service was less fuel efficient and more impactful in terms of GHG emissions.
This work aims to analyze and compare two different management systems (door-to-door and mixed approaches) in mountainous communities in the Alps (Non and Fiemme Valleys) regarding the effectiveness of separate collection and GHG emissions. In previous works, we have already investigated the management of USW in the same area of the Alps, but a comparison between collection systems in terms of different environmental impacts has never been discussed [22,34,35].
Given the limited available literature on the subject, this research could serve as a precursor and pioneer study of waste management in mountainous areas by comparing two waste collection systems regarding their effectiveness and GHG emissions. The outcomes of this study could be helpful for waste utilities, institutional agencies, and local communities and could serve as a decision-making and comparison tool for different USW collection systems.

2. Materials and Methods

2.1. Description of the Case Studies

This study aimed to compare the effectiveness of two different methods for USW collection in terms of separate collection and the GHG emissions, specifically CO2eq, in mountainous valleys: (i) a mixed system (centralized + door-to-door system) (Scenario 1) and (ii) a complete door-to-door curbside pickup system (Scenario 2). In order to compare these different scenarios, two valleys in the autonomous province of Trento (Italy) with similar characteristics in terms of extension and orography were selected as case studies. The USW was considered to be attributable to 20 03 01 mixed municipal waste in the European waste catalogue. It should be noted that the fraction of recyclable waste also included materials with different European waste codes (EWCs) (Table A1).

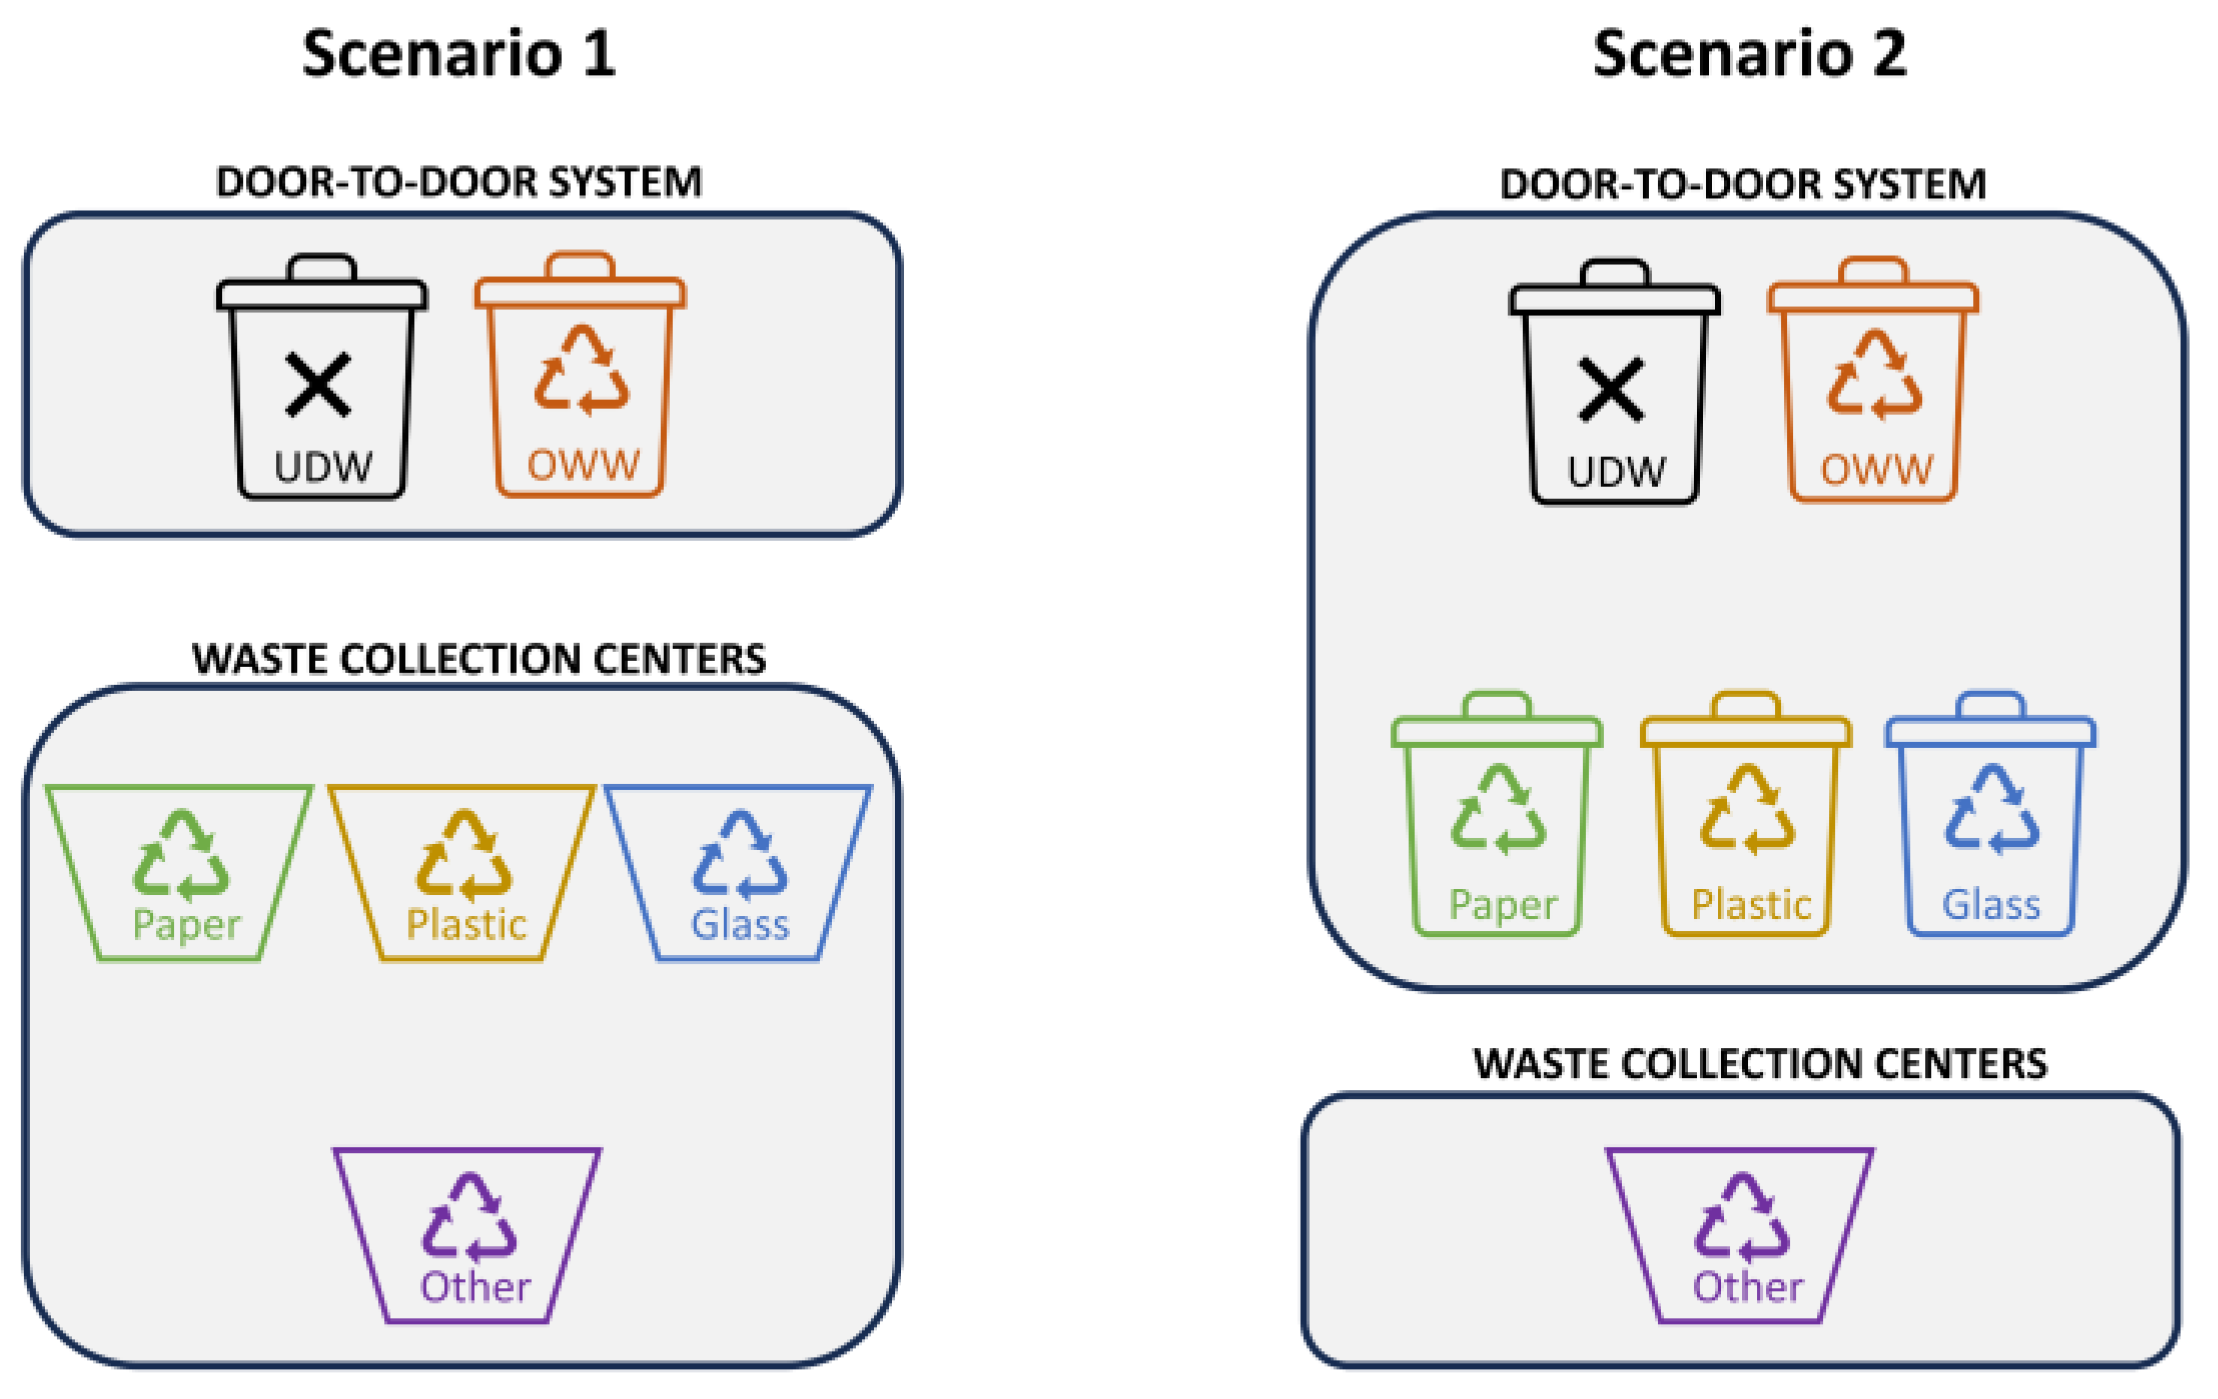
2.1.1. Scenario 1: Mixed System

The Non Valley (Scenario 1) is formed of 23 municipalities, housing 39,000 inhabitants and covering almost 600 km2. It is a moderate tourist area that is famous for its vast apple orchards. Waste is mainly collected via mixed door-to-door and centralized collection systems. The collection of unsorted urban dry waste (UDW) and organic wet waste (OWW) takes place via door-to-door pickup service using 18 vehicles every two weeks (Figure 1). Recoverable materials (e.g., paper, plastics, glass) are conferred directly to waste collection centers by users (Table 1). Due to the fact that almost all types of waste are collected at waste collection centers, the assumption that the conferment takes place weekly was made following discussions with the local waste utilities. There are 21 collection centers in 16 different municipalities in the valley.

2.1.2. Scenario 2: Door-to-Door System

The Fiemme Valley (Scenario 2) extends over a territory of 415 km2 and comprises nine municipalities. The total population of the valley is almost 20,000 inhabitants. Vast wooded areas and a high tourist attendance also characterize the valley. Waste is mainly collected via a structured door-to-door system. The local waste utilities provide a weekly collection for UDW, OWW, plastic and cans, and paper, as well as the collection of glass packaging every two weeks. Using 26 vehicles and following a detailed pre-established schedule in each municipality, all materials are collected door-to-door from the users. For waste disposal, the users are equipped with containers with automatic recognition and identification plates on a free loan basis. Moreover, there are five collection centers in the area for the remaining types of waste, which are used by citizens approximately once a month to dispose of garden waste and other large organic waste materials (Table 1).

2.2. Data Analysis

2.2.1. Effectiveness of Separate Waste Collection

Local waste utilities and the Environmental Protection Agency obtained data about the effectiveness of the separate waste collection from 2019 to 2021. For each scenario, the effectiveness of the collection and separation of waste was evaluated using the recyclable collection index (RI), urban waste-specific production index (UWSP), and the recyclable waste-specific production index (RWSP), which are calculated using Equations (1)–(3).
RI (−) = RW/TW
UWSP (t inh−1 y−1) = (RW + NRW)/population
RWSP (t inh−1 y−1) = RW/population
where RW is the annual production of recyclable waste (t y−1), NRW is the annual production of non-recyclable waste (t y−1), and TW is the sum of RW and NRW (i.e., the annual production of total urban waste).

2.2.2. GHG Emissions from Waste Collection

The estimation of GHG emissions in terms of equivalent CO2 (CO2, eq) emitted by the transportation of waste was carried out for both scenarios using two different attributes: (i) CO2 emitted by individual users when delivering waste to the collection centers and (ii) emissions caused by the movement of the heavy vehicles used by the utilities for the door-to-door collection of waste.
The comparison of the two scenarios was conducted using two indices: (i) the waste-specific emissions index (WSE) and (ii) the user-specific emissions index (USE). These were calculated according to Equations (4) and (5), respectively.
WSE (kgCO2,eq twaste−1) = CO2,eq emitted/W
USE (kgCO2,eq inh−1 y−1) = CO2,eq emitted/population
where W is the amount of transported waste (t−1 y−1), whether collected or delivered, and CO2, eq is the equivalent CO2 emitted by the transportation of waste (kgCO2, eq y−1) considering two different attributes: (i) the GHGs emitted by individual users when delivering waste to the collection centers and (ii) emissions caused by the movement of the heavy vehicles used by the utilities for the door-to-door collection of waste.

Emissions from Individual Users

The emissions from individual users when delivering waste to the collection centers were calculated according to Equation (6).
CO2,eq emitted by users (tCO2,eq y−1) = families × N × Em × distance
where the number of families was obtained by dividing each area’s population by the number of members in each family (in both scenarios, an average of 2.3 family members was assumed [36]) and N is the number of deliveries per year, which was assumed depending on the scenario. In Scenario 1, most of the separate waste collection took place in the collection centers; therefore, the number of deliveries per family was assumed to be one per week. In Scenario 2, thanks to the structured door-to-door pickup system, the number of deliveries per family was assumed to be one per month. In both scenarios, a year was assumed to comprise 52.2 weeks.
The Em value of the specific CO2, eq emissions generated by private vehicles (kgCO2, eq km−1) was obtained from the percentage distribution of the most commonly used types of fuel and was considered equal to 0.154 gCO2, eq km−1 [37]. Vehicles running on diesel, gas, and gas coupled with liquefied petroleum gas (LPG) accounted for 54.2%, 39.84%, and 5.96% of the total number of circulating cars in the autonomous province of Trento. For each type of fuel, the average emissions were calculated using the arithmetic mean of the emission values of medium-sized cars (i) used for passenger transport, (ii) class EURO 3 to EURO 6, and (iii) traveling on country roads [38]. The data are reported in Table 2.
The average distances traveled by individual users for the delivery of waste were estimated as half of the average radial distance between the collection centers and those closest to them. The average distances are presented in Table 3 and Table 4. The distances used for Scenarios 1 and 2 were 1.9 km and 2.2 km, respectively.

Emissions from Waste Utilities

The emissions contributed by waste utilities when collecting waste via door-to-door systems were calculated according to Equation (7).
CO2,eq emitted by utilities (tCO2,eq y−1) = Journeys × Em × distance
In this analysis, also considering the morphology of the territory, the use of heavy vehicles (tare weight = 3.5 t; capacity = 1.5 t) was considered based on information provided by the waste utilities. In both scenarios, 0.230 kgCO2, eq km−1 was used.
Based on the information provided by the waste utilities, in Scenario 1, the collection of UDW and OWW took place in six distinct catchment areas. The mileage of each vehicle was obtained from Google Maps©, considering the most efficient route in terms of consumption, as can be seen from Table 5. The average distance of each journey was 22.43 km. The number of journeys was calculated by dividing the annual average amount of UDW and OWW produced in Scenario 1 from 2019 to 2021 by the capacity of a single vehicle (1.5 t). The numbers of journeys for UDW and OWW collections were 2015 and 1533, respectively.
In Scenario 2, the number of journeys was calculated by dividing the annual average amount of UDW, OWW, plastic and cans, paper, and glass packaging by the capacity of a single vehicle (1.5 t). The numbers of journeys for UDW, OWW, plastic and cans, paper, and glass packaging collections were 1027, 1190, 58, 1275, and 722, respectively. For each vehicle, the mileage was obtained by dividing the total miles traveled for waste collection by the number of vehicles and journeys. The average distance of each journey was 94.9 km.

3. Results and Discussion

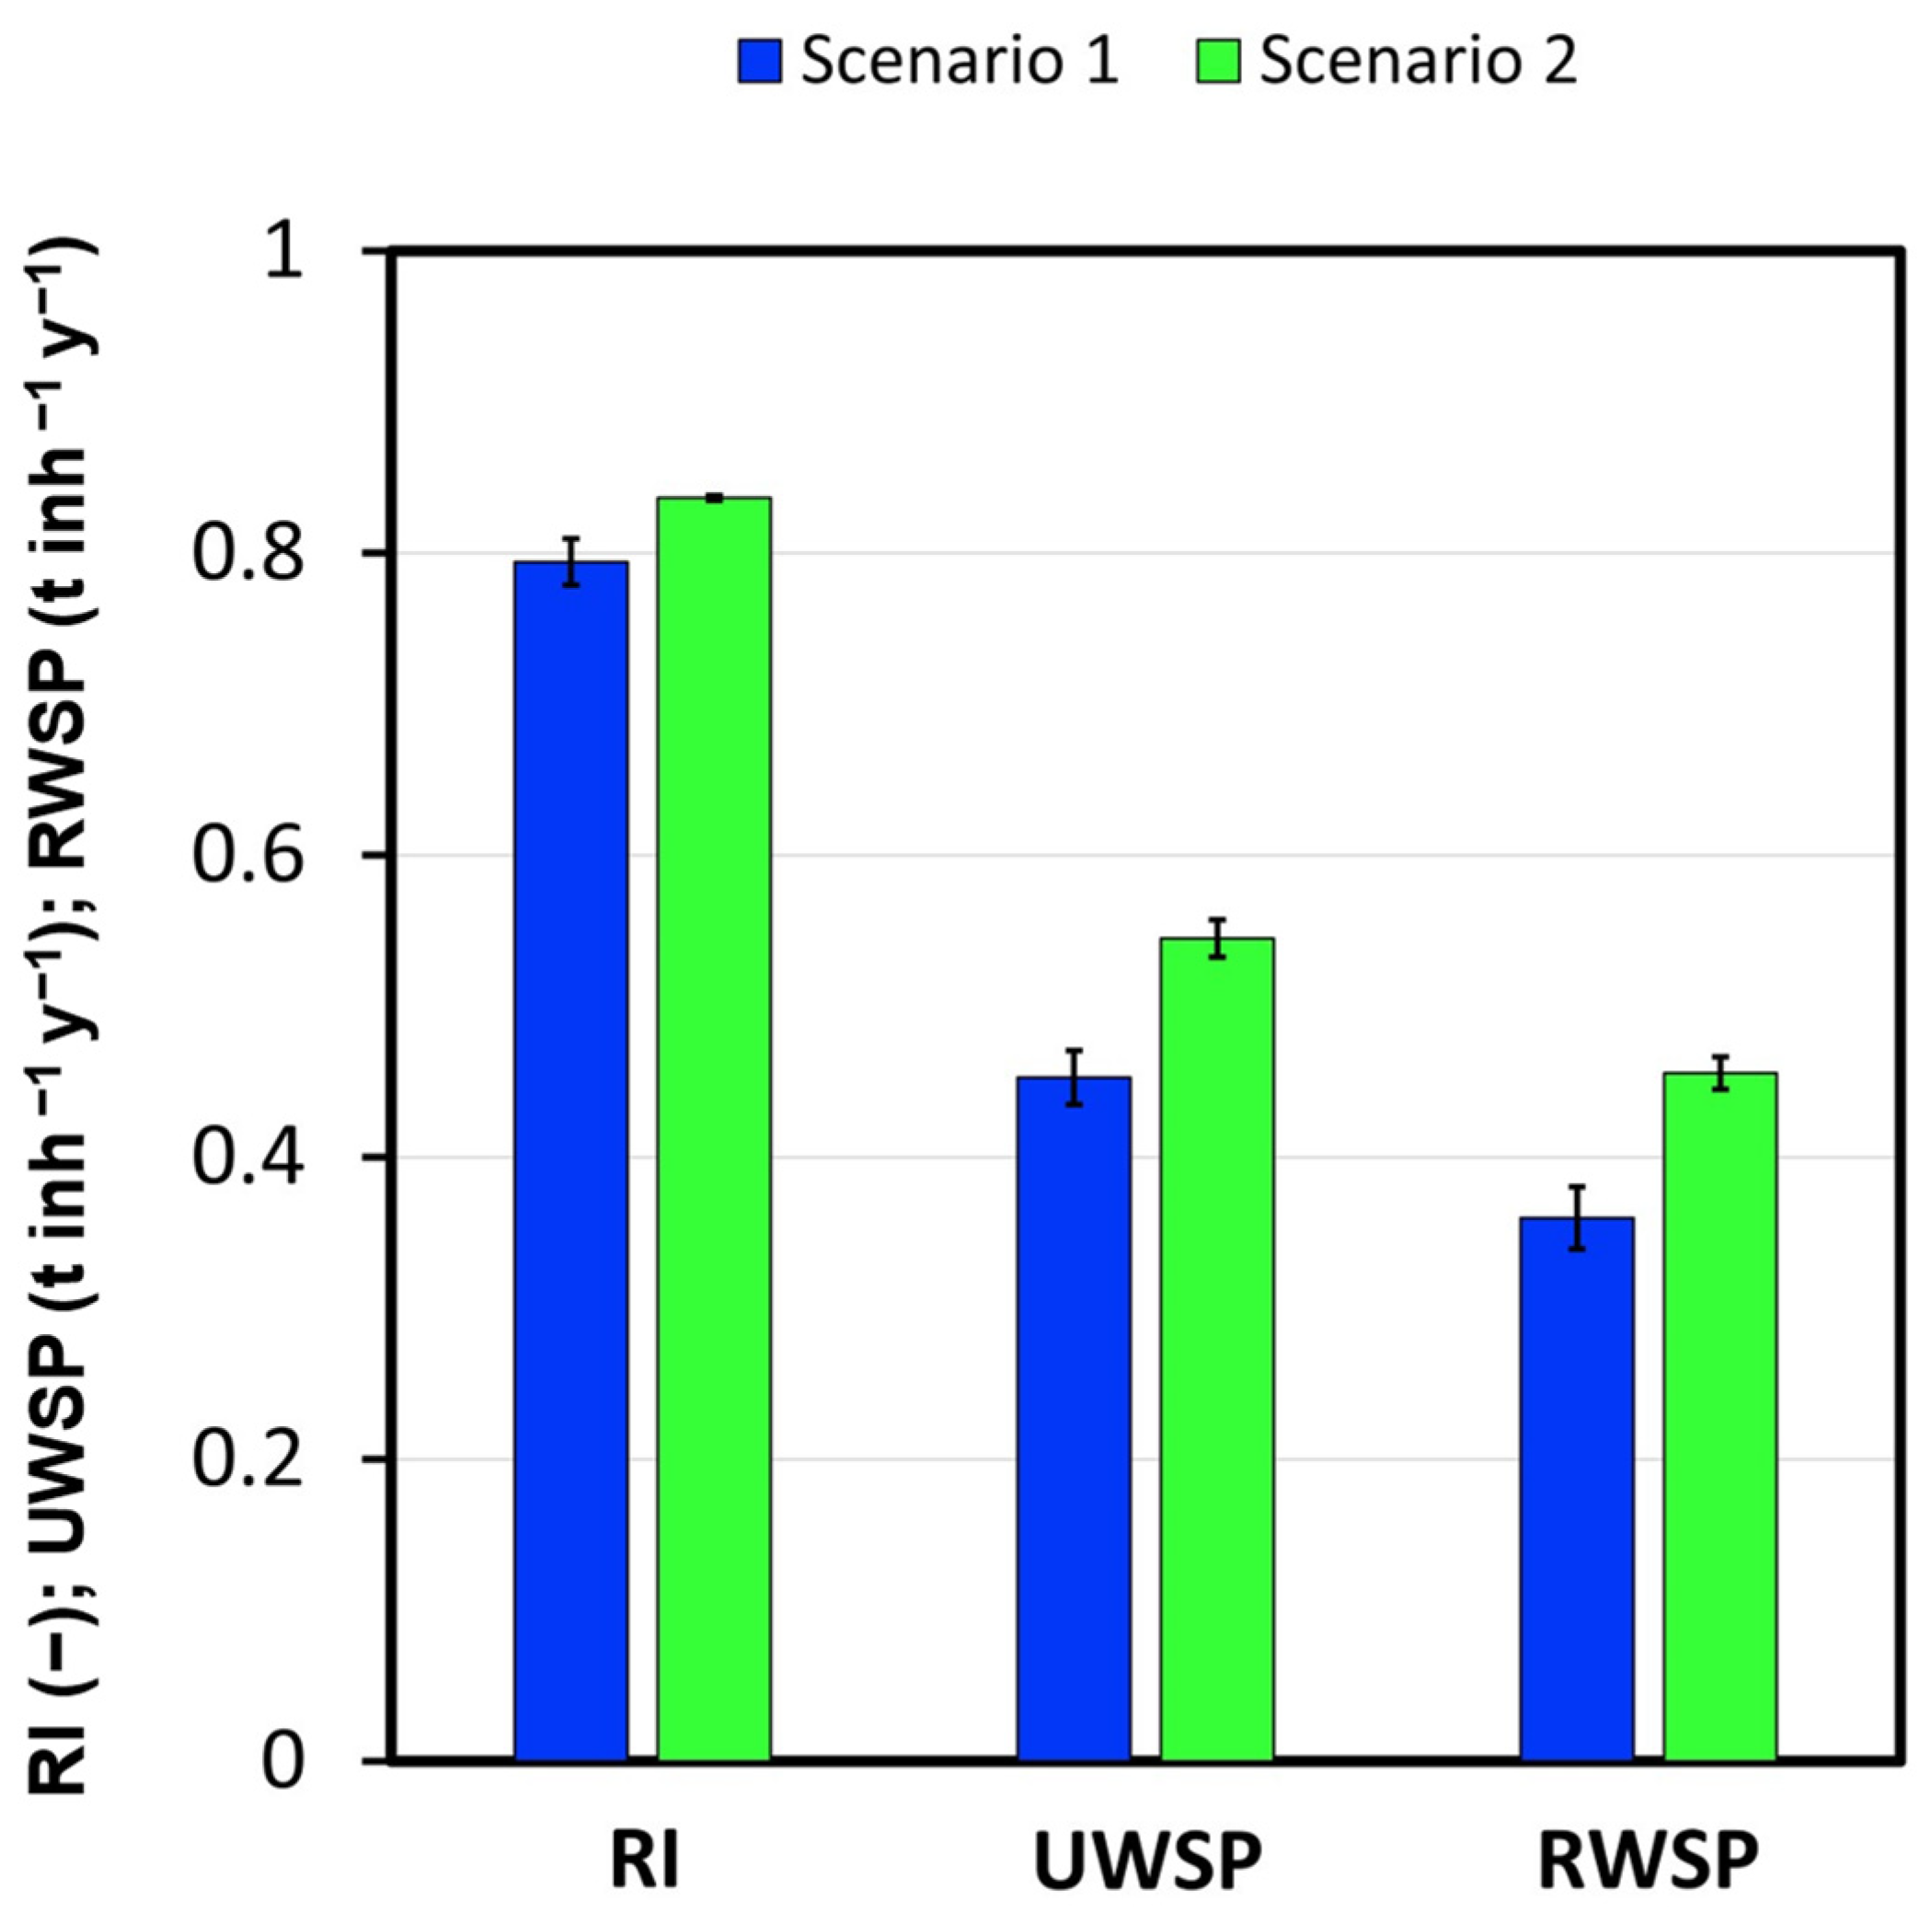
3.1. Effectiveness of Separate Waste Collection

The amount of waste produced in Scenario 1 was more significant than that produced in Scenario 2: on average, 17,833 ± 706 t y−1 and 10,972 ± 263 t y−1 were produced, respectively. However, by evaluating the data relating to the amount of waste per inhabitant (UWSP), it can be highlighted that production was lower in Scenario 1 with respect to Scenario 2 (0.45 ± 0.02 t inh−1 y−1 vs. 0.54 ± 0.01 t inh−1 y−1) (Figure 2). Those values almost agreed with the Italian average (UWSP = 0.50 t inh−1 y−1) and the southern Italian average (which comprises predominantly mountainous areas) (UWSP = 0.46 t inh−1 y−1) [39].
This result could be attributed to several factors, such as the following:
  • Tourism is more developed in the Fiemme Valley (Scenario 2) than in the Non Valley (Scenario 1) as annual non-permanent residents were, on average, more than double in Scenario 2 with respect to Scenario 1 (197,179 ± 49,100 vs. 73,934 ± 19,744, respectively) [40];
  • Better economic conditions. The average annual income in the municipalities of Scenario 2 was significantly higher than those of Scenario 1 (almost 23.8%) [41]. It has been proven that the amount and composition of waste are linked to the annual income of the population [42,43,44]. Despite it not being within the scope of the present work to investigate the influence of annual income, it is reasonable to assume that it could be a factor influencing the higher UWSP value in Scenario 2 with respect to Scenario 1.
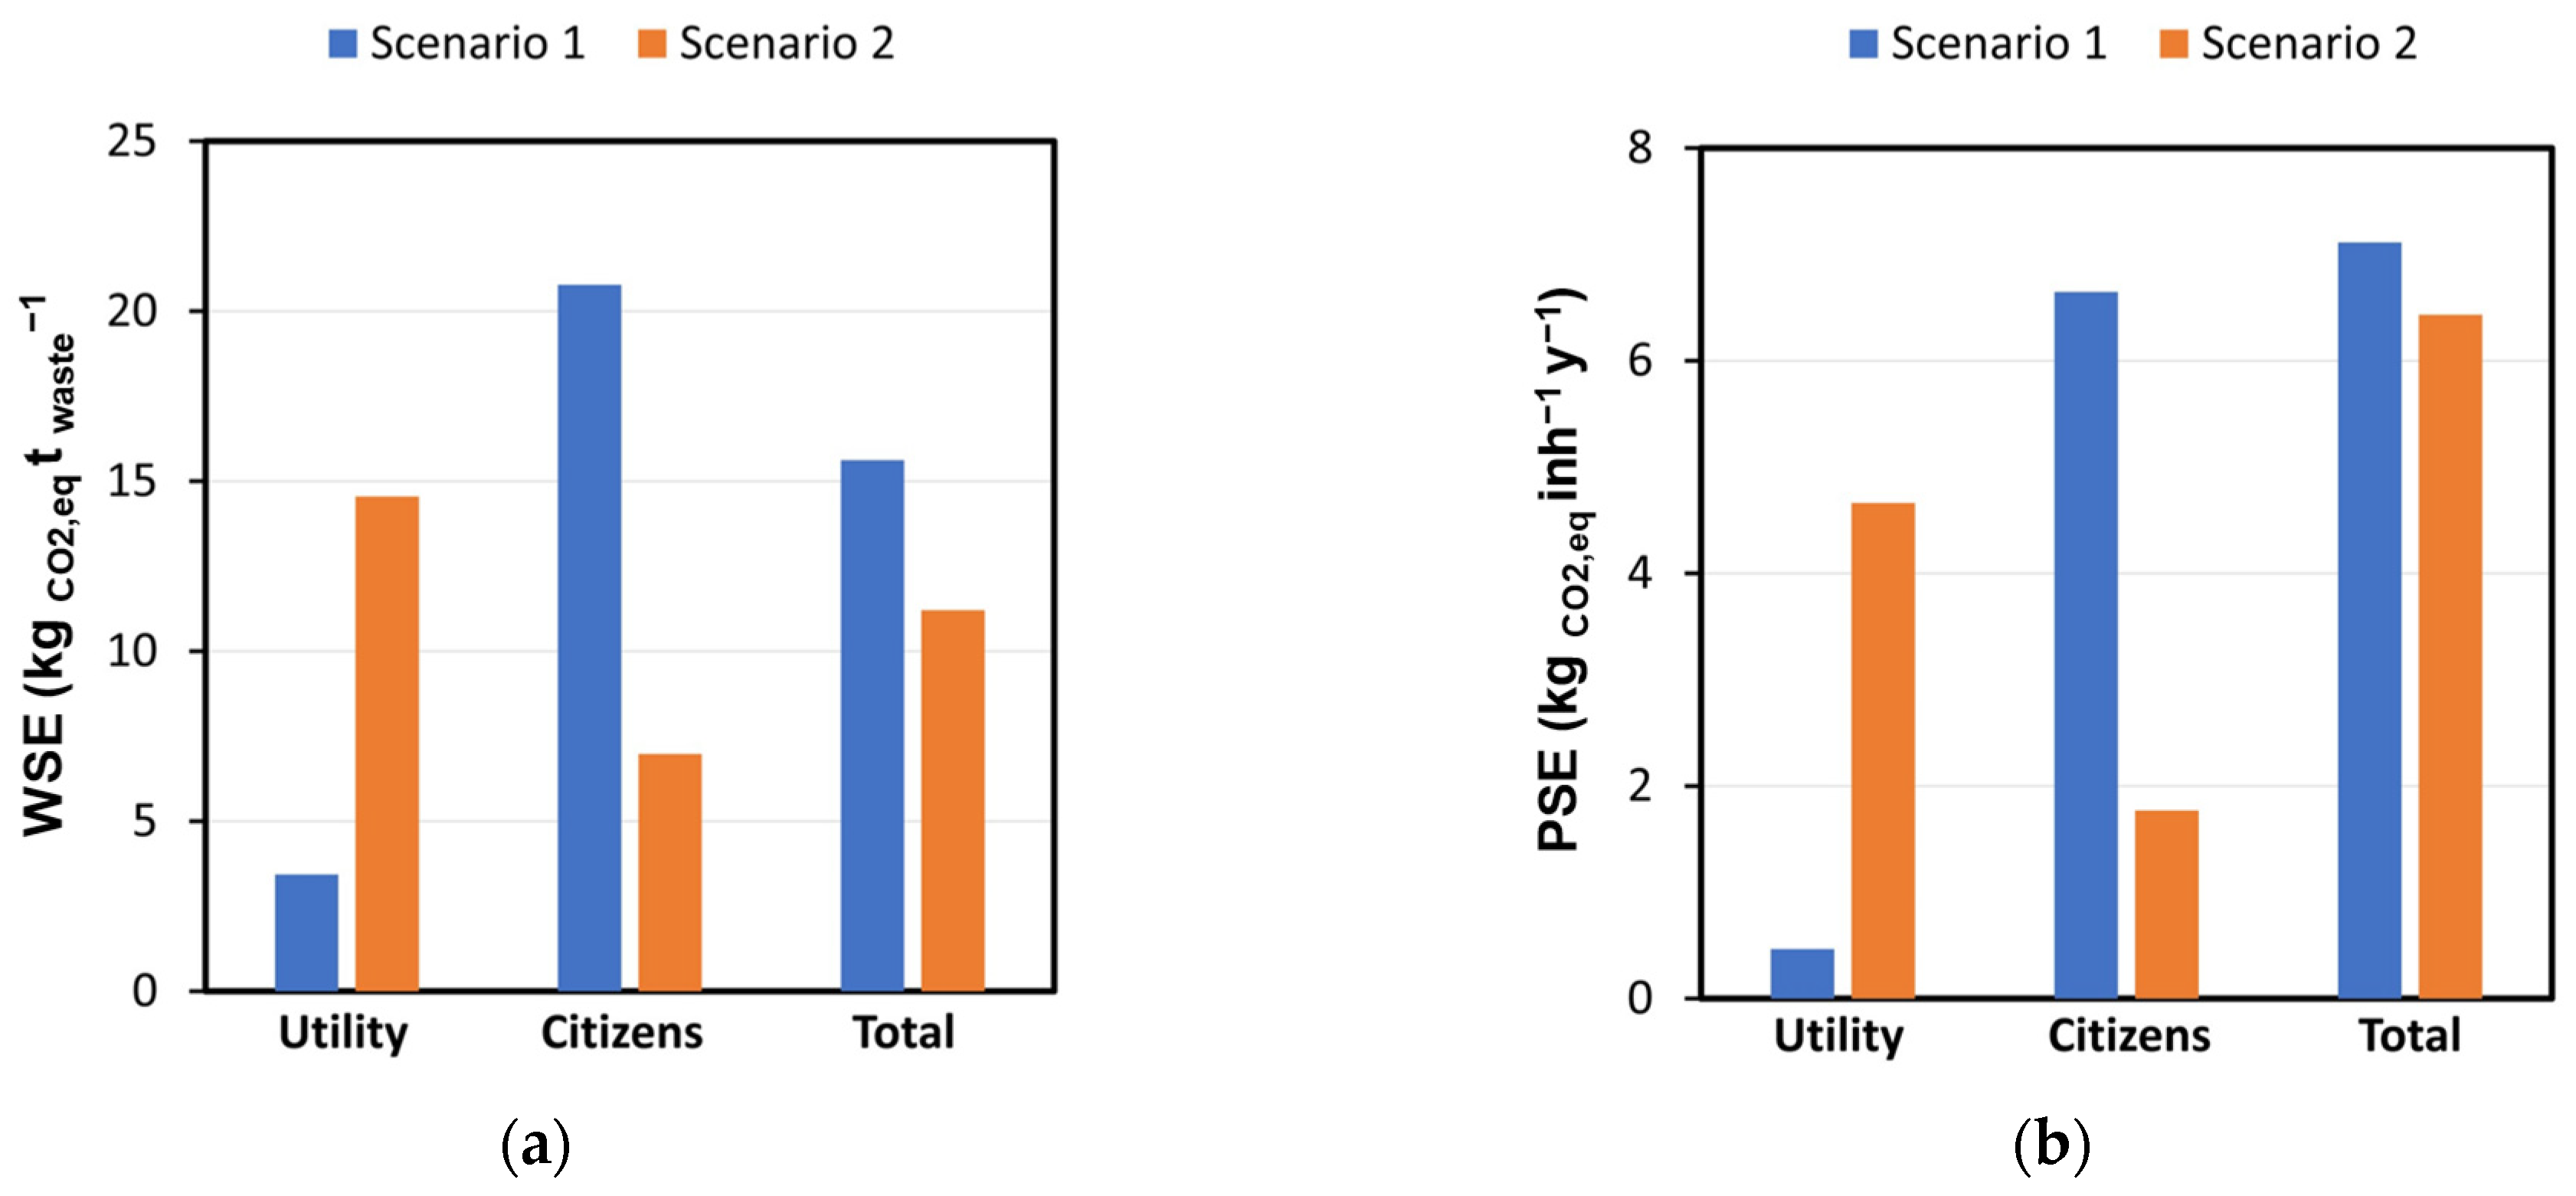
With regard to the effectiveness of the separate collection of waste (RI), the door-to-door system (Scenario 2) proved to be better than the mixed system (door-to-door + collection centers; Scenario 1), reaching 0.84 ± 0.01 vs. 0.79 ± 0.02. Also, in mountainous areas, the door-to-door system allowed for the higher performance of separate collection, as already demonstrated in previous studies on densely populated urban areas [19,45]. This result could be explained by users needing to pay more attention to the entire door-to-door system than at the collection centers. The tracking of incorrect collection was more effective in the first method.
The results of the RI and UWSP reflected the RWSP, which remained higher in Scenario 2 (0.46 ± 0.01 t inh−1 y−1 vs. 0.36 ± 0.02 t inh−1 y−1). Those values were comparable to the Italian average (RWSP 0.32 t inh−1 y−1), but they were significantly higher than averages in other predominantly mountainous areas (e.g., southern Italy, where RWSP = 0.26 t inh−1 y−1) due to the higher performance of separate collection [39].
These results also agreed with those found in an analysis of the MSW management in Bari (Italy). In that study, the better performance of door-to-door systems in comparison to that of mixed systems was confirmed, in both environmental and economic terms [23]. On the contrary, Schuch et al. [46] compared different plastic collection strategies in Austria and found that that the best performance (up to 75%) was achieved in rural areas via curbside collection.
It should be noted that the UWSP, RWSP, and RI were not affected by the COVID-19 period. During the COVID-19 pandemic, the Italian National Institute of Health applied regulations about solid waste collection in both valleys [47,48]. For COVID-positive citizens, using undifferentiated bags as the only collection tool was initially envisaged. For healthy users, however, waste disposal via separate waste collection continued as normal. As reported by the water utilities, in Scenario 1, collection centers were closed for the first two weeks of lockdown; instead, the door-to-door collection of waste materials (glass, plastic, aluminum, and paper materials) was carried out every 15 days. In the case of Scenario 2, collection centers remained closed for about a month. However, the amount of waste produced and the effectiveness of separate collection in the two scenarios were not affected.

3.2. GHG Emissions

The average annual GHG emissions for separate waste collection in Scenario 1 were two times those in Scenario 2 (279.5 tCO2, eq vs. 128.6 tCO2, eq). Looking at the specific production per ton of total waste collected and per inhabitant (WSE and PSE, respectively), the GHGs emitted in Scenario 1 remained higher than those in Scenario 2 (Figure 3).
Considering the total waste produced and collected, the WSE in Scenario 1 was almost 40% higher than that in Scenario 2 (15.62 kgCO2, eq twaste−1 vs. 11.21 kgCO2, eq twaste−1). These results were lower than those obtained by Yaman et al. [26] regarding three urban provinces in Saudi Arabia (29.14 kgCO2, eq twaste−1 on average). This difference could be due to different emission factors being considered when estimating vehicular emissions during transportation and the different types of waste collection. The full door-to-door system produced a huge amount of GHG emissions (14.55 kgCO2, eq twaste−1 and 3.44 kgCO2, eq twaste−1 in Scenarios 2 and 1, respectively), while a significantly lower amount of GHGs was emitted by citizens bringing waste to collection centers (6.98 kgCO2, eq twaste−1 vs. 20.78 kgCO2, eq twaste−1).
In terms of PSE, the full door-to-door system remained the most advantageous, with 7.11 kgCO2, eq inh−1 y−1 vs. 6.43 kgCO2, eq inh−1 y−1 being emitted in the case of the mixed collection system (Scenario 1) with respect to the full door-to-door system (Scenario 2). As for WSE, the high amount of GHGs emitted by the utility vehicles (4.66 kgCO2, eq inh−1 y−1 vs. 0.47 kgCO2, eq inh−1 y−1 in Scenarios 2 and 1, respectively) was compensated for by the significantly lower amount of GHGs emitted by citizens (1.77 kgCO2, eq inh−1 y−1 vs. 6.65 kgCO2, eq inh−1 y−1).
In terms of GHG emissions during the collection of USW, these results prove that the full door-to-door system (Scenario 2) is the best option for separate waste collection in low-population areas, such as mountainous regions. However, several actions have been suggested in the literature to reduce emissions further. In this case, considering that most of the emissions were produced by utility vehicles, the renewal of the fleet of vehicles to focus on those using alternative fuels and the optimization of collection routes could help to reduce these emissions [49].

3.3. Limitations of Study and Possible Directions for Future Research

The lack of previous in-depth studies on the topic lends significant importance to this study. However, the results obtained so far could be enriched with statistical studies. The limited dataset did not allow for a t-test or analysis of variance (ANOVA) and represents a study limitation. Therefore, this aspect should be taken into account in future analyses. A detailed study on the advantages of door-to-door systems would not only enrich the literature on the topic but would also allow an adequate amount of data to be provided to waste managers to assist them in their decision-making for operations in mountainous areas.
To ensure a detailed overall vision of the topic, further specific analyses could be derived from investigations and surveys regarding the relationship between waste disposal and daily transport for diversified activities (especially in the case of mixed waste collection systems). In this analysis, weekly (Scenario 1) and monthly (Scenario 2) deliveries by users from home were assumed and estimated. However, this assumption did not take into account the possibility of waste being taken to collection centers during journeys that were already made routinely (to reach work, go shopping, etc.). Therefore, detailed investigations could be carried out to better describe the situation of that particular case study. Moreover, further additional economic studies could be conducted to understand the relationship between environmental and economic benefits.

4. Conclusions

This study aimed to compare two separate waste collection systems in low-density areas (Alpine valleys) in terms of effectiveness and GHG emissions. In terms of separate waste collection, the results suggested that the full door-to-door system (Scenario 2) achieved better performance than the mixed collection system (door-to-door + centers; Scenario 1) (0.84 ± 0.01 vs. 0.79 ± 0.02). This result was obtained despite the higher amount of waste produced in Scenario 2 with respect to Scenario 1 (0.46 ± 0.01 t inh−1 y−1 vs. 0.36 ± 0.02 t inh−1 y−1). In terms of GHG emissions, the results proved that the full door-to-door system (Scenario 2) represented the best option for collecting separate waste in mountainous areas, with 11.21 kgCO2, eq twaste−1 emitted compared to the 15.62 kgCO2, eq twaste−1 estimated in Scenario 1. The high amount of GHGs emitted by utility vehicles (4.66 kgCO2, eq inh−1 y−1 in Scenario 2 vs. 0.47 kgCO2, eq inh−1 y−1 in Scenario 1) was fully compensated for by the significantly lower amount of GHGs emitted by citizens (−66% for WSE and −73% for PSE).

Author Contributions

Conceptualization, L.M. and E.C.R.; methodology, L.M., A.P.D.B. and E.C.R.; validation, M.C.M., V.T. and E.C.R.; formal analysis, L.M. and A.P.D.B.; investigation, L.M. and A.P.D.B.; resources, L.M. and E.C.R.; data curation, L.M. and A.P.D.B.; writing—original draft preparation, L.M. and A.P.D.B.; writing—review and editing, L.M., A.P.D.B., M.C.M., V.T. and E.C.R.; visualization, L.M., A.P.D.B., M.C.M., V.T. and E.C.R.; supervision, V.T. and E.C.R. All authors have read and agreed to the published version of the manuscript.

Funding

This research received no external funding.

Data Availability Statement

All data generated or analyzed during this study are included in this published article.

Conflicts of Interest

The authors declare no conflicts of interest.

Abbreviations

CE, Circular Economy; GHG, greenhouse gas; LCA, life cycle assessment; MCDA, multicriteria decision analysis; MSW, municipal soldi waste; NRW, annual production of non-recyclable waste; OWW, organic wet waste; RI, recyclable collection index; RW, annual production of recyclable waste; SC, separate collection; SDG: Sustainable Development Goal; TW, annual production of total waste; UDW, urban dry waste: USE, user-specific emissions index; USW, urban solid waste; UWSPI, urban waste-specific production index; RWSPI, recyclable waste-specific production index; WSE, waste-specific emissions index.

Appendix A

Table A1. European waste codes (EWCs) of RW.
Waste TypeEWC CodeEWC Description
Paper and cardboard15 01 01Paper and cardboard packaging
20 01 01Paper and cardboard waste
Plastic15 01 02Plastic packaging
20 01 39Plastic
02 01 04Waste plastics (except packaging)
Glass15 01 07Glass packaging
20 01 02Glass

References

  1. Shah, A.V.; Srivastava, V.K.; Mohanty, S.S.; Varjani, S. Municipal Solid Waste as a Sustainable Resource for Energy Production: State-of-the-Art Review. J. Environ. Chem. Eng. 2021, 9, 105717. [Google Scholar] [CrossRef]
  2. Ebrahimian, F.; Karimi, K. Efficient Biohydrogen and Advanced Biofuel Coproduction from Municipal Solid Waste through a Clean Process. Bioresour. Technol. 2020, 300, 122656. [Google Scholar] [CrossRef]
  3. Zhang, X.; Liu, C.; Chen, Y.; Zheng, G.; Chen, Y. Source Separation, Transportation, Pretreatment, and Valorization of Municipal Solid Waste: A Critical Review. Environ. Dev. Sustain. 2022, 24, 11471–11513. [Google Scholar] [CrossRef]
  4. Salmenperä, H.; Pitkänen, K.; Kautto, P.; Saikku, L. Critical Factors for Enhancing the Circular Economy in Waste Management. J. Clean. Prod. 2021, 280, 124339. [Google Scholar] [CrossRef]
  5. Agovino, M.; Garofalo, A.; Mariani, A. Effects of Environmental Regulation on Separate Waste Collection Dynamics: Empirical Evidence from Italy. J. Clean. Prod. 2016, 124, 30–40. [Google Scholar] [CrossRef]
  6. EU. Directive 2008/98/EC of the European Parliament and of the Council of 19 November 2008 on Waste and Repealing Certain Directives; European Parliament and European Council: Strasbourg, France, 2008. [Google Scholar]
  7. EU. Directive (EU) 2018/852 of the European Parliament and of the Council of 30 May 2018 Amending Directive 94/62/EC on Packaging and Packaging Waste; European Parliament and European Council: Strasbourg, France, 2018. [Google Scholar]
  8. EU. Directive (EU) 2018/851 of the European Parliament and of the Council of 30 May 2018 Amending Directive 2008/98/EC on Waste; European Parliament and European Council: Strasbourg, France, 2018. [Google Scholar]
  9. EU. Directive (EU) 2018/850 of the European Parliament and of the Council of 30 May 2018 Amending Directive 1999/31/EC on the Landfill of Waste; European Parliament and European Council: Strasbourg, France, 2018. [Google Scholar]
  10. EU. Directive (EU) 2018/849 of the European Parliament and of the Council of 30 May 2018 Amending Directives 2000/53/EC on End-of-Life Vehicles, 2006/66/EC on Batteries and Accumulators and Waste Batteries and Accumulators, and 2012/19/EU on Waste Electrical and Electronic Equipment; European Parliament and European Council: Strasbourg, France, 2018. [Google Scholar]
  11. IP. Legislative Decree of 3 April 2006, No. 152; Environmental Regulations; Italian Parliament: Rome, Italy, 2006. (In Italian) [Google Scholar]
  12. Farzadkia, M.; Mahvi, A.H.; Norouzian Baghani, A.; Sorooshian, A.; Delikhoon, M.; Sheikhi, R.; Ashournejad, Q. Municipal Solid Waste Recycling: Impacts on Energy Savings and Air Pollution. J. Air Waste Manag. Assoc. 2021, 71, 737–753. [Google Scholar] [CrossRef]
  13. Kumar, S. Composting of Municipal Solid Waste. Crit. Rev. Biotechnol. 2011, 31, 112–136. [Google Scholar] [CrossRef]
  14. Idumah, C.I.; Nwuzor, I.C. Novel Trends in Plastic Waste Management. SN Appl. Sci. 2019, 1, 1402. [Google Scholar] [CrossRef]
  15. Torretta, V.; Tolkou, A.K.; Katsoyiannis, I.A.; Caccamo, F.M.; Miino, M.C.; Baldi, M.; Collivignarelli, M.C. Enhancement of Methanogenic Activity in Volumetrically Undersized Reactor by Mesophilic Co-Digestion of Sewage Sludge and Aqueous Residue. Sustainability 2021, 13, 7728. [Google Scholar] [CrossRef]
  16. Moya, D.; Aldás, C.; López, G.; Kaparaju, P. Municipal Solid Waste as a Valuable Renewable Energy Resource: A Worldwide Opportunity of Energy Recovery by Using Waste-To-Energy Technologies. Energy Procedia 2017, 134, 286–295. [Google Scholar] [CrossRef]
  17. Scarlat, N.; Fahl, F.; Dallemand, J.-F. Status and Opportunities for Energy Recovery from Municipal Solid Waste in Europe. Waste Biomass Valor. 2019, 10, 2425–2444. [Google Scholar] [CrossRef]
  18. Viotti, P.; Di Genova, P.; Falcioli, F. Numerical Analysis of the Anaerobic Co-Digestion of the Organic Fraction from Municipal Solid Waste and Wastewater: Prediction of the Possible Performances at Olmeto Plant in Perugia (Italy). Waste Manag. Res J. A Sustain. Circ. Econ. 2004, 22, 115–128. [Google Scholar] [CrossRef] [PubMed]
  19. Botti, L.; Battini, D.; Sgarbossa, F.; Mora, C. Door-to-Door Waste Collection: Analysis and Recommendations for Improving Ergonomics in an Italian Case Study. Waste Manag. 2020, 109, 149–160. [Google Scholar] [CrossRef] [PubMed]
  20. Gallardo, A.; Bovea, M.D.; Colomer, F.J.; Prades, M. Analysis of Collection Systems for Sorted Household Waste in Spain. Waste Manag. 2012, 32, 1623–1633. [Google Scholar] [CrossRef] [PubMed]
  21. Calabrò, P.S.; Komilis, D. A Standardized Inspection Methodology to Evaluate Municipal Solid Waste Collection Performance. J. Environ. Manag. 2019, 246, 184–191. [Google Scholar] [CrossRef] [PubMed]
  22. Ragazzi, M.; Fedrizzi, S.; Rada, E.C.; Ionescu, G.; Ciudin, R.; Cioca, L.I. Experiencing Urban Mining in an Italian Municipality towards a Circular Economy vision. Energy Procedia 2017, 119, 192–220. [Google Scholar] [CrossRef]
  23. Gadaleta, G.; De Gisi, S.; Todaro, F.; Campanaro, V.; Teodosiu, C.; Notarnicola, M. Sustainability Assessment of Municipal Solid Waste Separate Collection and Treatment Systems in a Large Metropolitan Area. Sustain. Prod. Consum. 2022, 29, 328–340. [Google Scholar] [CrossRef]
  24. Põldnurk, J. Optimisation of the Economic, Environmental and Administrative Efficiency of the Municipal Waste Management Model in Rural Areas. Resour. Conserv. Recycl. 2015, 97, 55–65. [Google Scholar] [CrossRef]
  25. Agovino, M.; Musella, G. Separate Waste Collection in Mountain Municipalities. A Case Study in Campania. Land Use Policy 2020, 91, 104408. [Google Scholar] [CrossRef]
  26. Yaman, C.; Anil, I.; Jaunich, M.K.; Blaisi, N.I.; Alagha, O.; Yaman, A.B.; Gunday, S.T. Investigation and Modelling of Greenhouse Gas Emissions Resulting from Waste Collection and Transport Activities. Waste Manag. Res. 2019, 37, 1282–1290. [Google Scholar] [CrossRef]
  27. Zhang, K.; Cui, J.; Zhou, Y.; Ouyang, C.; Palocz-Andresen, M.; Lou, Z. GHG emissions reduction patterns from waste sectors after forced source separation. Process Saf. Environ. Prot. 2023, 180, 443–450. [Google Scholar] [CrossRef]
  28. Teng, H.; Zhou, K. Designing a sustainable collection and transportation routes for domestic wastes in the agro-pastoral ecotone of the Tibetan Plateau. J. Environ. Manag. 2023, 347, 119130. [Google Scholar] [CrossRef] [PubMed]
  29. Sousa, V.; Drumond, A.; Meireles, I. Fuel consumption rate and emissions variability in waste collection services routes: Case study of Cascais Ambiente. Environ. Sci. Pollut. Res. 2023. [Google Scholar] [CrossRef] [PubMed]
  30. Moora, H.; Urbel-Piirsalu, E.; Voronova, V. The Climate Change Impact of Possible Municipal Solid Waste Management Scenarios in Estonia. Linnaeus Eco-Tech. 2017, 78–89. [Google Scholar] [CrossRef]
  31. Chen, Y.-C.; Lo, S.-L. Evaluation of Greenhouse Gas Emissions for Several Municipal Solid Waste Management Strategies. J. Clean. Prod. 2016, 113, 606–612. [Google Scholar] [CrossRef]
  32. Calabrò, P.S. Greenhouse Gases Emission from Municipal Waste Management: The Role of Separate Collection. Waste Manag. 2009, 29, 2178–2187. [Google Scholar] [CrossRef]
  33. Korkut, N.E.; Yaman, C.; Küçükağa, Y.; Jaunich, M.K.; Demir, İ. Greenhouse Gas Contribution of Municipal Solid Waste Collection: A Case Study in the City of Istanbul, Turkey. Waste Manag. Res. J. A Sustain. Circ. Econ. 2018, 36, 131–139. [Google Scholar] [CrossRef] [PubMed]
  34. Rada, E.; Zatelli, C.; Cioca, L.; Torretta, V. Selective Collection Quality Index for Municipal Solid Waste Management. Sustainability 2018, 10, 257. [Google Scholar] [CrossRef]
  35. Ranieri, E.; Rada, E.C.; Ragazzi, M.; Masi, S.; Montanaro, C. Critical Analysis of the Integration of Residual Municipal Solid Waste Incineration and Selective Collection in Two Italian Tourist Areas. Waste Manag. Res. J. A Sustain. Circ. Econ. 2014, 32, 551–555. [Google Scholar] [CrossRef]
  36. ISTAT. Statistical Data for the Territory of the Autonomous Province of Trento. Available online: https://www.istat.it/it/files/2020/05/04_Trento_Scheda.pdf (accessed on 13 November 2023). (In Italian).
  37. MIT. Open Data | Vehicles Circulating in the Autonomous Province of Trento. Available online: https://dati.mit.gov.it/catalog/dataset (accessed on 13 November 2023). (In Italian)
  38. ISPRA. The Database of Average Emission Factors for Road Transport in Italy. Available online: https://fetransp.isprambiente.it/#/home (accessed on 13 November 2023). (In Italian).
  39. ISPRA. Municipal Waste Report 2022 Edition; Rome. 2022. Available online: https://www.isprambiente.gov.it/it/pubblicazioni/rapporti/rapporto-rifiuti-urbani-edizione-2022 (accessed on 15 November 2023). (In Italian)
  40. ISPAT. Monthly Tourist Movement. Available online: https://statweb.provincia.tn.it/movTuristico/ (accessed on 14 November 2023). (In Italian).
  41. Comuni Italiani Data on Taxable Income for Natural Persons for the Purposes of Additional Income Tax for Municipalities in the Province of Trento. Elaboration on Data from the Ministry of Economy and Finance Relating to the 2016 Tax Year. Available online: http://www.comuni-italiani.it/022/statistiche/redditic2016.html (accessed on 14 November 2023). (In Italian).
  42. Zambrano-Monserrate, M.A.; Ruano, M.A.; Ormeño-Candelario, V. Determinants of Municipal Solid Waste: A Global Analysis by Countries’ Income Level. Environ. Sci. Pollut. Res. 2021, 28, 62421–62430. [Google Scholar] [CrossRef]
  43. Khan, D.; Kumar, A.; Samadder, S.R. Impact of Socioeconomic Status on Municipal Solid Waste Generation Rate. Waste Manag. 2016, 49, 15–25. [Google Scholar] [CrossRef] [PubMed]
  44. Ozcan, H.; Guvenc, S.; Guvenc, L.; Demir, G. Municipal Solid Waste Characterization According to Different Income Levels: A Case Study. Sustainability 2016, 8, 1044. [Google Scholar] [CrossRef]
  45. Teerioja, N.; Moliis, K.; Kuvaja, E.; Ollikainen, M.; Punkkinen, H.; Merta, E. Pneumatic vs. Door-to-Door Waste Collection Systems in Existing Urban Areas: A Comparison of Economic Performance. Waste Manag. 2012, 32, 1782–1791. [Google Scholar] [CrossRef] [PubMed]
  46. Schuch, D.; Lederer, J.; Fellner, J.; Scharff, C. Separate Collection Rates for Plastic Packaging in Austria—A Regional Analysis Taking Collection Systems and Urbanization into Account. Waste Manag. 2023, 155, 211–219. [Google Scholar] [CrossRef]
  47. ISS Environment and Waste Working Group. Interim Indications for the Management of Municipal Waste in Relation to the Transmission of the SARS-CoV-2 Virus Infection; ISS COVID-19 Report, n. 3/2020 Rev. 2; ISS Environment and Waste Working Group: Rome, Italy, 2020. (In Italian) [Google Scholar]
  48. Karaeva, A.; Conti, F.; Torretta, V.; Ghiringheli, G.; Magaril, E.R.; Rada, E.C. MSW Management in a Lacustrine Area: Circular Economy Criteria and Effects of COVID-19 Emergency. In Proceedings of the 2021 10th International Conference on Energy and Environment, Bucharest, Romania, 14–15 October 2021. [Google Scholar] [CrossRef]
  49. Apaydin, O.; Gonullu, M.T. Emission Control with Route Optimization in Solid Waste Collection Process: A Case Study. Sadhana 2008, 33, 71–82. [Google Scholar] [CrossRef]
Figure 1. Types of waste collection in the two scenarios. UDW, urban dry waste; OWW, organic wet waste.
Resources 13 00017 g001
Figure 2. RI, UWSP, and RWSP in Scenarios 1 and 2. The bars represent the confidence intervals. Number of data = 3.
Resources 13 00017 g002
Figure 3. (a) WSE and (b) PSE for Scenarios 1 and 2.
Resources 13 00017 g003
Table 1. Localities of the collection centers in Scenarios 1 and 2.
Collection CentersLocalities
Scenario 1
S1_CC1Castelfondo
S1_CC2Brez
S1_CC3Rumo
S1_CC4Cavareno
S1_CC5Sarnonico
S1_CC6Cis
S1_CC7Ruffré-Mendola
S1_CC8Cloz
S1_CC9Coredo
S1_CC10Denno
S1_CC11Bresimo
S1_CC12Romallo
S1_CC13Tassullo
S1_CC14Flavon
S1_CC15Sanzeno
S1_CC16Iscle
S1_CC17Sporminore
S1_CC18Vervò
S1_CC19Cles
S1_CC20Taio
S1_CC21Ton
Scenario 2
S2_CC1Medoina
S2_CC2Tesero
S2_CC3Ville di Fiemme
S2_CC4Ziano
S2_CC5Predazzo
Table 2. Average emissions for different types of fuel. The emissions for each class were taken from [38]. LPG, liquefied petroleum gas.
Fuel TypeEmissions per Class
(g km−1)
Average Emissions
(g km−1)
DieselEURO 3144.55144.26
EURO 4147.60
EURO 5143.88
EURO 6141.02
GasEURO 3167.77169.96
EURO 4175.07
EURO 5169.23
EURO 6167.76
Gas + LPGEURO 3144.04138.22
EURO 4144.64
EURO 5129.99
EURO 6134.21
Table 3. The radial distances between the collection centers and those closest to them in Scenario 1. To relate each collection center to the proper location, refer to Table 1.
Collection CentersDistance
(km)
FromTo
S1_CC1S1_CC2 3.6
S1_CC1S1_CC39.6
S1_CC1S1_CC53.4
S1_CC4S1_CC74.2
S1_CC4S1_CC53
S1_CC6S1_CC113.2
S1_CC6S1_CC34.2
S1_CC8S1_CC2 2.2
S1_CC9S1_CC131.2
S1_CC10S1_CC142.6
S1_CC10S1_CC161.2
S1_CC12S1_CC45.4
S1_CC12S1_CC83.2
S1_CC12S1_CC66
S1_CC15S1_CC121.6
S1_CC5S1_CC73.6
S1_CC5S1_CC2 3.4
S1_CC17S1_CC215.8
S1_CC17S1_CC105
S1_CC20S1_CC184.4
S1_CC20S1_CC92.4
S1_CC13S1_CC193
S1_CC13S1_CC154
S1_CC21S1_CC102.4
Table 4. The radial distance between the collection centers and those closest to them in Scenario 2. To relate each collection center to the proper location, refer to Table 1.
Collection CentersDistance
(km)
FromTo
S2_CC1S2_CC25.4
S2_CC1S2_CC34.8
S2_CC4S2_CC24.2
S2_CC4S2_CC53
Table 5. The average distance covered in each catchment area in Scenario 1.
No.Catchment Area LocalitiesDistance (km)
1Bresimo, Brez, Cagnò, Castelfondo, Cis, Cloz, Livo, Revò, Romallo, Rumo40.8
2Amblar, Cavareno, Don, Fondo, Malosco, Ronzone, Ruffreé, Sarnonico19
3Cles2
4Dambel, Nanno, Romeno, Sanzeno, Tassullo, Ton35.3
5Coredo, Sfruz, Smarano, Taio, Tres, Vervò16.9
6Campodenno, Cunevo, Denno, Flavon, Sporminore, Terres, Tuenno20.6
Disclaimer/Publisher’s Note: The statements, opinions and data contained in all publications are solely those of the individual author(s) and contributor(s) and not of MDPI and/or the editor(s). MDPI and/or the editor(s) disclaim responsibility for any injury to people or property resulting from any ideas, methods, instructions or products referred to in the content.

