Abstract
The restoration of aging sewer networks is a fundamental remediation approach with the aim of renewing or improving existing systems. Remediation methods include repair, renovation, and replacement (renewal). The restoration of a sewer network itself can be performed using either excavation or trenchless technologies. While these technologies offer various advantages, they also present disadvantages. The choice of a restoration technology depends on numerous parameters, including economic factors and local conditions (such as the construction of the existing sewage network, available working space, traffic load, and environmental safety restrictions). In addition to the parameters influencing the choice of restoration technology, recent considerations have been given to constraints related to greenhouse gas emissions and the corresponding carbon footprint. Carbon footprint serves as an indicator of the restoration activity’s dependence on fossil fuels, both during implementation and operation. In the 21st century, concerns regarding carbon footprints have rapidly escalated. The reduction in carbon footprints is a crucial objective from both an economic and an ecological point of view. This article specifically addresses the prospects of monitoring the carbon footprint concerning the partial restoration of a sewer network within the historical core of the city of Brno, located in the Czech Republic. This aspect constitutes the unique and innovative contribution of the paper. The intensity of the energy demand of excavation and trenchless technologies is utilized as a direct measure of the carbon footprint of each technology. The comparative assessment demonstrates that the trenchless technology used achieves a reduction of 59.2% in CO2 emissions compared to the excavation technology. The carbon footprint of Variant 1 (trenchless technology) is 9.91 t CO2 eq., while the carbon footprint of Variant 2 (excavation technology) is 24.29 t CO2 eq. The restoration of open pipelines produces more emissions due to the higher energy consumption, making it more expensive in terms of fuel costs, waste disposal costs, and the corresponding environmental hazards.
1. Introduction
Human activities in various sectors, including transportation, the food industry, and the construction industry, directly or indirectly release greenhouse gases (GHGs) and deplete natural resources. Regarding GHG emissions, governments have recently committed to limiting them, as evident during the UN Climate Summit (COP26) in Glasgow, Scotland, in November 2021 [1]. Regarding the sustainable use of natural resources, one may refer to the EU Council Regulation (No.) 305/2011 [2], which establishes uniform conditions (basic requirements for construction) for placing construction products on the market. This regulation incorporates a requirement for the sustainable use of resources: “The building must be designed, constructed, and demolished in such a way as to ensure the sustainable use of natural resources.” The EU Council regulation emphasizes the recyclability and durability of buildings and the use of environmentally friendly materials [2]. To demonstrate compliance with this regulation, a life cycle assessment and an Environmental Product Declaration are required. A component of the results of these assessments is the determination of the carbon footprint indicator [3].
Sewer networks play a crucial role in environmental protection, particularly in the preservation of groundwater. They are essential for mitigating the adverse environmental consequences resulting from substandard sanitation and wastewater management. The construction of well-designed sewer networks not only facilitates effective containment and treatment of wastewater, but also acts as a barrier against contamination of groundwater, a critical resource for both human consumption and ecosystem stability. However, despite their substantial advantages, sewer networks are not exempt from challenges, notably leaky sewers. Such leakage can facilitate the infiltration of pollutants into soil and groundwater, posing a potential hazard to water quality. Therefore, efficient development and maintenance of sewer networks are imperative not only to uphold environmental integrity, but also to safeguard groundwater reservoirs [4,5,6]. In the field of construction, as in many other sectors, the use of Environmental Product Declarations in construction regulations is still in its early stages in most EU countries. However, in countries such as Germany, Italy, and Norway, the use of Environmental Product Declarations is already at a high level and aligns with the life cycle assessment method [7]. Determining the carbon footprint of a specific type of construction requires numerous external data points, which do not necessarily have a direct dependence on each other. This indicator may not always be a priority in assessing the environmental friendliness of a material, product, or construction [8,9].
The reasons for monitoring the carbon footprint from a company’s perspective are primarily as follows [10,11]:
- Business development: the company establishes its main objectives while conducting audits and reducing its environmental impact.
- Parent organization reporting: the subsidiary’s carbon footprint is a component of the broader business performance indicator for the parent organization.
- Requests from customers and suppliers: customers and suppliers seek information about the company’s carbon footprint.
- Investor interests: an increasing number of companies provide data on their carbon (and possibly water) footprint in the global Carbon Disclosure Project database, which collects information for investor use.
- Cost savings: identifying which part of business activities consumes the most energy and resources and where cost reductions can be pursued.
- Risk reduction: preparation for potential increases in fossil energy prices and their incorporation into business planning.
- Business expansion: cost savings contribute to increased competitiveness and business expansion.
Excavation and trenchless technologies are commonly used in the construction sector, such as to restore sewer networks. Numerous factors influence the trade-off between these technologies [12,13,14,15], with GHG emissions and carbon footprints being among them [16,17]. The term “carbon footprint” represents the sum of all GHGs and serves as a control indicator for assessing the impact of human activities on the environment. Carbon footprint can be measured at various levels: national, municipal, individual, corporate, or at the level of a specific activity [18,19]. It serves as an indicator of the consumption of energy, products, and services and provides a measure of the environmental impact, particularly in terms of global warming [10,20,21]. Essentially, carbon footprint reflects the extent to which human activities rely on fossil fuels, both during implementation and continued operation [22,23,24]. Given the rapid growth in efforts to reduce the carbon footprint in the 21st century, this information is increasingly important from both ecological and economic perspectives. Public awareness of the need to reduce the carbon footprint is spreading rapidly [9,25,26].
The increasing global awareness of climate change and its implications has generated a compelling need not only to recognize the environmental impact of various industries, but also to develop innovative business models and technologies aimed at significantly reducing carbon emissions [27,28]. This article is dedicated to a thorough exploration of carbon footprint measurement and places a pivotal emphasis on the critical role of such measurement within the specific context of the Czech Republic. To illustrate this, we use the renewal of a partial sewage network as a case study, as it provides an excellent opportunity to delve into the potential for carbon emission reduction. One pioneering aspect of this study is its particular focus on comparing the carbon footprints between conventional excavation methods and cutting-edge trenchless technologies. Through a comprehensive analysis and precise quantification of the energy intensity and ensuing carbon emissions associated with both approaches, this research endeavors to highlight the substantial environmental advantages and novel advancements that adopting trenchless technologies in sewage network renewal can offer. In this way, it contributes significantly to the broader discourse on sustainable infrastructure development and reinforces the paramount importance of adopting environmentally friendly practices within the field of civil engineering. This study not only enriches our understanding of carbon emissions in infrastructure projects, but also underscores the practical importance of transitioning towards more eco-friendly techniques. Consequently, it is a highly valuable reference for stakeholders, policymakers, and environmentalists dedicated to achieving a greener and more sustainable future.
Considering the aforementioned goals, we propose the following hypotheses, which are examined in this study to assess the impact and feasibility of trenchless technologies in reducing the carbon footprint of sewage network renewal in the Czech Republic:
- The implementation of trenchless technologies in sewage network renewal will result in a significantly lower carbon footprint compared to conventional excavation methods.
- The comprehensive analysis and quantification of the intensity of the energy and associated carbon emissions will reveal specific advantages and novel advancements in the adoption of trenchless technologies for sewage network renewal.
- The application of environmentally friendly practices in civil engineering, particularly in sewage network renewal, will lead to a substantial reduction in carbon emissions.
2. Overview of Technologies for the Restoration of Sewer Networks
2.1. Restoration of Sewer Networks
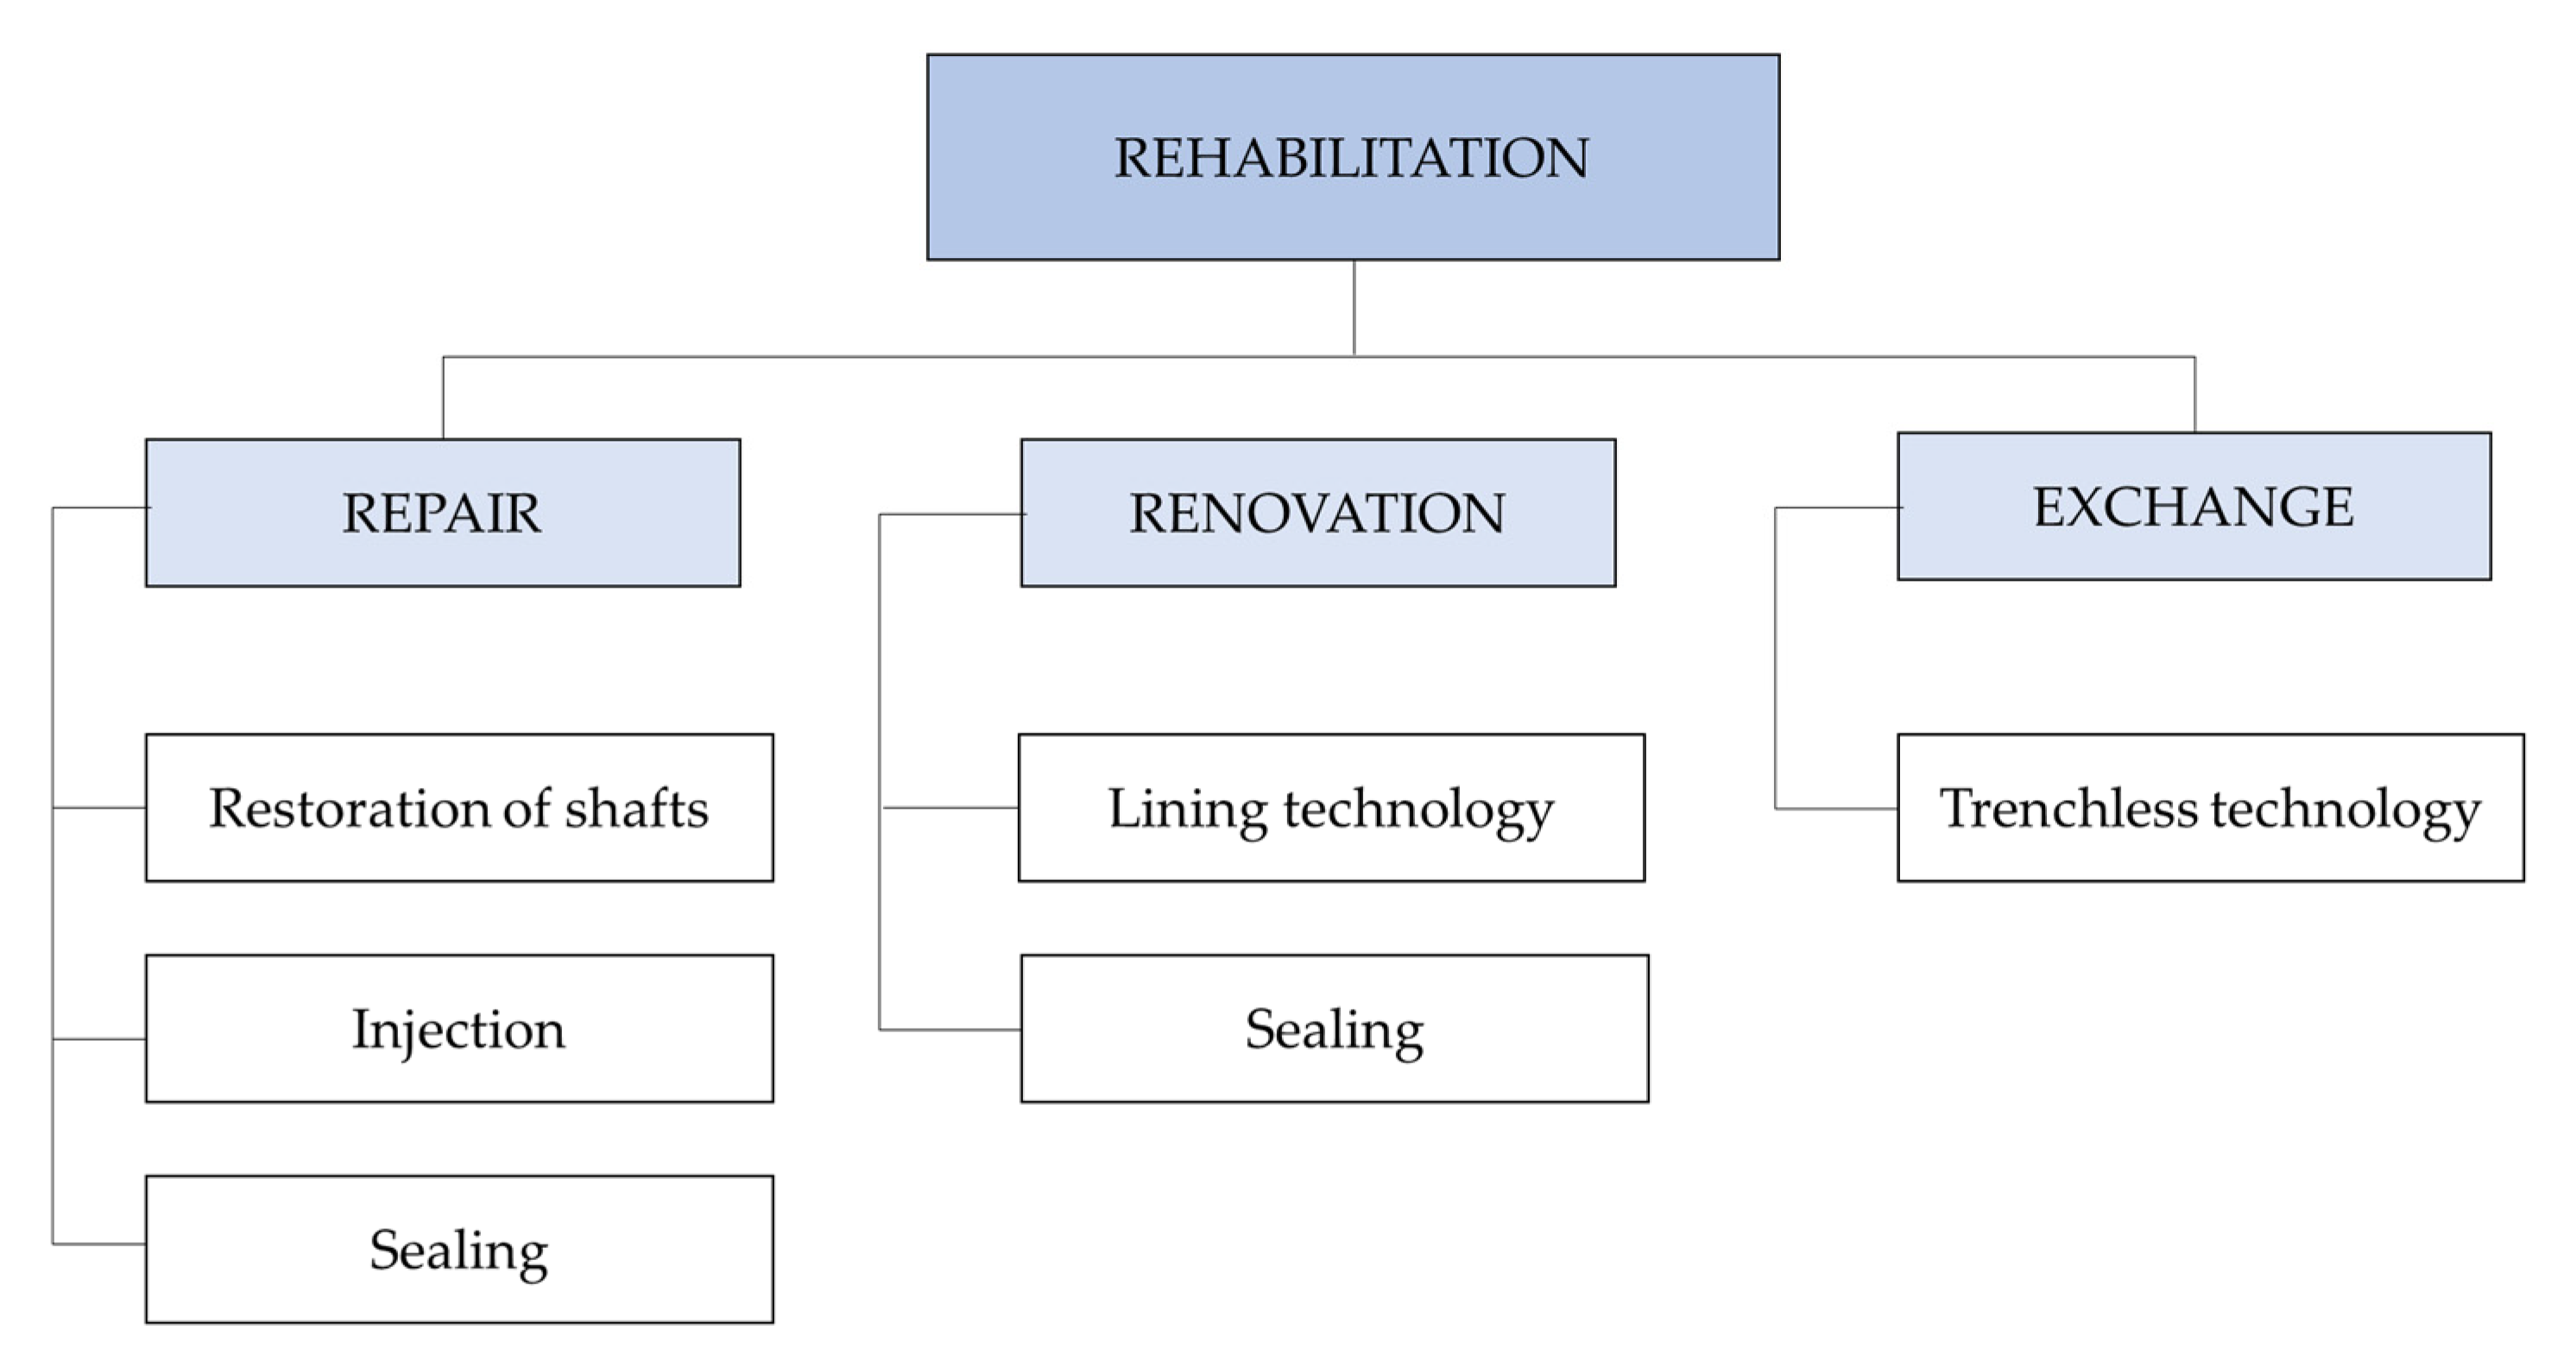
The restoration of sewer networks is one of the remediation approaches characterized as measures leading to the renewal or improvement of existing systems of sewer networks and sewer connections. Remediation methods can be divided into three groups (Figure 1) [29].
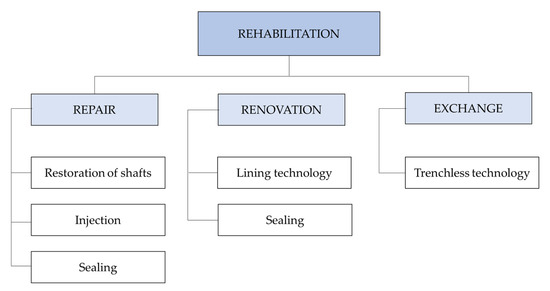
Figure 1.
Distribution of rehabilitation methods, based on the EN 14654-2 [29].
The definitions of repair, renovation, and replacement in sewer network restoration are as follows:
- Repair: according to the EN 14654-2 [29], it is a measure leading to the elimination of local defects.
- Renovation: as defined according to the EN 14654-2 [29], it is a measure to improve existing functional and operational properties of sewers and sewer connections while fully or partially preserving their original construction.
- Exchange or renewal: According to the EN 14654-2 [29], sewer network renewal means new construction in an existing route or the construction of a different route while maintaining the function of the original sewers and sewer connections. This method of remediation is used, especially in cases where the renovation of a sewer network would be too expensive, considering the extent and frequency of faults.
- Commonly used technologies include
- Excavation technologies for the restoration of sewer networks.
- Trenchless technologies for the restoration/renovation of sewer networks.
2.2. Trenchless Technologies for the Restoration/Renovation of Sewer Networks
The replacement and restoration of pipes and objects within a sewer network through open excavation represents one of the common options for rehabilitating pipes in an existing route. However, the economic complexity of this method is closely dependent on factors such as the depth of the rehabilitated objects, the nature of the paved surface, and the geological properties of the subsoil.
The principle of replacing sewer network objects through open excavation involves mechanical excavation of a trench or pit, filling it, subsequently placing pipes on the corresponding underfill, executing backfilling, and restoring the surface. Due to the higher costs associated with open excavation technologies, their use is particularly suitable for low storage depths and areas outside of paved surfaces. Restoration through open excavation is used, especially in cases where a pipeline is severely damaged and its operational technical condition is deemed unsuitable or in an emergency [30].
When constructing trenches to restore a sewer network through open excavation, the interdependence of the materials used, effective layering and filling, assembly and disassembly of the floor, static effects on the building components, and compliance with the height and position of the walls are considered regarding the intended use of the building surfaces [31].
2.3. Trenchless Technologies for the Restoration of Sewer Networks
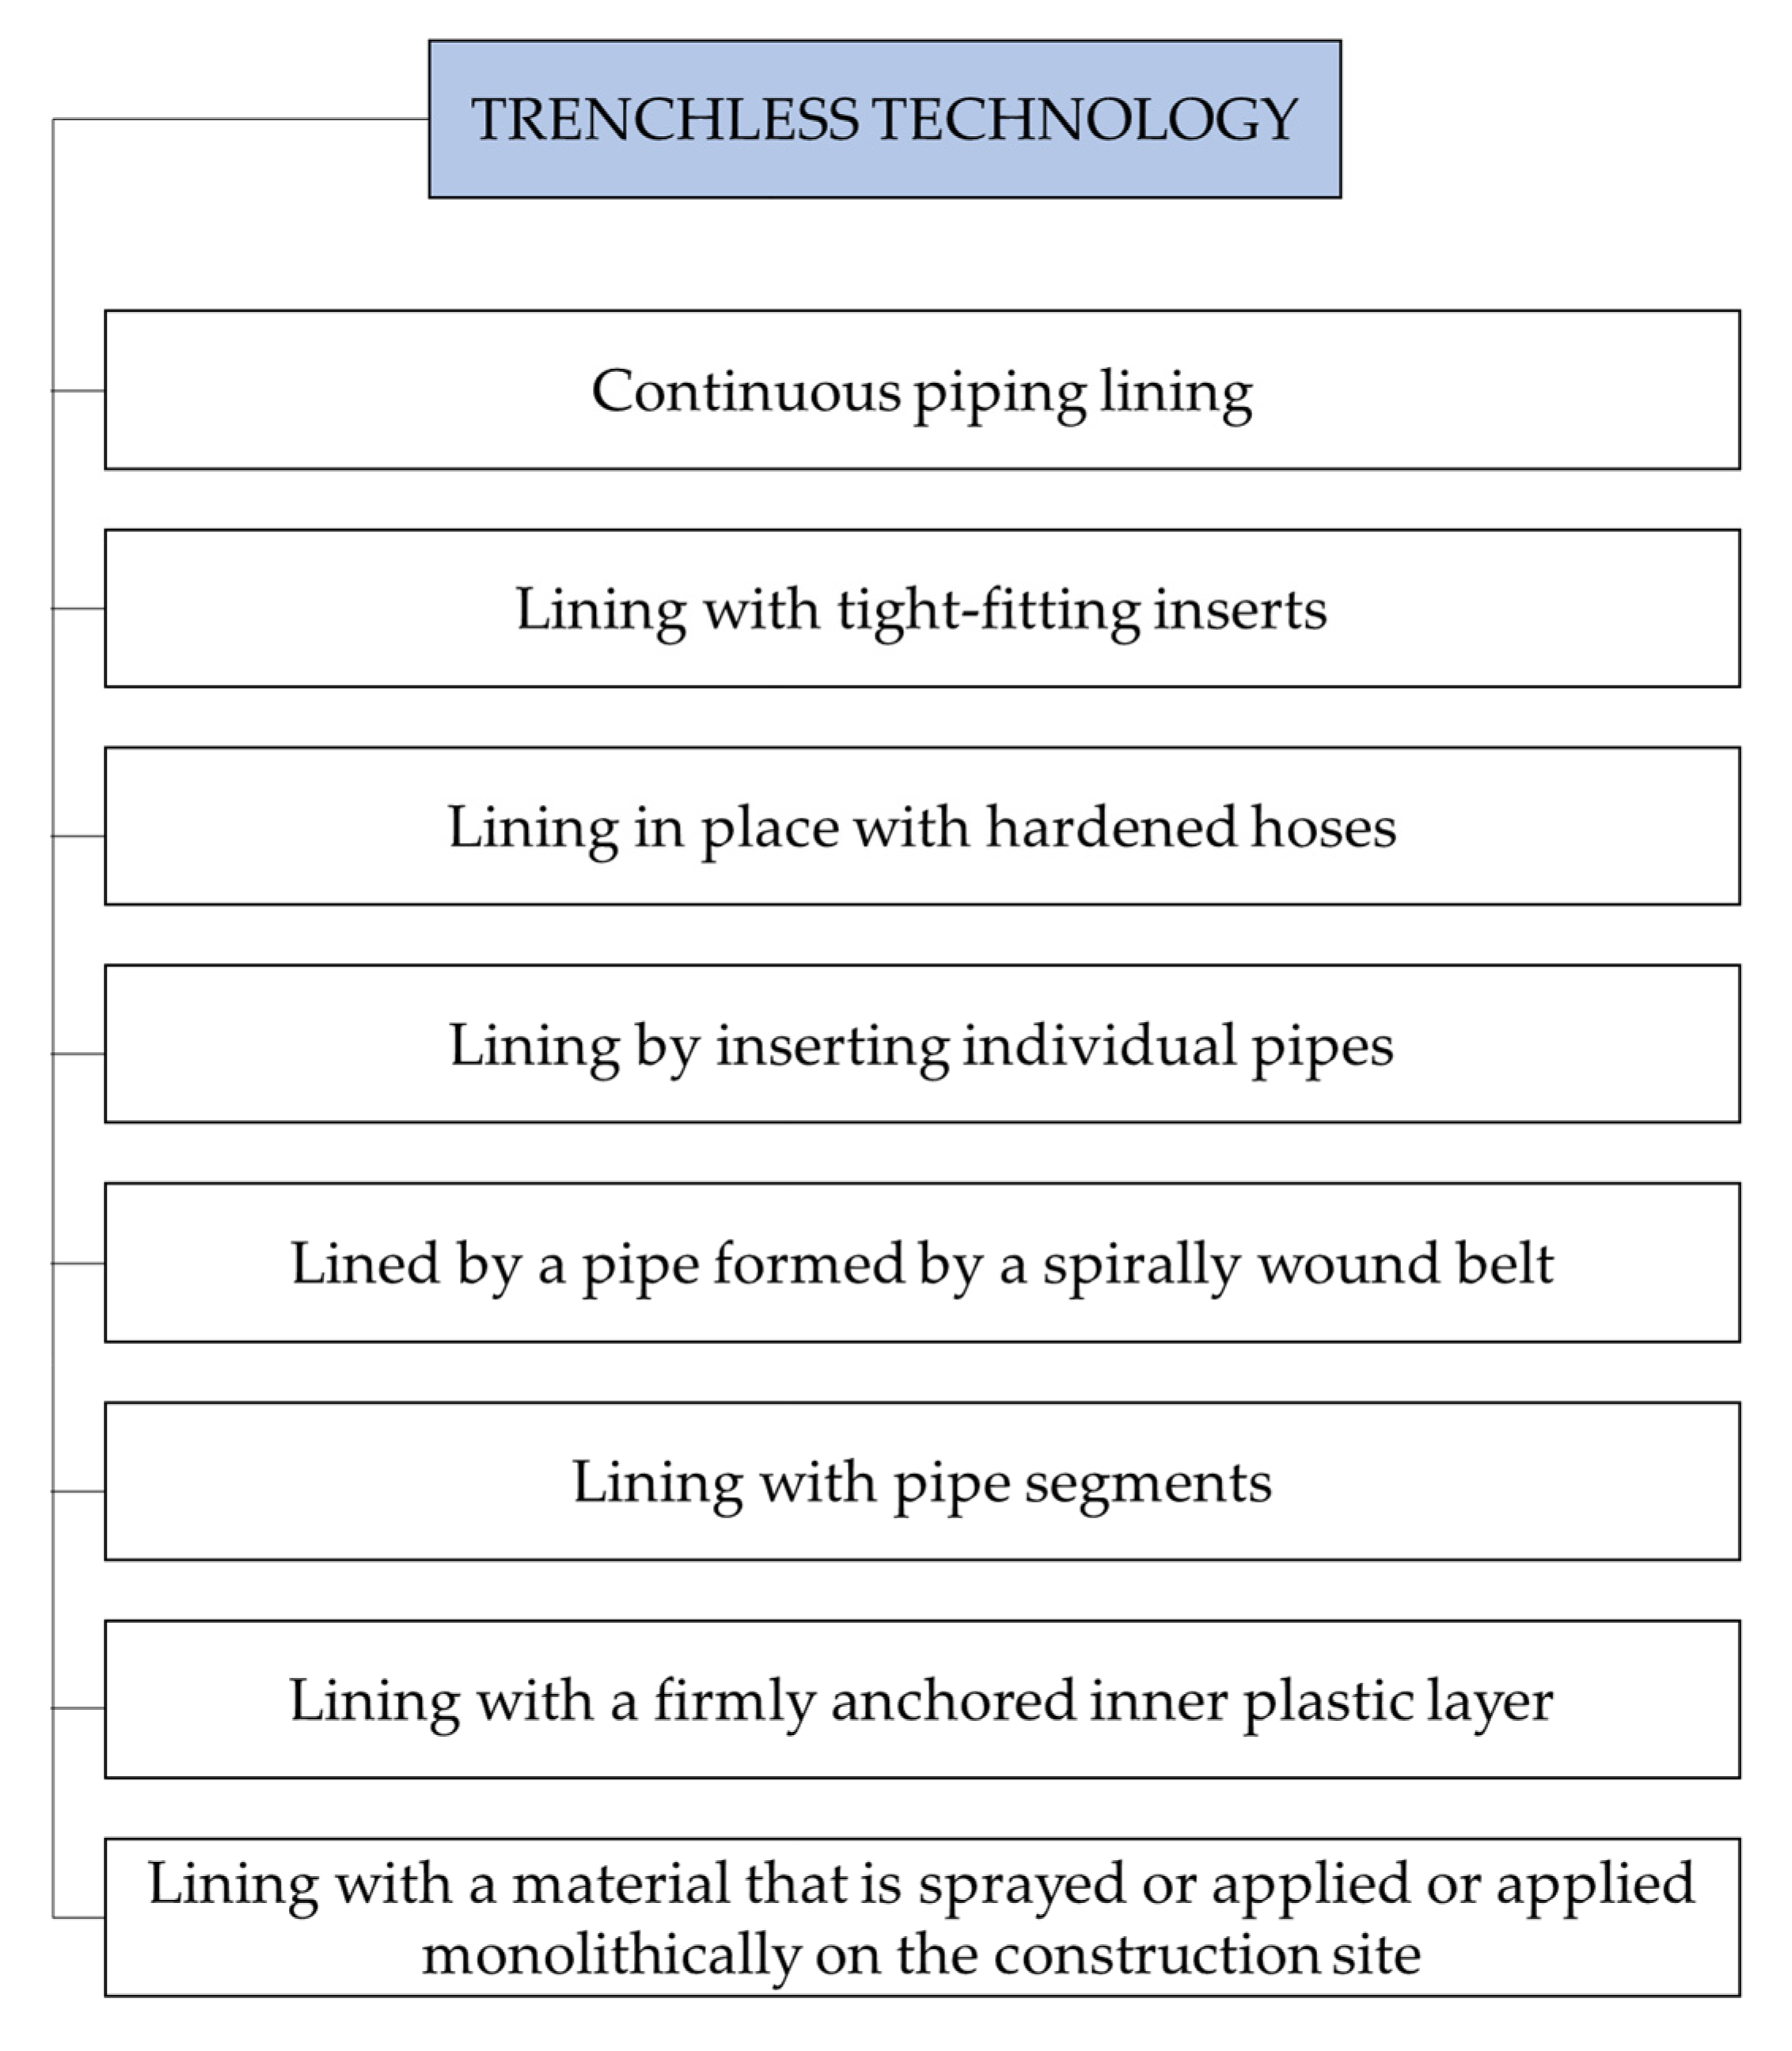
The use of trenchless technologies to rehabilitate sewer networks is characterized by the renovation or laying of the sewer pipes without the use of an open trench.
Trenchless technologies for conducting the rehabilitation of sewer networks can be categorized according to the scheme shown in Figure 2 in relation to the rehabilitation methods used [32].
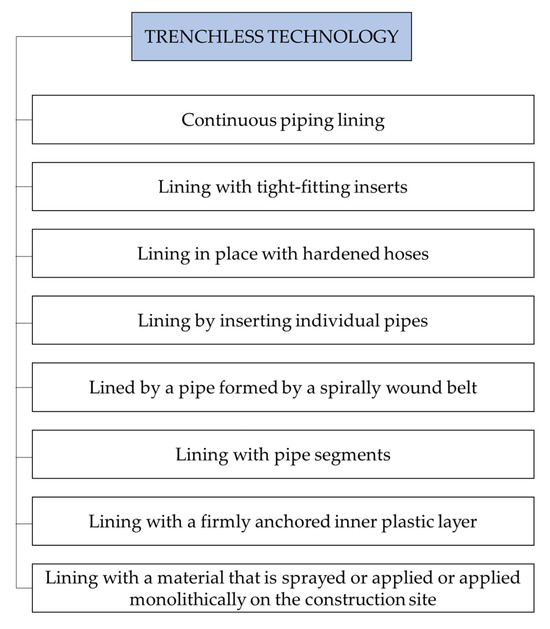
Figure 2.
Diagram illustrating the distribution of trenchless remediation methods based on the remediation techniques used [32].
Table A1 in the Appendix A showcases several parameters of excavation technologies, outlining their advantages and disadvantages using the example of sewer network renewal and replacement according to the EN 15885 [32].
Table A2 in the Appendix A presents a summary of the application of renovation trenchless technologies for sewage systems, defining their advantages and disadvantages during rehabilitation [32].
3. Determining the Carbon Footprint
GHGs contribute to the greenhouse effect by trapping infrared radiation in the atmosphere. On the one hand, they occur naturally (water vapor, methane, etc.). On the other hand, they are released by human activities (mainly through burning fossil fuels and various other activities) [33]. Carbon dioxide (CO2) and chlorofluorocarbons are examples of human-derived GHGs. The GHG Protocol [1,34] is a corporate standard for carbon footprint measurement and reporting that is used worldwide. It standardizes the procedure for measuring, managing, and reporting GHG emissions from companies. The GHG Protocol registers a total of seven anthropogenic GHGs relevant to a company’s carbon footprint.
Table 1 provides an overview of these greenhouse gases, their names, main sources, and global warming coefficients. The most common among these gases is CO2, which is formed whenever a substance containing carbon (C) reacts with oxygen (O2) in the atmosphere. The global warming potential [10] is a measure of the potential contribution of a given gas to the greenhouse effect in terms of the CO2 equivalent potential. The unit of measurement is the contribution of one molecule of CO2 to the greenhouse effect. Using these coefficients, it is possible to determine the so-called CO2 equivalence (written as CO2 eq., CO2e) of a given GHG. The term “effect” usually refers to a time horizon of 100 years [35].

Table 1.
Overview of the seven anthropogenic greenhouse gases outlined in the Greenhouse Gas Protocol.
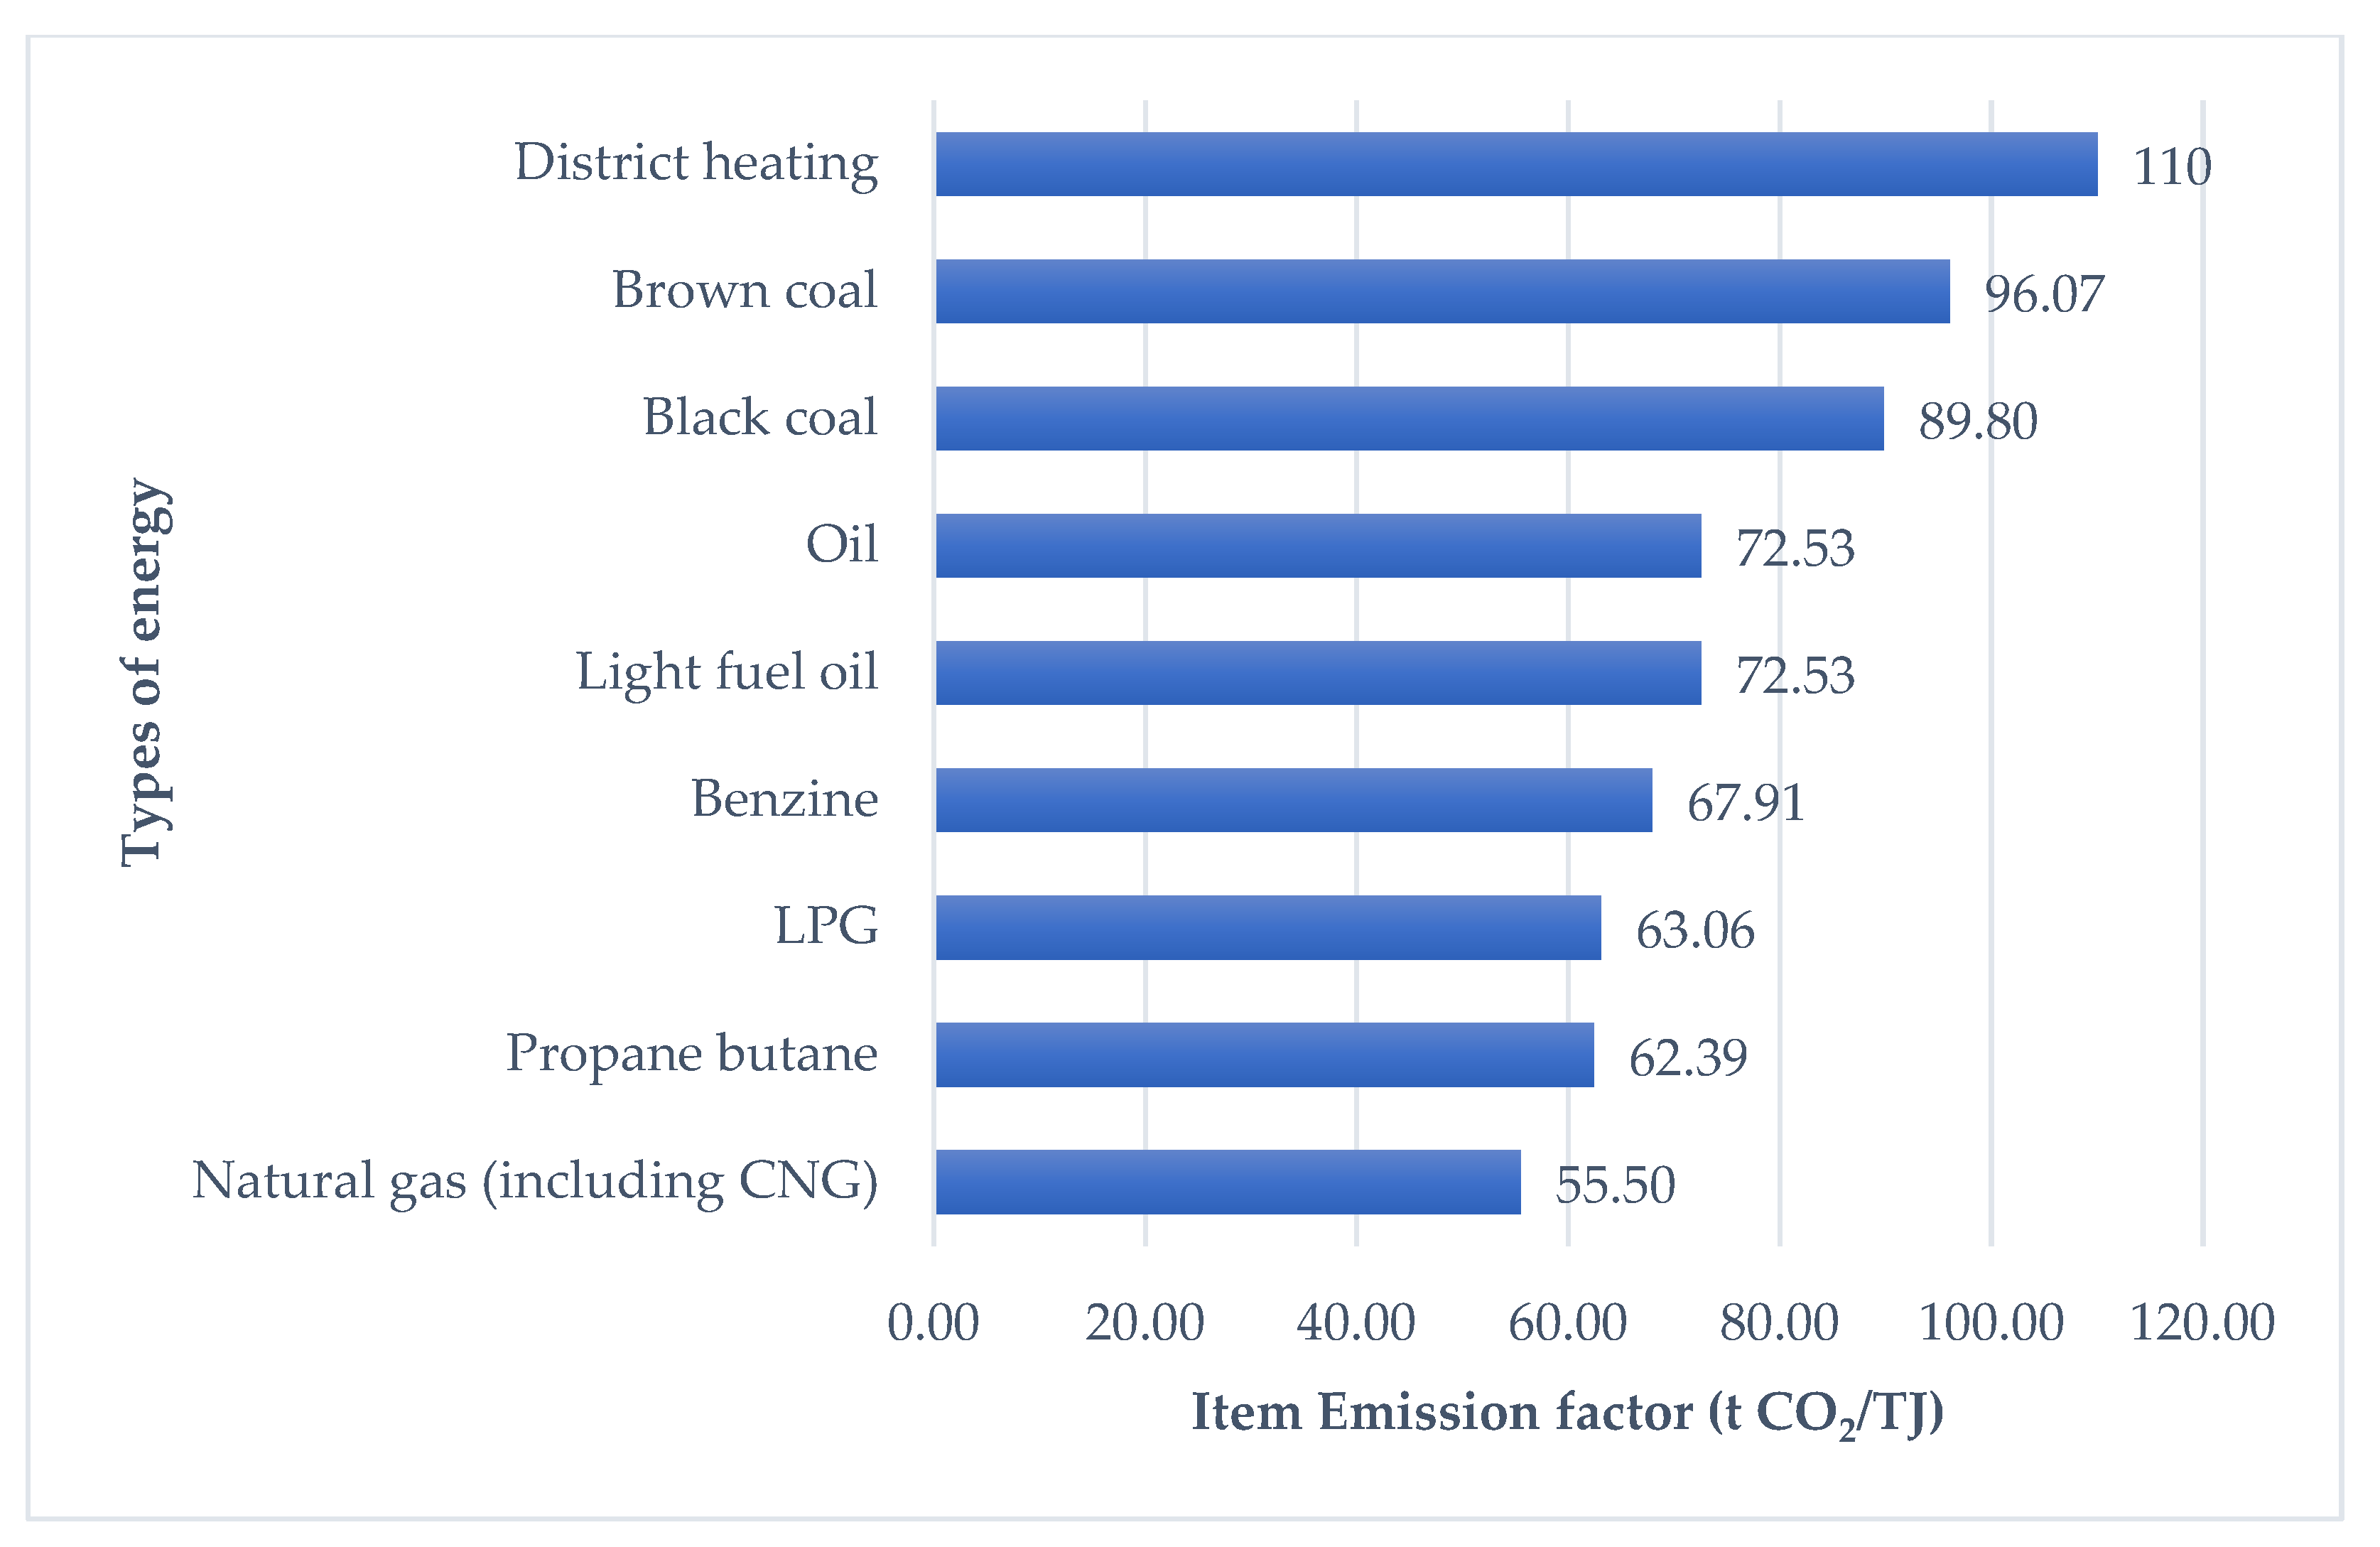
Emission factors quantify the amount of GHGs in tons of CO2 or other GHGs per unit of energy or another unit expression (such as the mass or volume of a product). In the next step, these factors must be converted to the corresponding amount of GHGs expressed in CO2 equivalents (CO2 eq.) using the global warming potential of a given gas. Some emission factors are country-specific; for example, electricity depends on the national energy mix, which varies for each country and changes over time. Similarly, for specific products (such as a computer), it is advisable to obtain the emission factor directly from the manufacturer of the given product [35]. An overview of basic emission factors in the Czech Republic for various types of energy, based on [36], is presented in Figure 3.

Figure 3.
Overview of basic emission factors in the Czech Republic for various types of energy, in (t CO2/TJ).
The calculation of the current value of the CO2 emission factor from electricity production is carried out based on the following method: The primary energy of fossil fuels used each year (according to individual fuels) for the production of electricity is multiplied by the specific emission factors for the given fuels (or related fuels). The resulting total value is divided by the total gross production of electricity in the Czech Republic. The CO2 emission factors from the burning of fossil fuels in the calculation are based on the IPCC 2006 methodology and national emission factors [37].
The values of the CO2 emission factor for electricity calculated based on this method are not identical to the values specified in Decree No. 480/2012 [38] on energy audit and energy assessment, in which the values of the CO2 emission factor are determined for a specific purpose (enforcement of state policy) and applied to electricity production from fossil sources. This decree was replaced in 2021 by two decrees, Decree No. 140/2021 [39] on energy audit and Decree No. 141/2021 on energy assessment [40], and data are kept in the Energy Consumption Monitoring System.
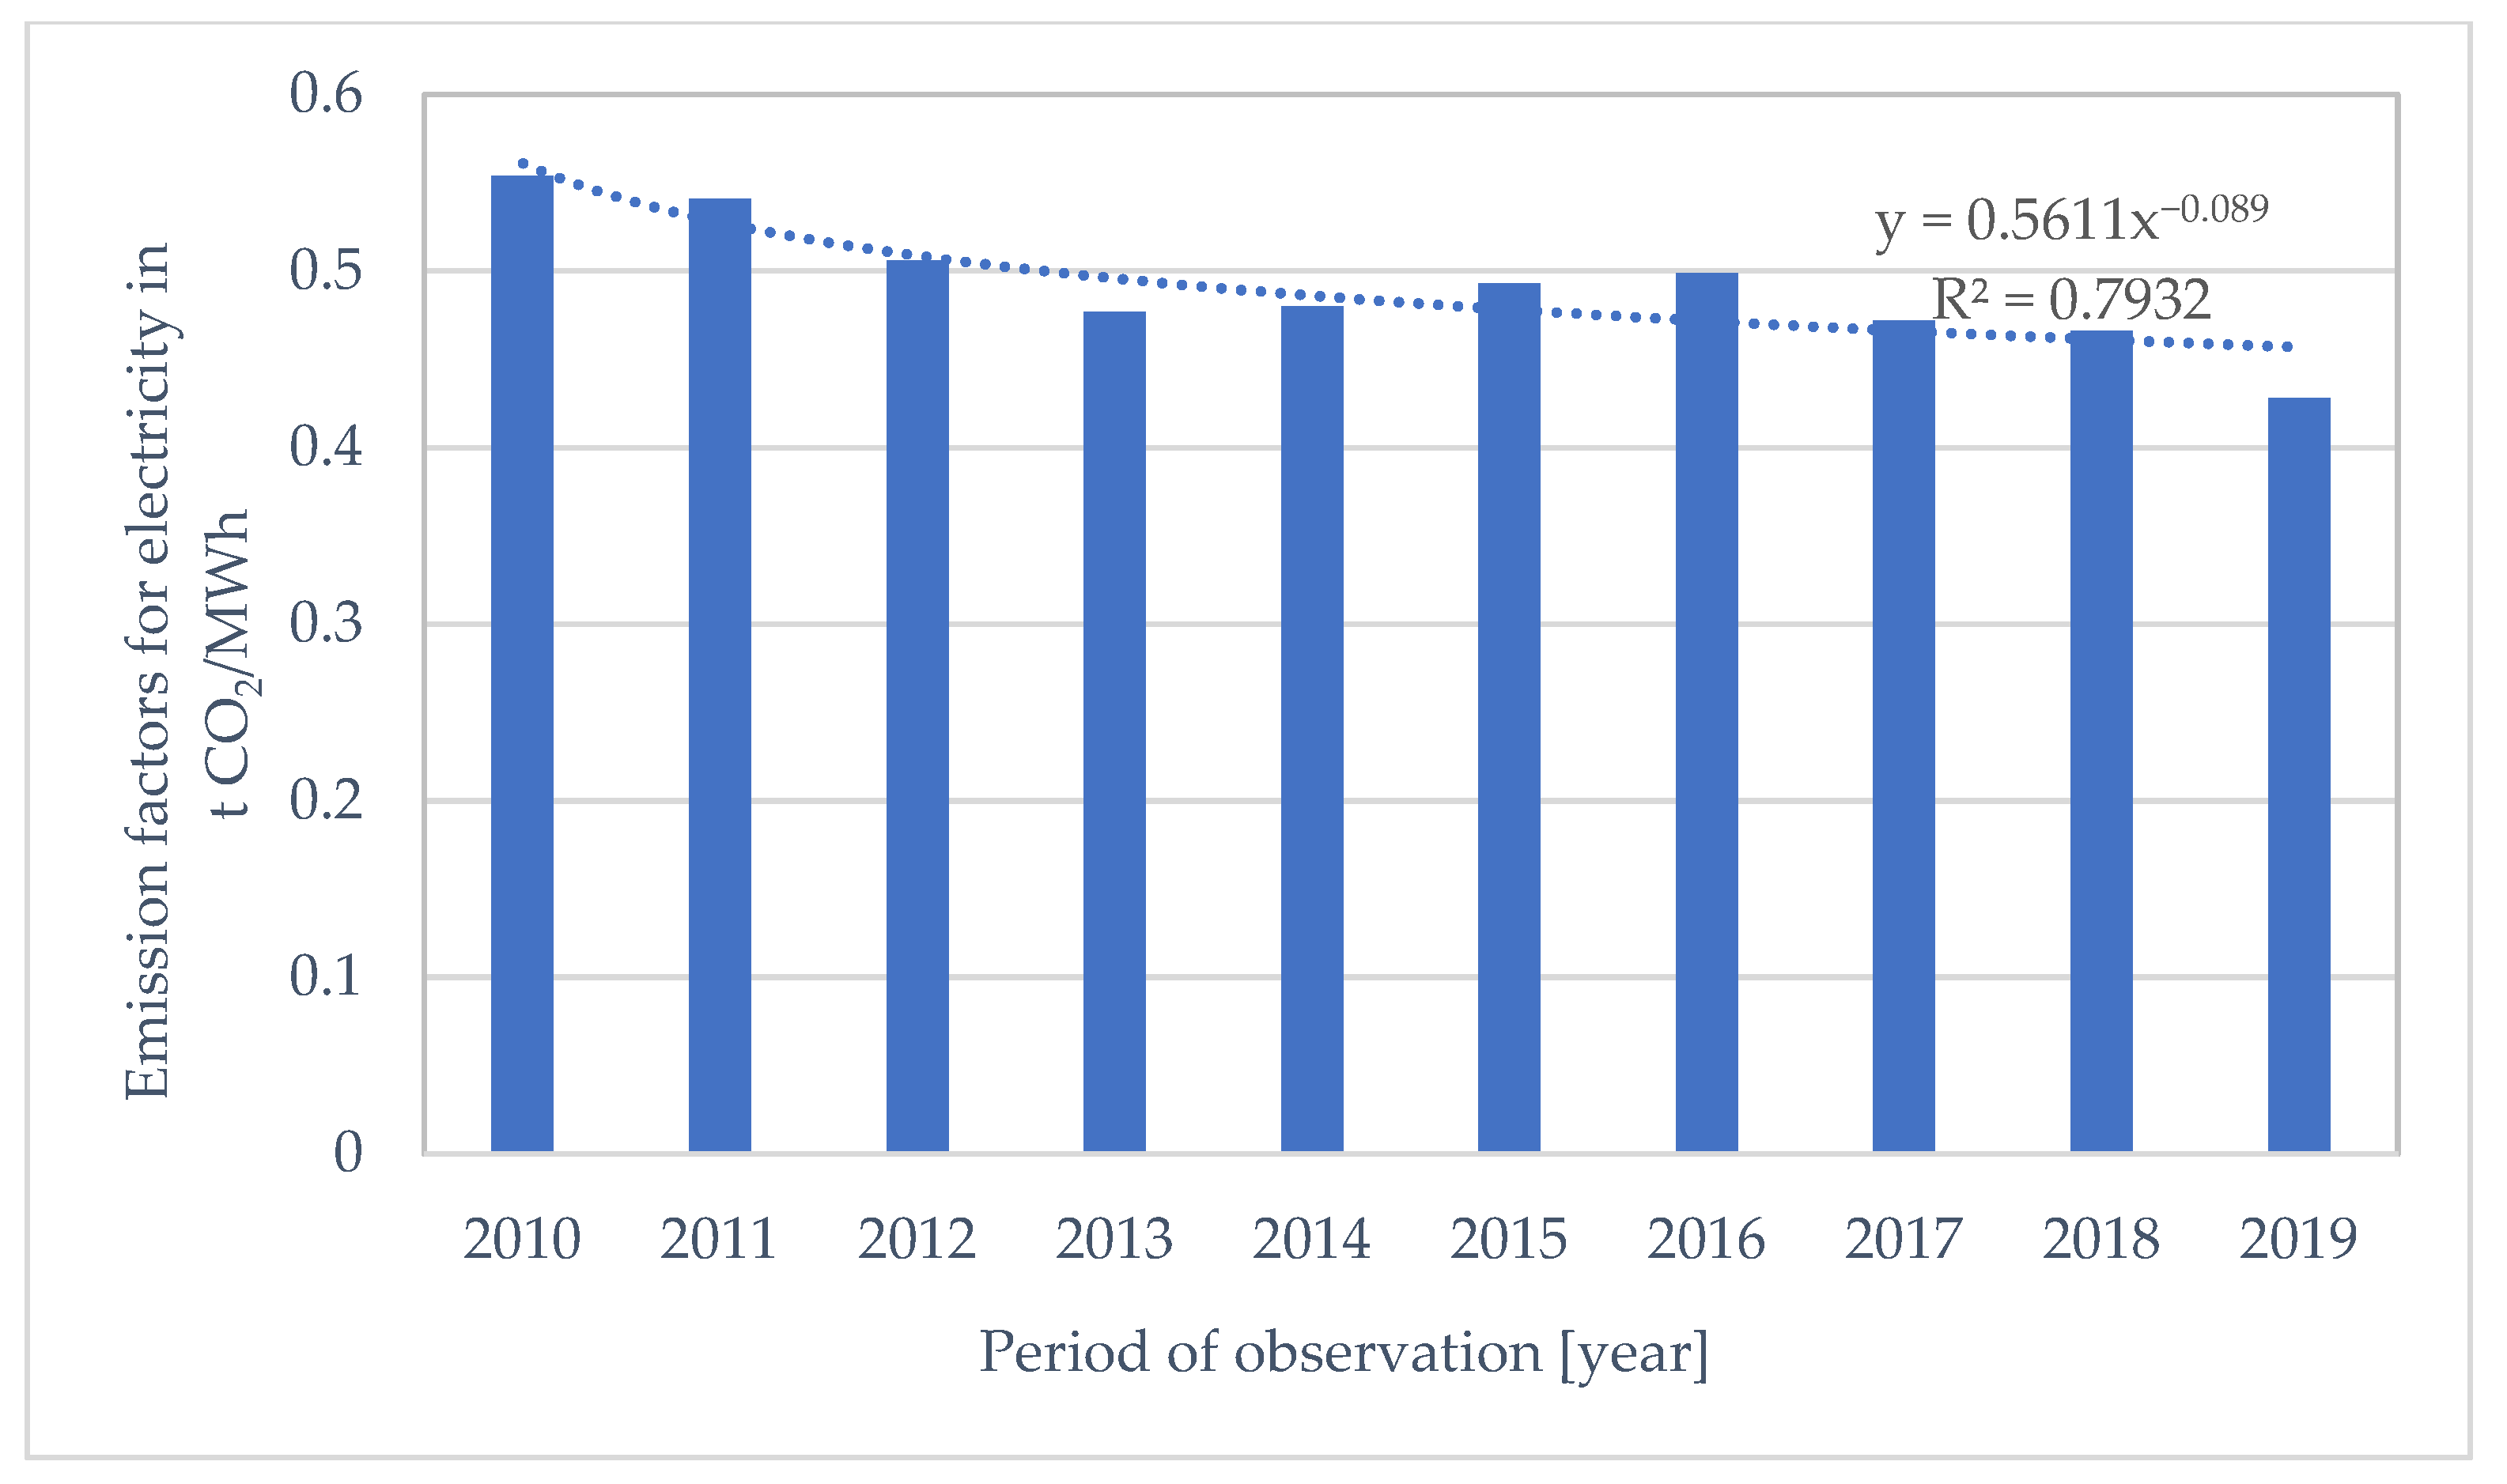
The presented data can be used exclusively for informational purposes, e.g., to monitor the real carbon footprint of companies taking electricity from the public grid or electricity sellers who buy it on the open market. In Figure 4, an overview of basic domestic emission factors for electricity (mix in the Czech Republic) is shown [41].
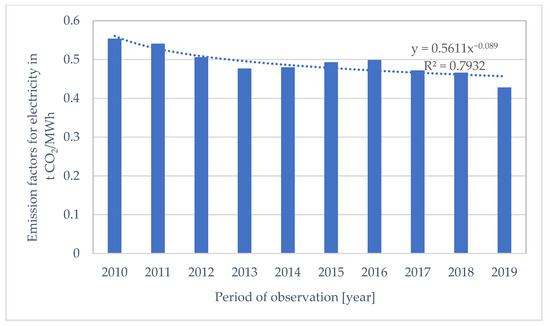
Figure 4.
Overview of basic domestic emission factors for electricity in CO2/MWh (mix in the Czech Republic), data from [41].
An R-squared value of 78% indicates that the estimated power is statistically of good quality and can satisfactorily represent the variations in basic domestic emission factors for electricity over a 10-year interval.
A company’s carbon footprint is a measure of the impact of its activities on the environment, specifically on the climate. This carbon footprint is an indirect indicator of the consumption of energy, products, and services. It measures the amount of GHGs corresponding to the company’s activities or products. In addition to the enterprise level, carbon footprint can be determined at other levels, including national, municipal, or individual. A product’s carbon footprint includes GHG emissions generated during the product’s life cycle—from raw material extraction to waste disposal [42,43]. The evaluation requires data from a product life cycle assessment. The results can be used to compare individual products in terms of their impact on the environment [44]. Carbon footprint is usually expressed in tons of CO2 equivalent (t CO2 eq.). In the case of partial activities or the carbon footprint of a given product, kilograms or grams of CO2 eq. can be used. The input data units for calculating carbon footprint are much more varied. In the case of energy, the unit is most often kWh or MWh. Other used energy units (e.g., joules or calories) must be converted to this unit. Other inputs are most often weight (tons or kg) or volume (cubic m or L).
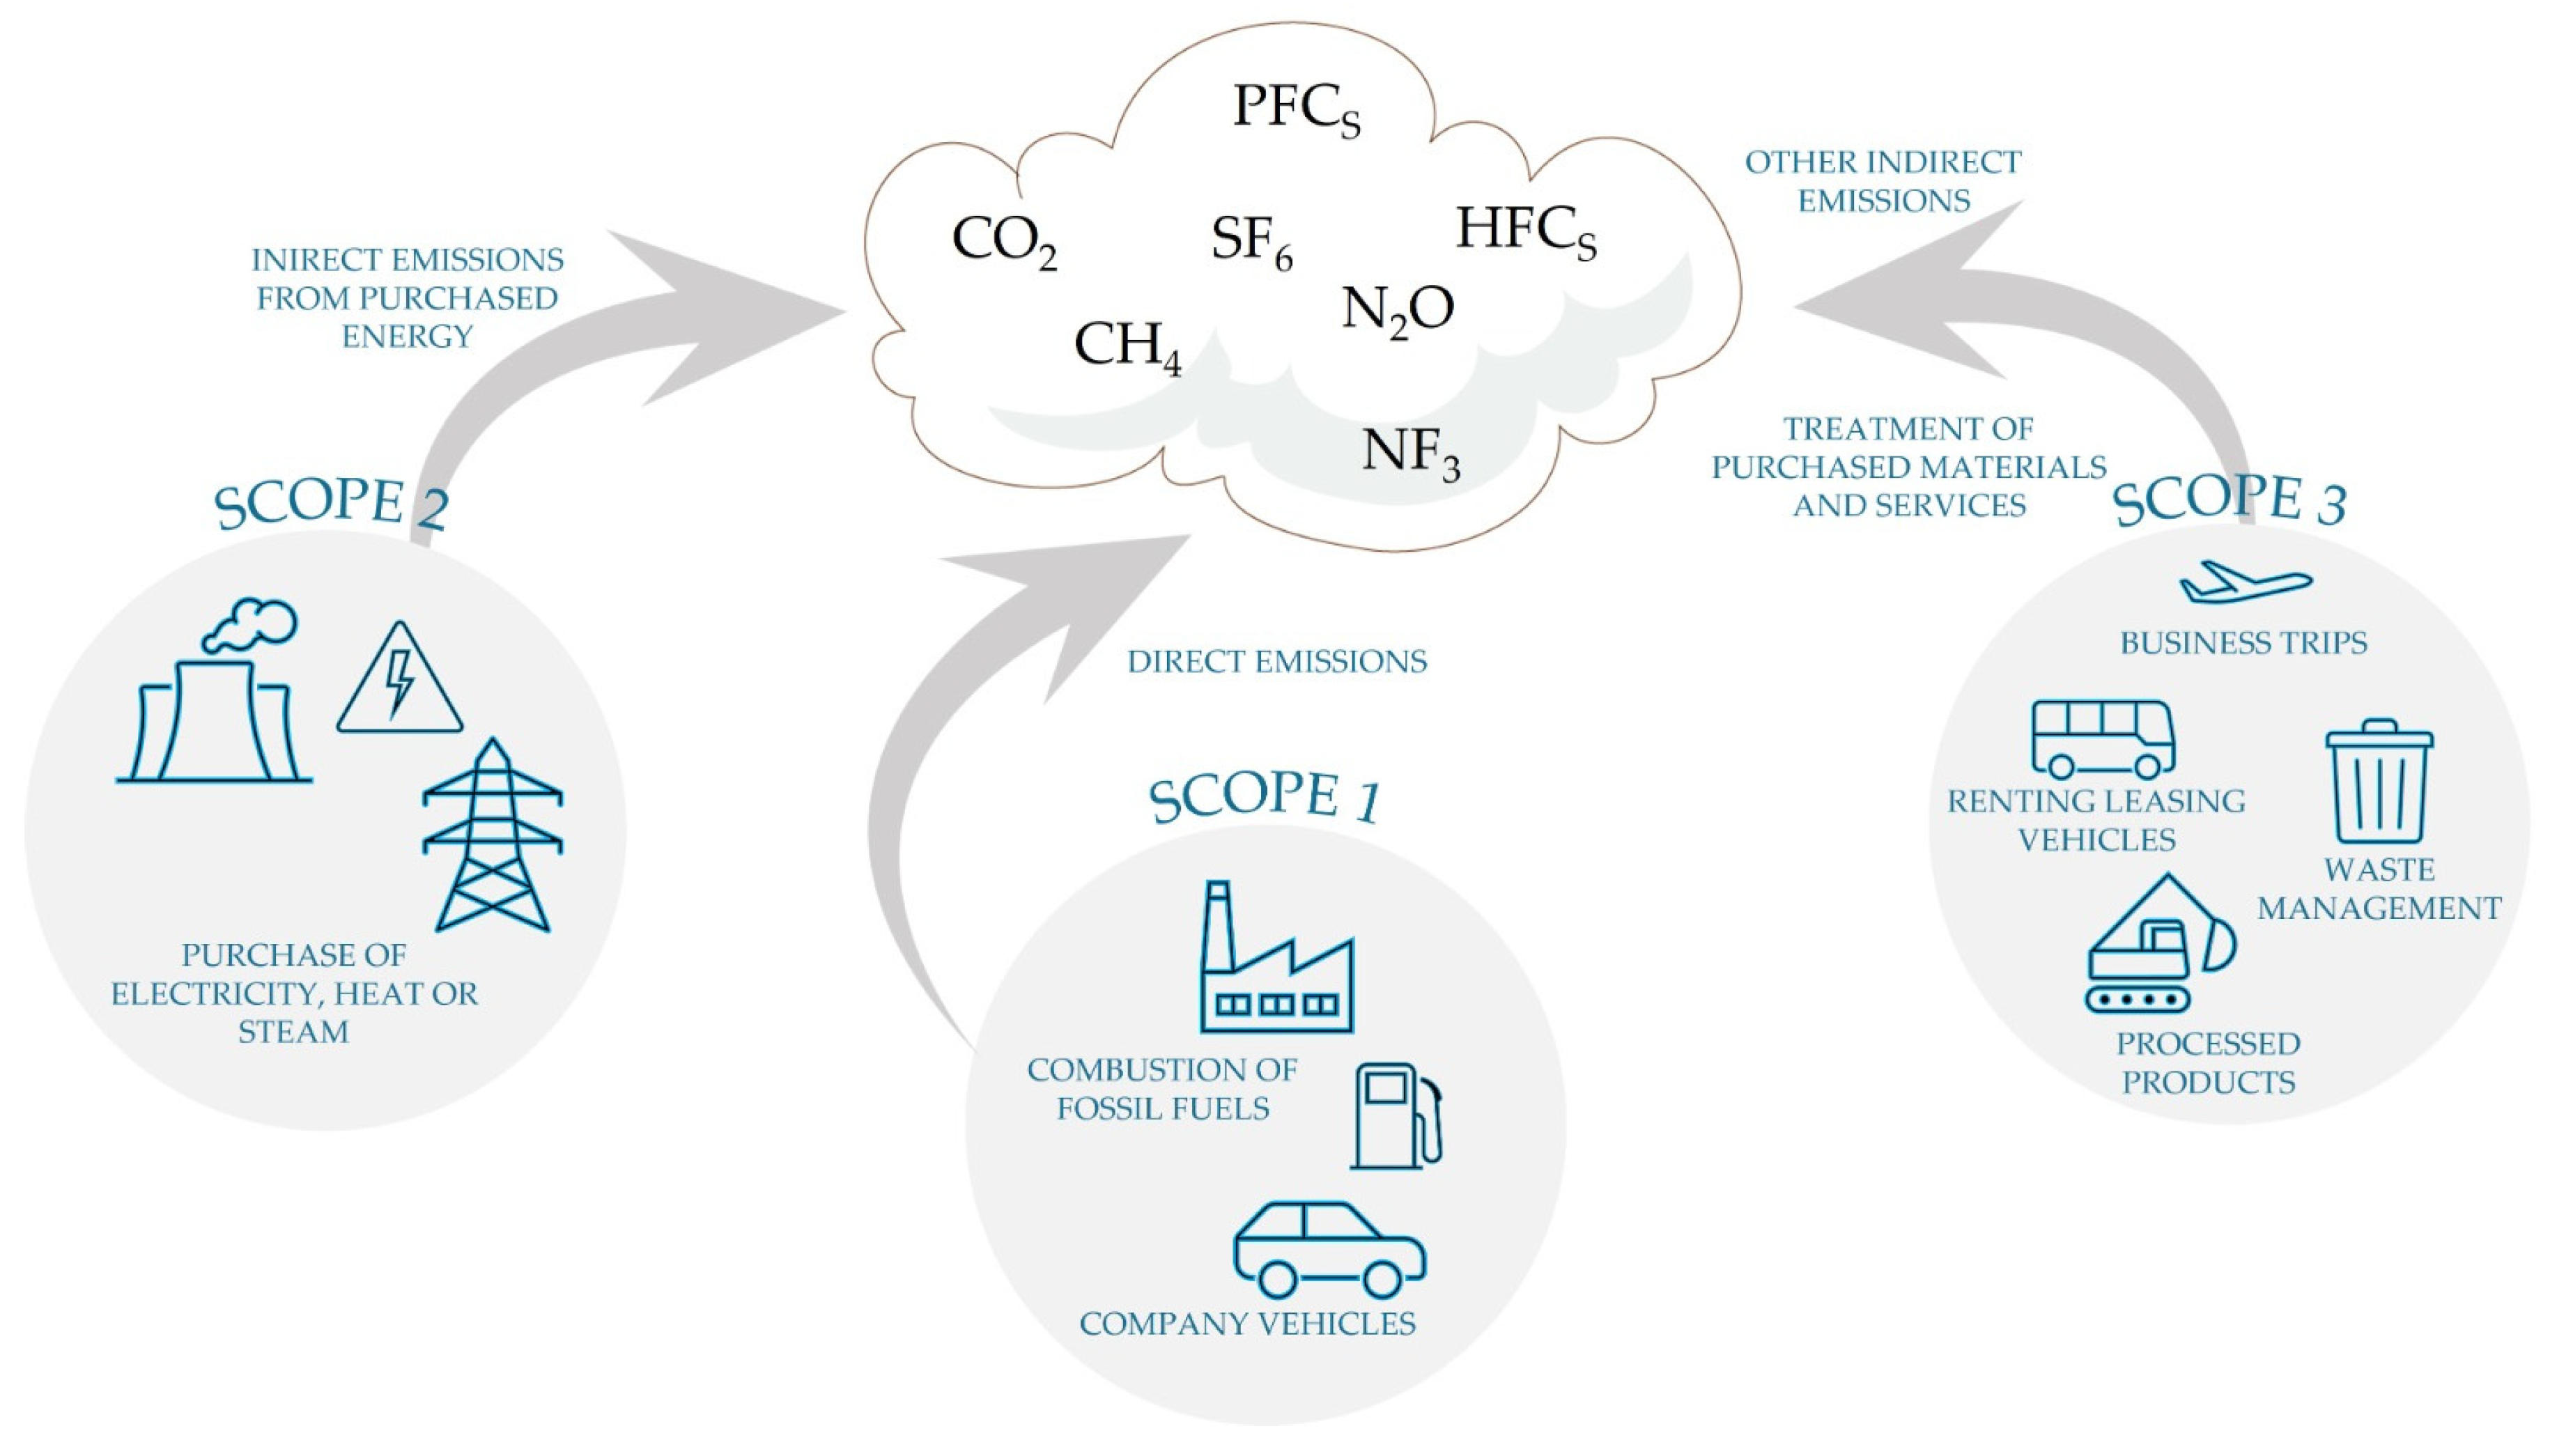
The GHG Protocol introduces a division of emissions related to business activities into three areas or scopes, which has become a widely used international standard. Figure 5 shows the typical composition of individual scopes, with examples taken from the results presented in [34].
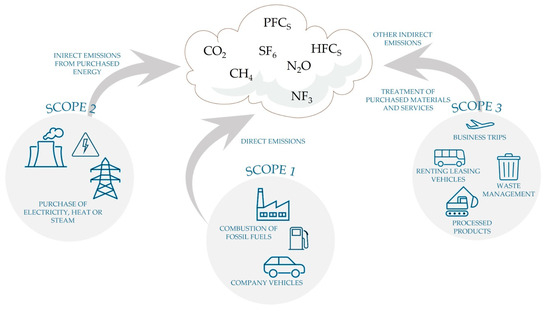
Figure 5.
Carbon footprint composition.
Scope 1, or direct emissions, refers to activities within an organization’s control that release emissions directly into the atmosphere. These emissions can come from various sources, including the burning of fossil fuels in company-owned equipment like boilers or generators, emissions from company-owned mobile sources like cars, and those generated by the company’s industrial processes, waste treatment, and wastewater treatment facilities. In the framework of this article, the carbon footprints of excavation and trenchless technologies are compared precisely based on direct emissions, i.e., analogously but simplified according to Scope 1.
Scope 2 emissions, arising from indirect energy consumption, are associated with the utilization of purchased energy sources such as electricity, heat, steam, and cooling. These emissions do not directly originate from a company but result from its operations, arising from sources not directly controlled by the company, although the company significantly influences their magnitude. If a company generates and sells its electricity or heat or resells purchased energy to other consumers, such as tenants, this energy’s quantity is measured and subtracted from the total Scope 2 emissions. The method for calculating Scope 2 emissions, which includes factors like energy production from renewable sources, was updated in January 2015, and details can be found on the GHG Protocol website [34].
Scope 3, referred to as other indirect emissions, pertains to emissions resulting from a company’s activities originating from sources outside the company’s control or ownership. These emissions include activities like air travel, waste disposal, material purchase, and transport by third parties, among others. This scope represents the broadest and least precisely defined category within the framework. Although emissions within Scope 1 and Scope 2 provide a basis for cross-company comparison, emissions within Scope 3 exhibit limited comparability. Consequently, the GHG Protocol and the Carbon Disclosure Project database require reporting for Scope 1 and Scope 2 emissions but only recommend reporting for Scope 3. In recent years, however, Scope 3 has gained importance, prompting many companies to regularly report on its most significant components. Such reporting enables companies to showcase innovative emission reduction management practices. The GHG Protocol provides detailed technical guidance to calculate the primary types of Scope 3 emissions [34].
4. Case Characterization
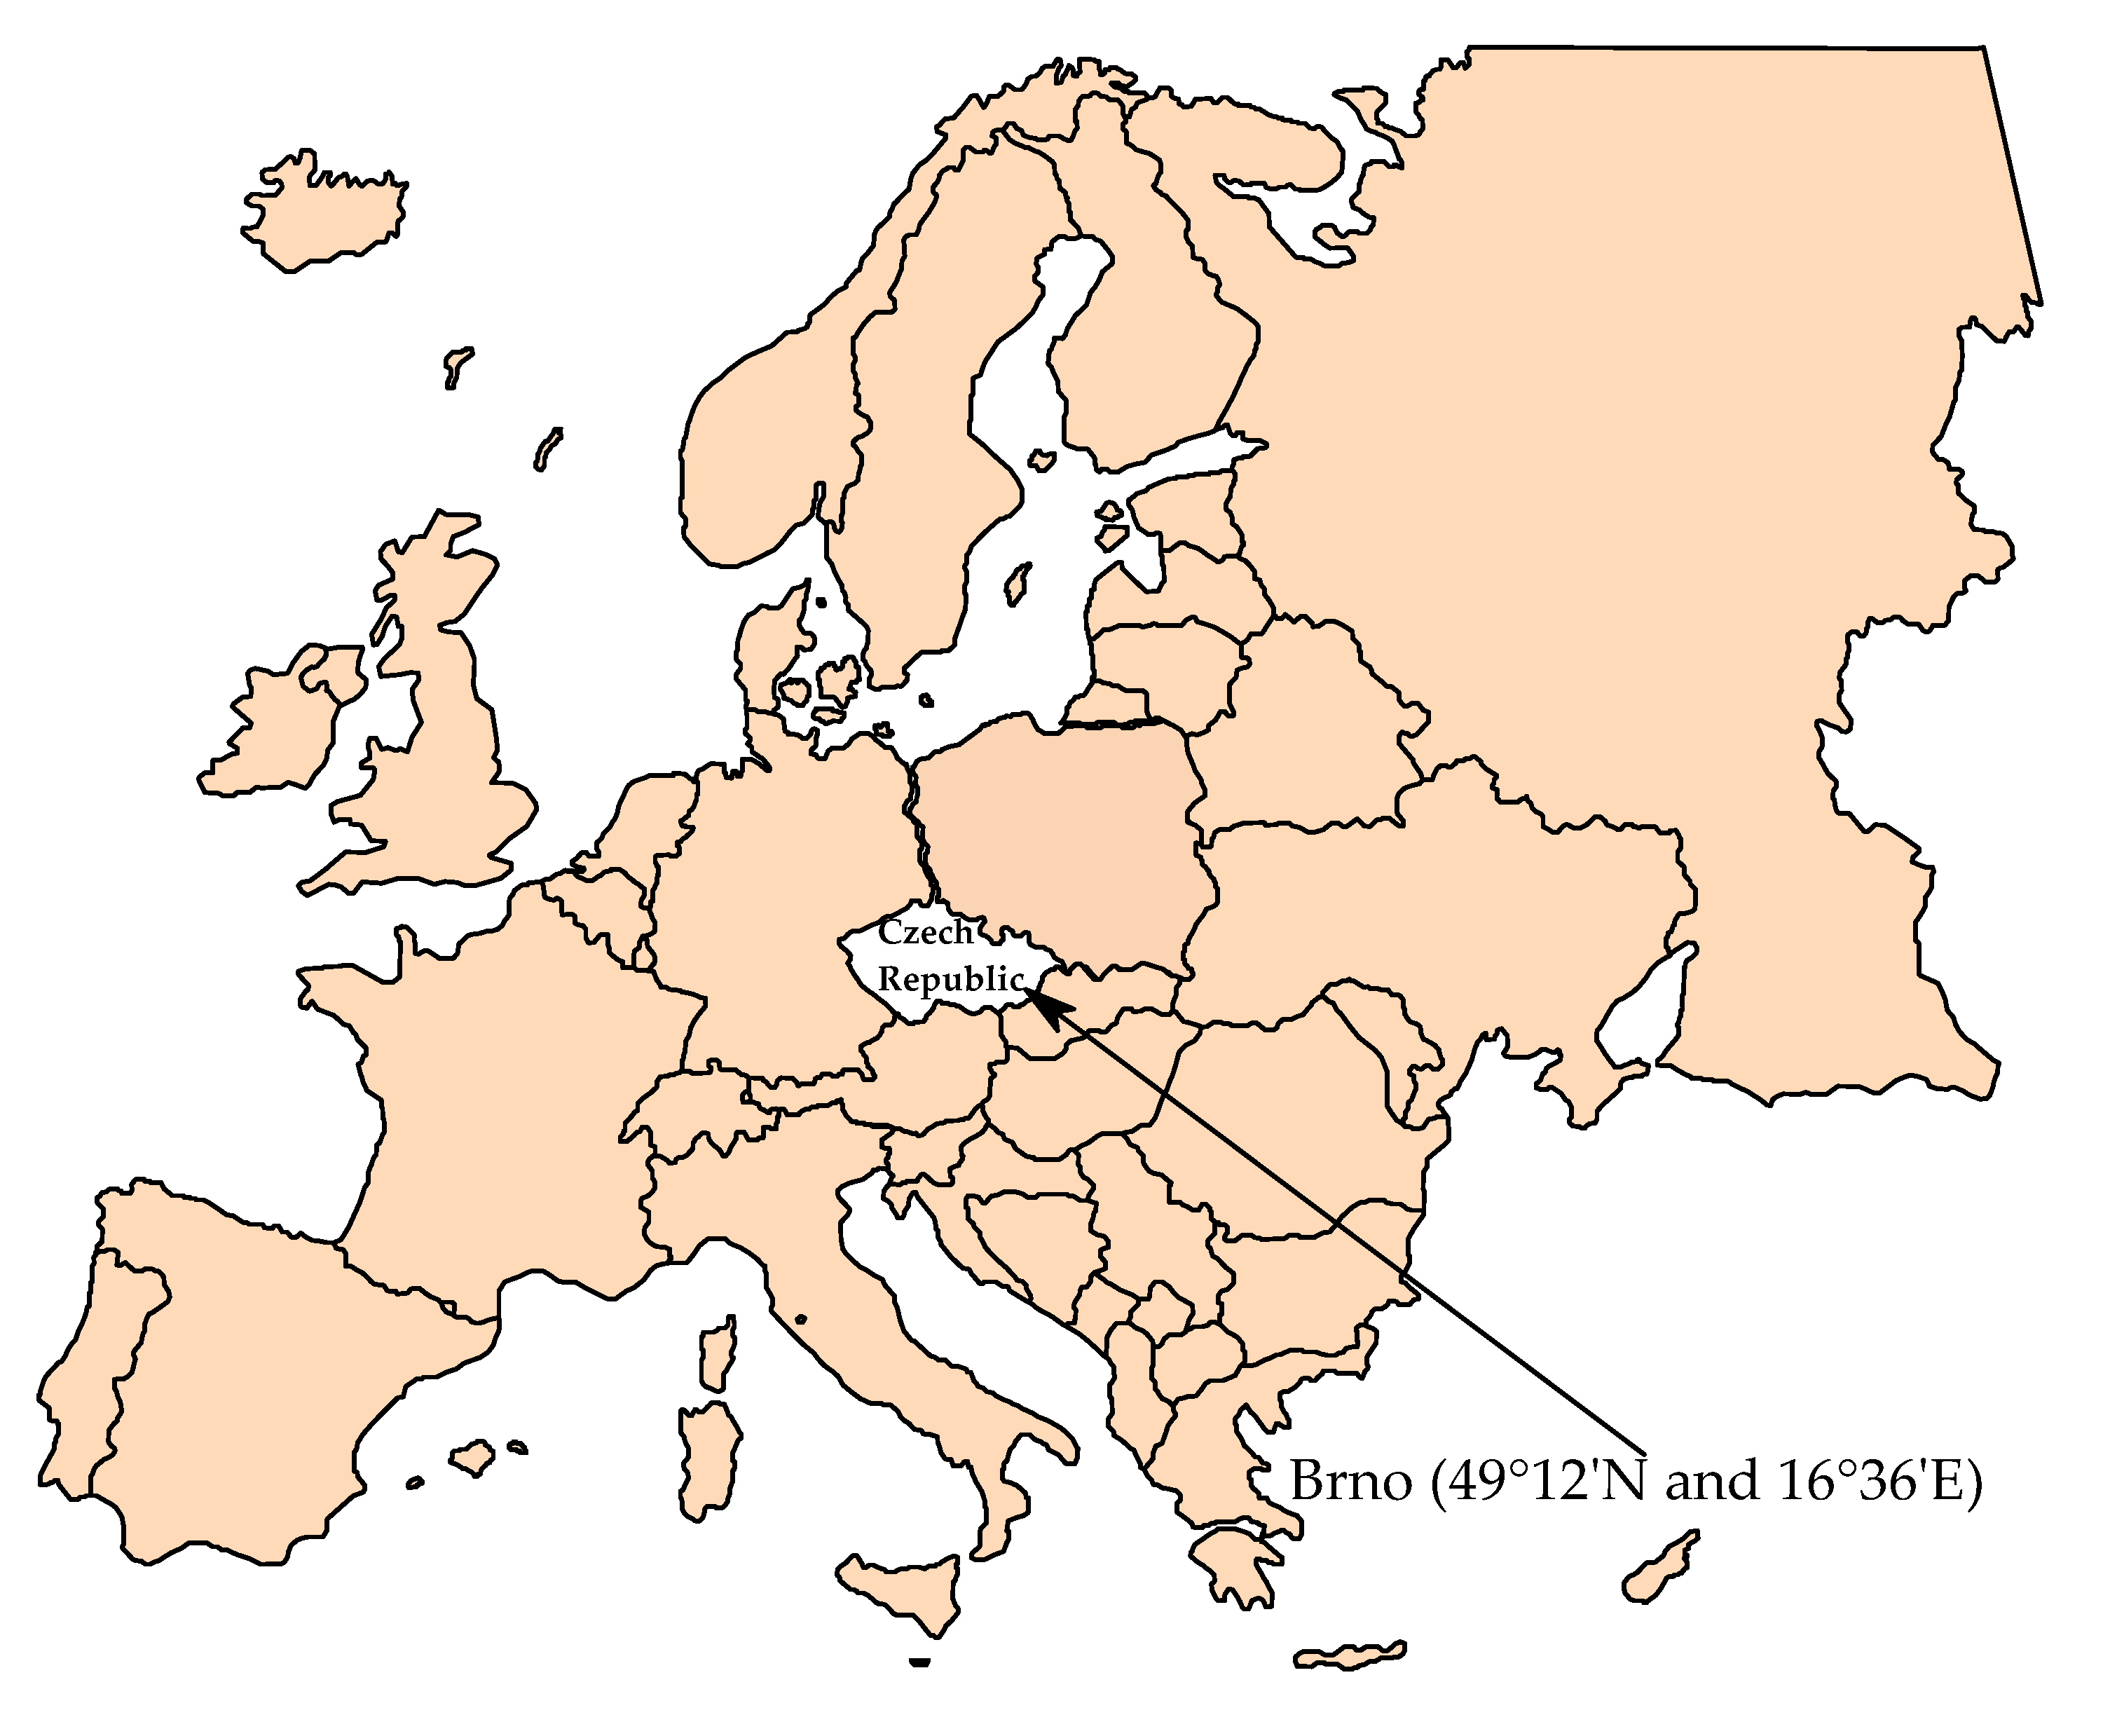
Veveří is a district north of the center of the statutory city of Brno (Czech Republic) (Figure 6). Its cadastral territory has an area of approximately 1.98 km2 and is part of the self-governing district in Brno’s city center. Over 19,000 inhabitants live here. Veveří is directly adjacent to the historical core of Brno, which is why it has a distinctly urban character with several streets with heavy traffic. The built-up area of the city is largely made up of multi-story historic houses and a number of representative houses, such as the luxurious Art Nouveau tenement houses on Konečný square, which are dominated by the Tivoli block of flats.
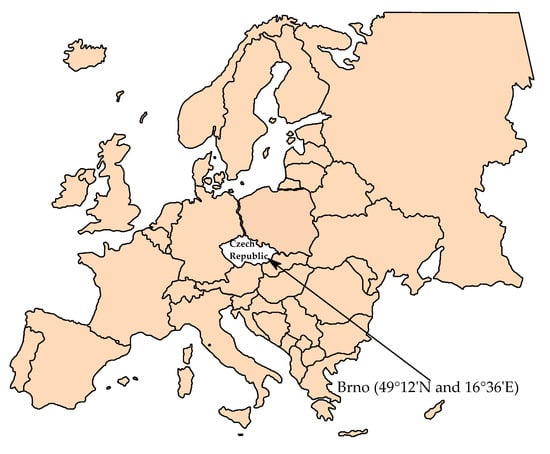
Figure 6.
Location of the examined city, Brno.
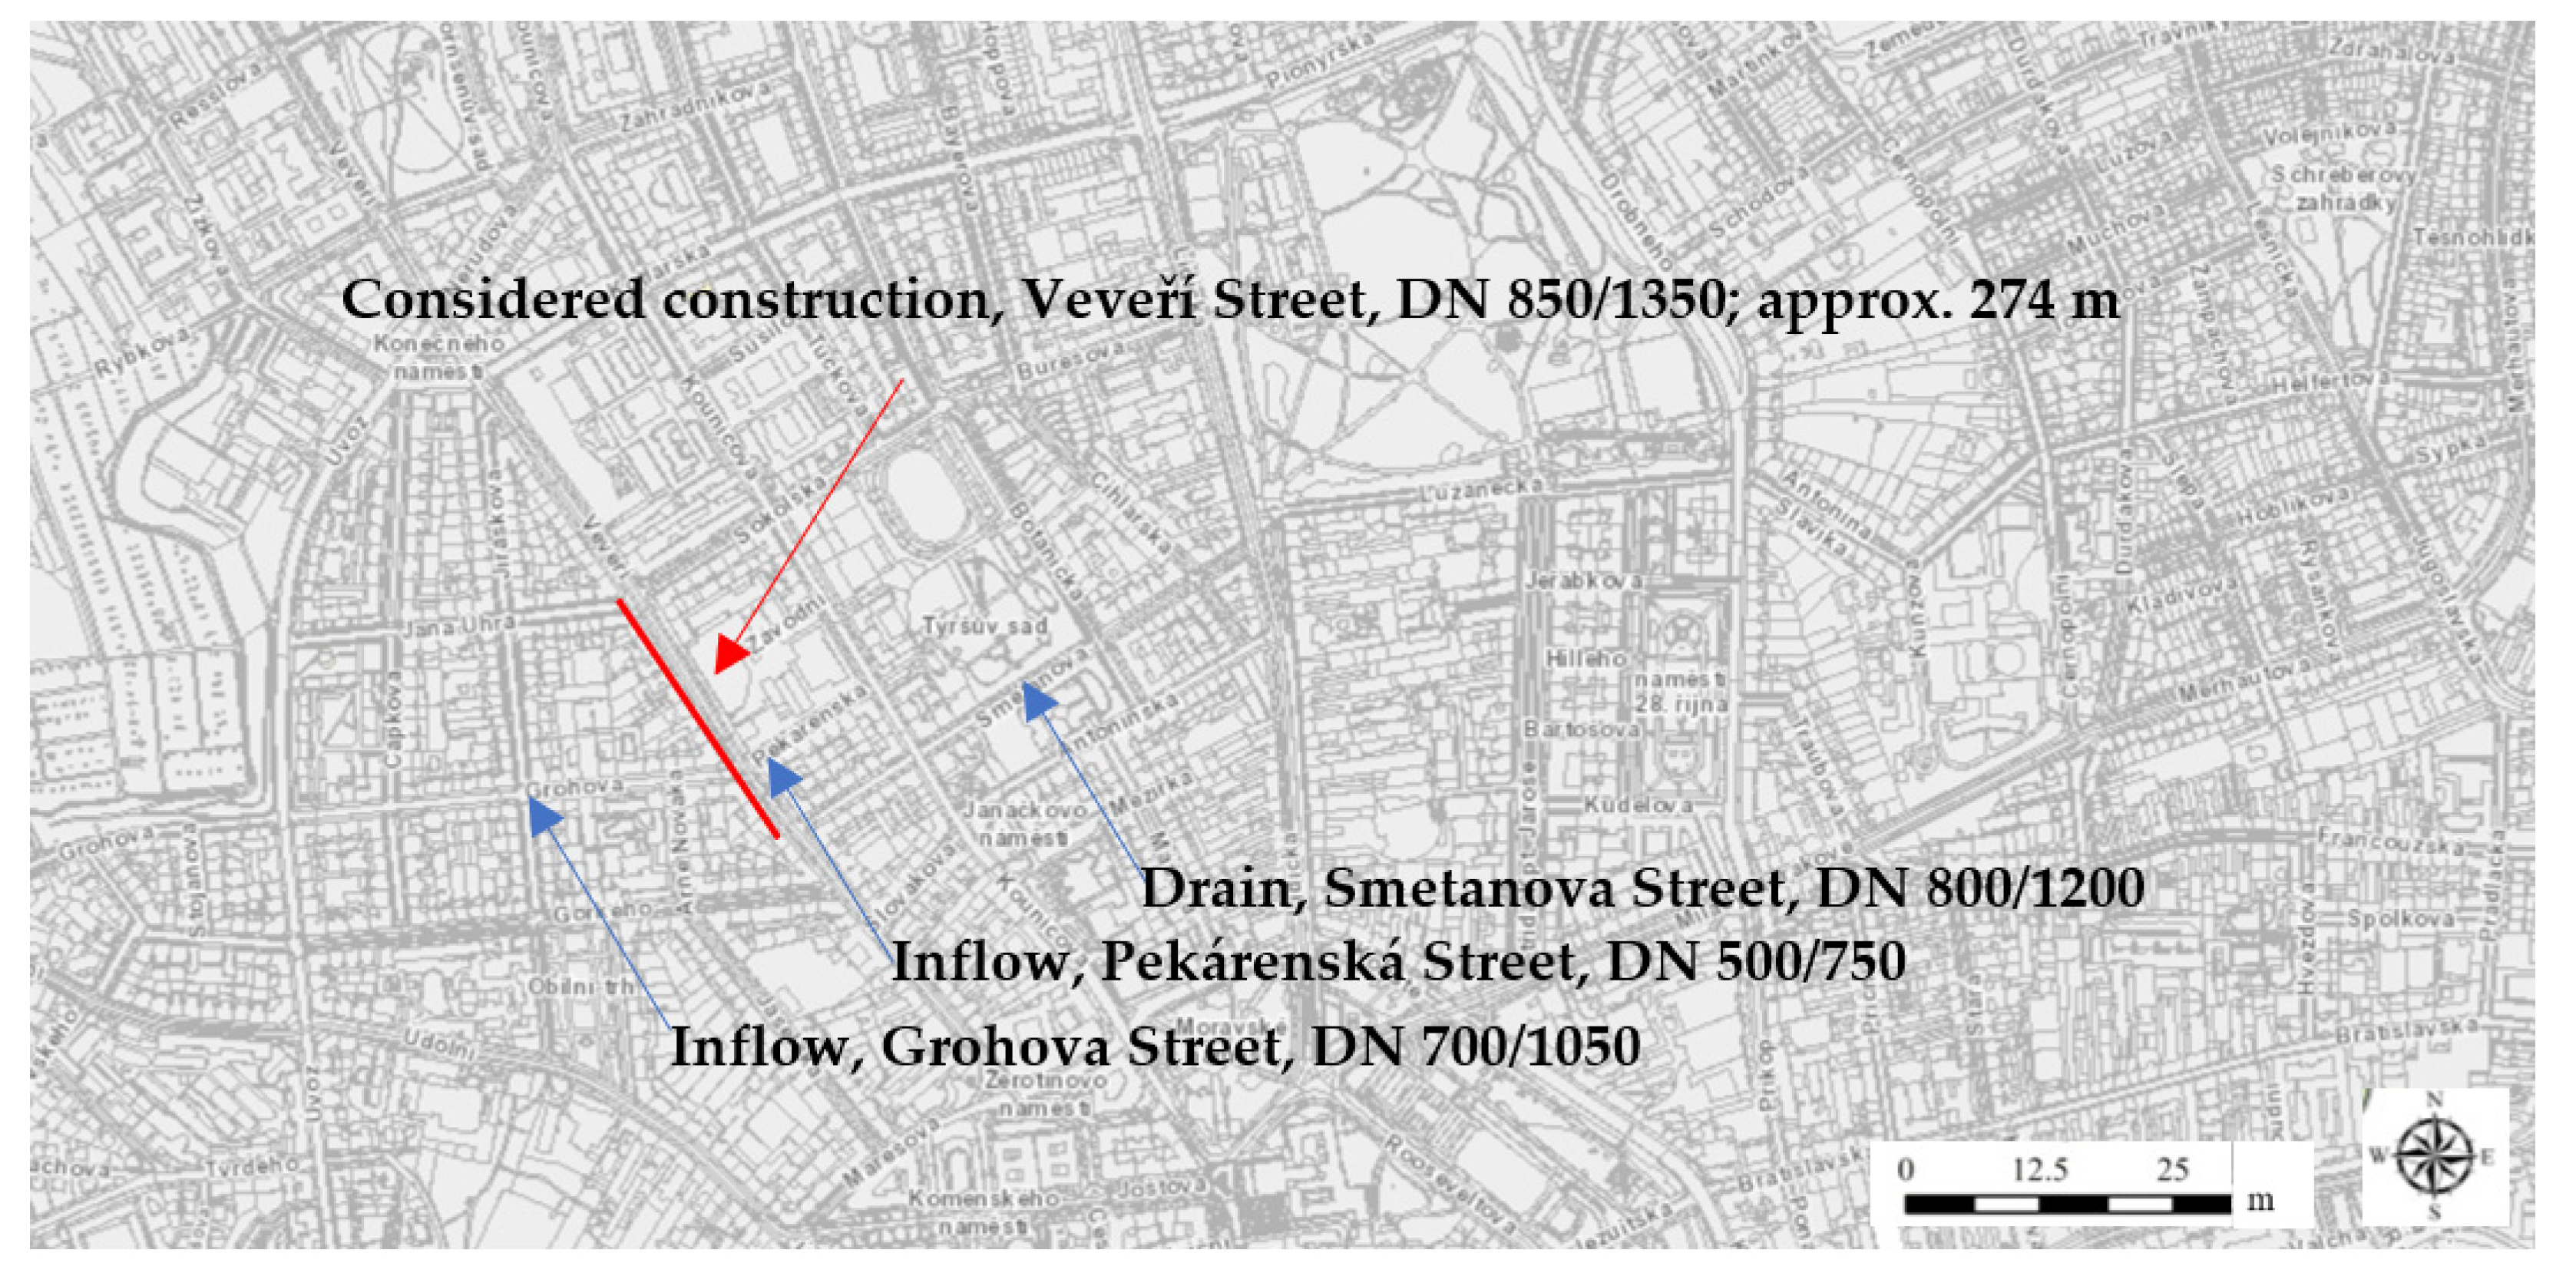
The existing sewer network underneath Veveří Street, in the section between the existing sewer shafts, was built from ovoid concrete pipes DN 850/1350 with a length of approximately 274 m and is located mainly in the middle of the tramway. There are 40 sewage connections connected to the existing sewer of interest, which are fed into the following sewers:
- Drain, Smetanova Street, DN 800/1200, made of concrete pipes with basalt lining;
- Inflow, Grohova Street, DN 700/1050, made of concrete pipes;
- Inflow, Pekárenská Street, DN 500/750, made of concrete pipes.
The construction under consideration addresses the rehabilitation of the existing sewer underneath Veveří Street, in the section from Smetanova Street to Sokolská Street, with a length of approximately 274 m, as shown in Figure 7 [45].
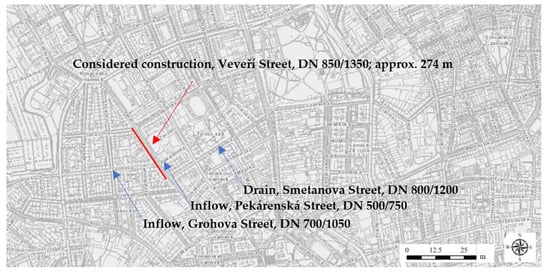
Figure 7.
Study location map [45].
5. Results
5.1. Comparison of Trenchless (Variant 1) and Excavation (Variant 2) Technologies
The processing and assessment of these two variants of technologies were conducted using the selected pilot location, focusing on the rehabilitation of the sewer network underneath Veveří Street in Brno.
The rehabilitation of the existing sewer was approached differently for each variant:
- Variant 1 addressed the rehabilitation of the section of interest of the sewer network using inverse trenchless technology, specifically renovation by lining in place with hardened hoses.
- Variant 2 addressed the rehabilitation of the section of interest by restoring the sewer using standard excavation technology.
The assessment of each variant considered the following indicators for trenchless technology (Variant 1) and excavation technology (Variant 2): project documentation, investment cost budgets, the schedule of anticipated design and construction works, and the overall impact of the implementation method in terms of monitoring selected carbon footprint indicators (e.g., the number of liters of fuel consumed during excavation work, the number of liters of fuel consumed for the transport of soil to the intermediate landfill and final landfill, and the carbon footprint of waste removal). The time schedules for the mentioned variants are outlined in Table 2.
Table 2.
Time schedules for the two distinct variants of technologies.
The determination of carbon footprint was approached analogously according to the methodology for determining the carbon footprint of a company [2].
5.2. Technical Description of Variant 1—Trenchless Technology
The rehabilitation of the sewer employed inverse trenchless technology, involving the pulling of the lining (non-woven fabric covered with polyurethane film and saturated with polyester resin) into the existing flow profile of the sewer. This method seals the pipe walls by fitting the lining into the damaged pipeline in an inverse manner. The walls of the rehabilitated pipeline were constructed with a smooth top foil, enhancing the hydraulic conditions within the rehabilitated pipe. Trenchless technology was implemented from existing inspection shafts, which were repaired after the completion of the rehabilitated pipeline.
The rehabilitation of the DN 850/1350 sewer progressed in the direction of wastewater flow. The renovation of the sewer was executed from the existing inspection shafts, which were removed and reinstated to their original condition following the pipeline’s rehabilitation.
Manholes in the rehabilitated section of the sewer underwent repair with masonry. The local filling of gaps, cracks, and caverns was carried out using a mortar mixture. The surface of the shafts was levelled with a trowel mortar with a thickness of 10 mm. Existing noncompliant steps were removed and either replaced with composite ladders or underwent no replacement. The shafts outside the rehabilitated section also underwent repair using the same method.
Earthworks commenced after laying out the utility networks and verifying them with hand-dug probes. The excavation work began with the removal of the existing surface structure.
The layers for the existing road construction were as follows:
Bituminous roadway:
- Asphalt: 41 cm.
- Macadam: 24 cm.
- Total: 65 cm.
Tram line:
- Cover plate: 16 cm.
- Concrete sleeper: 22 cm.
- Gravel beds incl. fret height: 50 cm.
- Total: 66 cm.
The groundwater level was situated below the foundation joint of the rehabilitated sewer, eliminating the need to account for the level of groundwater.
The aggregate percentage representation of individual classes of extractability, following the Czech Standard ČSN 73 3050 (excluding road construction work), was as follows:
- Class 2: 19%.
- Class 3: 59%.
- Class 4: 22%.
The aggregate percentage ratio of the individual mining classes according to the Czech Standard ČSN 73 6133 (excluding road construction work) was determined to be the following:
- Class I: 100%
The proportion of weight/bank (not original soil) was set at 50%, and the proportion of wet soils was set at 3%.
The excavations were filled to their entire width after the installation of the pipelines, relevant tests, surveying, and approval of the construction supervisor. Backfilling occurred in layers with a maximum thickness of 250–300 mm (before compaction). Above the top of the pipes, there was a backfill with a thickness of 300 mm that was filled with sorted material or according to the type of pipe laying. It was crucial to adhere to the technical conditions for laying pipes as specified by the relevant pipe manufacturer and the static assessment of the proposed laying method depending on the load and geological conditions.
Backfilling of trenches in the roads followed the TP (technical method) 146: “Permitting and execution of excavations and backfilling of trenches for utility networks in roadways” [46]. The material and technique used for the compaction met the required criteria. The bearing capacity of the plain had a value determined by the communications manager.
During the execution of the construction works and their inspection, compliance with quality requirements in accordance with the TP 146 issued by the Ministry of Transport of the Czech Republic in 2011 was essential. Replacement backfill material (full fractions) was utilized for backfilling construction trenches.
5.3. Technical Description of Variant 2—Excavation Technology
The sewer’s restoration encompassed earthworks and demolition activities within the section connecting the sewer shafts, coupled with the construction of a new sewer, including new sewer shafts. The construction of sewage drains took place in trenches with a width of 2.5 m, including furrows that were ploughed from the ground’s surface, with an adjacent spreading. Given the excavation’s depth, the digging and widening of the groove in the roadway and tramway were dimensioned to withstand the dynamic effects of frequent road traffic. To accommodate sewer manholes and culverts, the excavation was widened following the relevant standards. For larger monolithic sewer manholes, construction pits secured by steel casings with expansion frames were designed as part of the project documentation. The remaining characteristics aligned with those of Variant 1.
Renovation of the sewer network within the section between the sewer shafts involved the demolition of the existing concrete sewer DN 850/1350, which spanned approximately 274 m, including the sewer shafts. The demolished bituminous materials were transported to a controlled landfill within 9 km. The excavated soil volume was also transported to a controlled landfill within the same 9 km radius.
5.4. Selected Indicators from Individual Variants for the Purpose of Determining Their Carbon Footprint
The comparison of carbon footprints generated by Variant 1 and Variant 2 was based on specific input data, which were subsequently assessed and are shown in Table 3 and Table 4:
Table 3.
Summarization of input data for calculating the carbon footprints generated by Variant 1 and Variant 2.
Table 4.
Variant solution for construction works: Variant 1 with trenchless technology.
- Budget Item 1: Earthworks: “Horizontal relocation of the excavation with storage at the landfill for class 1 to 4 up to 9 km” was considered for the carbon footprint calculation. Other items were deemed negligible for this purpose.
- Budget Items 2–8: these items were considered negligible for the carbon footprint determination.
- Budget Item 9: Other Construction and Work, Demolition: the items “Horizontal transport of debris up to 9 km” and “Transfer of materials for pipelines from concrete pipes” were included in the comparison.
- Comparison Truck: a truck with a standard load of 8 t and a consumption rate of 40 l/100 kg was selected as the comparison vehicle for transporting soil, rubble, and materials (concrete pipelines or 23 mm thick lining).
- Variant 1 Energy Demands: For Variant 1, the energy demand included the “Wombat No. 6 mobile boiler” for producing hot water and steam during construction operations (36 h). The consumption of light heating oil was approximately 50 L/h, with a calorific value of 11.86 kWh/L.
- Additional Variant 1 Considerations: for Variant 1, the installation of the insert with the operation of 2 Sterling QP200 pumps (total of 40 h; consumption rate of approximately 6.5 L/h) and the operation of the ATLAS COPCO P3000 3 kW electrical control center (806 h; consumption rate of approximately 1 l/h) were also considered.
5.5. Determination of Carbon Footprints for Variant 1 and Variant 2
Table 5 presents the energy requirements for transporting soil (excavation), rubble, or materials for pipelines to the waste dump in terms of diesel fuel consumption.
Table 5.
Calculation of carbon footprints for Variant 1 and Variant 2.
Additionally, for Variant 1, energy consumption related to the operation of pumps for heating and steam circulation, as well as the energy associated with the operation of a steam boiler (light heating oil), was considered. Other items expressing the energy demand of Variant 1 and Variant 2 were assessed as negligible. Based on the data on the energy intensity of Variant 1 and Variant 2, their carbon footprint was determined (see Table 5) using Equation (1):
Emission in (t CO2 eq.) = Consumption in (MWh) or (L) · Emission factor
in (t CO2/MWh) or t CO2/L
in (t CO2/MWh) or t CO2/L
The emission assessment of Variant 1 involved a comprehensive analysis, considering the operational aspects of steam boiler No. 6, the overall functioning of the power plant, soil management, debris handling, material transport, and the operation of the two pumps. This thorough evaluation resulted in a total emission of 9.91 metric tons of CO2 equivalent (t CO2 eq). In contrast, the assessment of Variant 2, which focused on soil management, debris handling, and material transport, exhibited a significantly higher emission output, with a total of 24.29 metric tons of CO2 equivalent.
Upon a closer examination of the emission profiles of both variants, it is apparent that soil, debris, and material transport play a substantial role in the observed disparities. A detailed breakdown of the contributing factors in each variant provides insight into the emission sources, facilitating a nuanced understanding of the environmental impact associated with diverse operational components. This comprehensive analysis is essential for informed decision-making and the development of targeted strategies to minimize the carbon footprint in future operational scenarios.
5.6. Social Impact Assessment and Traffic Restrictions
One aspect of the impact assessment in the evaluation of the carbon footprints of trenchless and excavation technologies involved an examination of the so-called social impacts at the construction site, specifically the restoration of the water management infrastructure [47,48,49].
In October 2021, a questionnaire survey was conducted in the vicinity of Veveří Street, Brno. A total of 28 establishments directly adjacent to the site of the sewer network repair, implemented using trenchless technology, were approached. Feedback was obtained in the form of 20 completed questionnaires, representing a response rate of over 70% from potential participants.
The survey highlights that the surveyed establishments particularly valued the shorter duration of environmental restrictions associated with construction activities during the rehabilitation of the sewer network using trenchless technology. Given that the construction work occurred during holidays, the timing was considered excellent, minimizing the impact on the standard functioning of the affected companies. The direct effects of construction activities, such as noise, dust, and other restrictions, were more noticeable to companies with immediate concerns about their operational constraints.
6. Discussion
The assessment of energy demand from the application of trenchless and trench technologies, employing an analogy-based approach within Scope 1, involved the determination of direct process emissions, ultimately leading to the quantification of the carbon footprints. The conclusions regarding the carbon footprints resulting from the direct emissions of these technologies are as follows:
- The carbon footprint associated with Variant 1 involving trenchless technology amounts to 9.91 metric tons of CO2 equivalent (t CO2 eq.).
- On the contrary, the carbon footprint attributed to the excavation technology of Variant 2 totals 24.29 metric tons of CO2 eq.
The substantial reduction in carbon emissions (SR) was calculated according to Equation (2):
SR = (Carbon footprint of Variant 2—Carbon footprint of Variant 1)/Carbon footprint of Variant 2)
SR = (24.29–9.91)/24.29
SR = 0.592
When comparing these emission figures, it is noteworthy that Variant 1 (trenchless technology) exhibits a substantial reduction in carbon emissions, with a remarkable 59.2% reduction compared to the emissions generated by Variant 2 (excavation technology).
This discrepancy underscores the environmental advantages associated with the implementation of trenchless technology, emphasizing its potential to contribute significantly to the reduction of GHG emissions. The meticulous quantification of these carbon footprints is essential for informed decision-making and prioritizing environmentally sustainable practices within the field of construction and excavation technologies.
The use of trenchless technology emerges as a viable and cost-effective solution, provided that the technical condition of the sewer network under restoration allows its application, particularly when considering the carbon footprint determined by the energy demand of this technology. In our analysis, trenchless technology serves as the primary reference point, which is supplemented by an open trench implementation variant for a comprehensive assessment.
Our research aims to enhance its scope by incorporating geo-environmental factors and conducting impact analyses. Additionally, the introduction of a building inference method/model, uncertainty analysis, and an exploration of soil subsurface mechanical characteristics is envisaged. These integrations are pivotal to mitigating some of the inherent limitations in the current approach.
In a study conducted by Kaushal et al. (2020) [50], analogous assessment findings were obtained, affirming that, on average, the renewal of cured pipes resulted in a significant reduction of 68% in environmental impact, a substantial decrease of 75% in impact on human health, and a notable decline of 62% in resource depletion when juxtaposed with the open-cut replacement approach for small-diameter sanitary sewers. Also, the results presented in the study by Mohit et al. (2017) [40] indicated a reduction in airborne emissions ranging from 17% to 36% with the use of the pilot-tube method compared to the traditional hand tunneling method during the installation of a new 68 cm diameter clay sewer line.
In comparison, similar results were obtained in other large-scale constructions, as reported for a proposed underground freight transportation system [51]. In that study, the examination considers the construction of a freight pipeline on a proposed route from Huntsville to Madisonville, Texas, with a pipe diameter ranging from 8 to 13 ft. The analysis in the UFT study reveals that trenchless technology significantly outperforms the open-cut method in terms of carbon footprint. Specifically, the carbon footprint for the trenchless technology method amounts to 887 tons of CO2, while the open-cut method registers a substantially higher figure of 5379 tons of CO2, which is approximately six times higher. This stark difference underscores the environmentally friendly nature of trenchless technology in the construction of the 25-mile underground freight transportation system. The varying scopes and objectives of existing studies highlight the versatility of trenchless technology in mitigating environmental impact in various construction applications.
The results derived from this investigation are consistent with the findings reported in previous research endeavors [50,52,53,54,55,56,57,58,59]. This congruence underscores the reliability and corroborative nature of the current study, as it aligns with established knowledge and contributes to the growing body of evidence on this subject matter.
It is crucial to note that the presented case study holds a regional focus within a specific geographical location. While it is representative of an urban setting featuring streets with heavy traffic, including the historical core of the examined city, its applicability may be limited due to the lack of comparable previous studies. Recognizing the need for broader insights, a more extensive research effort is essential to identify similarities among the obtained results on a global scale. This approach is imperative for developing a comprehensive understanding and ensuring the generalizability of findings beyond the confines of specific regional contexts.
7. Conclusions
This article provides a comprehensive summary of the insights derived from an innovative voucher initiative, which, in the form of a research paper, facilitates a thorough comparison between trenched and trenchless technologies for the restoration of sewer networks, particularly in terms of carbon footprint. This emphasis on quantifying carbon emissions and energy requirements of each method represents a notable advancement in the field of environmental impact assessment. Conducted within the historical context of Brno, Czech Republic, this urban setting presents unique challenges for infrastructure projects, adding a significant layer of complexity and relevance to the study’s findings. The empirical nature of this investigation, anchored in real-world scenarios and specific metrics such as CO2 emissions and energy consumption, provides valuable insights for urban planners and environmental engineers. Furthermore, the article addresses the broader socio-economic impacts, encompassing social implications and traffic constraints, and thus offers a comprehensive perspective on the effects of these restoration technologies. While the study focuses on the Czech Republic, the insights it provides have wide-ranging implications, potentially informing global practices in sewer network restoration towards more ecologically sustainable methods.
While numerous analytical tools are currently available for automatically assessing the carbon footprints associated with trenched and trenchless technologies, it is noteworthy that these tools necessitate intricate input data and exhibit error rates reported to be in the range of 10% to 20%. In the context of the Czech Republic, addressing the carbon footprint issue at the corporate level is facilitated by legislative measures and accredited institutions. Certification is predominantly carried out through the implementation of the ISO 14,000 series of standards.
A distinct advantage of trenchless technology, as opposed to open-cut methods for pipeline construction, is its lower emission output. Moreover, with the escalating costs of fuel, waste disposal, and growing environmental and societal demands, the expenses associated with open-cut repairs and replacements are on the rise. In a comprehensive life-cycle cost evaluation, it is imperative to consider the total costs of pipe replacement or repair, encompassing social costs (both positive and negative), in order to detect the method with the most economically advantageous outcome. A discernible trend is emerging that favors trenchless construction methods to achieve cost-effectiveness amidst these considerations. As such, this article underscores the evolving preference for trenchless technologies as a strategic approach for achieving economic and environmental sustainability in sewer network restoration projects.
Author Contributions
Conceptualization, T.C., P.H. and J.R.; methodology, T.C., P.H. and Z.D.; validation, T.C., P.H. and J.R.; formal analysis, T.C. and K.P.-U. and Š.K.; investigation, T.C., Š.K.; resources, T.C., J.R. and K.P.-U.; data curation, T.C., P.H. and J.R.; writing—original draft preparation, T.C., P.H. and J.R.; writing—review and editing, T.C., Z.D. and K.P.-U.; visualization, K.P.-U. and B.T.-C.; supervision, T.C., P.H. and J.R.; project administration, Š.K., Z.D. and B.T.-C. All authors have read and agreed to the published version of the manuscript.
Funding
This study was supported with the co-financing by the Governments of Czechia, Hungary, Poland, and Slovakia through the Visegrad+ Grants from the International Visegrad Fund, project ID: 22220131.
Data Availability Statement
The data presented in this study are available on request from the corresponding author.
Conflicts of Interest
The authors declare no conflict of interest.
Appendix A
Table A1.
Summary of the application of excavation technologies for sewage systems, outlining their advantages and disadvantages during rehabilitation (self-generated work based on [32]).
Table A1.
Summary of the application of excavation technologies for sewage systems, outlining their advantages and disadvantages during rehabilitation (self-generated work based on [32]).
| Application and Installation | Pipeline Profile | Advantages | Disadvantages |
|---|---|---|---|
| Excavation Technology | |||
|
|
|
|
Table A2.
Summary of the application of trenchless renovation technologies for sewage systems, outlining their advantages and disadvantages during rehabilitation (self-generated work based on [32]).
Table A2.
Summary of the application of trenchless renovation technologies for sewage systems, outlining their advantages and disadvantages during rehabilitation (self-generated work based on [32]).
| Application and Installation | Pipeline Profile | Advantages | Disadvantages |
|---|---|---|---|
| Technology: Continuous piping lining | |||
|
|
|
|
| Technology: Lining with tight-fitting inserts | |||
|
|
|
|
| Technology: Lining in place with hardened hoses | |||
|
|
|
|
| Technology: Lining by inserting individual pipes | |||
|
|
|
|
| Technology: Lining by a pipe formed by a spirally wound belt | |||
|
|
|
|
| Technology: Lining with pipe segments | |||
|
|
|
|
| Technology: Lining with a firmly anchored inner plastic layer | |||
|
|
|
|
| Technology: Lining with a material that is sprayed or applied monolithically on the construction site | |||
|
|
| Requires excavation. |
References
- United Nations Conference on Climate Change (COP26), Summit of World Leaders, Glasgow. 2021. Available online: https://www.consilium.europa.eu/en/meetings/international-summit/2021/11/01/ (accessed on 10 December 2022).
- Regulation (EU) No. 305/2011 of the European Parliament and of the Council of 9 March 2011 Establishing Harmonized Conditions for Placing Construction Products on the Market and Repealing Council Directive 89/106/EEC. Available online: http://data.europa.eu/eli/reg/2011/305/oj (accessed on 10 December 2022).
- Akbarnezhad, A.; Xiao, J. Estimation and Minimization of Embodied Carbon of Buildings: A Review. Buildings 2017, 7, 5. [Google Scholar] [CrossRef]
- Mester, T.; Szabó, G.; Balla, D. Assessment of Shallow Groundwater Purification Processes after the Construction of a Municipal Sewerage Network. Water 2021, 13, 1946. [Google Scholar] [CrossRef]
- Mester, T.; Szabó, G.; Sajtos, Z.; Baranyai, E.; Kiss, E.; Balla, D. Assessment of Groundwater Decontamination Processes around a Dismantled Septic Tank Using GIS and Statistical Analysis. Water 2023, 15, 884. [Google Scholar] [CrossRef]
- Mester, T.; Szabó, G.; Sajtos, Z.; Baranyai, E.; Szabó, G.; Balla, D. Environmental Hazards of an Unrecultivated Liquid Waste Disposal Site on Soil and Groundwater. Water 2022, 14, 226. [Google Scholar] [CrossRef]
- Krejza, Z.; Vaňková, L.; Chovancová, J. Carbon Footprint Associated with Construction Industry and Determination of Its Theoretical Amount. IOP Conf. Ser. Earth Environ. Sci. 2019, 222, 012013. [Google Scholar] [CrossRef]
- Abbasi, M.A.; Parveen, S.; Khan, S.; Kamal, M.A. Urbanization and Energy Consumption Effects on Carbon Dioxide Emissions: Evidence from Asian-8 Countries Using Panel Data Analysis. Environ. Sci. Pollut. Res. 2020, 27, 18029–18043. [Google Scholar] [CrossRef]
- Zhang, L.; Feng, Y.; Chen, B. Alternative Scenarios for the Development of a Low-Carbon City: A Case Study of Beijing, China. Energies 2011, 4, 2295–2310. [Google Scholar] [CrossRef]
- Steininger, K.W.; Munoz, P.; Karstensen, J.; Peters, G.P.; Strohmaier, R.; Velázquez, E. Austria’s Consumption-Based Greenhouse Gas Emissions: Identifying Sectoral Sources and Destinations. Glob. Environ. Change 2018, 48, 226–242. [Google Scholar] [CrossRef]
- Piratla, K.R.; Ariaratnam, S.T.; Cohen, A. Estimation of CO2 Emissions from the Life Cycle of a Potable Water Pipeline Project. J. Manag. Eng. 2012, 28, 22–30. [Google Scholar] [CrossRef]
- Kubová, P.; Hájek, M.; Třebický, V. Carbon Footprint Measurement and Management: Case Study of the School Forest Enterprise. BioResources 2018, 13, 4521–4535. [Google Scholar] [CrossRef]
- Loyarte-López, E.; Barral, M.; Morla, J.C. Methodology for Carbon Footprint Calculation Towards Sustainable Innovation in Intangible Assets. Sustainability 2020, 12, 1629. [Google Scholar] [CrossRef]
- Zeleňáková, M.; Markovič, G.; Kaposztásová, D.; Vranayová, Z. Rainwater Management in Compliance with Sustainable Design of Buildings. Procedia Eng. 2014, 89, 1515–1521. [Google Scholar] [CrossRef]
- Zeleňáková, M.; Zvijáková, L. Risk Analysis within Environmental Impact Assessment of Proposed Construction Activity. Environ. Impact Assess. Rev. 2017, 62, 76–89. [Google Scholar] [CrossRef]
- Hluštík, P.; Zeleňáková, M. Risk Analysis of Failure in Sewer Systems in Czech Municipalities. Pol. J. Environ. Stud. 2019, 28, 4183–4190. [Google Scholar] [CrossRef]
- Ghavami, S.M.; Borzooei, Z.; Maleki, J. An Effective Approach for Assessing Risk of Failure in Urban Sewer Pipelines Using a Combination of GIS and AHP-DEA. Process Saf. Environ. Prot. 2020, 133, 275–285. [Google Scholar] [CrossRef]
- Arroyo, M.F.R.; Miguel, L.J. Low-Carbon Energy Governance: Scenarios to Accelerate the Change in the Energy Matrix in Ecuador. Energies 2020, 13, 4731. [Google Scholar] [CrossRef]
- Chen, G.; Wiedmann, T.; Hadjikakou, M.; Rowley, H. City Carbon Footprint Networks. Energies 2016, 9, 602. [Google Scholar] [CrossRef]
- Mueller, K.; Lauvaux, T.; Gurney, K.; Roest, G.; Ghosh, S.; Gourdji, S.; Karion, A.; DeCola, P.; Whetstone, J. An Emerging GHG Estimation Approach Can Help Cities Achieve Their Climate and Sustainability Goals. Environ. Res. Lett. 2021, 16, 084003. [Google Scholar] [CrossRef]
- Xia, C.; Li, Y.; Ye, Y.; Shi, Z.; Liu, J. Decomposed Driving Factors of Carbon Emissions and Scenario Analyses of Low-Carbon Transformation in 2020 and 2030 for Zhejiang Province. Energies 2017, 10, 1747. [Google Scholar] [CrossRef]
- Fry, J.; Lenzen, M.; Jin, Y.; Wakiyama, T.; Baynes, T.; Wiedmann, T.; Malik, A.; Chen, G.; Wang, Y.; Geschke, A.; et al. Assessing Carbon Footprints of Cities under Limited Information. J. Clean. Prod. 2018, 176, 1254–1270. [Google Scholar] [CrossRef]
- Chen, G.; Hadjikakou, M.; Wiedmann, T.; Shi, L. Global Warming Impact of Suburbanization: The Case of Sydney. J. Clean. Prod. 2018, 172, 287–301. [Google Scholar] [CrossRef]
- Ariaratnam, S.T.; Piratla, K.; Cohen, A.; Olson, M. Quantification of Sustainability Index for Underground Utility Infrastructure Projects. J. Constr. Eng. Manag. 2013, 139, A4013002. [Google Scholar] [CrossRef]
- Stecko, J. Trust as an Essential Factor behind Economic Decisions. Actual Probl. Econ. 2016, 180, 299–304. Available online: https://www.scopus.com/inward/record.uri?eid=2-s2.0-84978733613&partnerID=40&md5=ef399d61565bdb46e0596179cf3191a8 (accessed on 10 January 2023.).
- Prinzing, M. Going Green Is Good for You: Why We Need to Change the Way We Think about Pro-Environmental Behavior. Ethics Policy Environ. 2023, 26, 1–18. [Google Scholar] [CrossRef]
- Boerner, R.E.J. Ecology and Our Endangered Life-Support Systems. J. Environ. Qual. 1990, 19, 350–351. [Google Scholar] [CrossRef]
- Stephens, S.L.; McIver, J.D.; Boerner, R.E.J.; Fettig, C.J.; Fontaine, J.B.; Hartsough, B.R.; Kennedy, P.L.; Schwilk, D.W. The Effects of Forest Fuel-Reduction Treatments in the United States. BioScience 2012, 62, 549–560. [Google Scholar] [CrossRef]
- EN 14654-2:2021; Drainage and Sewerage Systems Outside Buildings. Management and Control of Operations. Part 2: Remediation. European Committee for Standardization. CEN Brussels: Brussels, Belgium, 2021. Available online: https://standards.globalspec.com/std/14361274/EN%2014654-2 (accessed on 10 January 2023).
- Ti, Z.; Wang, F.; Zhao, Y.; Ma, B.; Zeng, C.; Liao, B. Theoretical Study on Design of Composite Lining Structure with Rigid–Flexible Combination for Trenchless Pipeline Rehabilitation. Appl. Sci. 2022, 12, 5374. [Google Scholar] [CrossRef]
- EN 1610:2017; Implementation of Sewers and Sewage Connections and Their Testing. European Committee for Standardization; CEN Brussels: Brussels, Belgium, 2017. Available online: https://standards.iteh.ai/catalog/standards/cen/8762de52-0030-4a8c-88ec-574bdec5f761/en-1610-2015 (accessed on 11 January 2023).
- EN 15885:2019; Classification and Functional Characteristics of Technologies for Renovation, Repair and Replacement of Sewers and Sewer Connections. European Committee for Standardization; CEN Brussels: Brussels, Belgium, 2019. Available online: https://standards.iteh.ai/catalog/standards/sist/9e964e23-8a4c-4984-949c-60dd8c33b67f/sist-en-15885-2019 (accessed on 1 June 2023).
- Lee, B.-J.; Yun, S.-Y.; Jeong, I.-K.; Hwang, Y.; Park, J.-H.; Kim, J. Improving the Measurement of Characteristic Parameters for the Determination of GHG Emissions in the Semiconductor and Display Industries in Korea. Appl. Sci. 2023, 13, 8834. [Google Scholar] [CrossRef]
- The Greenhouse Gas Protocol. A Corporate Accounting and Reporting Standard; World Resources Institute and World Business Council for Sustainable Development: Washington, DC, USA, 2004; Available online: https://ghgprotocol.org/sites/default/files/standards/ghg-protocol-revised.pdf (accessed on 5 December 2022).
- IPCC. Climate Change 2014: Mitigation of Climate Change. Contribution of Working Group III to the Fifth Assessment Report of the Intergovernmental Panel on Climate Change; Edenhofer, O., Pichs-Madruga, R., Sokona, Y., Farahani, E., Kadner, S., Seyboth, K., Adler, A., Baum, I., Brunner, S., Eickemeier, P., et al., Eds.; Cambridge University Press: Cambridge, UK; New York, NY, USA, 2014; Available online: https://www.ipcc.ch/site/assets/uploads/2018/02/ipcc_wg3_ar5_full.pdf (accessed on 11 January 2023).
- Třebický, V. Methodology for Determining the Carbon Footprint of an Enterprise, Cl2, o.p.s. 2016. Available online: https://ci2.co.cz/sites/default/files/souboryredakce/metodika_final_vystup.pdf (accessed on 10 December 2022).
- Intergovernmental Panel on Climate Change (IPCC). Guidelines for National Greenhouse Gas Inventories. Available online: https://www.ipcc-nggip.iges.or.jp/public/2006gl/index.html (accessed on 10 January 2023).
- Decree No. 480/2012 Coll. Decree on Energy Audit and Energy Assessment. Available online: https://www.zakonyprolidi.cz/cs/2012-480 (accessed on 11 January 2023).
- Decree No. 140/2021 Coll. Decree on Energy Audit. Available online: https://www.zakonyprolidi.cz/cs/2021-141?text=Decree%20No.%20140%2F2021%20Coll.%20Decree%20on%20Energy%20Audit (accessed on 10 January 2023).
- Decree No. 141/2021 Coll. Decree on Energy Assessment and Data Kept in the Energy Consumption Monitoring System. Available online: https://www.zakonyprolidi.cz/cs/2021-141?text=vyhl%c3%a1%c5%a1ka+energetick%c3%a9+posudky (accessed on 10 January 2023).
- The Value of the CO2 Emission Factor from Electricity Production for the Years 2010–2019; Ministry of Industry and Trade, Czech Republic: Praga, Czech Republic, 2021. Available online: https://www.mpo.cz/cz/energetika/statistika/elektrina-a-teplo/hodnota-oftheco2-emission-factor-from-electricityproduction-for-years-2010_2019--258830/ (accessed on 15 December 2022).
- Bogalecka, M. Probabilistic Approach to Modelling, Identification and Prediction of Environmental Pollution. Environ. Model. Assess. 2022, 28, 1–14. [Google Scholar] [CrossRef]
- Hao, J.; Wang, Y.; Wu, Y.; Guo, F. Metal Recovery from Waste Printed Circuit Boards: A Review for Current Status and Perspectives. Resour. Conserv. Recycl. 2020, 157, 104787. [Google Scholar] [CrossRef]
- Alnaimy, M.; Zelenakova, M.; Vranayova, Z.; Abu-Hashim, M. Effects of Temporal Variation in Long-Term Cultivation on Organic Carbon Sequestration in Calcareous Soils: Nile Delta, Egypt. Sustainability 2020, 12, 4514. [Google Scholar] [CrossRef]
- Digital Map of Brno. Available online: https://mestobrno.maps.arcgis.com/apps/webappviewer/index.html?id=a217f5ecea584d95abb3583759d7a48f (accessed on 10 December 2022).
- Ministry of Transport of the Czech Republic. Department of Land Communications. Permitting and Carrying out Excavations and Backfilling of Trenches for Utility Networks in Roadways. TP 146. Technical Conditions. Available online: https://www.vnictp.cz/sites/default/files/content/article/technicke-podminky-tp-146-ministerstva-dopravy-cr-z-roku-2011/tp146vs2011cj72011120tn1.pdf (accessed on 10 December 2023).
- Ariaratnam, S.T. Social and Environmental Sustainability of Trenchless Technologies. In Proceedings of the 30th International No-Dig Conference and Exhibition 2012, No-Dig, Sao Paulo 2012, Sao Paulo, Brazil, 12–14 November 2012; pp. 335–344. Available online: https://asu.elsevierpure.com/en/publications/social-and-environmental-sustainability-of-trenchless-technologie (accessed on 11 January 2023).
- Beale, D.J.; Marlow, D.R.; Cook, S. Estimating the Cost and Carbon Impact of a Long Term Water Main Rehabilitation Strategy. Water Resour. Manag. 2013, 27, 3899–3910. [Google Scholar] [CrossRef]
- Ferreira, E.P.; dos Anjos, L.H.C.; Pereira, M.G.; Valladares, G.S.; Cipriano-Silva, R.; Azevedo, A.C. de Genesis and Classification of Soils Containing Carbonate on the Apodi Plateau, Brazil. Rev. Bras. Ciênc. Solo 2016, 40. [Google Scholar] [CrossRef]
- Kaushal, V.; Najafi, M. Comparative Assessment of Environmental Impacts from Open-Cut Pipeline Replacement and Trenchless Cured-in-Place Pipe Renewal Method for Sanitary Sewers. Infrastructures 2020, 5, 48. [Google Scholar] [CrossRef]
- Tavakoli, R.; Najafi, M.; Tabesh, A.; Ashoori, T. Comparison of Carbon Footprint of Trenchless and Open-Cut Methods for Underground Freight Transportation. 2017, p. 55. Available online: https://ascelibrary.org/doi/10.1061/9780784480892.005 (accessed on 11 January 2023).
- Chilana, L.; Bhatt, A.H.; Najafi, M.; Sattler, M. Comparison of Carbon Footprints of Steel versus Concrete Pipelines for Water Transmission. J. Air Waste Manag. Assoc. 2016, 66, 518–527. [Google Scholar] [CrossRef]
- Kaushal, V.; Najafi, M.; Serajiantehrani, R. Environmental Impacts of Conventional Open-Cut Pipeline Installation and Trenchless Technology Methods: State-of-the-Art Review. J. Pipeline Syst. Eng. Pract. 2020, 11, 03120001. [Google Scholar] [CrossRef]
- Alsadi, A.A.; Matthews, J.C. Evaluation of Carbon Footprint of Pipeline Materials during Installation, Operation, and Disposal Phases. J. Pipeline Syst. Eng. Pract. 2020, 11, 04020005. [Google Scholar] [CrossRef]
- Swallow, A.W.; Sheil, B.B. Embodied Carbon Analysis of Microtunneling Using Recent Case Histories. J. Geotech. Geoenviron. Eng. 2023, 149, 04023087. [Google Scholar] [CrossRef]
- Ariaratnam, S.T.; Sihabuddin, S.S. Comparison of Emitted Emissions Between Trenchless Pipe Replacement and Open Cut Utility Construction. J. Green Build. 2009, 4, 126–140. [Google Scholar] [CrossRef]
- Ahn, C.; Xie, H.; Lee, S.; Abourizk, S.; Peña-Mora, F. Carbon Footprints Analysis for Tunnel Construction Processes in the Preplanning Phase Using Collaborative Simulation. In Proceedings of the Construction Research Congress 2010, Banff, Canada, 8–10 May 2010; pp. 1538–1546. [Google Scholar] [CrossRef]
- Loss, A.; Toniolo, S.; Mazzi, A.; Manzardo, A.; Scipioni, A. LCA Comparison of Traditional Open Cut and Pipe Bursting Systems for Relining Water Pipelines. Resour. Conserv. Recycl. 2018, 128, 458–469. [Google Scholar] [CrossRef]
- Lu, H.; Matthews, J.; Iseley, T. How Does Trenchless Technology Make Pipeline Construction Greener? A Comprehensive Carbon Footprint and Energy Consumption Analysis. J. Clean. Prod. 2020, 261, 121215. [Google Scholar] [CrossRef]
Disclaimer/Publisher’s Note: The statements, opinions and data contained in all publications are solely those of the individual author(s) and contributor(s) and not of MDPI and/or the editor(s). MDPI and/or the editor(s) disclaim responsibility for any injury to people or property resulting from any ideas, methods, instructions or products referred to in the content. |
© 2024 by the authors. Licensee MDPI, Basel, Switzerland. This article is an open access article distributed under the terms and conditions of the Creative Commons Attribution (CC BY) license (https://creativecommons.org/licenses/by/4.0/).