Article

A Comprehensive Approach to Assess the Impact of Agricultural Production Factors on Selected Ecosystem Services in Poland

by
Waldemar Bojar
1,
Wojciech Żarski
1,
Renata Kuśmierek-Tomaszewska
2,*,
Jacek Żarski
2,
Piotr Baranowski
3,
Jaromir Krzyszczak
3,
Krzysztof Lamorski
3,
Cezary Sławiński
3,
Konstadinos Mattas
4,
Christos Staboulis
4,
Dimitrios Natos
4,
Ahmet Ali Koç
5,
Ahmet Bayaner
6,
Álvaro Ojeda Roldán
7 and
Obdulia Parra Rivero
8
1
Faculty of Management, Bydgoszcz University of Science and Technology, Fordońska 430, 85-790 Bydgoszcz, Poland
2
Faculty of Agriculture and Biotechnology, Bydgoszcz University of Science and Technology, Bernardyńska 6/8, 85-029 Bydgoszcz, Poland
3
Institute of Agrophysics, Polish Academy of Sciences, Doświadczalna 4, 20-290 Lublin, Poland
4
Department of Agricultural Economics, Aristotle University of Thessaloniki, 54124 Thessaloniki, Greece
5
Faculty of Economics and Administrative Sciences, Department of Economics, Akdeniz University, Dumlupınar Boulevard, 07058 Antalya, Turkey
6
Faculty of Economics and Administrative Sciences, Department of Business Administration, Akdeniz University, Dumlupınar Boulevard, 07058 Antalya, Turkey
7
Division of Energy & Industry 4.0, Idener Technologies, C/Earle Ovington 24, 8-9, 41300 La Rinconada, Seville, Spain
8
R&D Department, Cooperativas Agro-Alimentarias de Andalucía, Demetrio de los Ríos 15, 41003 Seville, Seville, Spain
*
Author to whom correspondence should be addressed.
Resources 2023, 12(9), 99; https://doi.org/10.3390/resources12090099
Submission received: 27 June 2023 / Revised: 23 August 2023 / Accepted: 24 August 2023 / Published: 28 August 2023

Abstract

:
The conservation of environmental resources is aimed at ensuring the continuity of ecosystem services for future generations and maintaining ecosystem integrity. Given the extensive reliance of agriculture on the environment, it is crucial to identify factors that impact the quality of ecosystem services (ESs), which can be regulated at large and heterogeneous national or European scales. This research, conducted within the Polish use case of the AGRICORE project, aims to demonstrate the feasibility of establishing indicators depicted in three ES categories, which can be shaped under the actions of the Common Agricultural Policy (CAP). The study was conducted based on national sources, mostly the database of the Central Statistical Office. The analyses of regression showed a significant impact of selected agricultural productivity factors on the key performance indicators (KPIs) assessing the level of selected ESs. The yield of cereal grains, which quantitatively expresses the potential of current crop production, depended to the greatest extent (r = 0.81) on a comprehensive indicator of the agricultural production space suitability, as well as on the rise of the level of nitrogen fertilization (r = 0.68), and also on the reduced share of permanent grassland in the agricultural area (r = −0.53). It was proved that in territorial units, in which the level of nitrogen fertilization per 1 ha was greater, the share of soils with favorable pH > 5.5 was also greater. The gross nitrogen balance had a positive and significant correlation with the level of investment subsidies (r = 0.86), the share of agricultural land in the total area (r = 0.67), and the level of nitrogen fertilization (r = 0.66). Notably, there were positive correlations between the level of environmental subsidies and the increase in forestation (r = 0.68) and also between air quality and the share of cereals in the sowing structure (r = 0.86). Additionally, the impact of agricultural productivity factors on cultural eco-services was found, e.g., the share of ecological land had a positive impact on the number of natural monuments, the area of nature reserves, the number of agritourists, and agritourism nights, while the share of cereals in the sowing structure negatively correlated with the most of analyzed cultural indicators. These results are useful for the development of a module for the ABM model that employs the desired environmental parameters to provide different assessments of the impact of selected agricultural productivity factors and ecosystem services on the economic farm status.

1. Introduction

Ecosystem services (ESs) are defined as “the benefits that ecosystems provide to human well-being” [1]. The paradigm of ESs has undergone progressive development and accrued substantial significance since the 1980s [2]. The current literature on ecosystem services often employs models tailored to specific conditions. Most known are Artificial Intelligence for Environment and Sustainability (ARIES), Lund–Potsdam–Jena General Ecosystem Simulator (LPJ-GUESS), Co$ting Nature (Policy support system for natural capital accounting and analyzing the ecosystem services), WaterWorld (Water policy support system), Integrated Valuation of Ecosystem Services and Trade-offs (InVEST), Resource Investment Optimization Service (RIOS), The Universal Soil Loss Equation (USLE), Conversion of Land Use and its Effects (CLUE-s), Global Biodiversity Model for Policy Support (GLOBIO), and Integrated Model to Assess the Global Environment (IMAGE) [3]. However, few of these large-scale modeling platforms enable customization with local data, parameterizations, or adjustments to model the structure to reflect local knowledge of processes that underlie ES supply and demand [4]. Most of the ES models address three main relationships: (i) models projecting effects of changes in indirect drivers, including policy interventions, on direct drivers (the approach used in this paper); (ii) models projecting impacts of changes in direct drivers on nature (biodiversity and ecosystems); and (iii) models projecting the consequences of changes in biodiversity and ecosystems for the benefits that people derive from nature (including ecosystem services). The above relationships can be modeled using three broad approaches: correlative models (we chose this approach), process-based models, or expert-based models [5]. Concurrently, they contain detailed information on their limitations, with some explicitly acknowledging the infeasibility of extrapolating model outcomes to alternate areas. Sharps et al. [6] compared three ES modeling tools and pointed out their weaknesses. According to the authors, one of the limitations is the annual time limit in which the models or tools work. As a result, high volatility over time of elements such as water consumption or electricity demand may be omitted. In addition, modeling ecosystem services in considerable time steps may ignore the interaction of various environmental factors. The use of average values of selected indicators may not consider such diversity as soil variability, spatial diversity, height above sea level, thermal conditions, or land use. What is more, the published results of analyses are often based on selected case studies that have certain limitations and therefore cannot always be transferred directly to another area, e.g., macro- and microelement migration in soil profiles may be conditioned by many factors related to the type of agricultural production, soil properties, and climate conditions. Finally, the problem is the small number of measurement points for monitoring the environment, which makes it difficult to verify the models. A universal model that would allow the determination of key performance indicators (KPIs) for various areas characterized by different conditions in terms of water, soil, climate, and other conditions has not been created yet [7]. Ecosystem services are multidisciplinary and must be considered in terms of natural economic and agricultural aspects. Consequently, the collection of suitably precise, comprehensive, and harmonious data for their evaluation represents a prominent challenge, particularly considering the varied nature of environmental reporting and the acquisition of pertinent information [8,9].
To support measuring, accounting for, and assessing ecosystem services at the international level, a hierarchical framework named the Common International Classification of Ecosystem Services (CICES) was designed. It provides a common naming and classification system and categorizes ES into three main categories: (i) provisioning, (ii) regulation and maintenance, and (iii) cultural [10,11]. Depending on their nature, system services can be considered in different spatial scales, ranging from the global (such as global climate change mitigation) to the local scale (exemplified by pest control). The spatial components of ecosystem services span across diverse geographical extents and encompass various ecological processes and functions. Moreover, they demonstrate the intricate interplay between ecosystems and human well-being at multiple levels of analysis [12]. The CICES findings on abiotic ecosystems show that there is a need for a complementary approach to all environmental services. The trade-offs between the use of different resources of the ecosystem services are sometimes necessary. In the context of environmental accounting, the expansion of exposure scenario classifications to encompass a broader range of abiotic products beyond the existing inclusion of water supply within the CICES framework would prove advantageous. This augmentation would facilitate a more comprehensive assessment of environmental impacts and resource utilization, necessitating the incorporation of additional abiotic products into the analytical framework.
In response to these challenges, our study aims to assess the potential for ecosystem services development in Poland through the use of regulating indicators under the CAP. This study attempts to define solutions that could help to assess the development potential of ecosystem services in Poland. The objective of our analysis is to examine to what extent some of the agricultural production factors, as well as environmental changes, can impact selected ecosystem services. Specifically, our investigations aim to demonstrate the feasibility of establishing indicators depicted in three ES categories, which can be modified by the actions of CAP. The analysis encompasses both qualitative assessments, such as trade-offs or synergistic combinations, and quantitative assessments that explore the impact of altering a particular indicator on the corresponding change in the ecosystem service. The outcomes of these investigations are aimed to identify key performance indicators (KPIs) that possess universality and can be incorporated into the ABM module for modeling ecosystem services within the AGRICORE tool.
A critical issue in scientific discussions is finding methodologies that effectively integrate economic and social goals with environmental imperatives [13,14]. The second issue is the identification of optimal solutions for various stakeholders involved in the development of the ESs, which is dependent on their distinct interests, posing a formidable challenge within the spatial context and pertaining to the varying scales of operation associated with individual environmental conditions and economic interests. These divergent needs and preferences often lead to conflicts between stakeholders [15,16,17,18,19]. Limited data availability, modeling technique constraints, and application nuances create challenges for the objective assessment of ecosystem services in Poland. They were the reason for attempting to define solutions that could help to assess the potential of the development of ecosystem services in Poland [20].

2. Materials and Methods

2.1. Data Sources

The selection of specific factors and indicators for this research was driven by the availability of comprehensive data covering the entirety of Poland during the recent period of 2020–2021. These data considerations played a crucial role in determining the variables under investigation. A standardized methodology was used to ensure robustness and comparability to develop indicators across the highest-level administrative division of Poland (voivodships), which is composed of 16 territorial units (Figure 1). The specific factors and indicators calculated separately for 16 voivodships were used to perform statistical analyses. Data from national databases and other national sources were used for the analysis. We were unable to obtain data from the Farm Accountancy Data Network (FADN) due to anonymity issues and bureaucracy related to the EU–FADN microdata application.
After conducting an extensive search across available databases, a total of eight factors related to agricultural production in Poland were carefully chosen for analysis. These factors encompass environmental components (F.1–4), agrotechnical considerations (F.5, F.6), and financial aspects (F.7, F.8). Detailed descriptions of these factors can be found in Table 1. It is noteworthy that all factors, except for F.1 (agricultural production space suitability index), are deemed to be influenced by the Common Agricultural Policy (CAP). Specifically, this policy presents an opportunity to shape the level of agricultural subsidies in Poland, thereby exerting a direct impact on the aforementioned factors.
Key performance indicators (KPIs), which serve as measurable values for the effectiveness of certain processes, were selected. These indicators (16 in total) were categorized into three groups based on the widely adopted classification: production/procurement services (4 indicators, denoted as P.1–P.4), environmental services with regulatory and supporting functions (7 indicators, denoted as E.1–E.7), and cultural services (5 indicators, denoted as C.1–C.5). For specific details, please refer to Table 2.
Data for this study were collected from open-access databases of Statistics Poland Reports, downloaded from the website stat.gov.pl/en/ accessed on 10 January 2023, as well as from the publications of the Poland Statistical Office [21,22,23,24,25]. The obtained data allowed us to determine F.2, F.4, F.5, F.6, P.1–4, E.4, E.5, and C.1–5. Due to some serious gaps or no data continuity in environmental monitoring, other sources of the data were explored. These sources included the following items: the research results from scientific papers and studies issued by the Institute of Cultivation, Fertilization, and Soil Science–National Research Institute in Puławy [26,27,28] and the Reports of the Chief Inspectorate of Environmental Protection (GIOŚ) [29]. These sources enabled us to determine factors F.1, F.2, F.7, and indicators E.1–3, E.6–7. To assess the values of subsidies for agricultural production under the Rural Development Program 2014–2020, M10–Agri-environment-climate measure, 10.1–sub-measure: Payments under Agri-environment-climate commitments (F.8.), the data from the reports available on the website of the Polish Agency for Modernization and Restructuring of Agriculture (ARMIR https://www.gov.pl/web/arimr accessed on 5 February 2023) [30] were analyzed. Data downloaded from databases were in the form of Excel files, while other sources were downloaded as pdf files, and the values copied to a spreadsheet format.
For most of the factors and indicators, the recently available data (years 2019–2020) were used. However, due to the lack of information on this period regarding indicators C.1 and C.5, the data from 2021 and the average of 2017–2021 (due to the coronavirus pandemic) had to be used, respectively. The data to evaluate all factors were taken directly from the above-mentioned databases, except for the indicators of cultural ecosystem services, which were recalculated to ensure the comparability of this data for all territorial units. To ensure comparability across all territorial units, the indicators of cultural ecosystem services C.1–C.5 required recalculation and were subsequently expressed per uniform number of inhabitants or a uniform area unit.

2.2. Statistical Analysis

The calculations carried out under the research objective consisted of searching for significant relationships between agricultural productivity factors and the selected KPIs. The Student t-test was used to assess the statistical significance of the relationship between agricultural productivity factors and selected KPIs to confirm the hypothesis that agricultural productivity factors modify selected ES indicators. Correlation coefficients were considered significant if the correlation coefficients were equal or greater than the critical value of 0.4973 (at the significance level p = 0.05) and 0.6226 (at the significance level p = 0.01). Additionally, some descriptive statistics, such as mean, extreme values, standard deviation (σ), and coefficient of variation (CV), were used.

3. Results and Discussion

Ecosystem services impacted by agriculture are of fundamental importance for human life, but only some of them are valued by the market and affect the way natural resources are managed. Other services are currently being appreciated and rewarded by agricultural policy as an instrument for the management of natural resources in agriculture. Our research results indicate that the assessment of the impact of agricultural production on selected ecosystem services is a challenging task that requires access to many sources of information. The complexity of the problem is evidenced by the remarkably high variability of the level of agricultural production as well as the diversification and development of the natural landscape within the territory of Poland.

3.1. Variability of the Agricultural Productivity Factors and KPIs of ESs for Poland

The agricultural productivity factors indicate their large spatial diversity in particular territorial units of Poland, which is evident from the values of the coefficient of variation (CV). The greatest variability expressed by CV = 106.9% was observed for factor F.4—the share of ecological land in the area of agricultural land (Table 3). This variability of agricultural production can be explained by the fact that Polish agriculture shows significant regional differences, resulting from natural, economic, organizational, infrastructural, and socio-cultural conditions, as well as historical conditions (partitions). The level of agricultural development is conditioned by the general level of economic development of the country and the region. On the other hand, the level and structure of production factor resources in the region define and determine the structure of agricultural production. The actual production volume in relation to potential possibilities is a measure of the use of agricultural production space [31,
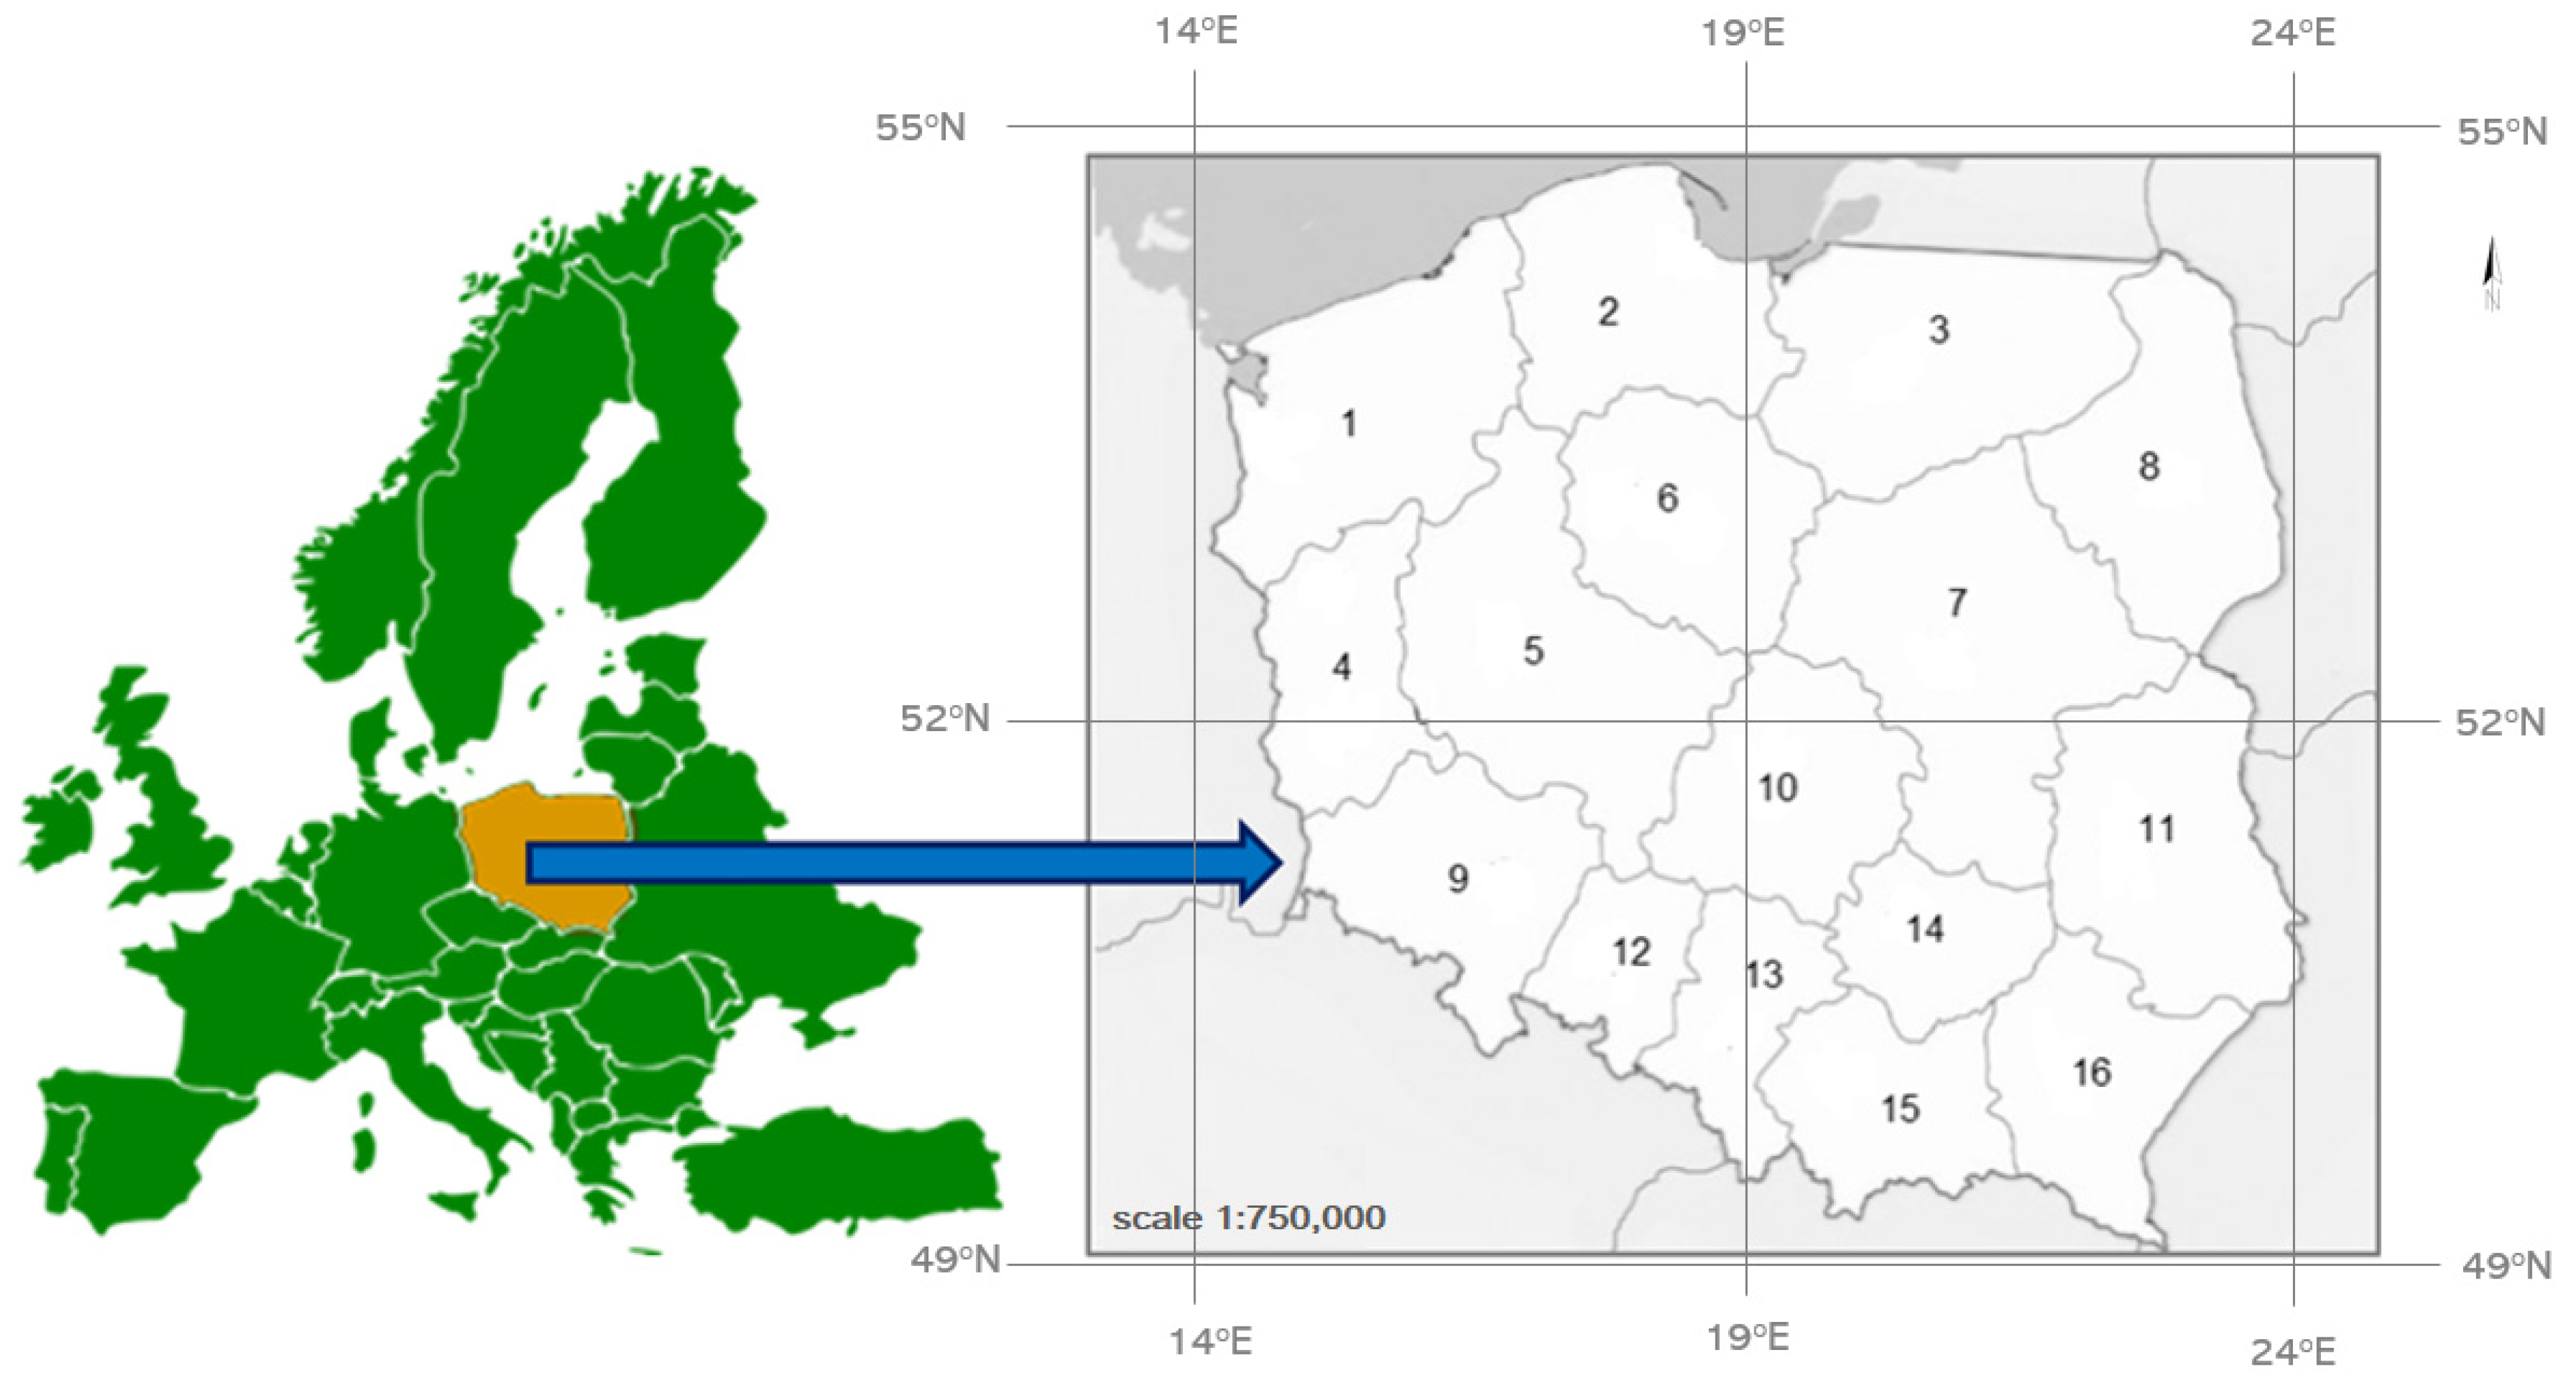
32]. On the other hand, the least spatial differentiation (CV = 7.3%) was obtained for the share of cereal crops in the sowing structure (F.5). It is worth emphasizing that the mean value of the factor was very high in all voivodships, with an average of 69.6%, and a maximum amounted to 76.7% in Śląskie voivodship (unit 13) (Table S1, Supplementary Materials). Kapusta [33] explains that cereals are an important component of Poland’s agriculture and economy since they play an important role in shaping food security in the country. They are cultivated by 89.5% of farms, and their share in the crop structure has always been high, oscillating on the level of almost ¾ of the crop area.
Similar to the agricultural productivity factors, all of the indicators we selected for the analysis show great diversification between individual territory units of the country, which confirm the range of the values presented in Table 4. From the group of indicators evaluating the level of production ecosystem services, livestock density per 100 ha of agricultural land (P.2) shows the greatest differentiation within all the voivodeships. Changes in the concentration of animal production were analyzed by Rokicki et al. [34]. The authors found out, that in Poland in the years 2005–2019, changes of this indicator were strongly associated to Poland’s entrance into the market of European Union. From that moment, milk, meat, and egg producers were subjected to many new regulations. The new regulations resulted in an increase in the specialization of farms, because of which the stock of animals increased significantly in certain voivodeships. These changes caused a strong diversification of the level of animal production between voivodeships. The most agriculturally developed Mazowieckie and Wielkopolskie voivodeships became the units with the highest concentration of animal production (units 7 and 5 in Figure 1). On the other hand, the Podlaskie voivodship (unit 8) was strongly specialized in milk production. The concentration of other types of animal production such as live cattle and eggs was similar as for the population.
In the category of environmental services, the greatest variability was found in the gross nitrogen balance per 1 ha of agricultural land (indicator E.4) and in air quality assessment indicators (indicators E.6 and E.7). Research carried out in 2017 [35] pointed out that the diversity of nitrogen management in Polish agriculture was so large that the level of nitrogen consumption in mineral fertilizers between voivodeships often differed by nearly three times. To a large extent, this is a consequence of the diversified area structure and the organizational and economic level of farms in Poland. The processes of polarization taking place in Polish agriculture, e.g., agrarian structures, the intensity of agricultural production, visible also in the height of regional balances of nitrogen balances, indicate the deepening of the existing diversification [35]. Regarding air pollution, the main source of it is considered to be low emissions caused by combustion processes in households. This is due to the low quality of fuels, most often waste (brown coal, fine coal), and outdated heating systems used to heat buildings [36]. Additionally, it is facilitated by the process of incineration of municipal waste. Research by Tomal [37] showed that the type of area may affect the concentration of PM10 pollutants in the air. The greatest pollution occurs in cities, while it is much lower in the non-urban area. The suburbs were characterized by moderate levels of PM10 pollutants in the air.
When considering the group of cultural KPIs, the most diverse indicator was C.3, which concerned the area of nature reserves per 1000 inhabitants of the voivodship. In Poland, 60.1% of the country’s area is not covered by nature protection. The average distance in these areas to the nearest protected area is 3.3 km. These data indicate a high density of the network of protected areas, as well as their relatively large fragmentation. Previous research showed that the maximum distance from any type of protected area in Poland was less than 20.1 km [38]. This value occurred in Lubelskie voivodeship (unit 4). The lowest maximum distance of 8.6 km was noted in the Warmińsko-mazurskie (unit 3), while at the same time, the average distance for this voivodship was only 1.6 km. The spatial differentiation of KPI indicators in individual territorial units in Poland is presented in Table S2 in Supplementary Materials.

3.2. Assessment of the Impact of the Agricultural Production Factors on Indicators of ESs

The linear regression analysis revealed that some of the agricultural productivity factors had a significant impact on shaping selected indicators assessing the level of ESs (
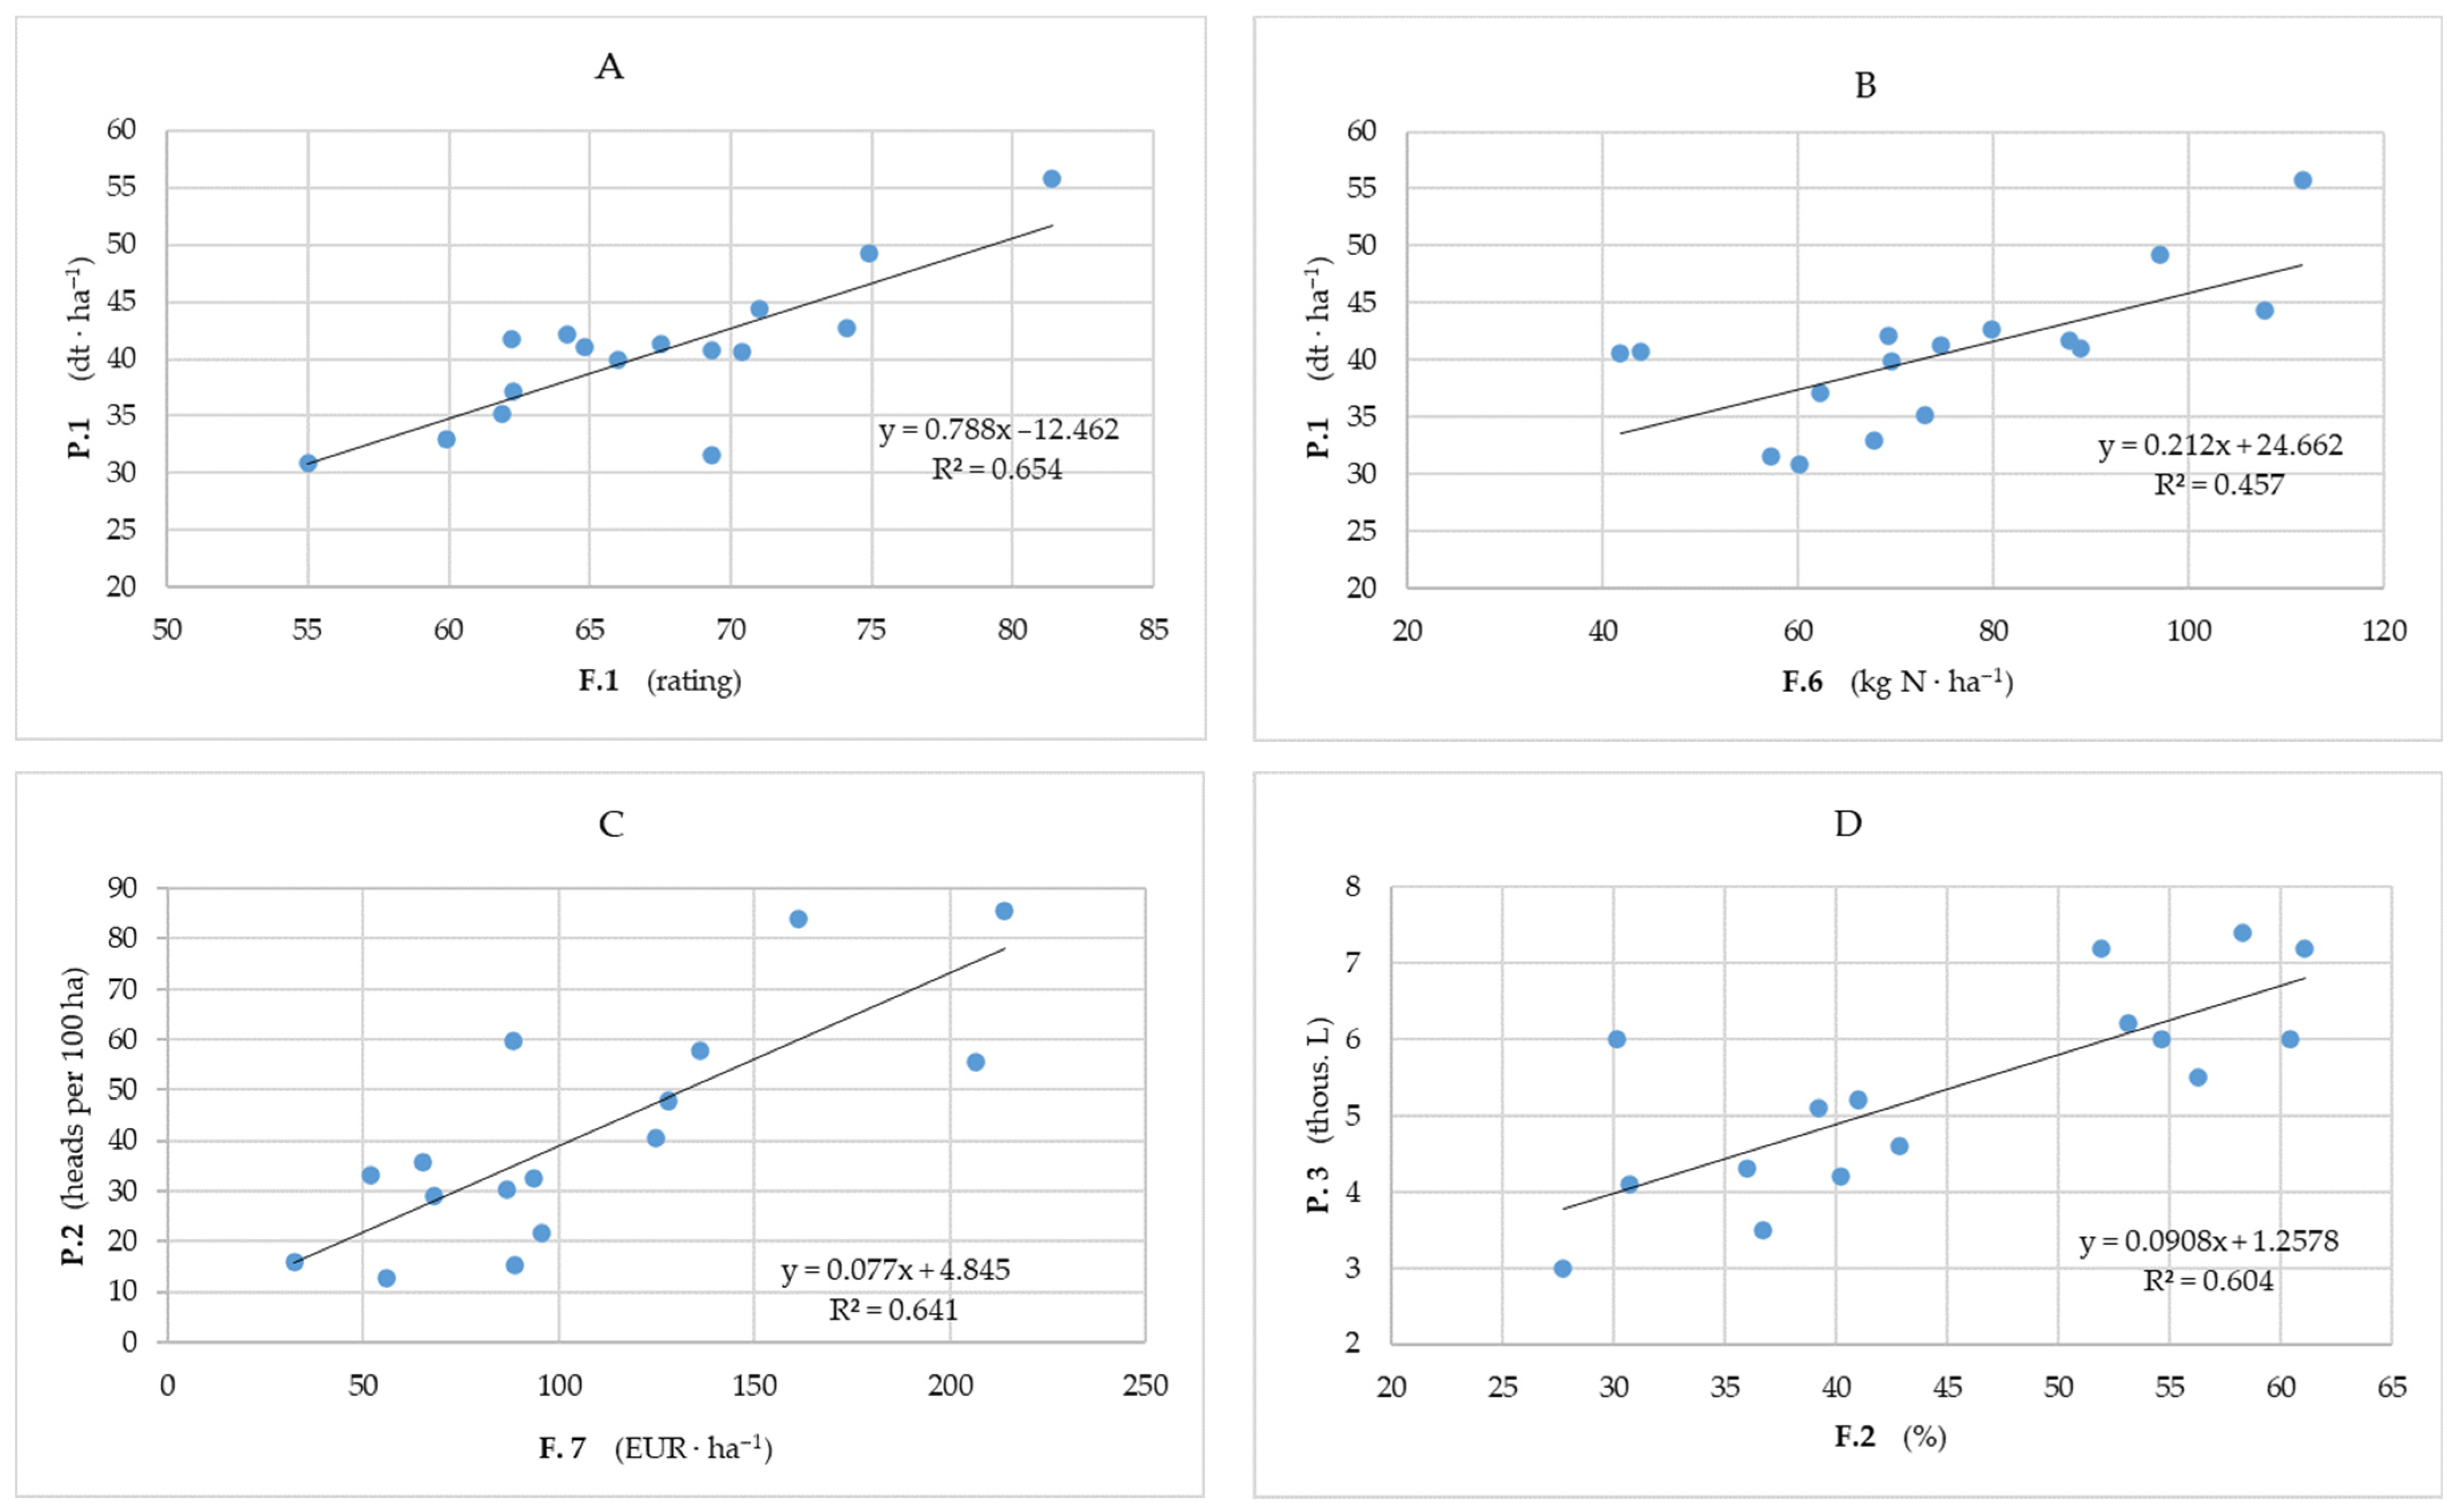
Table 5). Significant interdependences were found in 12 out of 32 analyzed production services, with 7 at the level of p = 0.01. The strongest relationship (r = 0.81) occurred between the yield of cereal grains (P.1), which quantitatively expresses the potential of current crop production, and the agricultural production space suitability (F.1). The F.1 factor covers the quality of individual elements of the habitat, such as soil quality and suitability, soil water conditions, relief, and agro-climate. In addition, Harasim [26] in his research confirmed a significant dependence (p = 0.05) of the yield of cereal grains and the entire plant production on the index of agricultural production space suitability. Our outcomes are supported by several research results [39,40,41], which proved that crop yields were the most reliable estimates for agricultural land evaluation and suitability for crop production. On the other hand, the results of studies conducted in Canada indicated that cereal crops, such as barley, oats, and mixed grains, were more tolerant to soil–climate–landscape variations and could be grown in many regions of the country, while non-grain crops were more sensitive to environmental factors [42].
The increase in the yield of cereal grains is also significantly influenced by the rise of the level of nitrogen fertilization (r = 0.68) as well as the reduced share of permanent grassland in the agricultural area (r = −0.53). According to Podolska [43], nitrogen fertilization was one of the most important factors affecting both the yield and the parameters of the technological value of winter wheat grain. Higher doses of nitrogen fertilization had a positive effect on all elements of the yield structure, increasing the number of ears, ear fertility, and grain abundance. It was also confirmed by the results of numerous studies, which indicate that long-term N fertilization can contribute to relieving the global food crisis by not only enhancing cereal yield, but also promoting its stability [44,45]. Mohammed et al. [46] also observed the beneficial effect of an increase in fertilizer N rates in wheat grain yield and protein content. However, the authors noted that there were large differences in yields at different locations with the same N application rate. Similar observations were reported by Walsh et al. [47]. When analyzing the impact of the agricultural productivity factors (F) on the production indicators (P), it was found that the investment subsidies under the Rural Development Program (F.7), as well as the percentage share of agricultural land in the total area (F.2), significantly influence the level of stocking density (P.2 r = 0.80 and r = 0.66, respectively), milk yield (P.3 r = 0.64 and r = 0.78, respectively), and the value of commodity production (P.4 r = 0.58 and r = 0.56, respectively). Couillard and Turkina [48] examined the effects of Free Trade Agreements (FTAs) and subsidies under the Common Agricultural Policy of the European Union on dairy industry competitiveness. The authors found that the effects of FTAs on dairy industry competitiveness depended on the agreement type and that subsidies improved competitiveness. Zalewski et al. [49] evaluated the efficiency of the use of public financial support investment activities in selected dairy farms in Poland. The authors surveyed over two-hundred milk production farms that were beneficent of European Union (EU) in the years 2011–2014. The results of the study showed that the external fundings enabled the farmers the investments, which improved their economic situation.
Kondratowicz-Pozorska [50] obtained contrary results. It was indicated that there were difficulties in finding significant relationships between the number of subsidies for agriculture and rural development and the amount and value of production due to the multi-purpose nature of the aid provided to farmers. This aid is not mainly targeted to obtain high levels of production, but first and foremost it is aimed to maintain and protect the quality and benefits of rural areas. Selected dependences between agricultural productivity factors in Poland and KPIs of production/provisioning ecosystem services are presented in Figure 2 along with linear regression equations.
Regarding indicators evaluating environmental ecosystem services, a significant interaction between some of them and agricultural production factors was found (Table 6). Significant dependencies were found in 16 out of 56 analyzed combinations (with 12 at 
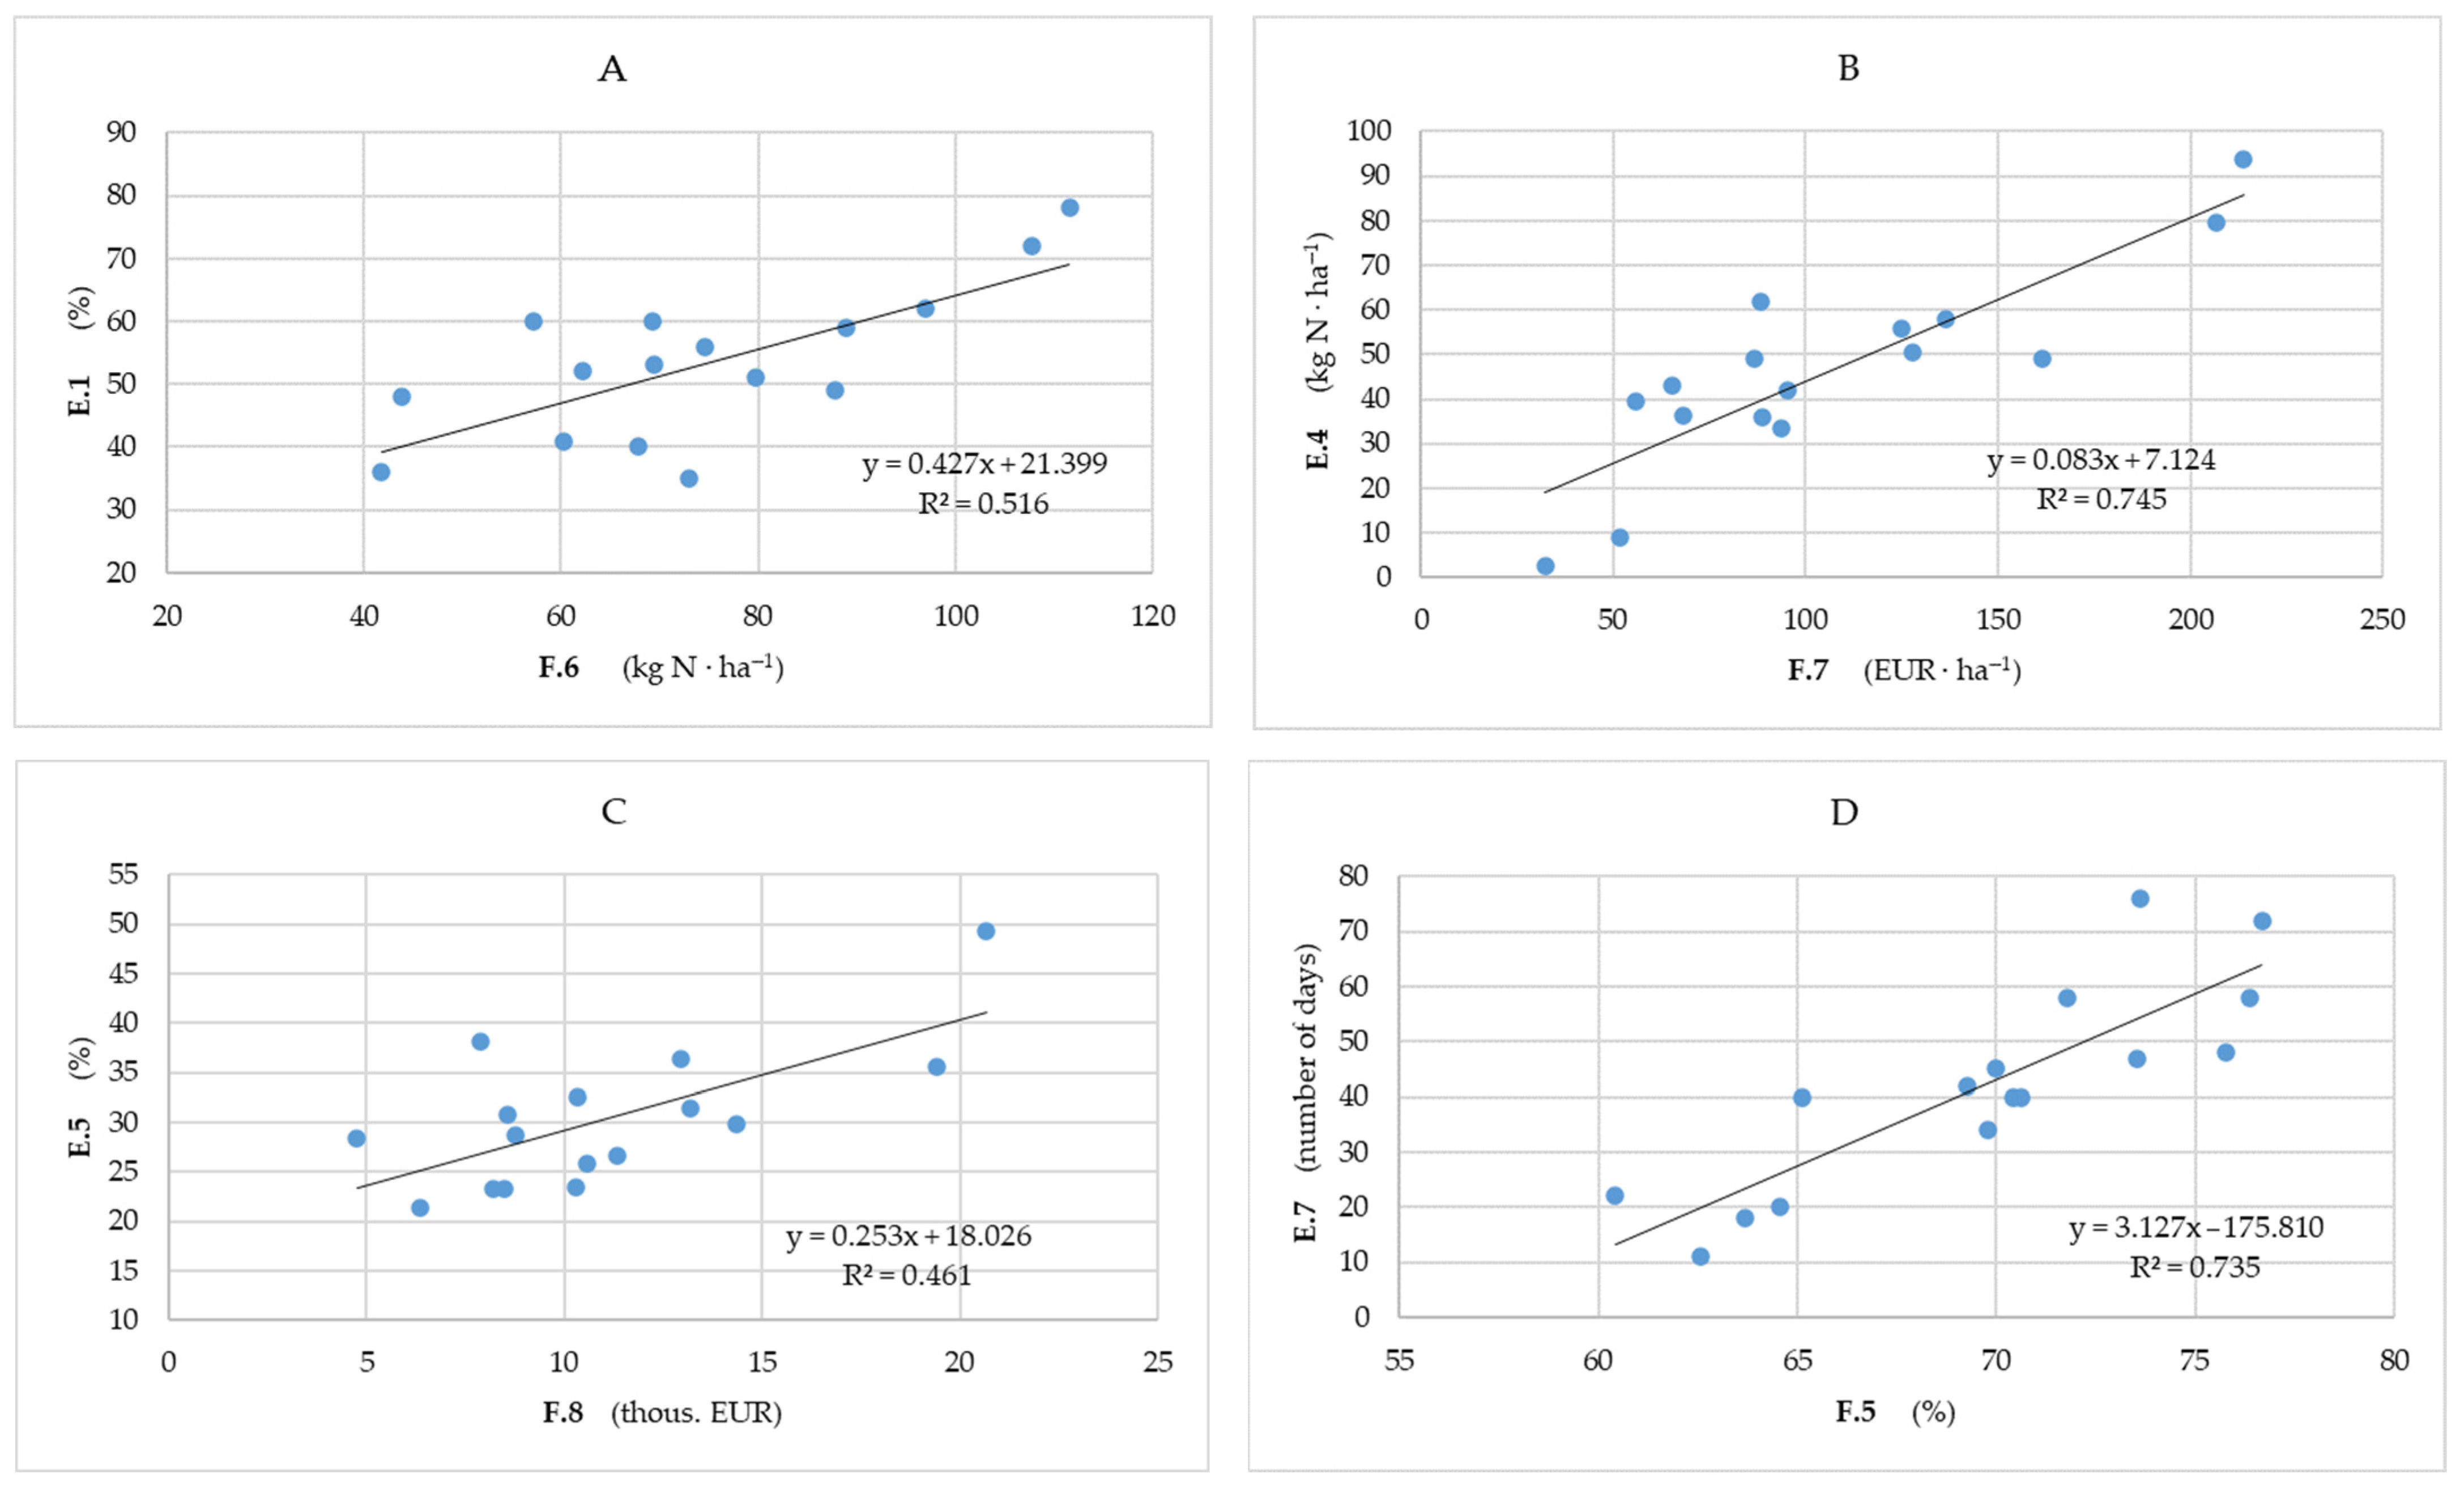
p = 0.01). Soil quality (E.1), expressed as the share of soils with pH > 5.5, depended significantly on the index of agricultural production space suitability (F.1 r = 0.64) and the level of nitrogen fertilization (F.6 r = 0.72). It was proved that in territory units, where the level of nitrogen fertilization per 1 ha of agricultural land is greater, the share of soils with favorable pH > 5.5 is also greater (Figure 3A). According to the study by Ochal et al. [51], soil acidification remained a major barrier to plant production and posed a threat to the environment. Nitrogen fertilizers contributed to the increase in acidification, however, in the territory units where the level of nitrogen use is greater than in the others, more calcium fertilizers are also used [52,53,54,55,56]. Dashuan Tian [57] found that depending on ecosystem types, N fertilizer rate and form, and testing durations the soil pH varied. It decreased mostly in grassland. Higher risk of soil acidification was shown in the case of use of urea and NH4NO3 compared to the NH4 form.
The gross nitrogen balance (E.4), which is an important agri-environmental indicator, correlated positively and at a significant level with three agricultural productivity factors: mainly with the level of investment subsidies (F.7 r = 0.86), the share of agricultural land in the total area (F.2 r = 0.67), and the level of nitrogen fertilization (F.6 r = 0.66) (Figure 3B). According to Kopiński [58], the greatest balances of nitrogen are found in countries, or in Polish regions, in which the agricultural production is very intensive. Research on the effect of agri-environment schemes (2007–2014) on groundwater quality in Bavaria, Germany [59], showed that agri-environment schemes (AESs), as a part of the CAP, can be effective in reducing nitrate levels in grassland. However, organic farming and the cultural landscape showed no significant effect on groundwater quality. It is noteworthy that cereal crops and forage showed a positive effect on groundwater quality. High levels of nitrates in the groundwater were concentrated in cropland areas rather than grasslands.
Another significant positive correlation was found between the level of environmental subsidies (F.8) and the increase in forestation (E.5 r = 0.68) (Figure 3C). The results of research carried out in five countries of the European Union showed that thanks to the flexibility that the CAP gives countries to adapt their subsidy programs to specific national needs, the European Agricultural Fund for Rural Development and equivalent national subsidies have indeed been used in a wide range of activities [60]. Due to the diverse needs of forestry and the functions performed by forest areas, subsidized investments were also varied. Their goals were oriented, e.g., on improving machinery resources, but also on increasing the ecological value of forests. As the authors pointed out, the countries’ current subsidy systems focused on different forest policy goals. Comparison of results from the countries surveyed was hampered by inconsistencies and many inaccuracies in the documentation of the distribution of funds. This shows that to increase the effectiveness of subsidy schemes and achieve the objectives of European forest area policy, it is crucial to understand and unify the current distribution of subsidies.
Air quality expressed by two indicators (E.6 and E.7) depended on two agricultural productivity factors: the share of cereals in the sowing structure (F.5 r = 0.86 and r = 0.81, respectively) and the share of ecological land in the area of agricultural land (F.4 r = −0.60 and r = −0.66, respectively). Inferior air quality concerned territory units characterized by an increased share of cereals in the sowing structure (F.5) (Figure 3D) and a smaller share of ecological lands (F.4). These are probably indirect relationships since, according to the analysis of Parlińska and Pomiechowski [61], the main source of air pollution with the PM10 dust is considered to be low emissions, which are caused by combustion processes in households. The population density in rural areas, and thus also the number of small farms, is the highest in the southern part of Poland in the territory units 13, 15, and 16 (Śląskie, Małopolskie, and Podkarpackie voivodeships), where the share of cereals in the sowing structure is the largest. On the other hand, in voivodships where the population density in rural areas is the lowest, such as in voivodeships 1, 3, and 8 (West Pomeranian, Warmińsko-mazurskie, and Podlaskie), the share of cereals in the sowing structure is also the lowest. Łowicki [62] stated that landscape indicators can be useful for generating new sources of information to explain the presence of PM in the atmospheric air. The author emphasized that any changes in the landscape should consider green areas that function as a pollution filter. Planning of all investments should be closely related to the design of such areas. As a result, by providing an entire range of ecosystem services (regulatory and cultural), it is possible to ensure better air quality and increase the quality of life of the inhabitants. Lin and Chen [63] analyzed the effect of landscape patterns on the concentration of particulate matter in the atmosphere in Fujian Province, China. The authors confirmed that forest areas had a substantial impact on PM10 concentrations in spring and summer. However, in the autumn–winter period, air quality depended significantly on built-up areas. Huang [64] proved that the presence of pollutants in the atmospheric air, e.g., PM2.5 and PM10, significantly depends on the share of impermeable surfaces and arable land and this relationship is positive. However, in the case of the share of wetland, water reservoirs, and forests, this correlation is negative. The author stated that these relations do not depend on the seasons. The strength of the correlation between the forms of land cover and the state of the air may vary slightly during the entire year.
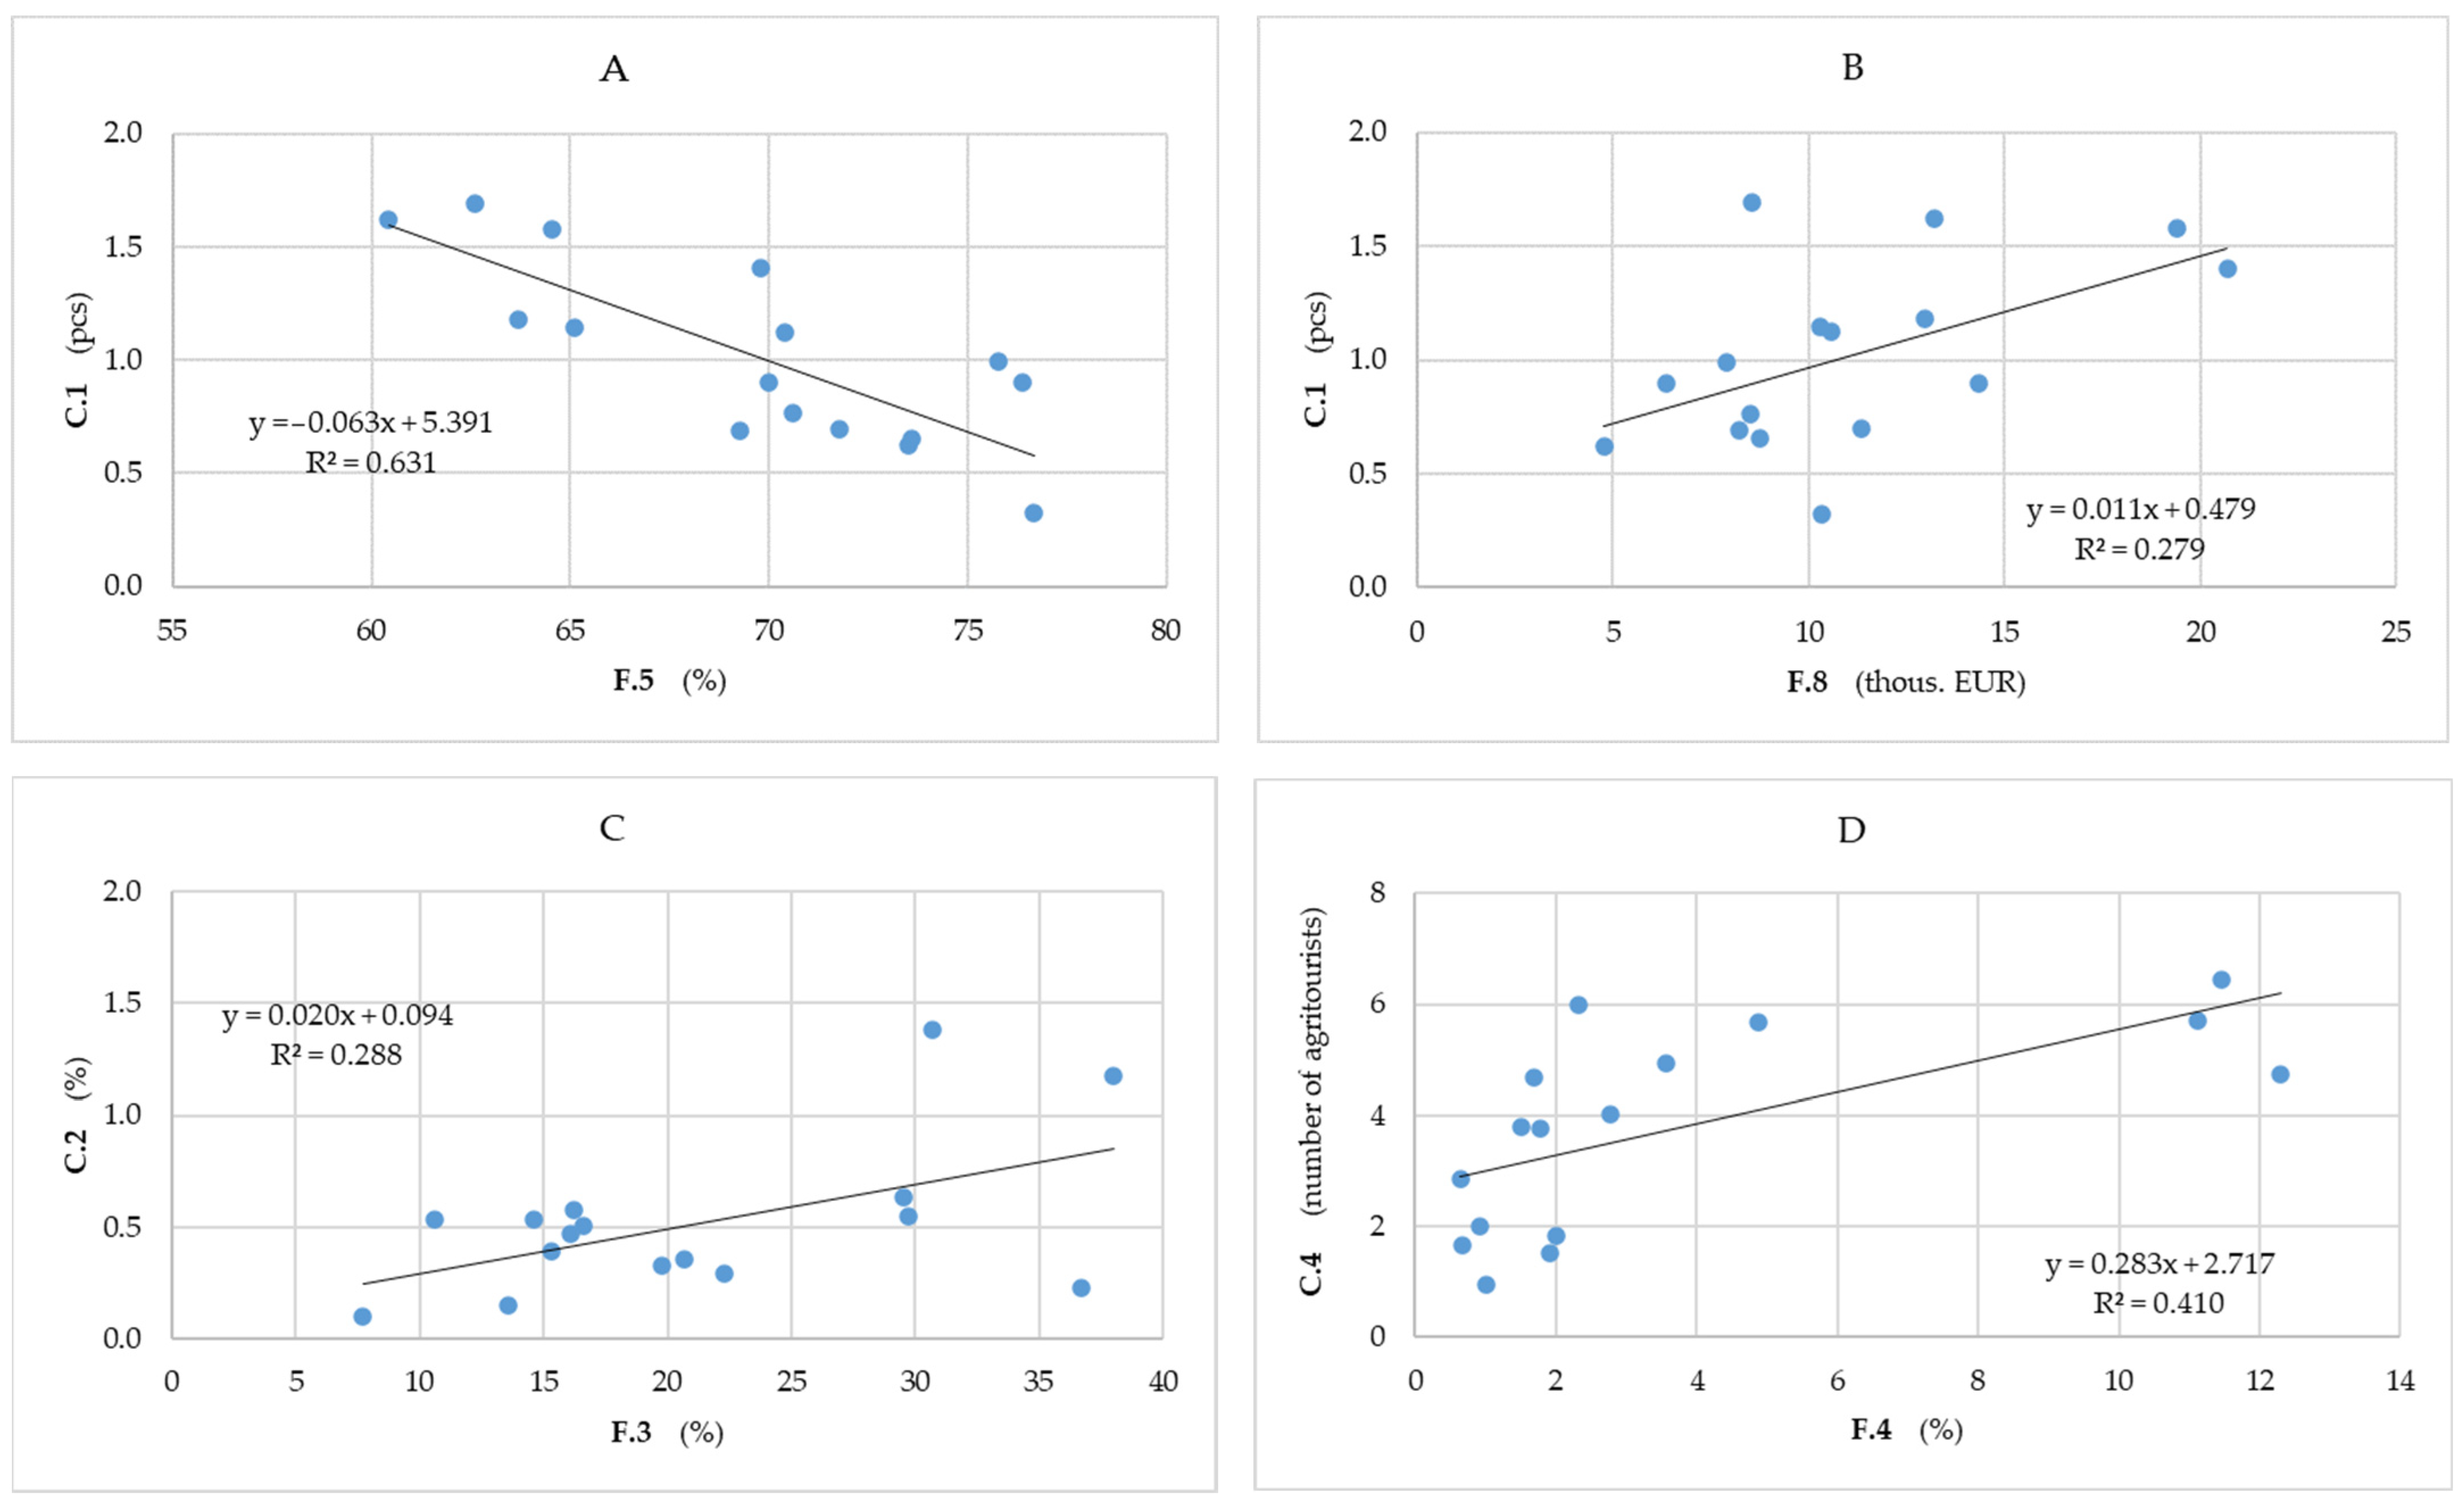
Cultural ecoservices CESs enable direct, intellectual, and identity interactions with an animate nature, including nature constituting an element of natural heritage. An even more utilitarian type of cultural ecosystem service is the opportunity for recreation, including tourism, aesthetics, and providing inspirational, educational, spiritual, and religious provisions. Specific benefits include the chance of taking landscape trips, visiting places of worship, etc.
The impact of agricultural productivity factors on the level of these services was limited. Only 11 out of 40 analyzed correlations were found to be significant (with 5 of them at p = 0.01) (Table 7). A positive association was found between the share of ecological land (F.4) and all CESs except C2 (the correlation coefficients for C.1, C.3, C.4, and C.5 surpassed r = 0.57), as well as for permanent grassland in the area of agricultural land (F.3) and C.2 and C.3 services (r = 0.54 and 0.51, respectively). The share of cereals in the sowing structure (F.5.) had a negative impact on the analyzed indicators C.1, C.2, C.3, and C.5, except C4 (the correlation coefficients surpassed r = −0.57). Moreover, a positive correlation between the level of environmental subsidies (F.8) and the number of nature monuments (C.1 r = 0.53) was found. Selected relationships between agricultural productivity factors in Poland and indicators of cultural ecosystem services, along with linear regression equations, are shown in Figure 4. The lack of a larger number of unambiguous correlations is primarily explained by the difficult valuation of the potential of ecosystems to provide cultural services. Direct indicators, which are sometimes difficult to calculate, or assess subjectively by an expert, are most often used for this purpose.
Rasmusen et al. [65] found that intensive agricultural production is rarely compatible with the production of positive cultural ecosystem services and well-being. Auer et al. [66] confirmed that agriculture in Balcarce County has significantly modified the rural landscape over the past two decades. As a result of those changes, the supply of cultural ecosystem services was limited, and this affected intangible assets and social activities, causing the risk of their discontinuity in the future. The negative impact of agricultural activity on cultural ecosystem services is manifested, among others, by the risk of losing the cultural identity characteristic for certain habitats (such as cultural and spiritual practices, as well as recreational, tourist, educational, ecological, and technological potential [67]). Wang et al. [68] argued that human controlled rewilding can be an important alternative to afforestation of degraded agricultural land. The main beneficiaries of cultural ecosystems are residents and the tourism industry, although landscape managers can indirectly benefit from the interaction between cultural and other activities. An example of such cooperation is Tuscany, where tourism has significantly increased the demand for regional agricultural products [69]. Moreover, an increase in agri-tourism forces the improvement of infrastructure, which is beneficial for the local community. The development of suburban areas is a good example of positive changes in agricultural landscapes and benefits for the economy of the entire region. Additionally, Flood et al. [70] showed that areas such as peatlands are important for building social bonds. The authors emphasized historical, educational, and health aspects of such areas, which is crucial for creating social and ecological potential.
From the point of view of decision-makers, the evaluation of the impact of the Rural Development Policy (RDP) tools on the development of ecosystems is an important instrument for planning diverse activities related to agriculture and environmental protection. It can help to identify the most satisfactory agricultural practices, as well as select synergistic actions that will help achieve an effective and sustainable response to climate change. Successful management of the multifunctionality of agriculture is also key to protecting biodiversity and ensuring access to various ecosystem services. Evaluating the impact of RDP tools can help determine what farming practices are most beneficial for distinct types of ecosystems and what actions can help protect the environment and deliver ecosystem services, which has been already confirmed in other studies [71,72,73,74,75].
The future perspective of our research is the development of a module within the AGRICORE tool for modeling agricultural structures surrounding farmers (markets and land) and their context (environmental and climate impacts, socio-economic impacts (rural integration), ecosystem services delivery, and political environment) in Poland. The module of ES elaborated based on the available data will allow for the development of a module for the ABM model that employs the desired environmental parameters to provide different assessments of the impact of selected agricultural productivity factors and ecosystem services on the economic farm status. Data from ABM on agricultural production in a given area will allow for the modeling of predicted changes in the state of the environment. One of the goals for the future is to find ES assessment methods that would integrate economic and social goals with environmental goals. On the other hand, finding the most satisfactory solutions for individual stakeholders and their different interests in the development of ES can be a challenge both in the spatial context and in terms of environmental conditions and economic interests, because they can often conflict with various stakeholders due to their different needs and preferences. Consequently, the future goals are not only to expand the research by taking into account the scale and complexity of the studies, but also to engage economists and sociologists to find the answer how certain ES preferences influence the processes of making decisions at different levels, the individual and the public, and how to translate the knowledge of ESs on market economy to indicate the current versus future costs and benefits of ESs in unified units.

4. Conclusions

Climate change and the rising pressure on agriculture, which are related to the need to provide food for a growing population on the one hand and the limited possibility of increasing the area of land used for agriculture on the other, mean that environmental problems are intensifying. Some attempts are made to limit the negative impact of agricultural production on the ecosystem, but at the same time, trials are made to ensure an increase in the scale of ecosystem services generated by agriculture through legal regulations and agricultural policy instruments. This sector of the economy has a key impact on the functioning of numerous ecosystems. With the simultaneous responsibility for providing food, there is a need to manage natural resources in such a way that they guarantee both the sustainable development of agriculture and the surrounding nature.
To capture the impacts of governance on three categories of ecosystem services via agricultural productivity factors, we proposed a comprehensive approach to specify possible agricultural impact tracks. These tracks show how different governance decisions might influence site and farm conditions, which in turn influence agricultural production practices and thus ES provision. Our approach is the first at the scale of the entire highly diversified agricultural and natural territory of Poland divided into sixteen units. To capture the impacts of governance on three categories of ecosystem services via agricultural productivity factors, we proposed an approach to specify possible agricultural impact tracks. These tracks show how different governance decisions might influence site and farm conditions, which in turn influence agricultural production practices and thus ES provision. Based on the obtained results, we can conclude that the level of provisioning ecosystem services related to plant production depended significantly on the agricultural production space suitability and the level of nitrogen fertilization, while animal and commercial production depended on the value of investment subsidies under the Rural Development Programme. The impact of agricultural production factors on the level of environmental ecosystem services has not been unambiguously proved in our analysis. However, there was a clear tendency of the decrease in the level of these services with the increase in the intensity of agricultural production. The increased share of agricultural land in the total area and higher investment subsidies correlated negatively with soil humus and positive gross nitrogen balance. Agricultural production factors influenced the level of cultural ecosystem services to a limited extent. A positive effect of the increased share of ecological land on the studied indices and a negative correlation of these indices with the share of cereals in the sowing structure was noted. A significant, positive correlation was found between the level of environmental subsidies in M.10. and forestation and the number of natural monuments. The results presented in this paper propose the solutions for shaping agriculture to be competitive at regional as well as international scales through the provision of multiple ecosystem services. The used approach provides a simple model to account for a range of associations that relate agricultural management to land cover, agricultural production, air pollution, and nature heritage, and contribute to the sustainability of the environment. The application of such an integrative perspective of the inter-relations within the factors and ES indicators encourages better-informed agricultural and environmental policy.

Supplementary Materials

The following supporting information can be downloaded at: https://www.mdpi.com/article/10.3390/resources12090099/s1: Table S1. Spatial differentiation of the agrotechnical and financial factors (F) of agricultural productivity in Poland. Table S2. Spatial differentiation of the KPIs of production (P), environmental (E), and cultural (C) ecosystem services.

Author Contributions

Conceptualization, W.B., W.Ż., J.Ż. and R.K.-T.; methodology, W.B., W.Ż., J.Ż., R.K.-T. and J.K.; formal analysis, J.Ż., J.K., P.B. and K.L.; investigation, W.B., W.Ż., J.Ż. and R.K.-T.; resources, W.B., W.Ż., J.Ż., R.K.-T., P.B., J.K., K.L., C.S. (Cezary Sławiński), K.M., C.S. (Christos Staboulis), D.N., A.A.K., A.B., Á.O.R. and O.P.R.; writing—original draft preparation, W.B., W.Ż., J.Ż. and R.K.-T.; writing—review and editing, P.B., J.K., K.L., C.S. (Cezary Sławiński), K.M., C.S. (Christos Staboulis), D.N., A.A.K., A.B., Á.O.R. and O.P.R. All authors have read and agreed to the published version of the manuscript.

Funding

This research was funded by the Horizon 2020 AGRICORE project, grant number 816078.

Data Availability Statement

The primary data presented in this study are available from open-access databases listed in the Materials and Methods section or on request from the corresponding author.

Conflicts of Interest

The authors declare no conflict of interest. The funders had no role in the design of the study; in the collection, analyses, or interpretation of data; in the writing of the manuscript; or in the decision to publish the results.

References

  1. Reid, W.; Mooney, H.; Cropper, A.; Capistrano, D.; Carpenter, S.; Chopra, K. Ecosystems and Human Well-Being: Synthesis; A Report of the Millennium Ecosystem Assessment; Island Press: Washington, DC, USA, 2005; 212p. [Google Scholar]
  2. Gómez-Baggethun, E.; de Groot, R.; Lomas, P.L.; Montes, C. The history of ecosystem services in economic theory and practice: From early notions to markets and payment schemes. Ecol. Econ. 2010, 69, 1209–1218. [Google Scholar] [CrossRef]
  3. Bullock, J.M.; Ding, H. A Guide to Selecting Ecosystem Service Models for Decision-Making: Lessons from Sub-Saharan Africa; World Resources Institute: Washington, DC, USA, 2018; 48p. [Google Scholar]
  4. Martínez-López, J.; Bagstad, K.J.; Balbi, S.; Magrach, A.; Voigt, B.; Athanasiadis, I.; Pascual, M.; Willcock, S.; Villa, F. Towards globally customizable ecosystem service models. Sci. Total Environ. 2019, 650, 2325–2336. [Google Scholar] [CrossRef]
  5. Ferrier, S.; Ninan, K.N.; Leadley, P.; Alkemade, R.; Acosta, L.A.; Akçakaya, H.R.; Brotons, L.; Cheung, W.; Christensen, V.; Harhash, K.A.; et al. (Eds.) IPBES: Summary for Policymakers of the Methodological Assessment of Scenarios and Models of Biodiversity and Ecosystem Services of the Intergovernmental Science-Policy Platform on Biodiversity and Ecosystem Services; Wintle: Bonn, Germany, 2016; 32p, Available online: https://www.ipbes.net/sites/default/files/downloads/pdf/SPM_Deliverable_3c.pdf (accessed on 4 August 2023).
  6. Sharps, K.; Masante, D.; Thomas, A.; Jackson, B.; Redhead, J.; May, L.; Prosser, H.; Cosby, B.; Emmett, B.; Jones, L. Comparing strengths and weaknesses of three ecosystem services modelling tools in a diverse UK river catchment. Sci. Total Environ. 2017, 584–585, 118–130. [Google Scholar] [CrossRef]
  7. Ruymbeke, K.V.; Ferreira, J.; Gkisakis, V.; Kantelhardt, J.; Tasevska, G.M.; Matthews, P.; Niedermeyer, A.; Schaller, L.; Zawalinska, K.; Mertens, K.; et al. Assessing Environmental Performance of Agricultural Practices in Europe Using Ecosystem Services: An Environmental Performance Indicator Approach. In Proceedings of the Conference of International Association of Agricultural Economists, Virtual, 17–31 August 2021; Available online: https://ideas.repec.org/p/ags/iaae21/315242.html (accessed on 16 August 2022).
  8. Manley, K.; Nyelele, C.; Egoh, B.N. A review of machine learning and big data applications in addressing ecosystem service research gaps. Ecosyst. Serv. 2022, 57, 101478. [Google Scholar] [CrossRef]
  9. Lai, T.-Y.; Salminen, J.; Jäppinen, J.-P.; Koljonen, S.; Mononen, L.; Nieminen, E.; Vihervaara, P.; Oinonen, S. Bridging the gap between ecosystem service indicators and ecosystem accounting in Finland. Ecol. Modell. 2018, 377, 51–65. [Google Scholar] [CrossRef]
  10. Haines-Young, R. Report of Results of a Survey to Assess the Use of CICES, 2016. Support to EEA Tasks under the EU MAES Process. Negotiated Procedure No EEA. NSS/16/002. Available online: https://cices.eu/content/uploads/sites/8/2016/07/Report-on-Survey-Results_19072016_Upload.pdf (accessed on 8 August 2022).
  11. Haines-Young, R.; Potschin, M.; Kienast, F. Indicators of ecosystem service potential at European scales: Mapping marginal changes and trade-offs. Ecol. Indic. 2012, 21, 39–53. [Google Scholar] [CrossRef]
  12. Andersson, E.; Nykvist, B.; Malinga, R.; Jaramillo, F.; Lindborg, R. A social–ecological analysis of ecosystem services in two different farming systems. AMBIO 2015, 44, 102–112. [Google Scholar] [CrossRef] [PubMed]
  13. Krzyszczak, J.; Baranowski, P.; Lamorski, K.; Sławiński, C.; Siedliska, A.; Bojar, W.; Żarski, W.; Żarski, J.; Kuśmierek-Tomaszewska, R.; Koç, A.A.; et al. Impact assessment of agri-environment-climate measure (M.10) of RDP 2014-2020 on Polish farmers’ perception of environmental and climatic policies implementation. Intern. Agroph. 2023; in press. [Google Scholar] [CrossRef]
  14. Staboulis, C.; Natos, D.; Gkatsikos, A.; Tsakiridou, E.; Mattas, K.; Bojar, W.; Baranowski, P.; Krzyszczak, J.; Rivero, O.P.; Roldán, Á.O. Assessing the Role of the Young Farmer Scheme in the Export Orientation of Greek Agriculture. Sustainability 2022, 14, 3287. [Google Scholar] [CrossRef]
  15. Benra, F.; De Frutos, A.; Gaglio, M.; Álvarez-Garretón, C.; Felipe-Lucia, M.; Bonn, A. Mapping water ecosystem services: Evaluating InVEST model predictions in data scarce regions. Environ. Modell. Softw. 2021, 138, 104982. [Google Scholar] [CrossRef]
  16. Boyd, J.; Ringold, P.; Krupnick, A.; Johnson, R.; Weber, M.; Hall, K.M. Ecosystem services indicators: Improving the linkage between biophysical and economic analyses. Res. Future Discuss. Pap. 2015, 15–40, 1–89. [Google Scholar] [CrossRef]
  17. Haefele, M.; Loomis, J.B.; Bilmes, L. Total Economic Valuation of the National Park Service Lands and Programs: Results of a Survey of the American Public. HKS Work. Pap. 2016, 16-024, 1–48. [Google Scholar] [CrossRef]
  18. Johnston, R.J.; Rolfe, J.; Rosenberger, R.S.; Brouwer, R. Benefit transfer of environmental and resource values. Resour. Econ. (Dordr.) 2018, 69, 467–481. [Google Scholar] [CrossRef]
  19. Olander, L.P.; Johnston, R.J.; Tallis, H.; Kagan, J.; Maguire, L.A.; Polasky, S.; Urban, D.; Boyd, J.; Wainger, L.; Palmer, M. Benefit relevant indicators: Ecosystem services measures that link ecological and social outcomes. Ecol. Indic. 2018, 85, 1262–1272. [Google Scholar] [CrossRef]
  20. Bojar, W.; Żarski, W. Evolution of agriculture towards more effective natural resources management with regard to green Economy. In Proceedings of the 38th International Business Information Management Association Conference (IBIMA): Innovation Management and Sustainable Economic Development in the Era of Global Pandemic, Seville, Spain, 23–24 November 2021; pp. 7327–7333. [Google Scholar]
  21. Statistical Yearbooks of Agriculture 2021. Available online: https://stat.gov.pl/obszary-tematyczne/roczniki-statystyczne/roczniki-statystyczne/rocznik-statystyczny-rolnictwa-2021,6,15.html (accessed on 10 January 2023).
  22. Statistical Yearbooks of Agriculture 2020. Available online: https://stat.gov.pl/obszary-tematyczne/roczniki-statystyczne/roczniki-statystyczne/rocznik-statystyczny-rolnictwa-2020,6,14.html (accessed on 10 January 2023).
  23. Statistical Yearbooks of Environmental Protection 2021. Available online: https://stat.gov.pl/obszary-tematyczne/srodowisko-energia/srodowisko/ochrona-srodowiska-2021,1,22.html (accessed on 10 January 2023).
  24. Statistical Yearbooks of Environmental Protection 2020. Available online: https://stat.gov.pl/obszary-tematyczne/srodowisko-energia/srodowisko/ochrona-srodowiska-2020,1,21.html (accessed on 10 January 2023).
  25. Zegar, J.S.; Toczyński, T.; Wrzaszcz, W. Sustainability of Polish Agriculture. General Agricultural Census 2010; Polish Statistics GUS Press: Warszawa, Poland, 2010; 219p. Available online: https://stat.gov.pl/download/cps/rde/xbcr/gus/PSR_Zrownowazenie_internet.pdf (accessed on 23 April 2023). (In Polish)
  26. Harasim, A. Agroecological potential of agriculture as an element of regions’competitiveness. Econ. Reg. Stud. Stud. 2013, 6, 90–96. Available online: https://ageconsearch.umn.edu/record/264964/ (accessed on 11 April 2023).
  27. Jończyk, K.; Jadczyszyn, J.; Filipiak, K.; Stuczyński, T. Spatial diversity of organic material content in soils in Poland in the context of soil protection and agricultural use [Przestrzenne zróżnicowanie zawartości materii organicznej w glebach Polski w kontekście ochrony gleb i ich rolniczego wykorzystania]. Stud. Rap. IUNG-PIB 2008, 12, 145–154. (In Polish) [Google Scholar]
  28. Pietrzykowski, R.; Wicki, L. Regional Differentiation in Uptaking the CAP Funds on Agri-environmental Programmes in Poland. Econ. Sci. Rural Develop. 2011, 26, 149–162. Available online: http://lwicki.wne.sggw.pl/wp-content/uploads/2015/12/2011_art_wicki_ESRD_26_149-162.pdf (accessed on 7 May 2023).
  29. Report of the Chief Inspectorate of Environmental Protection (GIOŚ): Air Quality in Poland in 2017 in Light of the Results of Measurements Conducted as Part of the State Environmental Monitoring. State Environmental Monitoring—Inspection for Environmental Protection. Available online: https://powietrze.gios.gov.pl/pjp/content/show/1001477 (accessed on 12 April 2023).
  30. The Agency for Restructuring and Modernisation of Agriculture (ARMA) M. 10 Agri-Environment-Climate Measure. Available online: https://archiwum.arimr.gov.pl/pomoc-unijna/prow-2014-2020/dzialanie-rolnosrodowiskowo-klimatyczne-oraz-rolnictwo-ekologiczne-projekt-prow/dzialanie-10-dzialanie-rolno-srodowiskowo-klimatyczne.html (accessed on 5 February 2023).
  31. Harasim, A. Dobór wskaźników do oceny regionalnego zróżnicowania rolnictwa [Selection of indicators for the assessment of regional diversification of agriculture]. Stud. Rap. IUNG-PIB 2006, 3, 61–69. (In Polish) [Google Scholar]
  32. Kopiński, J.; Krasowicz, S. Regionalne zróżnicowanie warunków produkcji rolniczej w Polsce [Regional diversification of agricultural production conditions in Poland]. Stud. Rap. IUNG-PIB 2010, 22, 9–29. (In Polish) [Google Scholar]
  33. Kapusta, F. Cereals as a component of agriculture and Polish economy. Econom. 21st Cent. 2016, 2, 121–137. [Google Scholar] [CrossRef]
  34. Rokicki, T.; Perkowska, A.; Ziółkowska, P. Changes in the concentration of animal production in Poland. Annals PAAAE 2020, XXII, 175–186. [Google Scholar] [CrossRef]
  35. Kopiński, J. Zróżnicowanie gospodarki nawozowej azotem w polskim rolnictwie [Diversity of nitrogen management in polish agriculture]. Polish J. Agron. 2018, 32, 3–16. (In Polish) [Google Scholar]
  36. Parlińska, M.; Pomichowski, P. Analiza czynników wpływających na jakość powietrza w wybranych regionach Polski [Analysis of factors affecting air quality in selected regions of Poland]. Probl. Drobnych Gospodarstw Roln. 2018, 2, 83–91. (In Polish) [Google Scholar] [CrossRef]
  37. Tomala, M. Monitorowanie jakości powietrza w Polsce w świetle koncepcji smart city [Monitoring Air Quality in Poland in Light of Smart City Concept]. Środkowoeurop. Stud. Polit. 2023, 1, 1–70. (In Polish) [Google Scholar] [CrossRef]
  38. Burdziej, J.; Kunz, M. Obszary chronione w Polsce—Spojrzenie geoprzestrzenne [Protected areas in Poland—Geospatial view]. In Systemy Informacji Geograficznej w Zarządzaniu Obszarami Chronionymi—Od Teorii do Praktyki; Kunz, M., Nienartowicz, A., Eds.; FUH DANIEL Press, Tuchola: Toruń, Poland, 2013; pp. 16–25. [Google Scholar]
  39. Han, C.; Chen, S.; Yu, Y.; Xu, Z.; Zhu, B.; Xu, X.; Wang, Z. Evaluation of Agricultural Land Suitability Based on RS, AHP, and MEA: A Case Study in Jilin Province, China. Agriculture 2021, 11, 370. [Google Scholar] [CrossRef]
  40. Pan, Y.; Lin, Y.; Yang, R. Agricultural Production Space Suitability in China: Spatial Pattern, Influencing Factors and Optimization Strategies. Int. J. Environ. Res. Public Health 2022, 19, 13812. [Google Scholar] [CrossRef]
  41. Dumanski, J.; Onofrei, C. Techniques of crop yield assessment for agricultural land evaluation. Soil Use Manag. 1989, 5, 9–15. [Google Scholar] [CrossRef]
  42. Bhullar, A.; Nadeem, K.; Ali, R.A. Simultaneous multi-crop land suitability prediction from remote sensing data using semi-supervised learning. Sci Rep. 2023, 13, 6823. [Google Scholar] [CrossRef]
  43. Podolska, G. Effect of nitrogen fertilization doses and way of its application on yield and technological quality of winter wheat cultivars grain. Act. Sci. Polon. Agric. 2008, 7, 58–65. [Google Scholar]
  44. Liang, G. Nitrogen fertilization mitigates global food insecurity by increasing cereal yield and its stability. Glob. Food Sec. 2022, 34, 100652. [Google Scholar] [CrossRef]
  45. Walsh, O.S.; Marshall, J.; Nambi, E.; Shafian, S.; Jayawardena, D.; Jackson, C.; Lamichhane, R.; Owusu Ansah, E.; McClintick-Chess, J. Spring wheat yield and grain quality response to nitrogen rate. Agron. J. 2022, 114, 2562–2572. [Google Scholar] [CrossRef]
  46. Mohammed, Y.A.; Kelly, J.; Chim, B.K.; Rutto, E.; Waldschmidt, K.; Mullock, J.; Torres, G.; Desta, K.G.; Raun, W. Nitrogen fertilizer management for improved grain quality and yield in winter wheat in Oklahoma. J. Plant Nutr. 2013, 36, 749–761. [Google Scholar] [CrossRef]
  47. Walsh, O.; Shafian, S.; Christiaens, R. Nitrogen fertilizer management in dryland wheat cropping systems. Plants 2018, 7, 9. [Google Scholar] [CrossRef] [PubMed]
  48. Couillard, C.; Turkina, E. Trade liberalisation: The effects of free trade agreements on the competitiveness of the dairy sector. World Econ. 2015, 38, 1015–1033. [Google Scholar] [CrossRef]
  49. Zalewski, K.; Bórawski, P.; Żuchowski, I.; Parzonko, A.; Holden, L.; Rokicki, T. The Efficiency of Public Financial Support Investments into Dairy Farms in Poland by the European Union. Agriculture 2022, 12, 186. [Google Scholar] [CrossRef]
  50. Kondratowicz-Pozorska, J. Influence of a Financial Supply from EU on Results of Production Activity of Polish Farmers. Stud. Pr. WNEIZ US 2017, 50, 91–100. [Google Scholar] [CrossRef]
  51. Ochal, P.; Jadczyszyn, T.; Jurga, B.; Kopiński, J.; Matyka, M.; Madej, A.; Rutkowska, A.; Smreczak, B.; Łysiak, M. Environmental Aspects of Soil Acidification in Poland [ŚRodowiskowe Aspekty Zakwaszenia Gleb w Polsce]; Report of the Institute of Soil Science and Plant Cultivation; State Research Institute for Ministry of Agriculture and Rural Development: Puławy, Poland, 2017; Available online: https://www.izbarolnicza.lodz.pl/sites/default/files/IUNG%20ekspertyza%20_wapnowanie_17.10.2017r.pdf (accessed on 19 April 2023). (In Polish)
  52. Tkaczyk, P.; Mocek-Płóciniak, A.; Skowrońska, M.; Bednarek, W.; Kuśmierz, S.; Zawierucha, E. The Mineral Fertilizer-Dependent Chemical Parameters of Soil Acidification under Field Conditions. Sustainability 2020, 12, 7165. [Google Scholar] [CrossRef]
  53. Filipek, T.; Skowrońska, M. Current dominant causes and effects of acidification of soils under agricultural use in Poland. Acta Agroph. 2013, 20, 283–294. [Google Scholar]
  54. Watros, A.; Lipińska, H.; Lipiński, W.; Tkaczyk, P.; Krzyszczak, J.; Baranowski, P. Mineral Nitrogen Content in Hydrographic Areas of Poland Depending on Land Use. Int. Agrophys. 2019, 33, 481–491. [Google Scholar] [CrossRef]
  55. Watros, A.; Lipińska, H.; Lipiński, W.; Tkaczyk, P.; Krzyszczak, J.; Baranowski, P.; Brodowska, M.S.; Jackowska, I. The relationship between mineral nitrogen content and soil ph in grassland and fodder crop soils. Appl. Ecol. Environ. Res. 2018, 17, 107–121. [Google Scholar] [CrossRef]
  56. Tkaczyk, P.; Bednarek, W.; Dresler, S.; Krzyszczak, J.; Baranowski, P.; Slawiński, C. Relationship between assimilable-nutrient content and physicochemical properties of topsoil. Int. Agrophysics 2017, 31, 551–562. [Google Scholar] [CrossRef]
  57. Tian, D.; Niu, S. A global analysis of soil acidification caused by nitrogen addition. Environ. Res. Lett. 2015, 10, 024019. [Google Scholar] [CrossRef]
  58. Kopiński, J. Gross nitrogen balance as an agri-environmental indicator of the intensity changes in agricultural production. Zesz. Probl. Post. Nauk Roln. 2010, 547, 185–191. [Google Scholar]
  59. Tzemi, D.; Mennig, P. Effect of agri-environment schemes (2007–2014) on groundwater quality; spatial analysis in Bavaria, Germany. J. Rural Stud. 2022, 91, 136–147. [Google Scholar] [CrossRef]
  60. Haeler, E.; Bolte, A.; Buchacher, R.; Hänninen, H.; Jandl, R.; Juutinen, A.; Schueler, S. Forest subsidy distribution in five European countries. For. Policy Econ. 2023, 146, 102882. [Google Scholar] [CrossRef]
  61. Parlińska, M.; Pomichowski, P. Analysis of factors influencing air quality in chosen regions of Poland. Probl. Drobnych Gospod. Roln. 2018, 2, 83–91. [Google Scholar] [CrossRef]
  62. Łowicki, D. Landscape pattern as an indicator of urban air pollution of particulate matter in Poland. Ecol. Indic. 2019, 97, 17–24. [Google Scholar] [CrossRef]
  63. Lin, F.; Chen, X. Effects of Landscape Patterns on Atmospheric Particulate Matter Concentrations in Fujian Province, China. Atmosphere 2023, 14, 787. [Google Scholar] [CrossRef]
  64. Huang, D.; He, B.; Wei, L.; Sun, L.; Li, Y.; Yan, Z.; Feng, S. Impact of land cover on air pollution at different spatial scales in the vicinity of metropolitan areas. Ecol. Indic. 2021, 132, 108313. [Google Scholar] [CrossRef]
  65. Rasmussen, L.V.; Coolsaet, B.; Martin, A.; Mertz, O.; Pascual, U.; Corbera, E.; Dawson, N.; Fisher, J.A.; Franks, P.; Ryan, C.M. Social-ecological outcomes of agricultural intensification. Nat. Sustain. 2018, 1, 275–282. [Google Scholar] [CrossRef]
  66. Auer, A.; Maceira, N.; Nahuelhual, L. Agriculturisation and trade-offs between commodity production and cultural ecosystem services: A case study in Balcarce County. J. Rur. Stud. 2017, 53, 88–101. [Google Scholar] [CrossRef]
  67. Tengberg, A.; Fredholm, S.; Eliasson, I.; Knez, I.; Saltzman, K.; Wetterberg, O. Cultural ecosystem services provided by landscapes: Assessment of heritage values and identity. Ecosyst. Serv. 2012, 2, 14–26. [Google Scholar] [CrossRef]
  68. Wang, L.; Pedersen, P.B.M.; Svenning, J.C. Rewilding abandoned farmland has greater sustainability benefits than afforestation. NPJ Biodivers. 2023, 2, 5. [Google Scholar] [CrossRef]
  69. Daniel, T.C.; Muhar, A.; Arnberger, A.; Aznar, O.; Boyd, J.W.; Chan, K.M.; Costanza, R.; Elmqvist, T.; Flint, C.G.; Gobster, P.H.; et al. Contributions of cultural services to the ecosystem services agenda. Proc. Natl. Acad. Sci. USA 2012, 109, 8812–8819. [Google Scholar] [CrossRef]
  70. Flood, K.; Mahon, M.; McDonagh, J. Assigning value to cultural ecosystem services: The significance of memory and imagination in the conservation of Irish peatlands. Ecosyst. Serv. 2021, 50, 101326. [Google Scholar] [CrossRef]
  71. Maes, J.; Jacobs, S. Nature-based solutions for Europe’s sustainable development. Conserv. Lett. 2015, 10, 121–124. [Google Scholar] [CrossRef]
  72. McLoughlin, D.; Browne, A.; Sullivan, C.A. The delivery of ecosystem services through results-based agri-environment payment schemes (RBPS): Three Irish case studies. Proc. R. Ir. Acad. 2020, 120, 91–106. [Google Scholar] [CrossRef]
  73. Morri, E.; Santolini, R. Ecosystem Services Valuation for the Sustainable Land Use Management by Nature-Based Solution (NbS) in the Common Agricultural Policy Actions: A case study on the Foglia river basin (Marche Region, Italy). Land 2022, 11, 57. [Google Scholar] [CrossRef]
  74. Schirpke, U.; Marino, D.; Marucci, A.; Palmieri, M.; Scolozzi, R. Operationalising ecosystem services for effective management of protected areas: Experiences and challenges. Ecosyst. Serv. 2017, 28, 105–114. [Google Scholar] [CrossRef]
  75. Seddon, N.; Chausson, A.; Berry, P.; Girardin, C.A.J.; Smith, A.; Turner, B. Understanding the value and limits of nature-based solutions to climate change and other global challenges. Philos. Trans. R. Soc. B Biol. Sci. 2020, 375, 20190120. [Google Scholar] [CrossRef] [PubMed]
Figure 1. The territory of Poland (in yellow) divided into 16 territorial units (voivodeships); 1—Zachodniopomorskie, 2—Pomorskie, 3—Warmińsko-mazurskie, 4—Lubuskie, 5—Wielkopolskie, 6—Kujawsko-pomorskie, 7—Mazowieckie, 8—Podlaskie, 9—Dolnośląskie, 10—Łódzkie, 11—Lubelskie, 12—Opolskie, 13—Śląskie, 14—Świętokrzyskie, 15—Małopolskie, 16—Podkarpackie.
Resources 12 00099 g001
Figure 2. Examples of a significant impact of agricultural productivity factors on the level of indicators evaluating production ecosystem services; (A)—the impact of the index of agricultural production space suitability (F.1) on grain yields of cereal plants (P.1); (B)—the effect of the level of nitrogen fertilization (F.6) on the grain yield of cereal plants (P.1); (C)—the impact of the value of subsidies for investments under the Rural Development Programme (F.7) on the stocking of breeding animals in large animals per 100 ha (P.2); (D)—the impact of the share of agricultural land in the total area (F.2) on milk yield from one cow (P3).
Resources 12 00099 g002
Figure 3. Examples of a significant impact of agricultural productivity factors on the level of indicators evaluating environmental ecosystem services; (A)—the effect of the level of nitrogen fertilization on the percentage of soils with pH > 5.5; (B)—the impact of the value of subsidies for investments under the Rural Development Program on the gross nitrogen balance; (C)—the impact of the level of environmental subsidies M.10. on forestation; (D)—the impact of the share of cereals in the sowing structure on air quality measured by the number of days with daily PM10 concentrations exceeded.
Resources 12 00099 g003
Figure 4. Examples of a significant impact of agricultural productivity factors on the level of indicators evaluating cultural ecosystem services; (A)—impact of the share of cereals in the crop’s structure on arable land (F.5) on the number of natural monuments per 1000 inhabitants (C.1); (B)—the impact of the value of the benefit subsidy M.10. in July 2021 for one person (F.8) on the number of natural monuments per 1000 inhabitants (C.1); (C)—the impact of the share of permanent grasslands in the area of agricultural land (F.3) on the share of nature reserves in the total area (C.2); (D)—the impact of the share of ecological land in the area of agricultural land (F.4) on the number of agritourists per 1000 inhabitants (C.4).
Resources 12 00099 g004
Table 1. Selected environmental, agrotechnical, and financial factors (F) of agricultural productivity in Poland.
SymbolFactorUnit
F.1Agricultural production space suitability0–100 (rating)
F.2Share of agricultural land in the overall surface%
F.3Share of permanent grasslands in the area of agricultural land%
F.4Share of ecological land in the area of agricultural land%
F.5Share of cereals in the crop’s structure on arable land%
F.6Mineral fertilization with nitrogen per 1 ha of agricultural landkg
F.7Value of subsidies for investments per 1 ha of agricultural land (2004–2013)EUR *
F.8The value of the benefit subsidy M.10. in July 2021 for 1 personthous. EUR *
* The value expressed in EUR (euro) converted from PLN (zloty) at the exchange rate of 31 July 2023 1 EUR = 4.4190 PLN.
Table 2. Indicators selected for assessing the level of production (P), environmental (E), and cultural (C) ecosystem services.
SymbolIndicatorUnit
Production/provisioning services
P.1The yield of basic cereal grains from 1 hadt
P.2Stocking of breeding animals in large animals per 100 hain heads
P.3Milk yield from one cowthous. L
P.4Commodity production volume per 1 ha of agricultural landthous. EUR *
Environmental services
E.1The share of favorable soils pH above 5.5%
E.2Soil organic matter content%
E.3Share of soils with a satisfactory humus content%
E.4Gross nitrogen balance per 1 ha of agricultural landkg
E.5Forestation%
E.6Air quality—number of days with excessive PM10 concentrations-
E.7Air quality—negative opinion of the respondents%
Cultural services
C.1Number of natural monuments per 1000 inhabitantsin pcs
C.2Share of nature reserves in the total area%
C.3Area of nature reserves per 1000 inhabitantsha
C.4Number of agritourists per 1000 inhabitants-
C.5Number of agritourism nights per 1000 inhabitants-
* The value expressed in EUR converted from PLN at the exchange rate of 31 July 2023 1 EUR = 4.4190 PLN.
Table 3. Characteristics of the agrotechnical and financial factors (F) of agricultural productivity in Poland.
FactorMean *Min *Max *σ *CV *
F.1Agricultural production space suitability67.155.081.46.59.7
F.2Share of agricultural land in the overall surface45.027.761.111.425.3
F.3Share of permanent grasslands in the area of agricultural land21.17.738.09.243.4
F.4Share of ecological land in the area of agricultural land3.80.612.34.0106.9
F.5Share of cereals in the crop’s structure on arable land69.660.476.75.17.3
F.6Mineral fertilization with nitrogen per 1 ha of agricultural land74.543.9111.620.327.2
F.7Value of subsidies for investments per 1 ha of agricultural land (2004–2013)106.132.4213.851.148.2
F.8The value of the benefit subsidy M.10. in July 2021 for 1 person11.04.820.74.238.0
* mean—the average value, min—the minimum value, max—the maximum value, σ—standard deviation, CV—coefficient of variation.
Table 4. Characteristics of the ES indicators (KPIs).
IndicatorMeanMinMax σ CV
Production/provisioning services
P.1The yield of basic cereal grains from 1 ha40.530.955.86.415.7
P.2Stocking of breeding animals in large animals per 100 ha41.112.985.622.554.8
P.3Milk yield from one cow5.33.07.41.324.9
P.4Commodity production volume per 1 ha of agricultural land1.30.62.10.430.3
Environmental services
E.1The share of favorable soils pH above 5.55335781222.6
E.2Soil organic matter content2.231.833.040.3314.6
E.3Share of soils with a satisfactory humus content47.932.874.113.428.1
E.4Gross nitrogen balance per 1 ha of agricultural land46.12.593.722.548.8
E.5Forestation30.321.449.37.123.5
E.6Air quality (number of days with PM10 exceeding concentration threshold *)4211761944.1
E.7Air quality—negative opinion of the respondents258481249.8
Cultural services
C.1Number of natural monuments per 1000 inhabitants1.020.321.690.4039.4
C.2Share of nature reserves in the total area0.510.101.380.3465.9
C.3Area of nature reserves per 1000 inhabitants5.81.023.66.6113.4
C.4Number of agritourists per 1000 inhabitants3.790.946.451.7947.1
C.5Number of agritourism nights per 1000 inhabitants14.64.622.76.746.1
* Daily concentrations (24-h average) are measured against a threshold value of 50 µg·m−3 according to the EU’s air quality directives (2008/50/EC Directive on Ambient Air Quality and Cleaner Air for Europe and 2004/107/EC Directive on heavy metals and polycyclic aromatic hydrocarbons in ambient air).
Table 5. Correlation coefficients (r) characterizing significant influence of agricultural productivity factors on provisioning ecosystem services indicators (KPIs) (F.1 agricultural production space suitability, F.2 share of agricultural land in the overall surface, F.3 share of permanent grasslands in the area of agricultural land, F.4 share of ecological land in the area of agricultural land, F.5 share of cereals in the crop’s structure on arable land, F.6 mineral fertilization with nitrogen per 1 ha of agricultural land, F.7 value of subsidies for investments per 1 ha of agricultural land (2004–2013), F.8 the value of the benefit subsidy M.10. in July 2021 for one person; P.1 the yield of basic cereal grains from 1 hectare, P.2 stocking of breeding animals in large animals per 100 ha, P.3 milk yield from one cow, P.4 commodity production volume per 1 ha of agricultural land).
Agriculture Productivity FactorsKPIs Assessing the Level of Provisioning Ecosystem Services
P.1P.2P.3P.4
F.10.81 **−0.58 *--
F.2-0.66 **0.78 **0.56 *
F.3−0.59 *---
F.4---−0.51 *
F.5----
F.60.68 **-0.66 **-
F.7-0.80 **0.64 **0.58 *
F.8----
*—significant at p = 0.05, **—significant at p = 0.01, -—insignificant.
Table 6. Correlation coefficients (r) characterizing significant dependencies of agricultural productivity factors and indicators (KPIs) assessing the level of environmental ecosystem services (F.1 agricultural production space suitability, F.2 share of agricultural land in the overall surface, F.3 share of permanent grasslands in the area of agricultural land, F.4 share of ecological land in the area of agricultural land, F.5 share of cereals in the crop’s structure on arable land, F.6 mineral fertilization with nitrogen per 1 ha of agricultural land, F.7 value of subsidies for investments per 1 ha of agricultural land (2004–2013), F.8 the value of the benefit subsidy M.10. in July 2021 for one person; E.1 the share of favorable soils pH above 5.5, E.2 soil organic matter content, E.3 share of soils, with a satisfactory humus content, E.4 gross nitrogen balance per 1 ha of agricultural land, E.5 forestation, E.6 air quality (number of days with exceeding PM10 concentration threshold, E.7 air quality—negative opinion of the respondents).
Agriculture Productivity FactorsKPIs Assessing the Level of Environmental Ecosystem Services
E.1E.2E.3E.4E.5E.6E.7
F.10.64 **------
F.2--−0.55 *0.67 **−0.81 **--
F.3−0.65 **------
F.4----0.62 **−0.60 *−0.66 **
F.5-----0.86 **0.81 **
F.60.72 **--0.66 **---
F.7-−0.51 *−0.51 *0.86 ** --
F.8----0.68 **--
*—significant at p = 0.05, **—significant at p = 0.01, -—insignificant.
Table 7. Correlation coefficients (r) characterizing significant relationships between agricultural productivity factors and indicators (KPIs) assessing the level of cultural ecosystem services (F.1 agricultural production space suitability, F.2 share of agricultural land in the overall surface, F.3 share of permanent grasslands in the area of agricultural land, F.4 share of ecological land in the area of agricultural land, F.5 share of cereals in the crop’s structure on arable land, F.6 mineral fertilization with nitrogen per 1 ha of agricultural land, F.7 value of subsidies for investments per 1 ha of agricultural land (2004–2013), F.8 the value of the benefit subsidy M.10. in July 2021 for one person; C.1 number of natural monuments per 1000 inhabitants, C.2 share of nature reserves in the total area, C.3 area of nature reserves per 1000 inhabitants, C.4 number of agritourists per 1000 inhabitants, C.5 number of agritourism nights per 1000 inhabitants).
Agriculture Productivity FactorsKPIs Assessing the Level of Cultural Ecosystem Services
C.1C.2C.3C.4C.5
F.1-----
F.2-----
F.3-0.54 *0.51 *--
F.40.75 **-0.58 *0.64 **0.57 *
F.5−0.79 **−0.67 **−0.72 **-−0.57 *
F.6-----
F.7-----
F.80.53 *----
*—significant at p = 0.05, **—significant at p = 0.01, -—insignificant.
Disclaimer/Publisher’s Note: The statements, opinions and data contained in all publications are solely those of the individual author(s) and contributor(s) and not of MDPI and/or the editor(s). MDPI and/or the editor(s) disclaim responsibility for any injury to people or property resulting from any ideas, methods, instructions or products referred to in the content.

