Article

How Do Extreme Lake Water Temperatures in Poland Respond to Climate Change?

1
Department of Land Improvement, Environmental Development and Spatial Management, Poznań University of Life Sciences, Piatkowska 94E, 60-649 Poznan, Poland
2
Department of Hydrology and Water Management, Adam Mickiewicz University, Krygowskiego 10, 61-680 Poznan, Poland
*
Author to whom correspondence should be addressed.
Resources 2023, 12(9), 107; https://doi.org/10.3390/resources12090107
Submission received: 20 July 2023 / Revised: 3 September 2023 / Accepted: 5 September 2023 / Published: 7 September 2023

Abstract

:
Lakes are vital components of the Earth’s hydrological cycle and are susceptible to the impacts of climate change. Understanding the changes in terms of minimum and maximum lake surface temperatures is crucial for assessing the effects of climate change on freshwater ecosystems. This study focuses on ten lakes in Poland to investigate the impacts of climate change on lake temperatures in different geographical regions. The Mann–Kendall (MK) and Sen tests were employed to analyze trends and changes in minimum and maximum water temperatures, respectively. The results reveal significant increases in the minimum and maximum temperatures, particularly in May and June. Different lakes exhibit varying trends and variability in temperature changes over time, indicating the vulnerability of these ecosystems. The current study also examines the magnitude of annual temperature changes and classifies them into different levels. This analysis highlights the complex relationship between air temperature, seasonal cycles, and lake morphometric characteristics in shaping variations in lake surface water temperature. These findings contribute to understanding the impacts of climate change on Poland’s lakes and provide valuable insights for developing conservation strategies and adaptive measures to protect freshwater resources.

1. Introduction

Climate change is a global phenomenon with significant implications for ecosystems worldwide, including lakes. Lakes act as sensitive indicators of climate change, responding to alterations in air temperature and climatic conditions. They have well-defined ecosystems that can be studied using standard protocols and are affected by direct and indirect changes related to climate change [1].
Previous studies have provided insight into the effects of climate change on aquatic ecosystems [2,3,4]. According to the authors of [5], climate change affects lakes in two ways: directly, through changes in atmospheric drivers such as temperature, precipitation, wind speed, and radiation, and indirectly, through modifications to catchment properties. This effect includes changes in food-web dynamics, biodiversity, and ecological productivity [6]. Climate change can cause significant ecological changes, such as shifts in the composition, seasonality, and production of algae, fluctuations in the abundance and emergence of insect populations, and alterations in the abiotic filters that impact the success of invasive or nuisance species [3,4,6,7,8,9,10]. Verburg [11] observed that the current warming trend had significant consequences for stratification in lakes, which indirectly affects plankton. Furthermore, there has been an increase in cyanobacteria dominance and alterations in the timing and duration of the growing season [12], which could cause mismatches between phytoplankton and zooplankton [13].
In the same way, warming lake water due to climate change could cause a decrease in the dissolved oxygen concentration [14,15]. It may also lead to a decline in lake ice formation [16,17] and increase lake evaporation by substantially altering the hydrological, chemical, and energy budgets of lakes [18,19,20] and fundamentally causing a trade-off between precipitation (P), evaporative water loss, and alterations in terrestrial water storage [21]. Additionally, climate change can influence the warming of lake surface water temperature (LSWT) and can cause a lake to experience a change in water storage that could result in an increase, decrease, or no significant cumulative change [22,23,24,25]. In general, the impact of climate change on lakes is complex and varied.
The minimum and maximum lake surface temperatures play a vital role in shaping the thermal regime of lakes, influencing water quality, aquatic biodiversity, and overall ecosystem functioning. Previous studies have largely focused on mean lake surface temperatures and air temperatures [26,27], leaving a relative gap in the comprehensive understanding of changes in the minimum and maximum temperature extremes in Poland’s lakes. This study thoroughly analyzes historical data from the time period of 1972–2021 regarding minimum and maximum lake surface temperatures across Poland to address this knowledge gap by examining long-term trends and temporal variations; the aim is to discern the changes occurring in these temperature extremes and their relationship to climate change. The outcomes of this in-depth analysis will contribute to the expanding body of knowledge on the impact of climate change on lakes, with a specific focus on Poland. By unraveling the intricacies of trends, variations, and the magnitude of change in minimum and maximum lake surface temperatures, this study will provide critical insights into the vulnerabilities and resilience of Poland’s lakes to climate change. The findings will inform evidence-based decision-making, aiding in developing tailored conservation strategies and adaptive measures to ensure the long-term sustainability and preservation of Poland’s invaluable freshwater resources.

2. Materials and Methods

2.1. Study Area

The study was conducted in Poland and focused on lake surface temperature, taking advantage of the country’s extensive freshwater resources, including more than 9300 lakes. Poland’s geographical position between the Baltic Sea and the Tatra Mountains provides an interesting climate combination of continental and oceanic influences, making it an ideal location for investigating the impacts of climate change on lake temperatures. The study examined ten Polish lakes, which were strategically selected to represent various geographical regions (Figure 1). These lakes included Lake Studzieniczne in the eastern region, Lake Sławskie in the western and southern regions, and Lake Gardno, a coastal lake in the north. Most of the analyzed lakes were formed after the last glaciation, except for Lake Gardno. All the studied lakes had a flow-through characteristic, meaning that water consistently flowed in and out of the lakes. Detailed information on the lakes’ basic morphometric parameters can be found in Table 1 of the study.

2.2. Materials

This study utilized daily water temperature data collected between 1972 and 2021 from 10 lakes located in Poland. The data were obtained through measurements conducted by the Institute of Meteorology and Water Management—National Research Institute at a depth of 0.4 m beneath the water surface in the coastal zone. Standard measurements were taken at 6 UTC. This study also includes information on air temperature, as measured by the same institute (measured in standard meteorological cages at a height of 2 m above the ground surface). The daily data were utilized to determine the minimum and maximum monthly and annual values.

2.3. Methods

The hydrological year in Poland begins on November 1 of the previous year and ends on October 31 of the current year. The study adopts time series data from 1972 to 2021 to examine the changes in the lakes’ minimum and maximum water temperatures. The temperature data were analyzed on both a monthly and annual basis. To better understand the temperature changes within each period and identify any trends that may have occurred, the temperature data were divided into three periods: 1972–2001, 1982–2011, and 1982–2021. Air temperatures were measured daily to collect the necessary data, and the minimum, maximum, and average daily values were determined. The minimum and maximum temperature for each day of the month and year were then calculated from this data using MS Excel. The temperature data for each year within each period was analyzed and then presented in a clear format, such as temperature duration curves. This allowed the researchers to read 90% of values and compare the temperature trends within and between the different periods. Finally, the resulting data set was subjected to further statistical analysis to understand the temperature trends better and identify any significant changes that occurred over the years.

2.4. Statistical Analysis

This study adopts the Mann–Kendall test (MK) following the method used in [29,30,31] to determine the trends of changes in minimum and maximum water temperatures. This method has been widely used in analyses involving hydrological and climatic change trends [26,30,32,33,34]. Although the MK test lacks autocorrelation, this was removed from the data set by adopting the trend-free pre-whitening procedure developed elsewhere [29,35]. Similarly, the study adopts a non-parametric Sen test (S) following the method used in [33,36] to evaluate the magnitude of changes in maximum lake water temperature. The study adopts the Sen test against ordinary least square (OLS) regression because the test is based on the median of all possible pairwise slopes between the observations, making it less sensitive to outliers. In addition, Sen’s estimator is robust when faced with outliers because it does not assume any particular distribution of the errors or the data and is a more robust measure of central tendency than the mean [28]. The modified MK package developed by the authors of [37] was used to analyze trends and measure changes in magnitude through the MK and S tests in R studio. Finally, based on the calculated values of the Sen slope for each lake, mean and median values were calculated for the periods 1972–2001, 1982–2011, 1982–2021, and the whole period of 1972–2021. In order to answer the question regarding in which period the greatest changes occurred, the significance of differences was analyzed using a parametric t-test and the nonparametric sign test, respectively. The t-test and sign-test results were presented on the background of mean and median values, respectively. Differential significance calculations were performed for annual and monthly periods at a significance level of 0.05.

3. Results

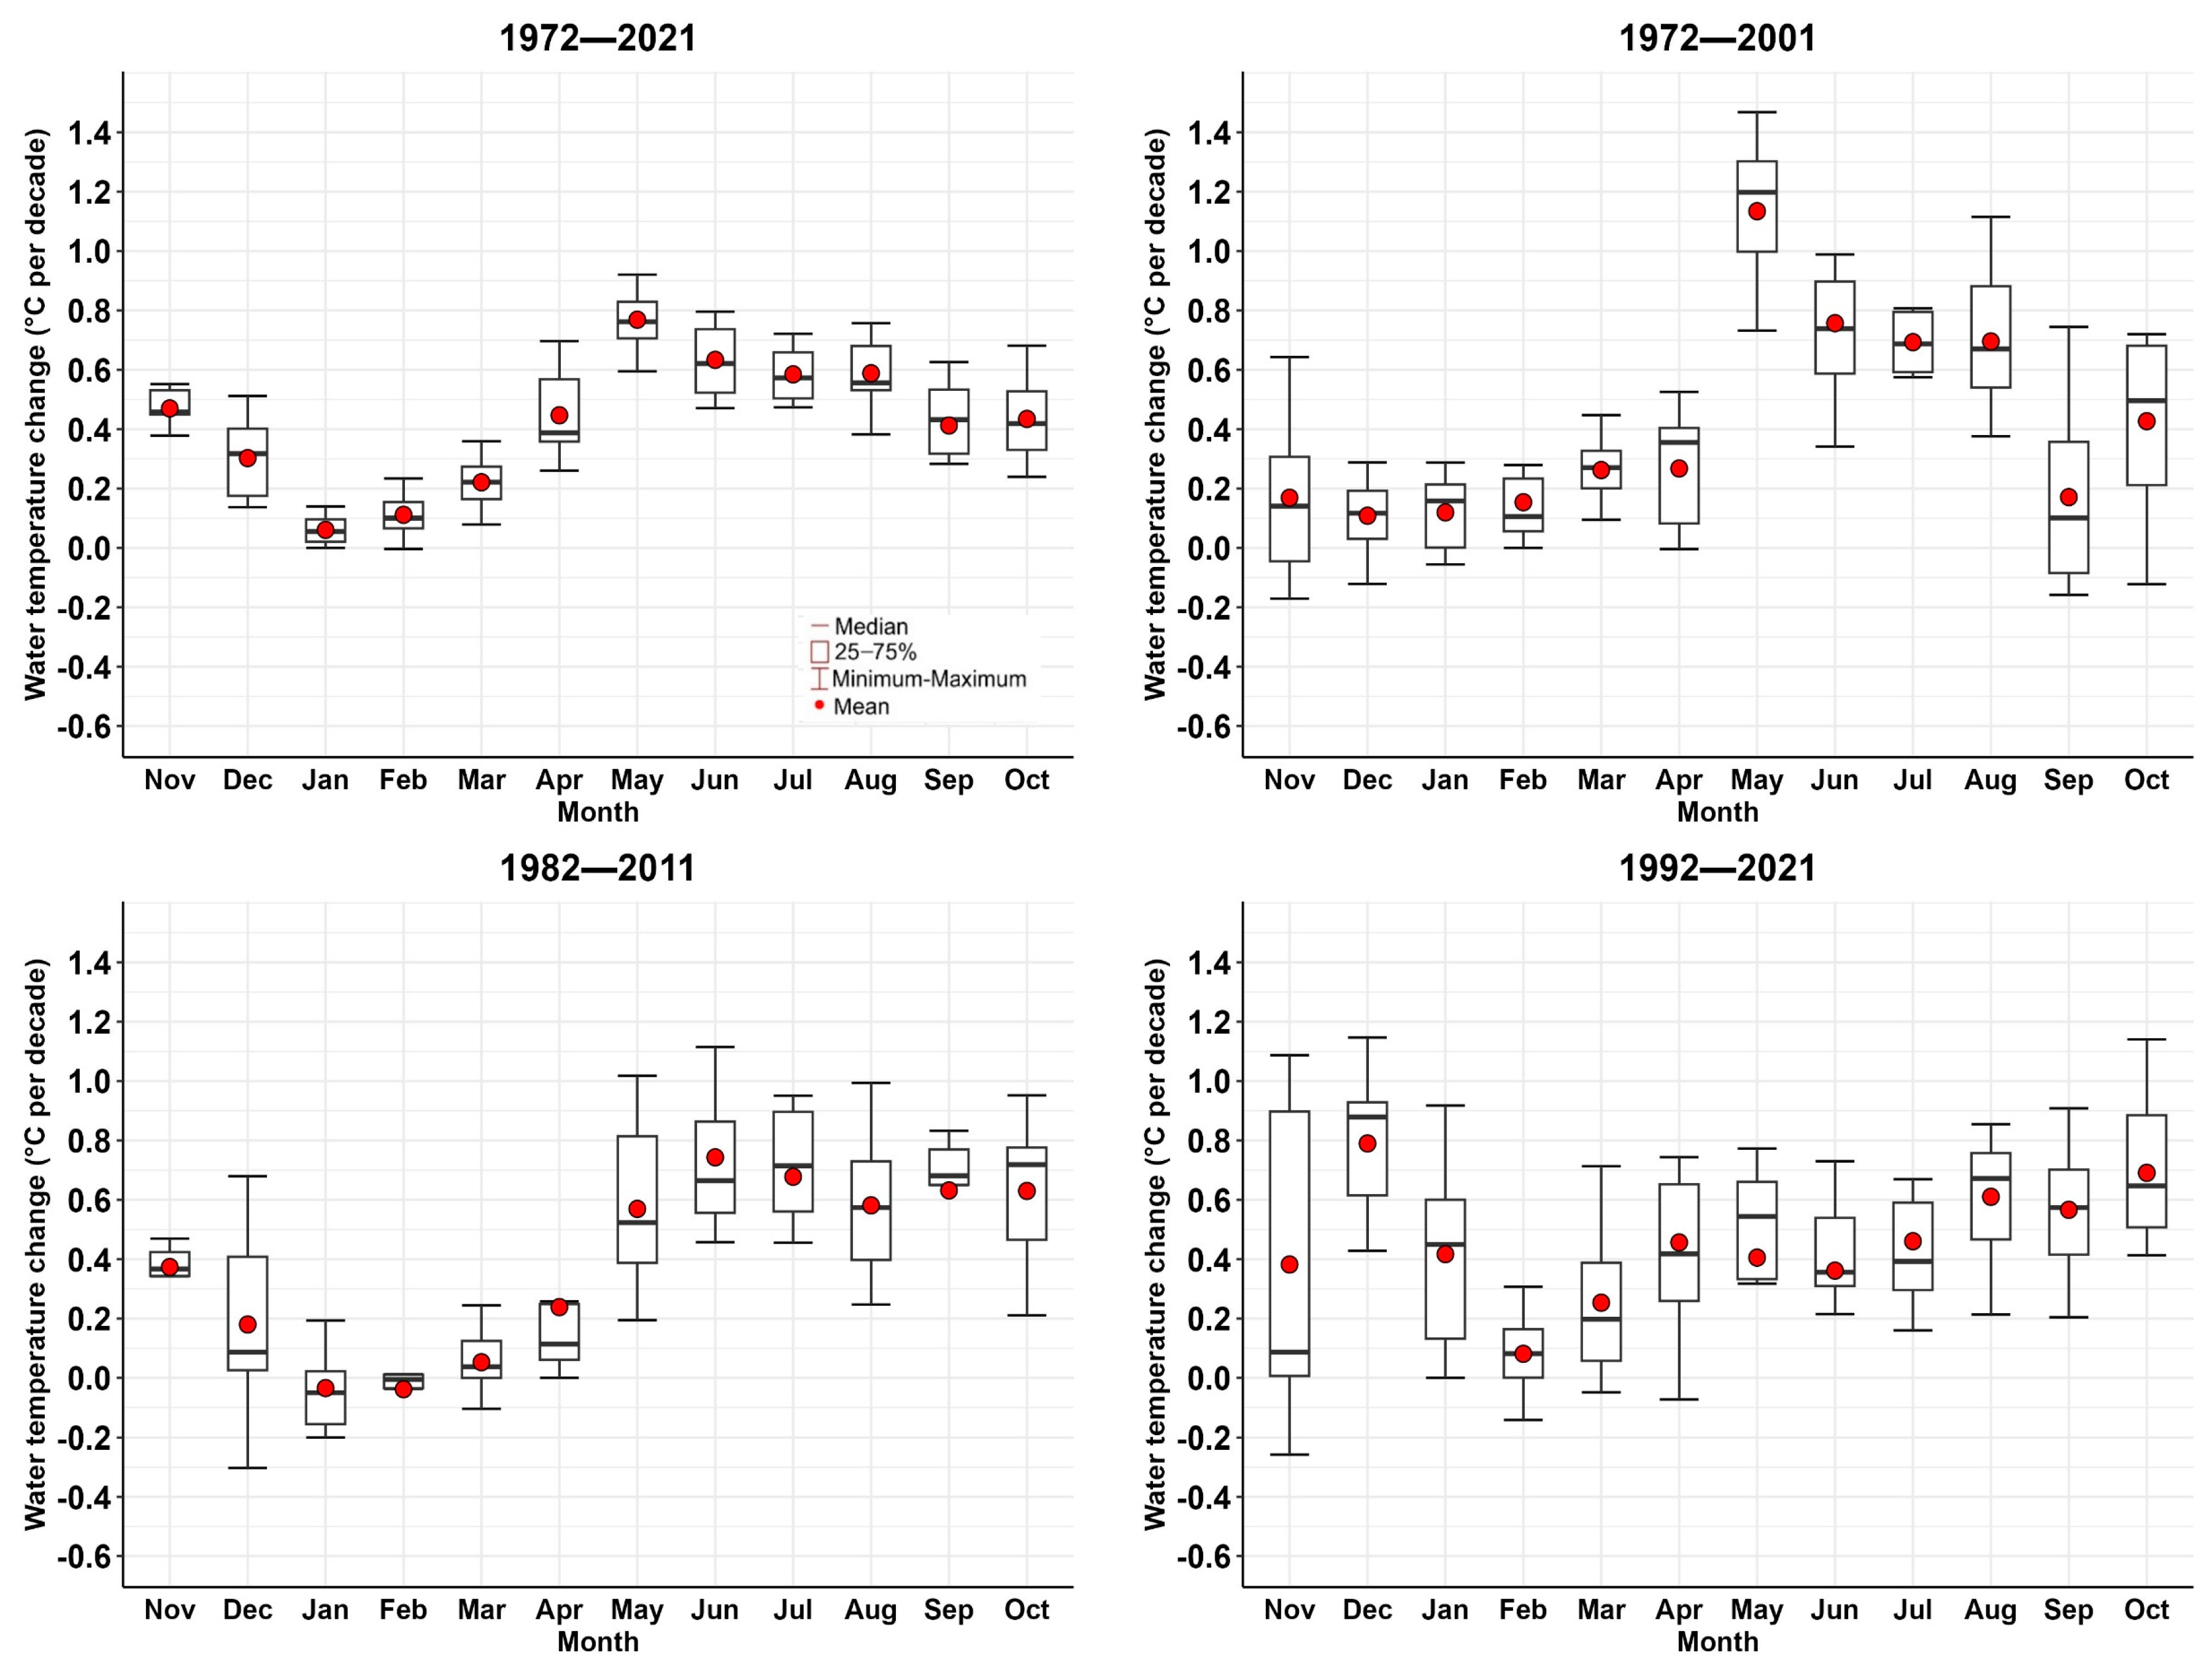
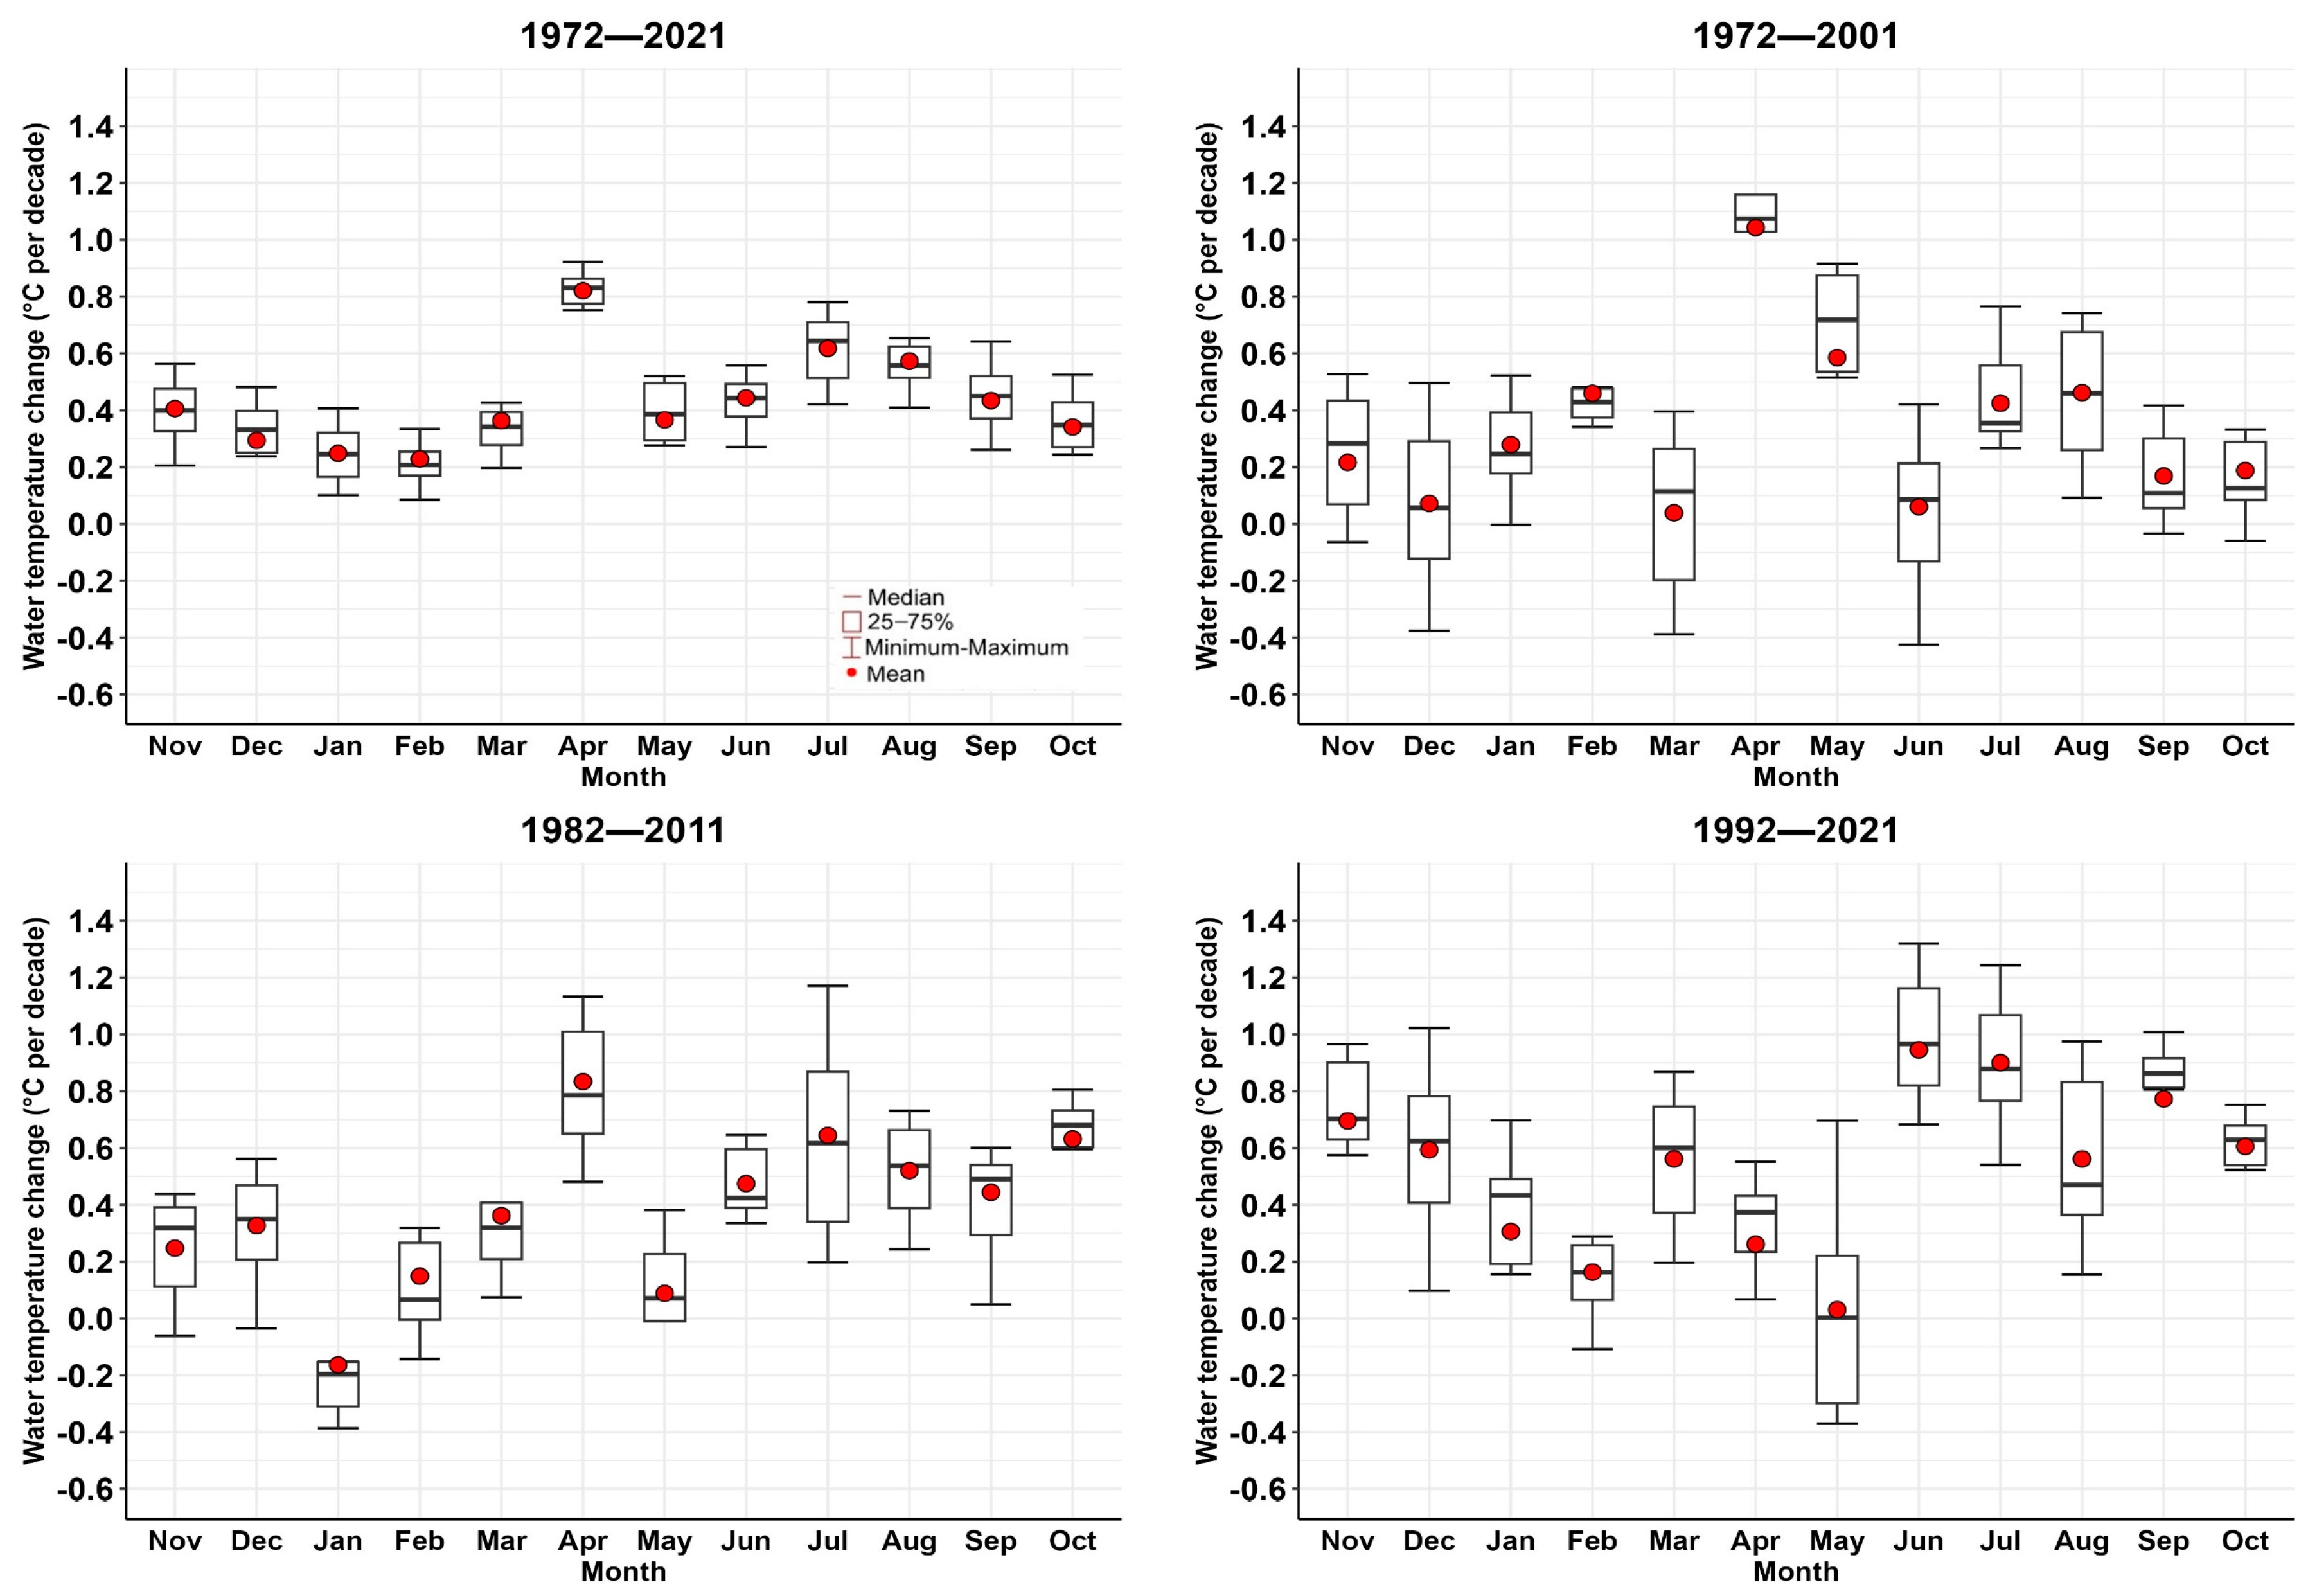
The results of the monthly trends in the lakes’ minimum and maximum surface water temperature are presented in Figure 2 and Figure 3, respectively, and span four different periods: 1972–2021, 1972–2001, 1982–2011, and 1992–2021. For minimum LSWT (Figure 2), the highest increase in water temperature was observed in May for the period from 1972 to 2021 and 1972 to 2001. However, the latter period experienced a more significant temperature increase, with mean values of 0.8 °C per decade and 1.2 °C per decade, respectively. In 1982–2011, June had the highest rate of temperature increase, with a mean value of 0.7 °C per decade. December showed the highest rate of temperature increase in the period from 1992 to 2021, with a mean value of 0.6 °C per decade. January and February consistently exhibited lower temperatures across all four periods, with mean values ranging from 0.0 °C per decade to 0.1 °C per decade. Similarly, regarding maximum LSWT (Figure 3), the highest increase in water temperature was observed in April, with mean values of 0.8 °C per decade, 1.1 °C per decade, and 0.8 °C per decade, respectively, while in the period from 1992 to 2021, June had the highest rate of temperature increase, with a mean value of 1 °C per decade. Conversely, the lower water temperature varies across each period. Lower water temperature was observed in February with an average of 0.2 °C per decade for the years 1972–2021, in March with an average of 0.0 °C per decade for 1972–2001, in January with an average of −0.2 °C per decade for 1982–2011, and in May with a mean of 0.1 °C per decade for 1992–2021.
Furthermore, the variability in the trends of changes in water temperature differed across the analyzed lakes and also varied among the four time periods. Regarding minimum LSWT, from 1972 to 2021, June, September, and December have higher variability, with an average difference of 0.2 °C per decade. In 1972–2001, September, October, and November exhibited the highest variability, with an average difference of 0.4 °C per decade. May, July, and December showed the highest variability in temperature change, recording an average difference of 0.4 °C per decade from 1982 to 2011. In 1992–2021, January, April, and November exhibited the highest variability, with an average difference of 0.6 °C per decade. Lower variability was consistently recorded in January, February, and November for the period from 1972 to 2021, with an average difference of 0.1 °C per decade, and in February, March, and December for the 1972–2001 period, with an average difference of 0.2 °C per decade. In the same vein, lower variability was observed in February, September, and November for 1982–2011, with an average difference of 0.1 °C per decade, while in the 1992–2021 period, February, June, and September consistently showed lower variability, with an average difference of 0.2 °C per decade. In the case of maximum LSWT, May, July, and October consistently displayed the highest variability for the period from 1972 to 2021, with an average difference of 0.2 °C per decade, while March, August, and December were the months with the highest variability for the period from 1972 to 2001, with an average difference of 0.4 °C per decade. For the period from 1982 to 2011, April, May, and July have the highest variability, with an average difference of 0.5 °C per decade, and finally, for the period from 1992 to 2021, May, August, and December recorded the highest variability, with an average difference of 0.5 °C per decade. Lower variability was consistently recorded for February, September, and October in 1972–2021, for January, March, and October in 1972–2001, and for January, February, and October in 1982–2011, with an average difference of 0.2 °C per decade for all three periods. Similarly, in 1992–2021, February, April, and August consistently showed lower variability, with an average difference of 0.1 °C per decade.
The yearly temperature trends for each lake were analyzed using the Mann–Kendall Z- and p-values (Table 2). A positive Z-value indicates an upward trend and implies an increasing trend over time. A p-value at a significance level alpha (0.05) was used to determine if the trend was statistically significant, thus indicating a considerable increase in the trend at a 5% level.
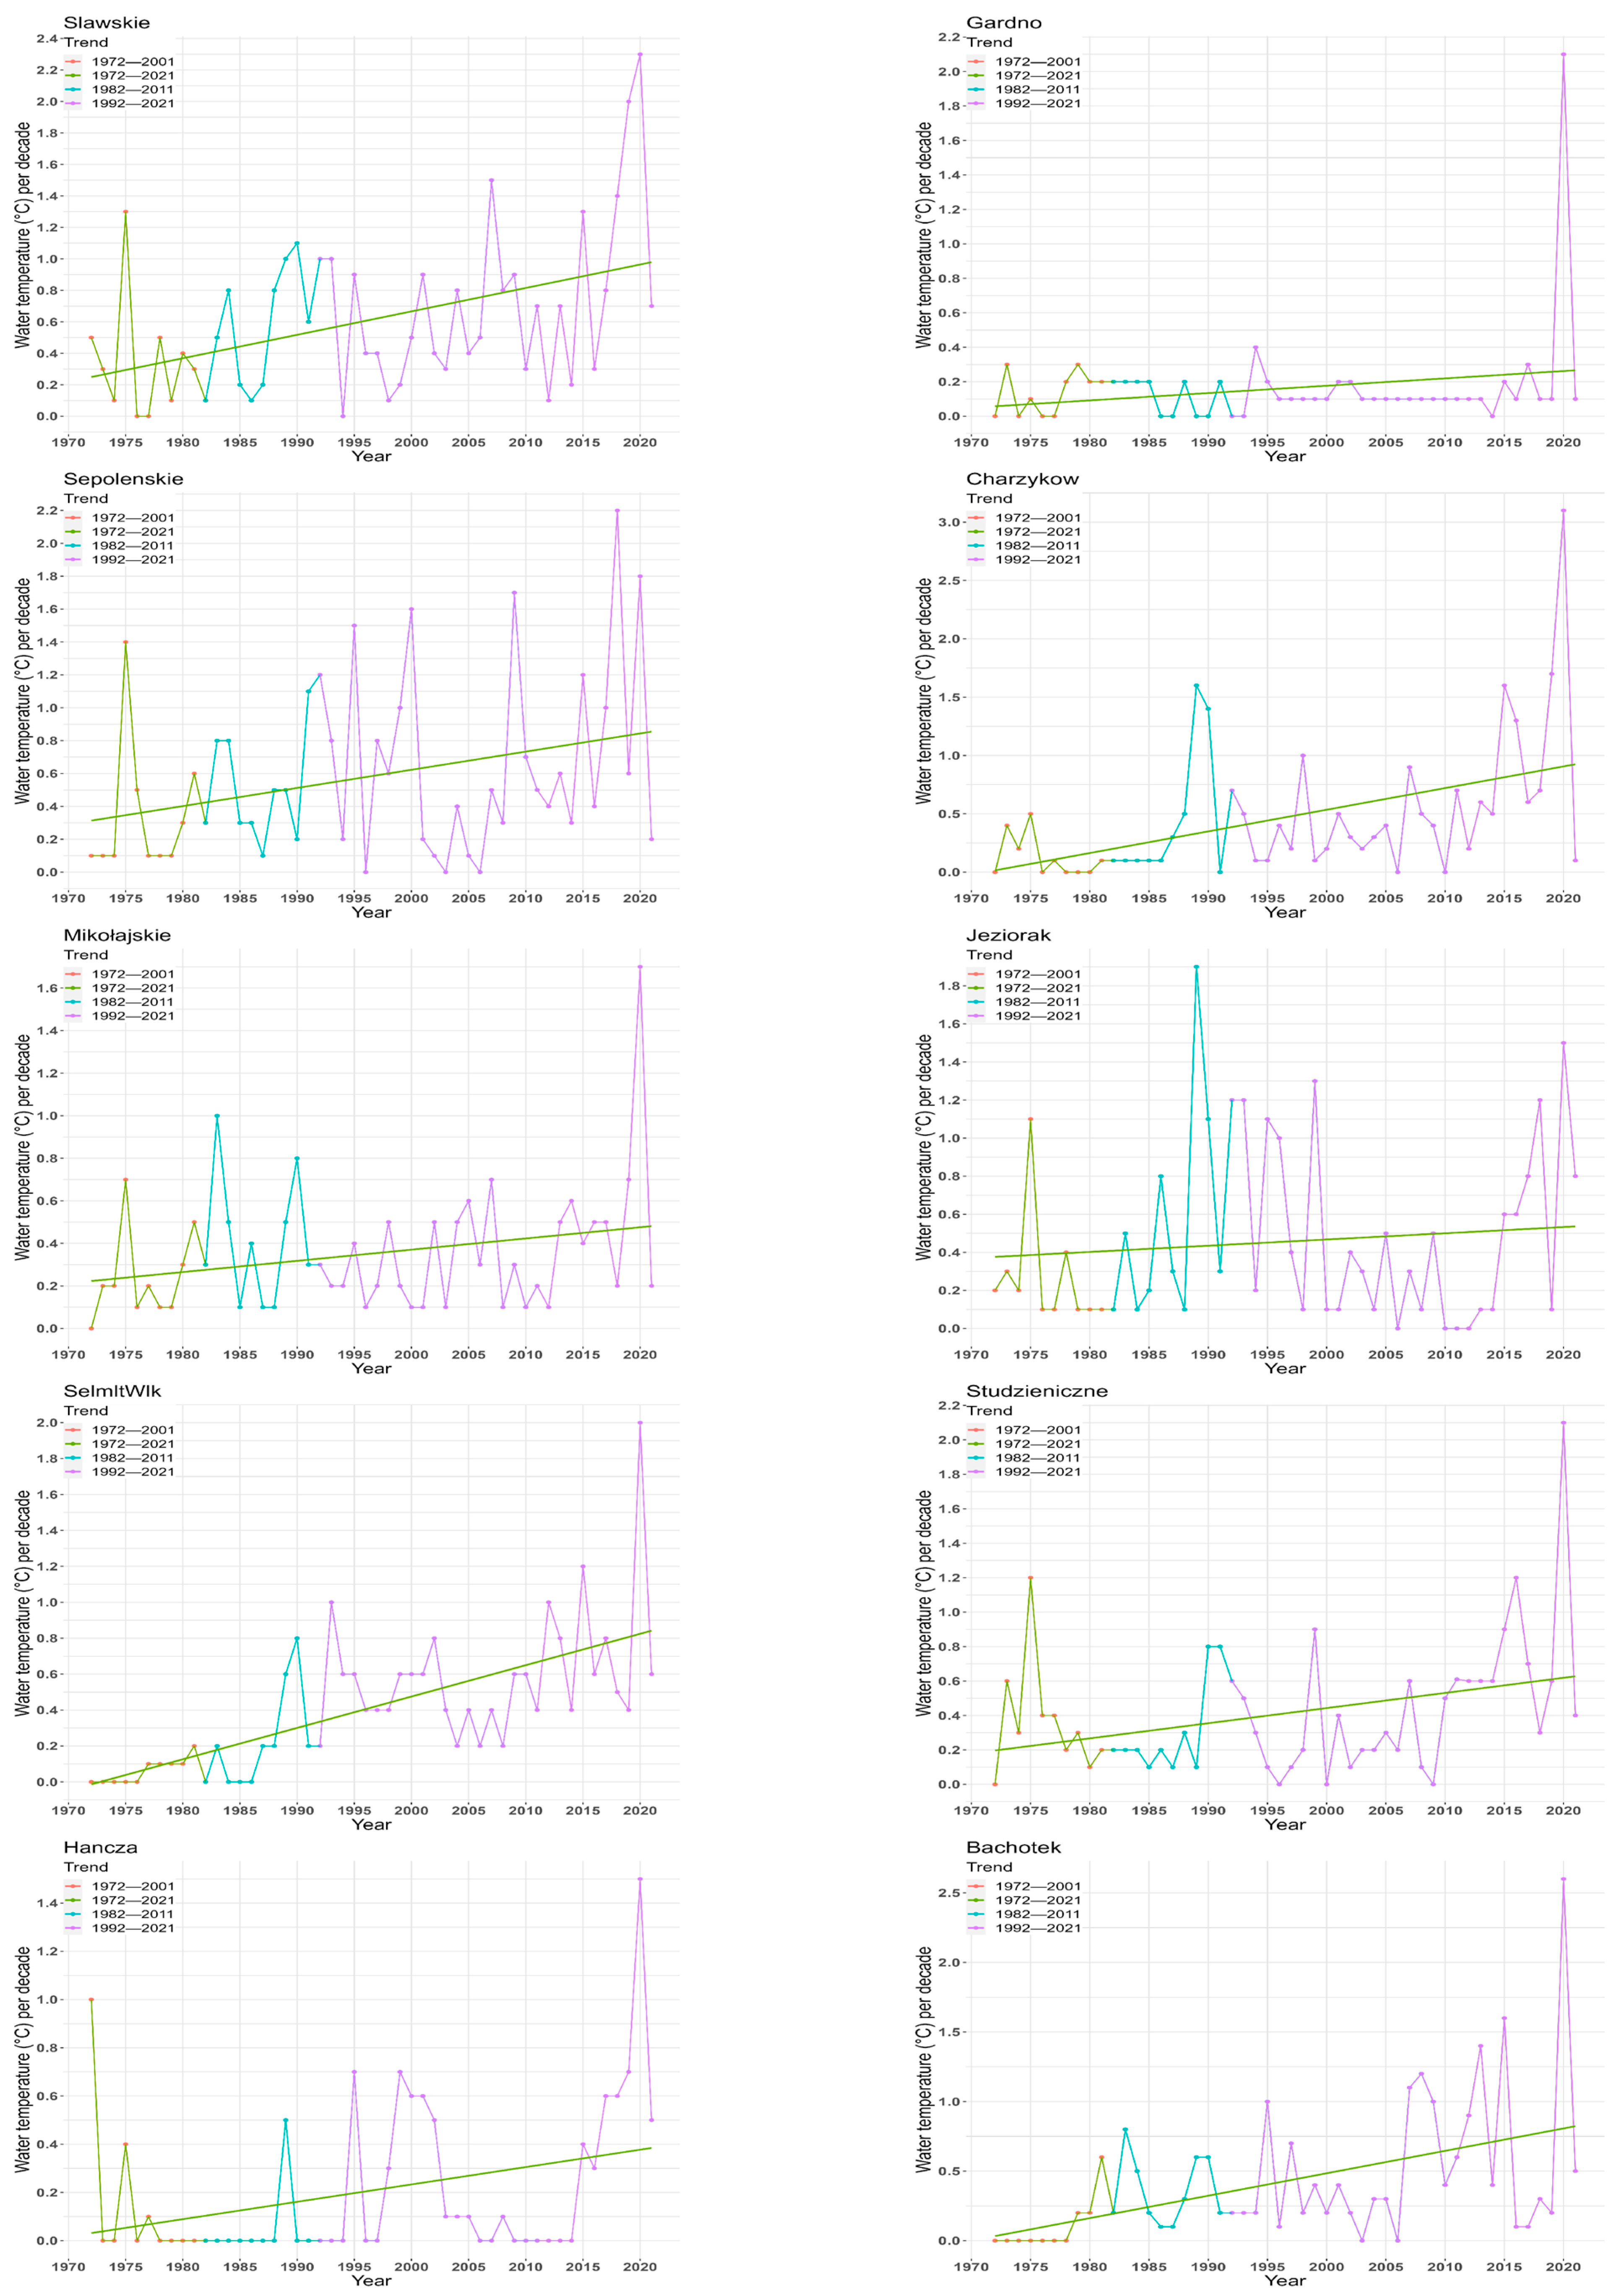
Figure 4 depicts the minimum yearly trend analysis results, which reveal significantly increasing trends at a 5% significance level in various lakes. Lakes Charzykowskie and Bachotek showed significant increasing trends in three periods: 1972–2021, 1972–2001, and 1992–2021, while Lakes Selmęt Wielki and Hańcza showed significantly increasing trends in two periods, 1972–2021 and 1972–2001. Additionally, Lake Studzieniczne exhibited significantly increasing trends from 1992 to 2021, while Lake Sępoleńskie displayed significantly increasing trends from 1972 to 2001. Notably, no significant increase was observed between 1982 and 2011 across any of the lakes examined.
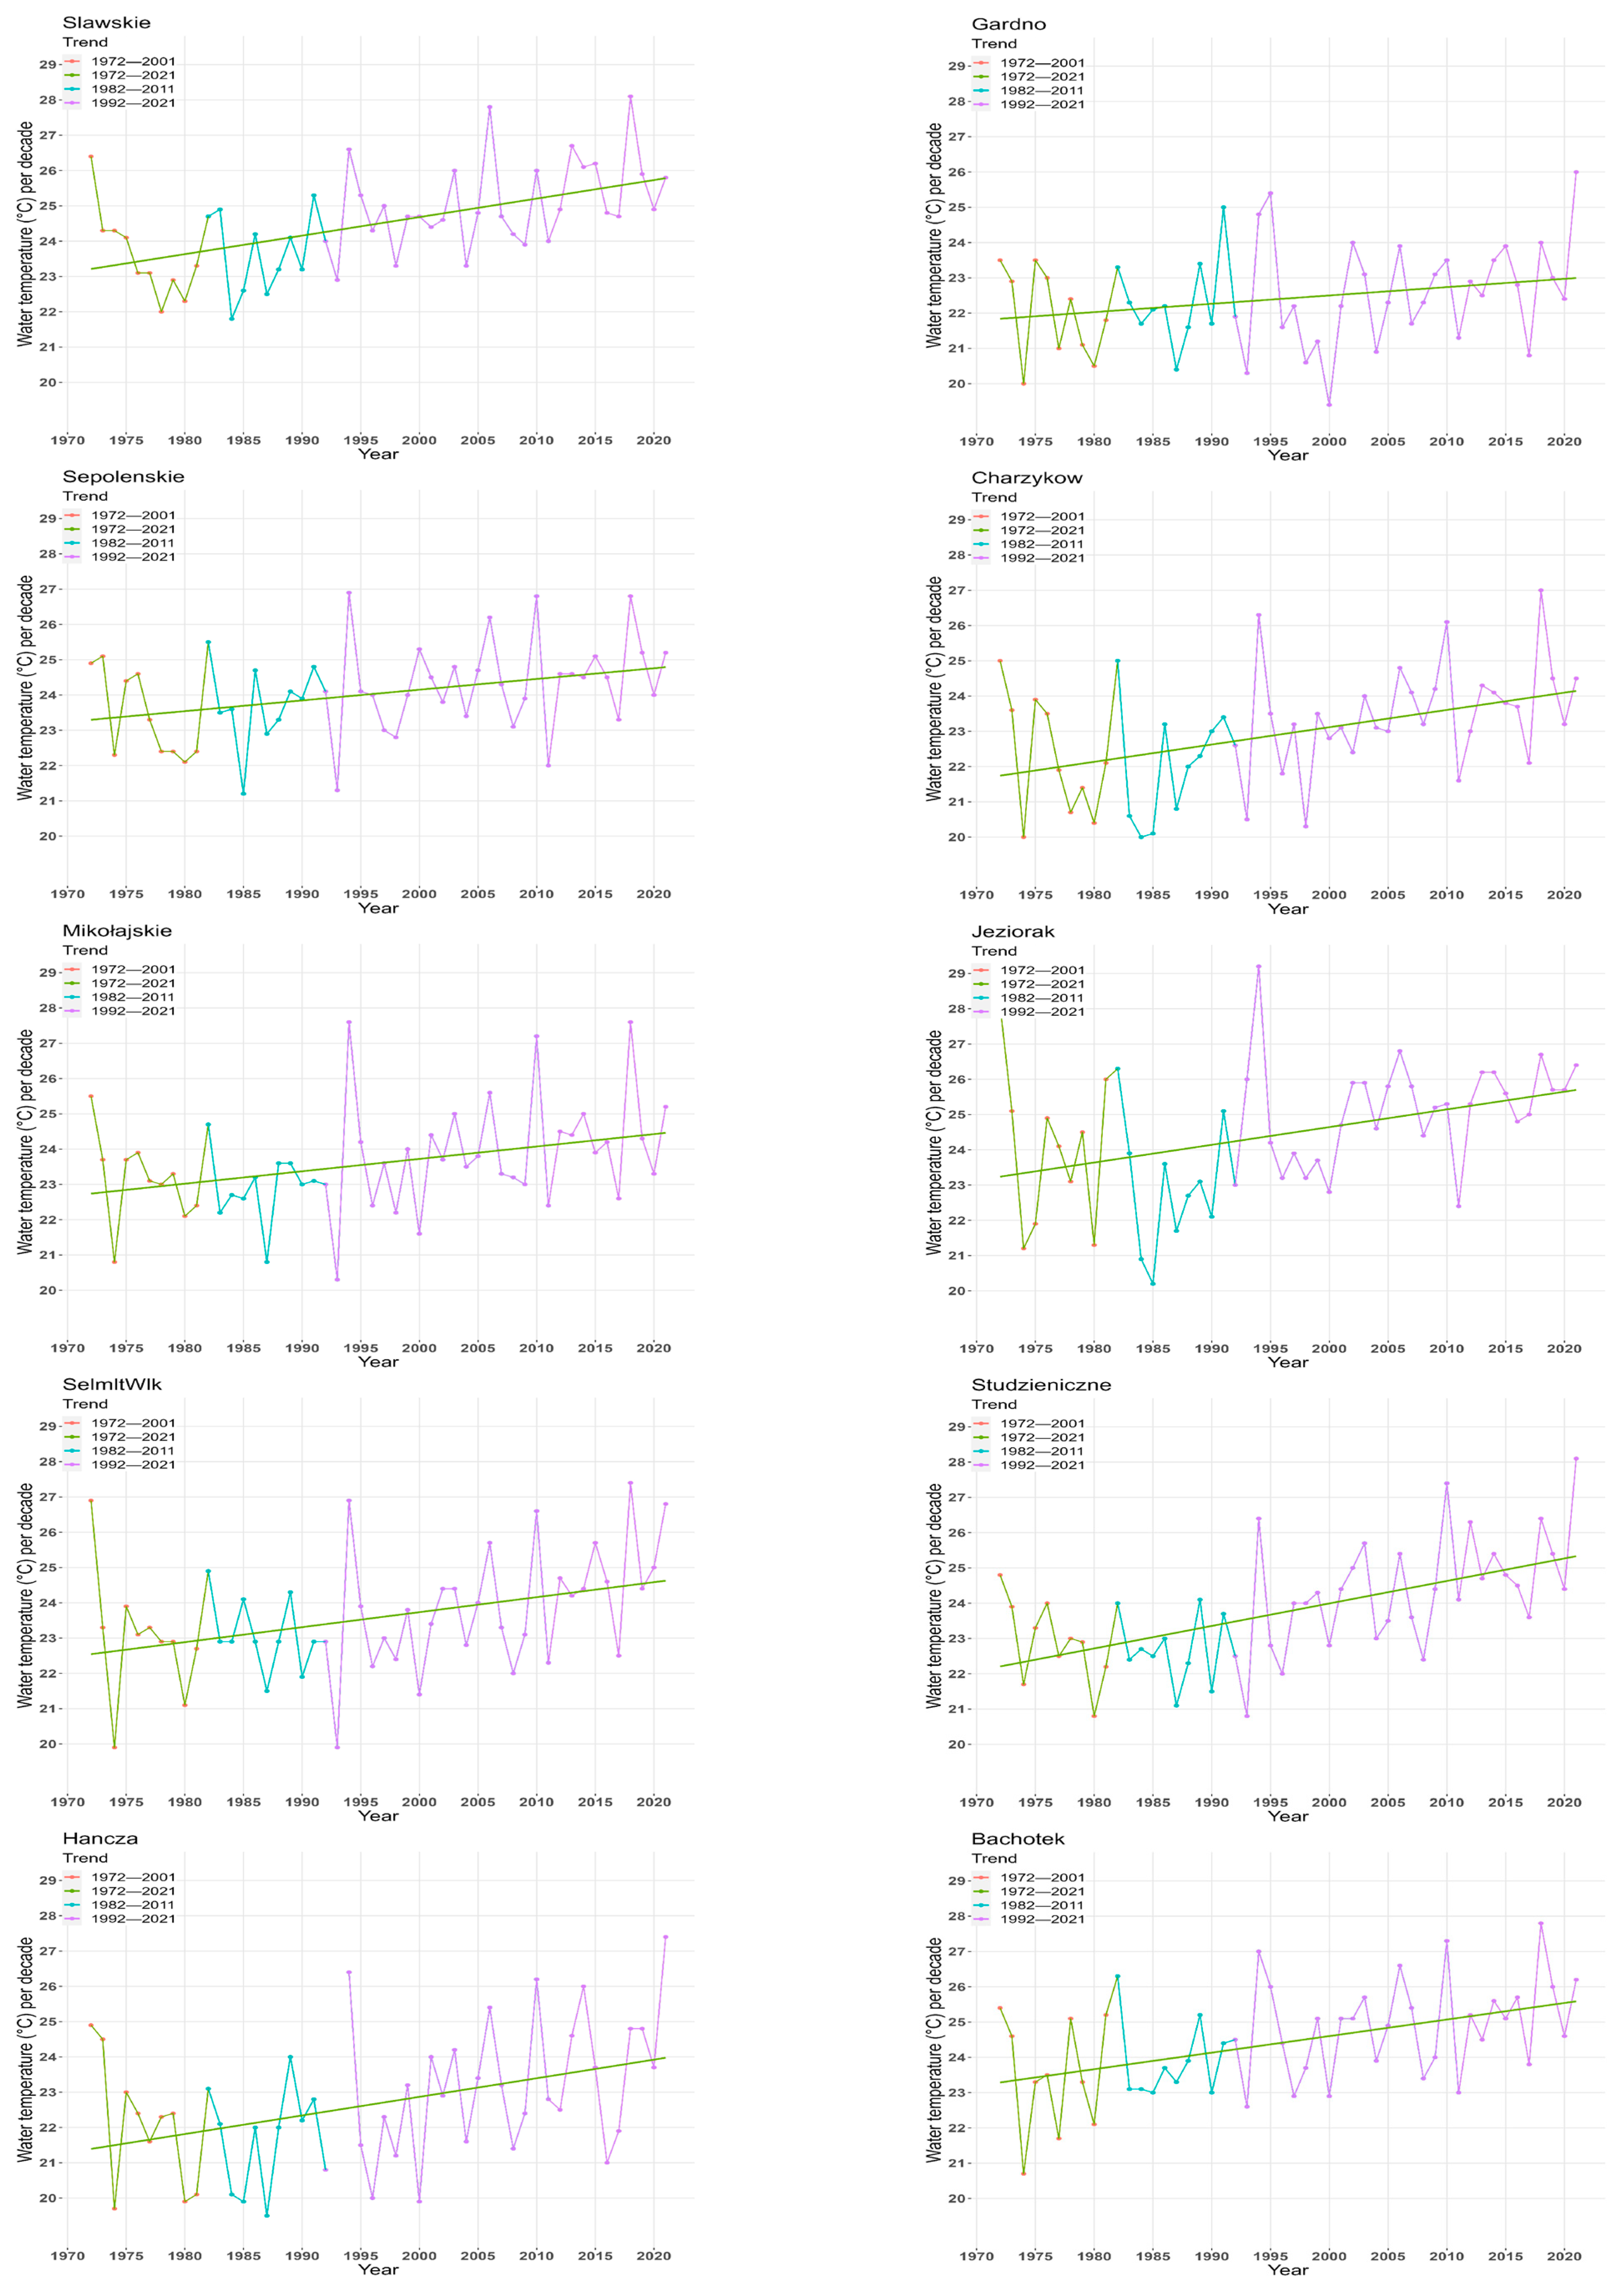
Similarly, the maximum yearly temperature trend analysis findings are presented in Figure 5. All lakes demonstrate a highly significant increase in temperature trends at a 5% significance level for the period from 1972 to 2021. However, only Lake Sławskie exhibits a significant increase in temperature trends from 1972 to 2001 and an increasing trend from 1982 to 2011. Lakes Studzieniczne and Hańcza show increasing trends in 1982–2011 and 1992–2021. In addition, Lakes Charzykowskie, Mikołajskie, and Bachotek also display significantly increasing trends from 1982 to 2011, while Jeziorak and Selmęt Wielki show significantly increasing trends from 1992 to 2021.
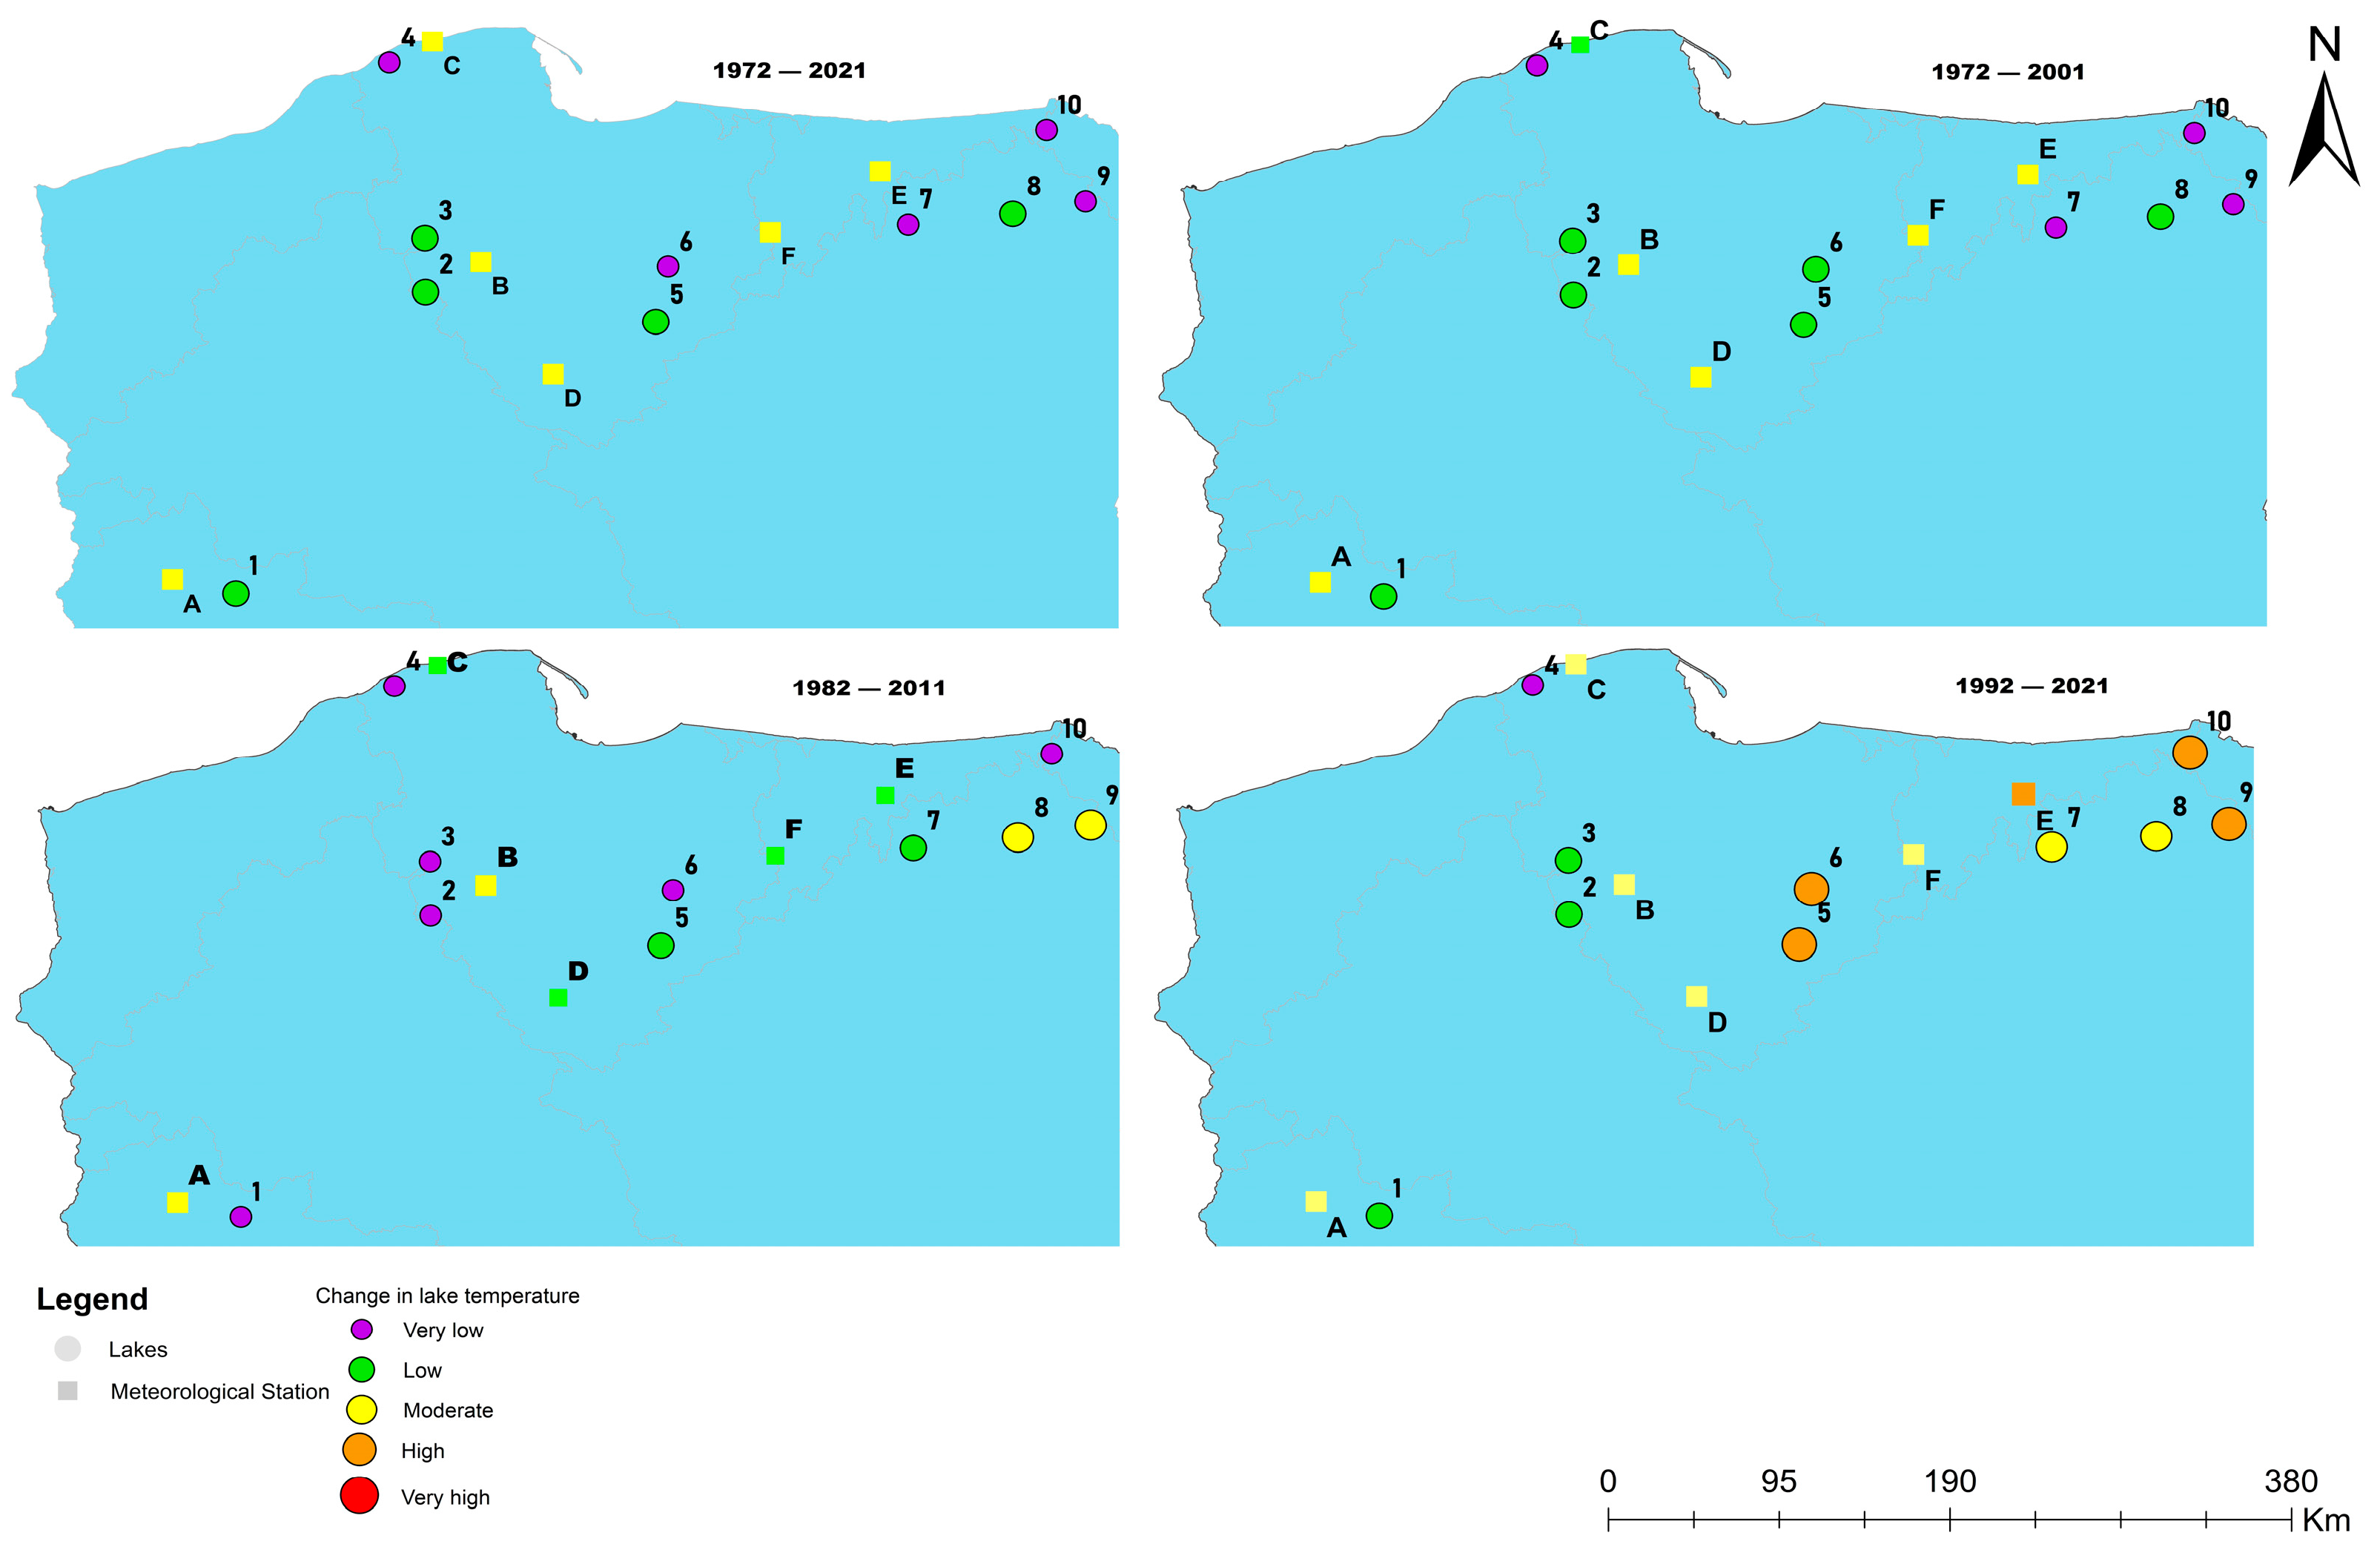
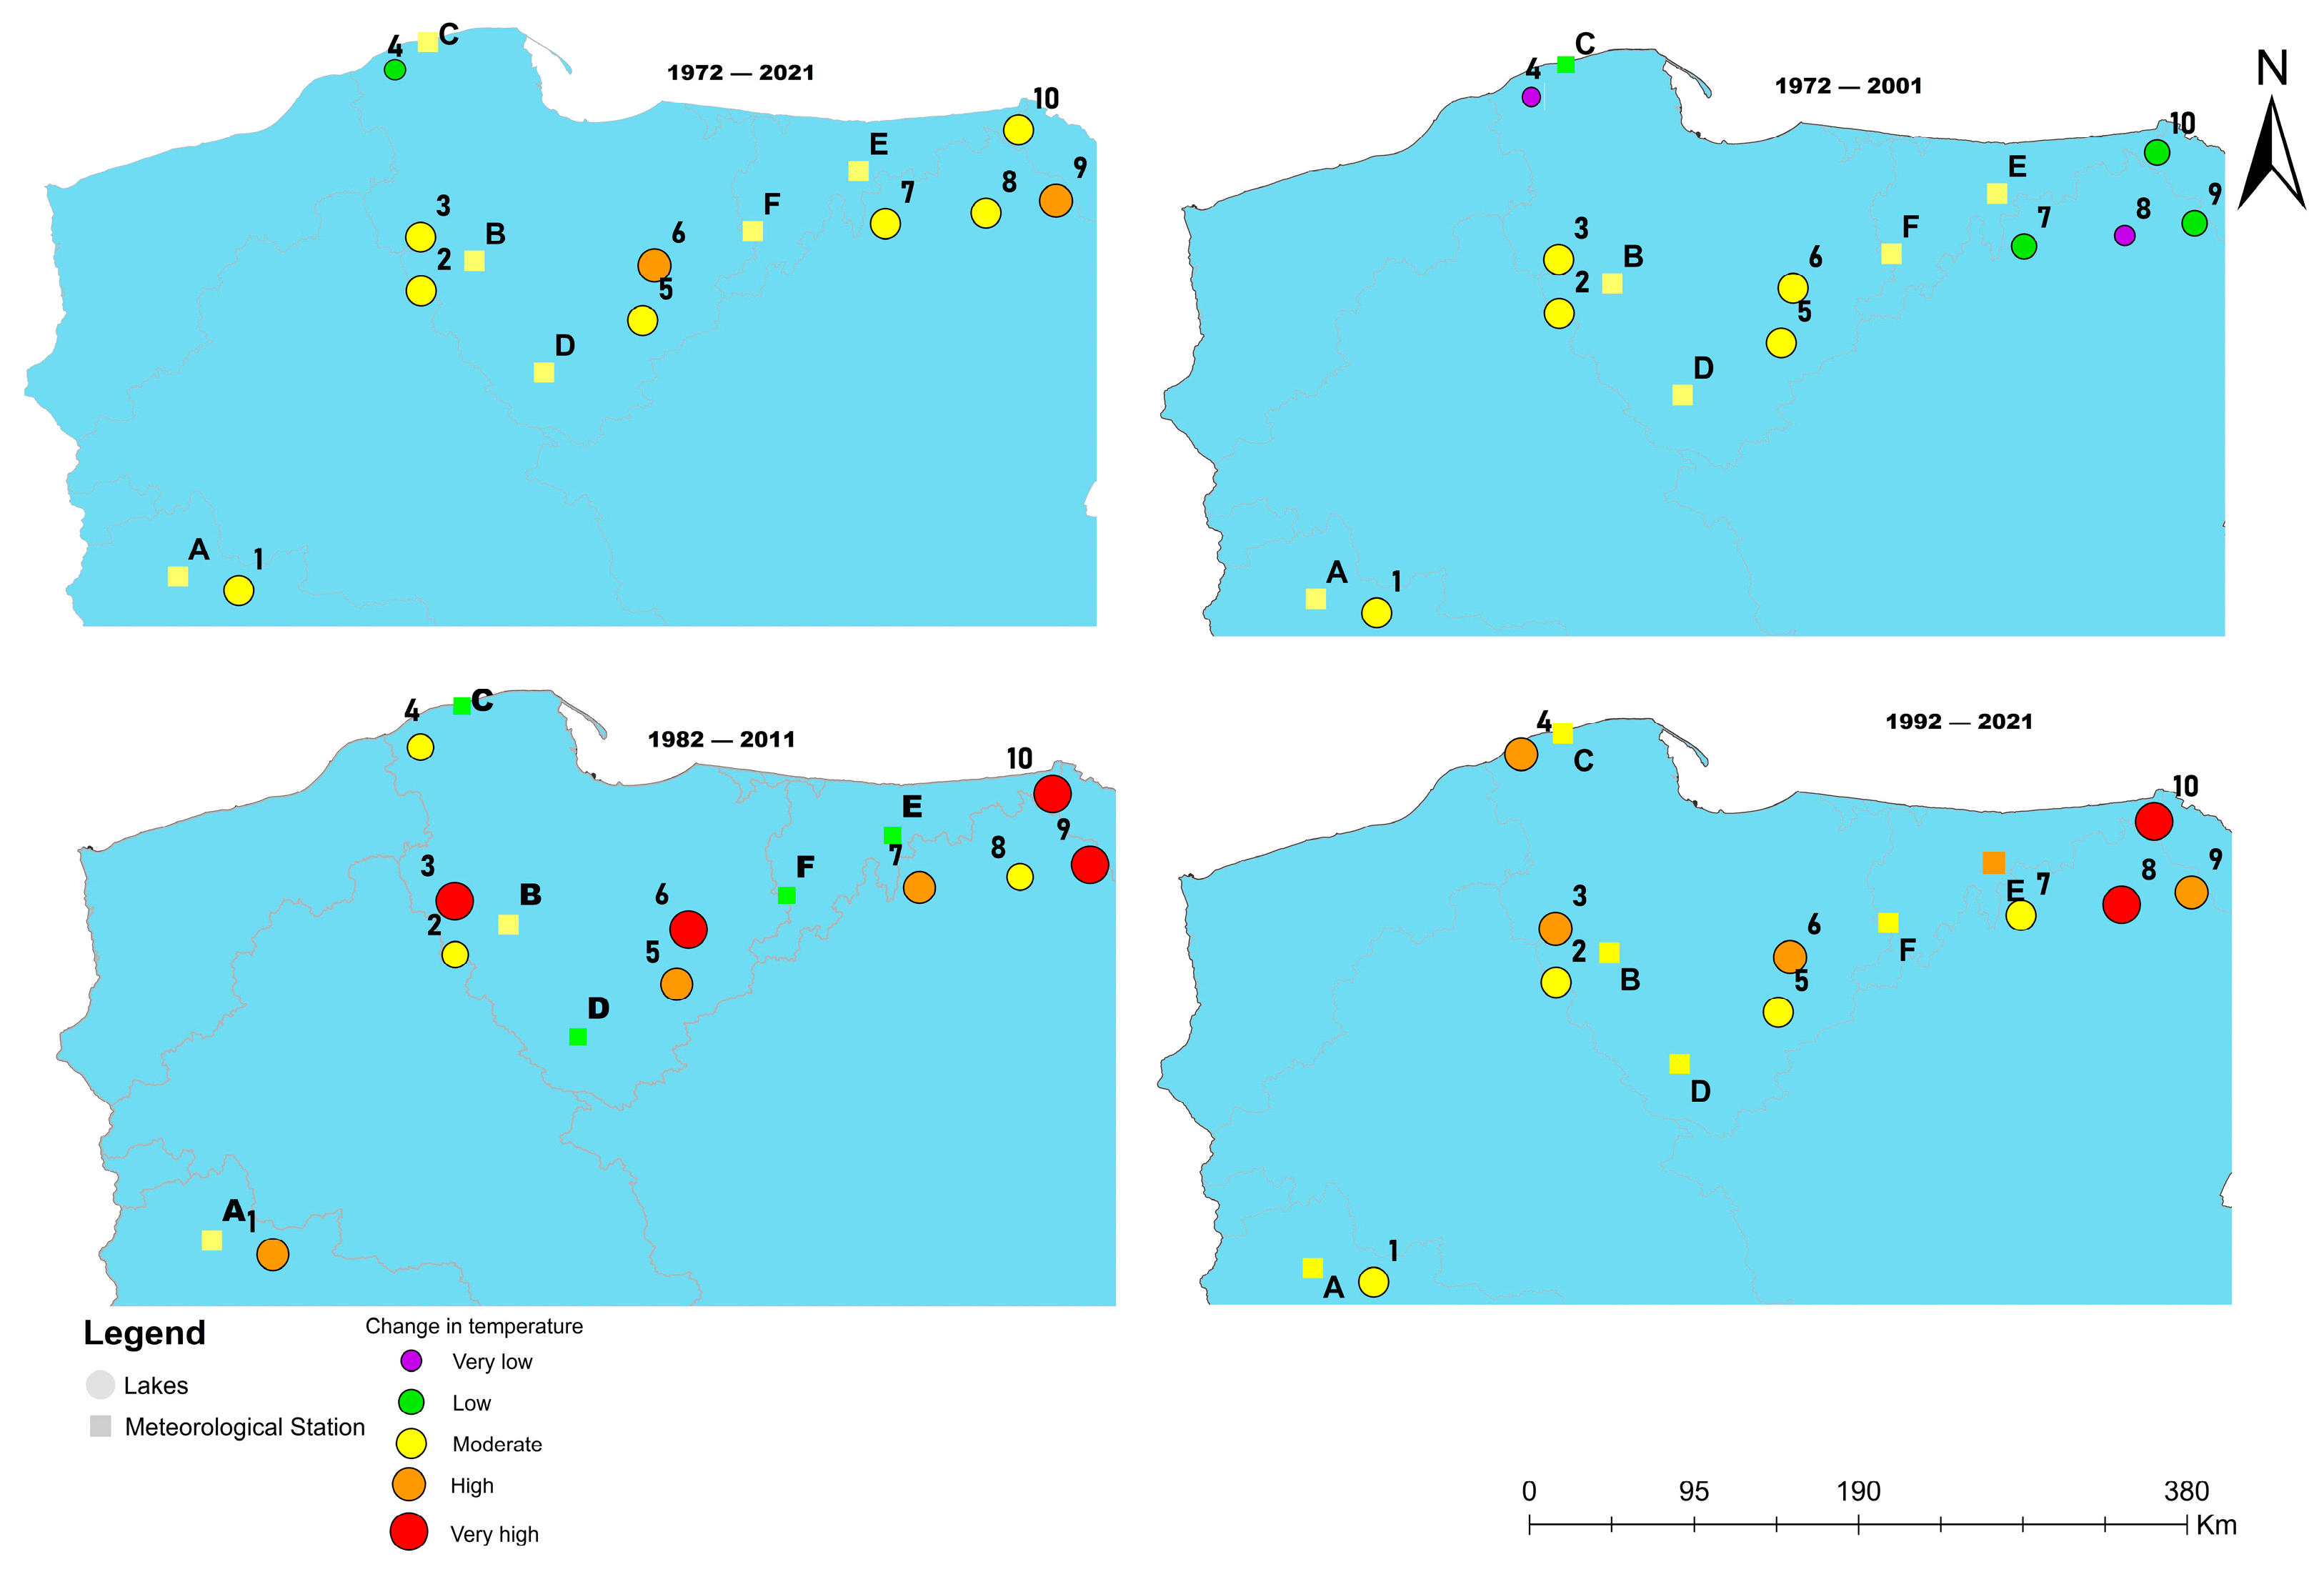
The annual change in lake surface temperature was observed based on the magnitude of the Sen slope. The changes were classified into five levels: very low, low, moderate, high, and very high (Table 3). The results of the annual changes in lake minimum and maximum temperature are presented in Figure 6 and Figure 7, respectively, while Table 4 shows the detailed location of the lakes and meteorological stations. During the first period (1972–2001), most lakes exhibited a low-magnitude change in minimum water temperature. In the second period (1982–2011), most lakes showed very low-magnitude changes, with lakes 8 and 9 displaying moderate changes. In the third period (1992–2021), diverse changes were observed, with high magnitudes in lakes 5, 6, 9, and 10, moderate changes in lakes 7 and 8, low-magnitude changes in lakes 1, 2, and 3, and very low-magnitude changes in lake 4. Meanwhile, from 1972 to 2021, the observed lakes experienced mostly low- and very low-magnitude temperature changes.
The analysis of the three trend periods (1972–2001, 1982–2011, and 1992–2021) reveals diverse changes in the maximum temperature magnitude across different lakes. For the first trend period, the lakes exhibited a range of changes, with some lakes experiencing moderate changes (lakes 1, 2, 3, 5, and 6), others showing low-magnitude changes (lakes 7, 9, and 10), and the remaining lakes displaying very low-magnitude changes (lakes 4 and 8). In the second trend period, the lakes demonstrated varied magnitudes of changes. Some lakes displayed very high-magnitude changes (lakes 3, 6, and 10), high changes (lake 9), and moderate changes (lakes 1, 2, 5, and 7), while others exhibited low-magnitude changes (lakes 4 and 8). Similar patterns were observed in the third trend period. Lakes 8 and 10 experienced very high-magnitude changes, lakes 3, 4, 6, and 9 displayed high-magnitude changes, lakes 1 and 5 showed moderate changes, and lake 2 exhibited low-magnitude changes. Most of the lakes experienced moderate changes in maximum temperature across all trend periods, except for lakes 6 and 9, which showed high-magnitude changes, and lakes 4 and 2, which showed low-magnitude changes. Lakes 1 and 5 demonstrated relatively consistent magnitude changes throughout the periods, while the others displayed variations.
Similarly, the changes in air temperature for the meteorological stations were analyzed.
The results of the trend analysis for annual air temperatures are presented in Table S3 in the Supplementary Materials. The results show that over the entire considered period from 1972 to 2021, annual average temperatures increased in the range of 0.39 to 0.42 °C per decade, with a mean value of 0.41 °C per decade. The changes in average annual air temperatures were statistically significant at a significance level of 0.05. In contrast, when considering individual 30-year periods, the largest increase in average annual air temperatures occurred in the 1992–2021 period at an average of 0.55 °C per decade, while the smallest occurred in the 1982–2011 period at an average of 0.28 °C per decade. The changes in average annual temperatures that were statistically significant at each of the weather stations were seen in the 1992–2021 period, while in the other periods, the changes were only statistically significant at station A (Zielona Góra). The results obtained for air temperatures correspond with the response related to extreme water temperatures, where the strongest changes are observed over the last 30-year period.
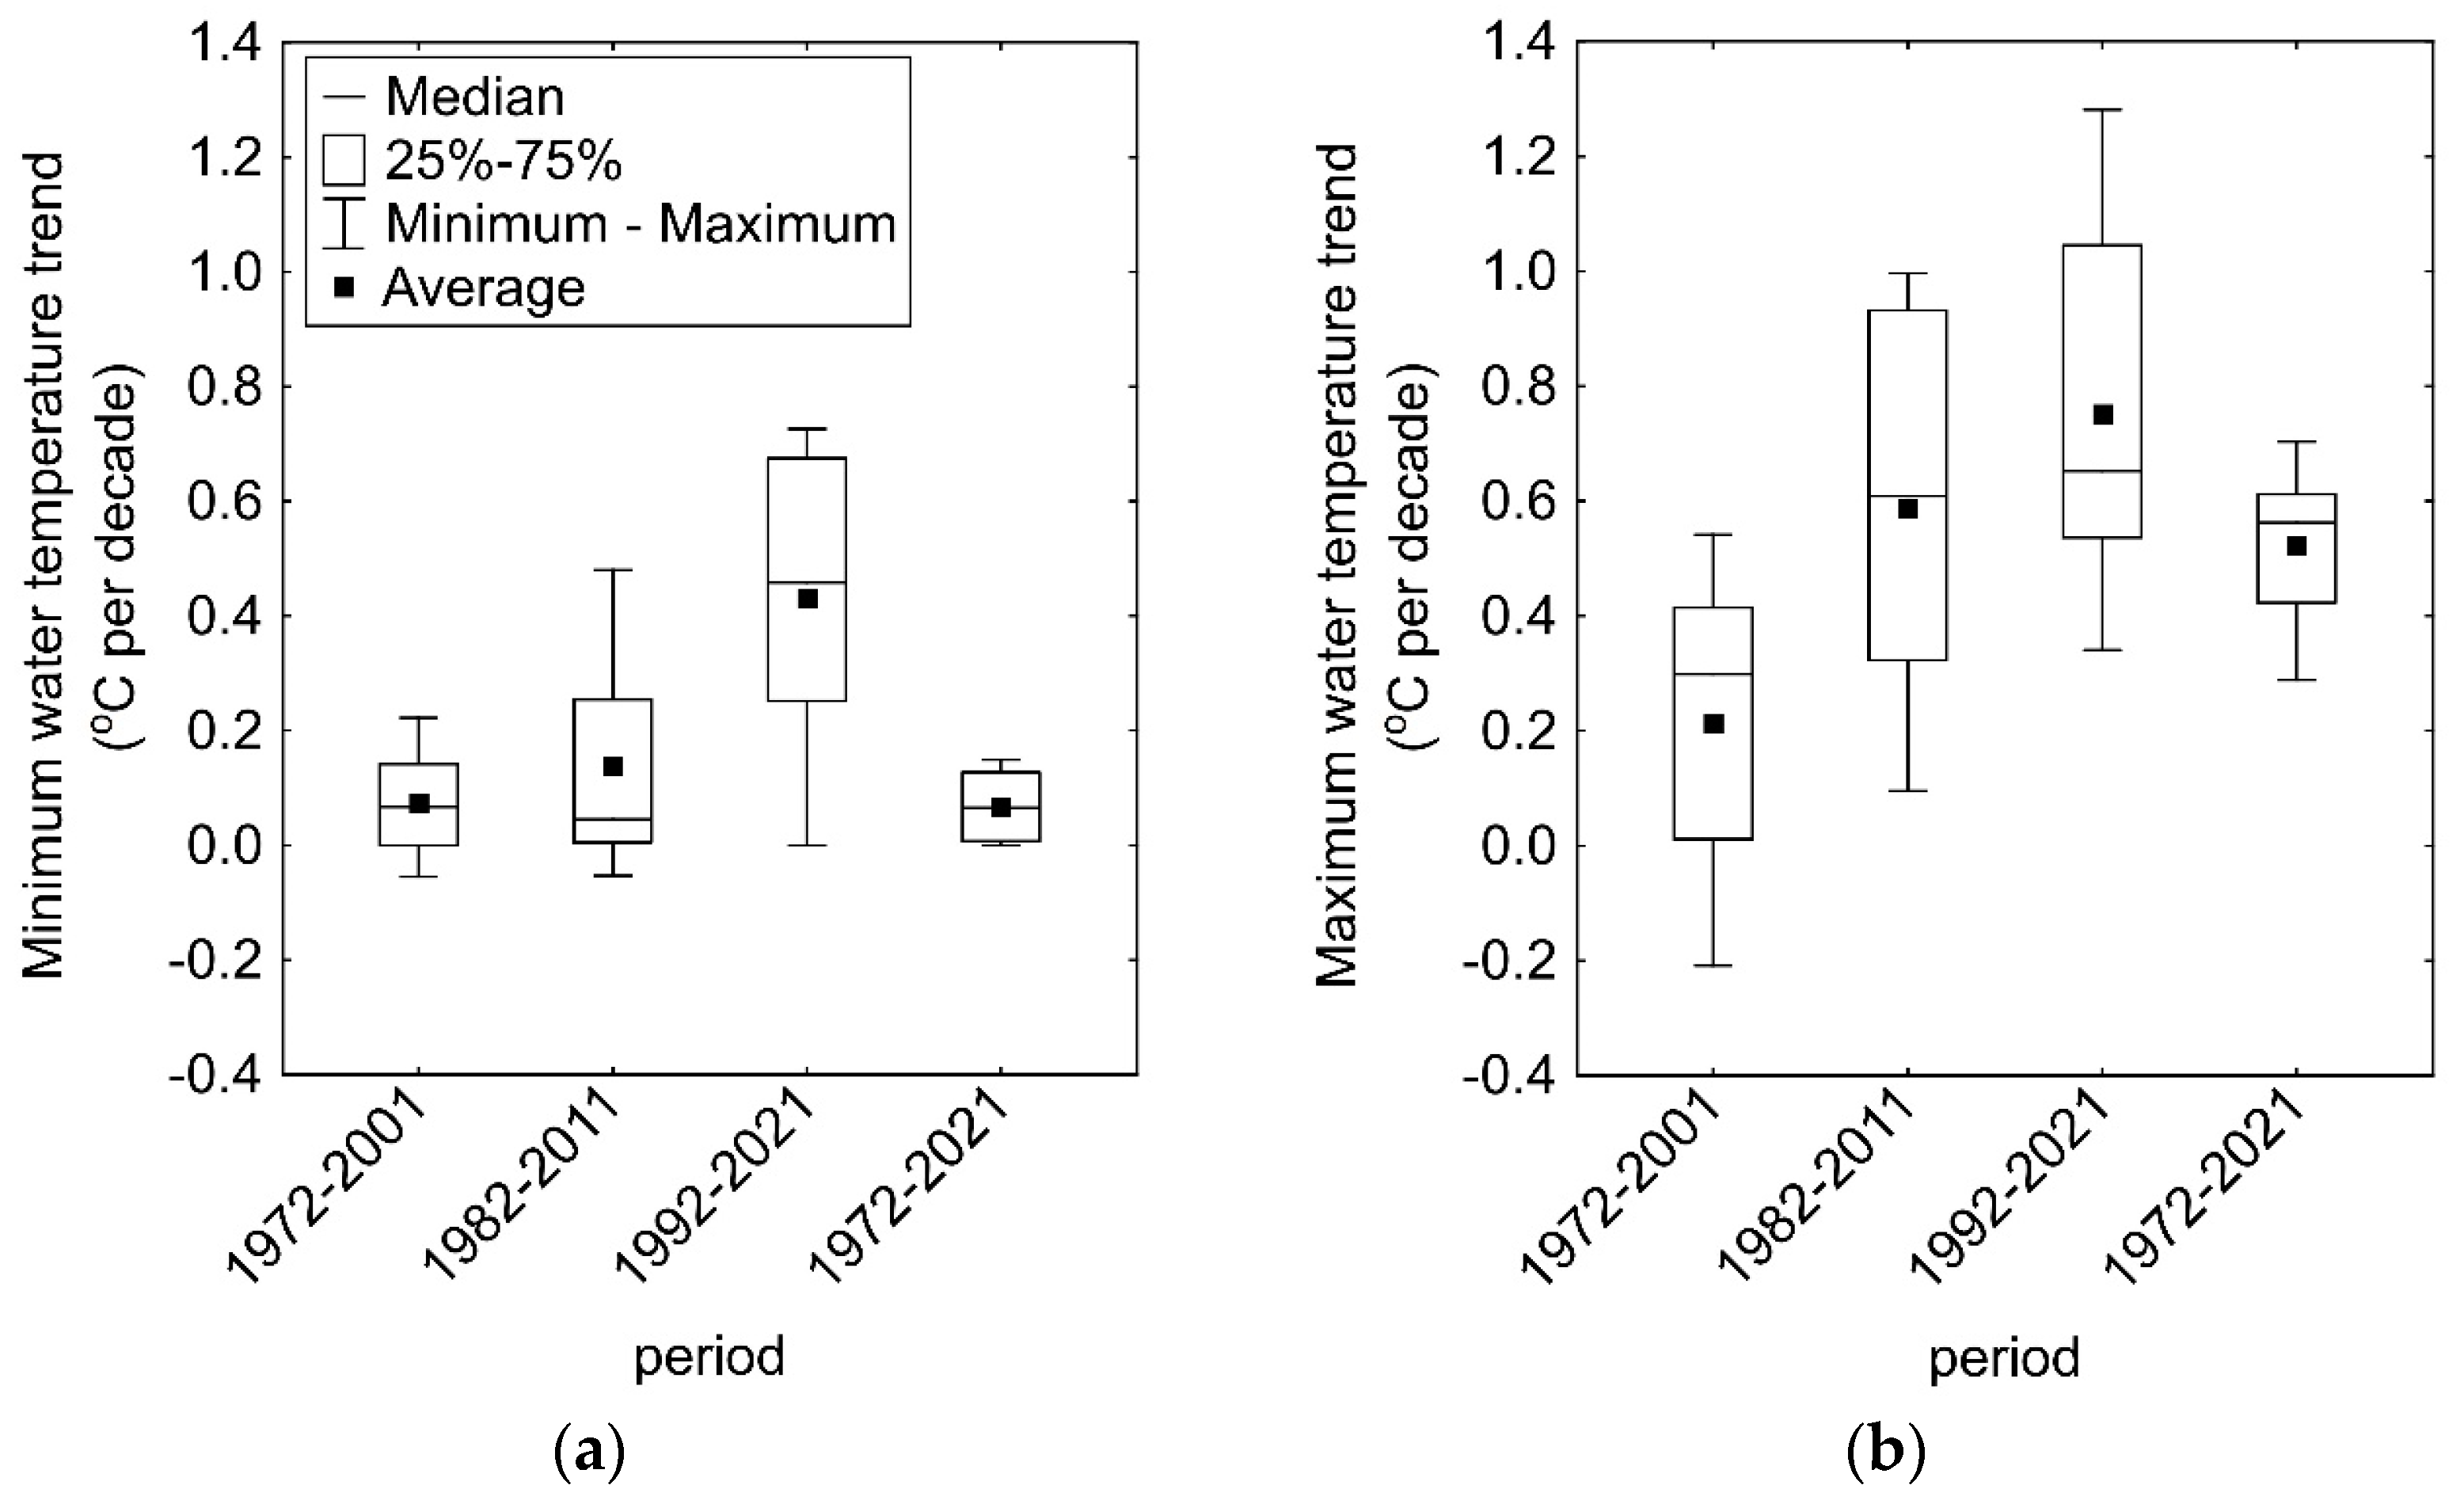
The significance of the differences in Sen slope values between the analyzed periods was determined to summarize the results. The analysis of the differences in Sen slope values for minimum and maximum temperatures is shown in Table 5 and Figure 8. The t-test and sign-test results are presented with the background of average and median values, respectively. The largest changes in mean and median values occurred in the period from 1992 to 2021, regarding minimum temperatures. Although mean and median values are the highest for maximum lake water temperatures in 1992–2021, the differences are not statistically significant compared to 1982–2011. The difference analysis results for months are shown in Tables S1 and S2 in the Supplementary Materials. The biggest changes occurred in 1992–2021 regarding maximum temperatures, while the changes were not as evident regarding minimum temperatures.

4. Discussion

The findings regarding the minimum and maximum changes in LSWT (MinLSWT and MaxLSWT), indicate that different months exhibited varying temperature increases and variability levels within each period. A similar result has been observed in Poland and in other parts of central Europe [29,30,38,39,40,41,42,43]. The months with the highest variability suggest periods when temperature fluctuations were more pronounced and vice versa, which could be attributed to various factors. The low variability can be associated with the relationship between the LSWT and air temperature; the average temperature of less than or equal to 0 °C per decade recorded across all periods indicates a limited exchange of heat between water and ice, thus making the lake water more isolated from atmospheric factors such as air temperature [44]. The North Atlantic Oscillation (NAO) is another significant factor that could cause variations in LSWT in Poland [45]. The location of the analyzed lakes, ranging from the northwestern region, with a warmer marine climate, to the northeastern part, which is characterized by a continental climate, further accentuates the role of the NAO. During the positive phase of the NAO, milder and wetter conditions prevail, leading to increased solar radiation and higher air temperatures that contribute to the elevated maximum water temperatures observed in the lakes, particularly in April, as warmer air masses are advected from the Atlantic; a similar result has been observed by the authors of [46]. Conversely, the positive phase also brings colder and stormier conditions, influencing the lower minimum water temperatures in February. During this period, the advection of colder air masses from northern latitudes decreases the surface water temperatures.
The observed variation in LSWT across all the periods under study can be attributed to a combination of seasonal cycles and the morphometric characteristics of the lakes [1]. In Poland, which is characterized by cold winters, transitional springs, warm summers, and mild autumns, most lakes exhibit a stratified nature with varying depths from shallow to deep (see Table 1). These factors play a significant role in shaping the patterns of LSWT variation [47]. These findings reveal a clear association between temperature increases and specific months, such as April, May, and June, aligning with the expected seasonal variations and agreeing with the findings reported in [43]. This trend is particularly evident in stratified lakes, where the limited depth allows for more efficient heating of the surface water layer during the transition from spring to summer; this finding is consistent with the observations made by the authors of [48] regarding the impacts of climate change on lake thermal dynamics and ecosystem vulnerabilities.
Consequently, these lakes exhibit more pronounced temperature increases across all studied periods in May. The relatively shallow depth (7/10 of the studied lakes) enables rapid warming, as the combined effects of solar radiation and air temperature have a more significant impact. Conversely, deeper stratified lakes (3/10 of the studied lakes) will display more moderate temperature changes during these months. The larger volume of colder water in the deeper layers acts as a thermal buffer, mitigating the rapid heating observed in shallow lakes [49]. Thus, the temperature increase in these lakes is more gradual. The interplay between lake depth and mixing dynamics shapes the extent of temperature changes in stratified lakes, reflecting the unique thermal characteristics of each lake [50].
The significance of seasonal cycles and the roles of lake depth and mixing processes are further highlighted by the variability in temperature seen across different months throughout all the periods studied. Months with higher temperature increases, such as May, July, and October, exhibit more significant variability. This variability can be attributed to the changing weather patterns and seasonal transitions [51]. In stratified lakes, these months may experience increased mixing due to wind-induced currents or convective processes, leading to notable fluctuations in surface water temperatures. Conversely, January and February, representing the winter season, consistently demonstrate lower temperatures and less variability. The deeper layers of stratified lakes act as a thermal buffer, providing insulation against the cold winter conditions. According to the authors of [52], this buffering effect contributes to more stable surface water temperatures during winter, as the larger water volume minimizes the impact of external temperature changes.
Additionally, the findings of this study provide compelling evidence of an increase in lake surface water temperatures. Among the studied lakes, five lakes (Charzykowskie, Bachotek, Selmęt Wielki, Hańcza, and Studzieniczne) exhibited a prolonged period of warming; Lake Sławskie demonstrated a notable warming trend, while Lakes Jeziorak and Selmęt Wielki exhibited ongoing warming. These temperature changes significantly affect lakes with stratified, deep, and shallow characteristics [34]. The observed temperature increases in deep lakes such as Charzykowskie and Hańcza can have complex implications due to their greater water column depth, as these lakes allow for vertical mixing and temperature gradients. Temperature changes in these lakes may impact not only the epilimnion (upper layer) but also the thermocline (middle layer) and hypolimnion (bottom layer). Such changes in thermal stratification can influence the availability of suitable habitats for different species within the water column [53].
Disruptions in the stability of the thermocline caused by temperature changes can also affect the vertical distribution of species and the availability of suitable conditions for plankton, fish, and other organisms at different depths [54]. Conversely, the temperature increases observed in shallow lakes such as Sławskie, Bachotek, and Selmęt Wielki can intensify thermal stratification due to their limited depth. Shallow lakes are more susceptible to rapid temperature fluctuations and changes in the epilimnion, which can lead to prolonged periods of warm surface water. These changes in thermal stratification can impact the distribution and behavior of species adapted to specific temperature ranges, potentially favoring warm-water species and altering the composition of the epilimnion community [28,55]. Rising winter lake temperatures have been linked to the disappearance of Arctic charr from Lake Vättern, highlighting the vulnerability of cold-water species to temperature changes [56].
The increase in surface water temperatures also has implications for harmful algal blooms (HABs) in deep and shallow lakes [57]. Warmer temperatures can promote the growth and proliferation of the algae species responsible for HABs [58]. The thermal structure of the lakes can influence the effects of temperature on HABs. In shallow lakes such as Sławskie and Bachotek, rapid temperature fluctuations and changes in the epilimnion make them particularly vulnerable to HABs. In deep lakes such as Charzykowskie and Hańcza, an increase in temperature can impact the vertical distribution of algae species, altering the composition and dynamics of HABs within the water column; this is in tandem with the findings of an earlier study [59] that water temperature is one of the most important factors influencing the growth probability of HABs in the aquatic ecosystem.
Furthermore, temperature changes can impact both deep and shallow lakes’ evaporation, water resources, and hydrological processes. In the case of the observed lakes, a prolonged increase in LSWT can accelerate the evaporation rate, leading to reduced water levels and potentially exacerbating water scarcity issues; this affirms the findings by the authors of [60], whose study established that due to increases in water temperature, the water level in lakes would decrease, mainly in response to the greater evaporation caused by the higher temperature of surface waters. Additionally, the concentration of pollutants and nutrients can increase due to reduced water volume, contributing to eutrophication and water-quality problems [26].
Increased LSWT might also have impacted the lakes’ water circulation and mixing processes. In stratified lakes, temperature differences between the layers drive vertical mixing, which is crucial for nutrient transport, the oxygenation of deeper waters, and the overall stability of the ecosystem [48,61]. What these observations echo is that in the observed lakes, changes in thermal stratification due to the increasing trend of LSWT could have affected the strength and frequency of vertical mixing and, thus, potentially disrupt these vital mixing processes. This disruption could have cascading effects on nutrient availability, oxygen levels, and the distribution and abundance of organisms throughout the water column; this upholds the position held in [62] that changes in thermal stratification can also impact the physical and chemical properties of the water column, including dissolved oxygen concentrations, nutrient availability, and pH value; changes in these properties can have significant implications for the health and functioning of aquatic ecosystems. As mentioned earlier, the specific temperature trends observed in each lake during the different periods could contribute to the variations in water circulation and mixing dynamics within each lake.
The impact of increasing temperature trends on lakes extends to the formation and duration of ice, which plays a crucial role in their ecological dynamics. The relationship between ice cover and the thermal regime of lakes, as emphasized by the author of [63], highlights the consequences of shortened ice cover duration on lake characteristics. The observed long-term increase in surface water temperatures in the studied lakes may intensify these changes, leading to delayed ice formation and reduced ice cover duration. Such alterations disrupt many essential processes, including light penetration, gas exchange, and nutrient cycling, thereby influencing the winter ecology of the lakes. The interconnectedness of temperature, ice cover, and ecological processes underscores the importance of understanding and monitoring these trends to assess the lake ecosystems’ overall health and functioning during winter.
Furthermore, the results of this study have important implications in the context of climate change and its potential effects on lake ecosystems. The observed temperature changes in air and water temperatures across the trend periods provide valuable insights into the ongoing climate dynamics and their impacts on lakes (Figure 6 and Figure 7). During the first trend period (1972–2001), this study shows a high magnitude of changes in air temperature, indicating a warming trend that is consistent with global climate change patterns [27,44,64,65,66]. However, the limited magnitude of changes in minimum LSWT during this period suggests that the higher AT restricted the cooling of lake waters; this has implications for the thermal stratification of the lakes and can disrupt the natural thermal profiles on which many organisms in the ecosystem rely [1,65].
In the second trend period (1982–2011), this study observed moderate AT, associated with minimal fluctuations in minimum LSWT, as most lakes demonstrated relatively low and low magnitudes of change that indicate a possible decoupling between air and water temperature dynamics. However, diverse magnitudes of change in maximum LSWT (for instance, Lakes 3, 6, and 9 consistently experienced high magnitudes of change) imply the influence of other factors on the thermal dynamics of lakes. These findings suggest that air temperature changes do not solely determine the impacts of climate change on the lake’s ecosystems but are also influenced by additional factors, such as lake-specific characteristics and local conditions; this is in tandem with the findings reported in [26] that the presence of ice cover in lakes is an essential factor for the functioning of lake ecosystems, which suggests that factors other than the air temperature, such as ice cover, can influence the impacts of climate change on lakes.
The third trend period (1992–2021) reveals a more diverse magnitude of change in both MinLSWT and MaxLSWT, reflecting the varying fluctuations in AT changes. The observed very high and high magnitudes of change in MaxLSWT in several lakes (in 8 and 10, and in 3, 4, 6, and 9, respectively) indicate an increasing trend in maximum lake surface temperatures, which can have significant ecological consequences. Higher temperatures can alter nutrient cycling, impact primary productivity, and influence the distribution and behavior of aquatic organisms [67].
Across all four trend periods (1972–2021), the observed magnitude of LSWT and AT changes in lakes and meteorological stations underscore the importance of considering climate change in the context of lake ecosystems. Rising air temperatures can profoundly affect water temperature dynamics, leading to shifts in ecological processes and potentially disrupting the delicate balance.

5. Conclusions

The study analyzes minimum and maximum lake surface temperatures over time in Poland, aiming to understand the changes in temperature extremes and their relationship to climate change. The analysis revealed notable trends and variations in the minimum and maximum lake surface temperatures across different periods. The results indicated that May consistently exhibited the highest increases in minimum temperature, while April exhibited the highest increases in maximum temperature. These findings align with the expected seasonal variations and highlight the influence of air temperature and climatic conditions on lake surface temperatures. The variability in temperature changes also varied across different months and lakes, emphasizing the complex nature of lake thermal dynamics. Factors such as the North Atlantic Oscillation (NAO), the morphometric characteristics of the lakes, and seasonal cycles played significant roles in shaping the observed temperature variations. Lakes in warmer marine climates showed different patterns than those in regions that are characterized by a continental climate.
Furthermore, the trend analysis using Mann–Kendall’s Z-test revealed significantly increasing trends in the minimum and maximum temperatures recorded for several lakes over specific periods. However, no significant increase was observed between 1982 and 2011. These findings highlight the temporal variability in temperature trends and underscore the importance of considering long-term data to comprehensively understand the impact of climate change on lakes. Similarly, the analysis of annual changes in lake surface water temperature categorized the magnitude of temperature shifts into different levels. Most lakes exhibited low to moderate changes in both the minimum and maximum temperatures across the studied periods. However, some lakes showed higher-magnitude changes, indicating variations in thermal responses and vulnerabilities to climate change.
The study enhances our knowledge of the vulnerabilities and resilience of Poland’s lakes to climate change. The insights gained from analyzing the temperature trends, variations, and magnitudes of changes in minimum and maximum lake surface temperatures can inform evidence-based decision-making and aid in developing tailored conservation strategies. By understanding the thermal dynamics of lakes, policymakers and stakeholders can implement effective adaptive measures (such as thermal stratification disruption and metastasis of water with different thermal characteristics) to ensure the long-term sustainability and preservation of Poland’s valuable freshwater resources. Additionally, considering the potential impacts of climate change on other ecological aspects of lakes, such as water quality, aquatic biodiversity, and ecosystem functioning, would provide a more holistic understanding of the consequences of climate change on these vital ecosystems.

Supplementary Materials

The following supporting information can be downloaded at: https://www.mdpi.com/article/10.3390/resources12090107/s1, Table S1. Average and median Sen slope value of minimum lake water temperature for all analyzed lakes; Table S2. Average and median Sen slope value of maximum lake water temperature for all analyzed lakes; Table S3. Mann–Kendall and Sen slope analysis of mean yearly air temperature (°C per decade).

Author Contributions

Conceptualization, M.S. and T.O.; methodology, M.S. and T.O.; software, M.S. and T.O.; validation, M.S. and M.P.; formal analysis, T.O.; investigation, T.O.; resources, M.P.; data curation, T.O.; writing—original draft preparation, T.O.; writing—review and editing, M.S. and M.P.; visualization, M.S. and T.O.; supervision, M.S.; project administration, T.O.; funding acquisition, T.O., M.S. and M.P. All authors have read and agreed to the published version of the manuscript.

Funding

This research received no external funding.

Data Availability Statement

Conflicts of Interest

The authors declare no conflict of interest.

References

  1. Adrian, R.; O’Reilly, C.M.; Zagarese, H.; Baines, S.B.; Hessen, D.O.; Keller, W.; Livingstone, D.M.; Sommaruga, R.; Straile, D.; Van Donk, E.; et al. Lakes as sentinels of climate change. Limnol. Oceanogr. 2009, 54, 2283–2297. [Google Scholar] [CrossRef] [PubMed]
  2. George, G. The Impact of Climate Change on European Lakes; Springer: Dordrecht, The Netherlands, 2010; pp. 1–13. [Google Scholar]
  3. Kernan, M.; Battarbee, R.; Moss, B. (Eds.) Changing Climate and Changing Freshwaters: A European Perspective; Wiley-Blackwell: Hoboken, NJ, USA, 2010; 320p. [Google Scholar]
  4. Jeppesen, E.; Meerhoff, M.; Davidson, T.; Trolle, D.; Sondergaar, D.M.; Lauridsen, T.; Beklioğlu, M.; Brucet, S.; Volta, P.; González-Bergonzoni, I.; et al. Climate change impacts on lakes: An integrated ecological perspective based on a multi-faceted approach, with special focus on shallow lakes. J. Limnol. 2014, 73, 844. [Google Scholar] [CrossRef]
  5. Taner, M.Ü.; Carleton, J.N.; Wellman, M. Integrated model projections of climate change impacts on a North American lake. Ecol. Model. 2011, 222, 3380–3393. [Google Scholar] [CrossRef]
  6. Mooij, W.M.; De Senerpont Domis, L.N.; Janse, J.H. Linking species- and ecosystem-level impacts of climate change in lakes with a complex and a minimal model. Ecol. Model. 2009, 220, 3011–3020. [Google Scholar] [CrossRef]
  7. Blenckner, T.; Omstedt, A.; Rummukainen, M. A Swedish case study of contemporary and possible future consequences of climate change on lake function. Aquat. Sci. Res. Boundaries 2002, 64, 171–184. [Google Scholar] [CrossRef]
  8. Jeppesen, E.; Meerhoff, M.; Jacobsen Ba Hansen, R.S.; Søndergaard, M.; Jensen, J.P.; Lauridsen, T.L.; Mazzeo, N.; Branco, C.W.C. Restoration of shallow lakes by nutrient control and biomanipulation—The successful strategy varies with lake size and climate. Hydrobiologia 2007, 581, 269–285. [Google Scholar] [CrossRef]
  9. Rahel, F.J.; Olden, J.D. Assessing the effects of climate change on aquatic invasive species. Conserv. Biol. J. Soc. Conserv. Biol. 2008, 22, 521–533. [Google Scholar] [CrossRef]
  10. Mooij, W.M.; Hülsmann, S.; De Senerpont Domis, L.N.; Nolet, B.A.; Bodelier, P.L.E.; Boers, P.C.M.; Pires, L.M.D.; Gons, H.J.; Ibelings, B.W.; Noordhuis, R.; et al. The impact of climate change on lakes in the Netherlands: A review. Aquat. Ecol. 2005, 39, 381–400. [Google Scholar] [CrossRef]
  11. Verburg, P.; Hecky, R.E.; Kling, H. Ecological consequences of a century of warming in Lake Tanganyika. Science 2003, 301, 505–507. [Google Scholar] [CrossRef]
  12. Chen, Y.; Qin, B.; Teubner, K.; Dokulil, M. Long-term dynamics of phytoplankton assemblages: Microcystis-domination in Lake Taihu, a large shallow lake in China. J. Plankton Res. 2003, 25, 445–453. [Google Scholar] [CrossRef]
  13. Winder, M.; Schindler, D.E.; Essington, T.E.; Litt, A.H.; Edmondson, W.T. Disrupted seasonal clockwork in the population dynamics of a freshwater copepod by climate warming. Limnol. Oceanogr. 2009, 54, 2493–2505. [Google Scholar] [CrossRef]
  14. Fang, X.; Stefan, H.G. Simulations of climate effects on water temperatures, dissolved oxygen, and ice and snow covers in lakes of the contiguous United States under past and future climate scenarios. Limnol. Oceanogr. 2009, 54, 2359–2370. [Google Scholar] [CrossRef]
  15. Palmer, M.E.; Yan, N.D.; Somers, K.M. Climate change drives coherent trends in physics and oxygen content in North American lakes. Clim. Chang. 2014, 124, 285–299. [Google Scholar] [CrossRef]
  16. Magee, M.R.; Wu, C.H. Effects of changing climate on ice cover in three morphometrically different lakes. Hydrol. Process. 2017, 31, 308–323. [Google Scholar] [CrossRef]
  17. Sharma, S.; Blagrave, K.; Magnuson, J.J.; O’reilly, C.M.; Oliver, S.; Batt, R.D.; Magee, M.R.; Straile, D.; Weyhenmeyer, G.A.; Winslow, L.; et al. Widespread loss of lake ice around the Northern Hemisphere in a warming world. Nat. Clim. Chang. 2019, 9, 227–231. [Google Scholar] [CrossRef]
  18. Schindler, D.W. The cumulative effects of climate warming and other human stresses on Canadian freshwaters in the new millennium. Can. J. Fish. Aquat. Sci. 2001, 58, 18–29. [Google Scholar] [CrossRef]
  19. Lenters, J.D.; Kratz, T.K.; Bowser, C.J. Effects of climate variability on lake evaporation: Results from a long-term energy budget study of Sparkling Lake, northern Wisconsin (USA). J. Hydrol. 2005, 308, 168–195. [Google Scholar] [CrossRef]
  20. Riveros-Iregui, D.A.; Lenters, J.D.; Peake, C.S.; Ong, J.B.; Healey, N.C.; Zlotnik, V.A. Evaporation from a shallow, saline lake in the Nebraska Sandhills: Energy balance drivers of seasonal and interannual variability. J. Hydrol. 2017, 553, 172–187. [Google Scholar] [CrossRef]
  21. Watras, C.J.; Read, J.S.; Holman, K.D.; Liu, Z.; Song, Y.-Y.; Watras, A.J.; Morgan, S.; Stanley, E. Decadal oscillation of lakes and aquifers in the upper Great Lakes region of North America: Hydroclimatic implications. Geophys. Res. Lett. 2014, 41, 456–462. [Google Scholar] [CrossRef]
  22. Notaro, M.; Bennington, V.; Lofgren, B. Dynamical downscaling–based projections of Great Lakes water levels. J. Clim. 2015, 28, 9721–9745. [Google Scholar] [CrossRef]
  23. Pekel, J.F.; Cottam, A.; Gorelick, N.; Belward, A.S. High-resolution mapping of global surface water and its long-term changes. Nature 2016, 540, 418–422. [Google Scholar] [CrossRef]
  24. Rodell, M.; Famiglietti, J.S.; Wiese, D.N.; Reager, J.T.; Beaudoing, H.K.; Landerer, F.W.; Lo, M.H. Emerging trends in global freshwater availability. Nature 2018, 557, 651–659. [Google Scholar] [CrossRef] [PubMed]
  25. Busker, T.; de Roo, A.; Gelati, E.; Schwatke, C.; Adamovic, M.; Bisselink, B.; Cottam, A. A global lake and reservoir volume analysis using a surface water dataset and satellite altimetry. Hydrol. Earth Syst. Sci. 2019, 23, 669–690. [Google Scholar] [CrossRef]
  26. Ptak, M.; Sojka, M.; Nowak, B. Effect of climate warming on a change in thermal and ice conditions in the largest lake in Poland—Lake Śniardwy. J. Hydrol. Hydrodyn. 2020, 68, 260–270. [Google Scholar] [CrossRef]
  27. Ptak, M.; Sojka, M.; Choiński, A.; Nowak, B. Effect of environmental conditions and morphometric parameters on surface water temperature in Polish Lakes. Water 2018, 10, 580. [Google Scholar] [CrossRef]
  28. Choiński, A. Katalog Jezior Polski; Wydawnictwo Naukowe UAM: Poznań, Poland, 2006. [Google Scholar]
  29. Ptak, M.; Olowoyeye, T.; Sojka, M. Trends of Changes in Minimum Lake Water Temperature in Poland. Appl. Sci. 2022, 12, 12601. [Google Scholar] [CrossRef]
  30. Ptak, M.; Wrzesiński, D.; Choiński, A. Long-term changes in the hydrological regime of high mountain lake Morskie Oko (Tatra Mountains, Central Europe). J. Hydrol. Hydromech. 2017, 65, 146–153. [Google Scholar] [CrossRef]
  31. Dokulil, M.T.; de Eyto, E.; Maberly, S.C.; May, L.; Weyhenmeyer, G.A.; Woolway, R.I. Increasing maximum lake surface temperature under climate change. Clim. Chang. 2021, 165, 56. [Google Scholar] [CrossRef]
  32. Stefanidis, S.; Stathis, D. Spatial and Temporal Rainfall Variability over the Mountainous Central Pindus (Greece). Climate 2018, 6, 75. [Google Scholar] [CrossRef]
  33. Myronidis, D.; Ioannou, K.; Fotakis, D.; Dörflinger, G. Streamflow and Hydrological Drought Trend Analysis and Forecasting in Cyprus. Water Resour. Manag. 2018, 32, 1759–1776. [Google Scholar] [CrossRef]
  34. Ptak, M.; Sojka, M. Different reactions to climate change as observed in selected elements of hydrological regime of the deepest lake on the Central European Plain (Lake Hańcza). Hydrol. Sci. J. 2021, 66, 1083–1095. [Google Scholar] [CrossRef]
  35. Yue, S.; Pilon, P.; Phinney, B.; Cavadias, G. The influence of autocorrelation on the ability to detect trend in hydrological series. Hydrol. Process. 2002, 16, 1807–1829. [Google Scholar] [CrossRef]
  36. Gilbert, R.O. Statistical Methods for Environmental Pollution Monitoring; Van Nostrand Reinhold Co.: New York, NY, USA, 1987; p. 320. [Google Scholar]
  37. Patakamuri, S.K.; O’Brien, N. Package “MODIFIEDMK” Title Modified Versions of Mann Kendall and Spearman’s Rho Trend Tests. R Package Version 2021, 1. [Google Scholar]
  38. Pernaravičiute, B. The impact of climate change on thermal regime of Lithuanian lakes. Ekologija 2004, 2, 58–63. [Google Scholar]
  39. Gross-Wittke, A.; Selge, F.; Gunkel, G. Effects of water warming on bank filtration: Experimental enclosure studies. WIT Trans. Ecol. Environ. 2013, 171, 209–224. [Google Scholar]
  40. Nōges, T.; Tuvikene, L.; Nōges, P. Contemporary trends of temperature, nutrient loading, and water quality in large Lakes Peipsi and Vōrtsjärv, Estonia. Aquat. Ecosyst. Health 2010, 13, 143–153. [Google Scholar] [CrossRef]
  41. Schmid, M.; Koster, O. Excess warming of a Central European lake driven by solar brightening. Water Resour. Res. 2016, 52, 8103–8116. [Google Scholar] [CrossRef]
  42. Woolway, R.I.; Meinson, P.; Nõges, P.; Jones, I.D.; Laas, A. Atmospheric stilling leads to prolonged thermal stratification in a large shallow polymictic lake. Clim. Chang. 2017, 141, 759–773. [Google Scholar] [CrossRef]
  43. Czernecki, B.; Ptak, M. The impact of global warming on lake surface water temperature in Poland-the application of empirical-statistical downscaling, 1971–2100. J. Limnol. 2018, 77, 330–348. [Google Scholar] [CrossRef]
  44. Woolway, R.I.; Merchant, C.J. Amplified surface temperature response of cold, deep lakes to inter-annual air temperature variability. Sci. Rep. 2017, 7, 4130. [Google Scholar] [CrossRef]
  45. Soja, G.; Züger, J.; Knoflacher, M.; Kinner, P.; Soja, A.M. Climate impacts on water balance of a shallow steppe lake in Eastern Austria (Lake Neusiedl). J. Hydrol. 2013, 480, 115–124. [Google Scholar] [CrossRef]
  46. Wrzesiński, D.; Choiński, A.; Ptak, M. Effect of North Atlantic Oscillation on the hydrological conditions of Lake Morskie Oko (Carphatian Mountains). Bull. Geogr. Phys. Geogr. Ser. 2016, 10, 95–105. [Google Scholar] [CrossRef]
  47. Austin, J.; Colman, S. A century of temperature variability in Lake Superior. Limnol. Oceanogr. 2008, 53, 2724–2730. [Google Scholar] [CrossRef]
  48. Peeters, F.; Livingstone, D.M.; Goudsmit, G.-H.; Kipfer, R.; Forster, R. Modeling 50 years of historical temperature profiles in alarge central European Lake. Limnol. Oceanogr. 2002, 47, 186–197. [Google Scholar] [CrossRef]
  49. Livingstone, D.M. Impact of secular climate change on the thermal structure of a large temperate central European lake. Clim. Chang. 2003, 57, 205–225. [Google Scholar] [CrossRef]
  50. Thackeray, S.J.; Henrys, P.A.; Hemming, D.; Bell, J.R.; Botham, M.S.; Burthe, S.; Helaouët, P.; Johns, D.G.; Jones, I.D.; Leech, D.I.; et al. Phenological sensitivity to climate across taxa and trophic levels. Nature 2016, 535, 241–245. [Google Scholar] [CrossRef] [PubMed]
  51. Hansen, G.J.A.; Read, J.S.; Hansen, J.F.; Winslow, L.A. Projected shifts in fish species dominance in Wisconsin lakes under climate change. Glob. Chang. Biol. 2017, 23, 1463–1476. [Google Scholar] [CrossRef]
  52. Ye, X.; Anderson, E.J.; Chu, P.Y.; Huang, C.; Xue, P. Impact of Water Mixing and Ice Formation on the Warming of Lake Superior: A Model guided Mechanism Study. Limnol. Oceanogr. 2018, 64, 558–574. [Google Scholar] [CrossRef]
  53. Winslow, L.A.; Read, J.S.; Hansen GJ, A.A.; Rose, K.C.; Robertson, D.M. Seasonality of change: Summer warming rates do not fully represent effects of climate change on lake temperatures. Limnol. Oceanogr. 2017, 62, 2168–2178. [Google Scholar] [CrossRef]
  54. Pełechata, A.; Pełechaty, M.; Pukacz, A. Winter temperature and shifts in phytoplankton assemblages in a small Chara-lake. Aquat. Bot. 2015, 124, 32. [Google Scholar] [CrossRef]
  55. Currie, R.J.; Bennett, W.A.; Beitinger, T.L. Critical thermal minima and maxima of three freshwater game-fish species acclimated to constant temperatures. Environ. Biol. Fishes 1998, 51, 187–200. [Google Scholar] [CrossRef]
  56. Jonsson, T.; Setzer, M. A freshwater predator hit twice by the effects of warming across trophic levels. Nat. Commun. 2015, 6, 5992. [Google Scholar] [CrossRef]
  57. Schneider, P.; Hook, S.J.; Radocinski, R.G.; Corlett, G.K.; Hulley, G.C.; Schladow, S.G.; Steissberg, T.E. Satellite observations indicate rapid warming trend for lakes in California and Nevada. Geophys. Res. Lett. 2009, 36, 22. [Google Scholar] [CrossRef]
  58. Shinohara, R.; Tanaka, Y.; Kanno, A.; Matsushige, K. Relative impacts of increases of solar radiation and air temperature on the temperature of surface water in a shallow, eutrophic lake. Hydrol. Res. 2021, 52, 916–926. [Google Scholar] [CrossRef]
  59. Rigosi, A.; Hanson, P.; Hamilton, D.P.; Hipsey, M.; Rusak, J.A.; Bois, J.; Sparber, K.; Chorus, I.; Watkinson, A.J.; Qin, B.; et al. Determining the probability of cyanobacterial blooms: The application of Bayesian networks in multiple lake systems. Ecol. Appl. 2015, 25, 186–199. [Google Scholar] [CrossRef] [PubMed]
  60. Hamilton, D.P.; Magee, M.R.; Wu, C.H.; Kratz, T.K. Ice cover and thermal regime in a dimictic seepage lake under climate change. Inland Waters 2018, 8, 381–398. [Google Scholar] [CrossRef]
  61. Ptak, M.; Nowak, B. Variability of oxygen-thermal conditions in selected lakes in Polan. Ecol. Chem. Eng. S 2016, 23, 639–650. [Google Scholar]
  62. Rempfer, J.; Livingstone, D.M.; Blodau, C.; Forster, R.; Niederhauser, P.; Kipfer, R. The effect of the exceptionally mild European winter of 2006–2007 on temperature and oxygen profiles in lakes in Switzerland: A foretaste of the future? Limnol. Oceanogr. 2010, 55, 2170–2180. [Google Scholar] [CrossRef]
  63. Skowron, R. The Differentiation and the Changeability of Choin Elements of the Thermal Regime of Water in Lakes on Polish Lowland; Wydawnictwo Naukowe UMK: Toruń, Poland, 2011; 346p. [Google Scholar]
  64. Schneider, P.; Hook, S.J. Space observations of inland water bodies show rapid surface warming since 1985. Geophys. Res. Lett. 2010, 37, L22405. [Google Scholar] [CrossRef]
  65. IPCC. Climate change 2013: The physical science basis. In Contribution of Working Group I to the Fifth Assessment Report of the Intergovernmental Panel on Climate Change; Stocker, T.F., Qin, D., Plattner, G.-K., Tignor, M., Allen, S.K., Boschung, J., Nauels, A., Xia, Y., Bex, V., Midgley, P.M., Eds.; Cambridge University Press: Cambridge, UK; New York, NY, USA, 2013; pp. 33–115. [Google Scholar]
  66. O’Reilly, C.M.; Sharma, S.; Gray, D.K.; Hampton, S.E.; Read, J.S.; Rowley, R.J.; Schneider, P.; Lenters, J.D.; McIntyre, P.B.; Kraemer, B.M.; et al. Rapid and highly variable warming of lake surface waters around the globe. Geophys. Res. Lett. 2015, 42, 10773–10781. [Google Scholar] [CrossRef]
  67. Hampton, S.E.; Galloway AW, E.; Powers, S.M.; Ozersky, T.; Woo, K.H.; Batt, R.D.; Labou, S.G.; O’Reilly, C.M.; Sharma, S.; Lottig, N.R.; et al. Ecology under lake ice. Ecol. Lett. 2017, 20, 98–111. [Google Scholar] [CrossRef] [PubMed]
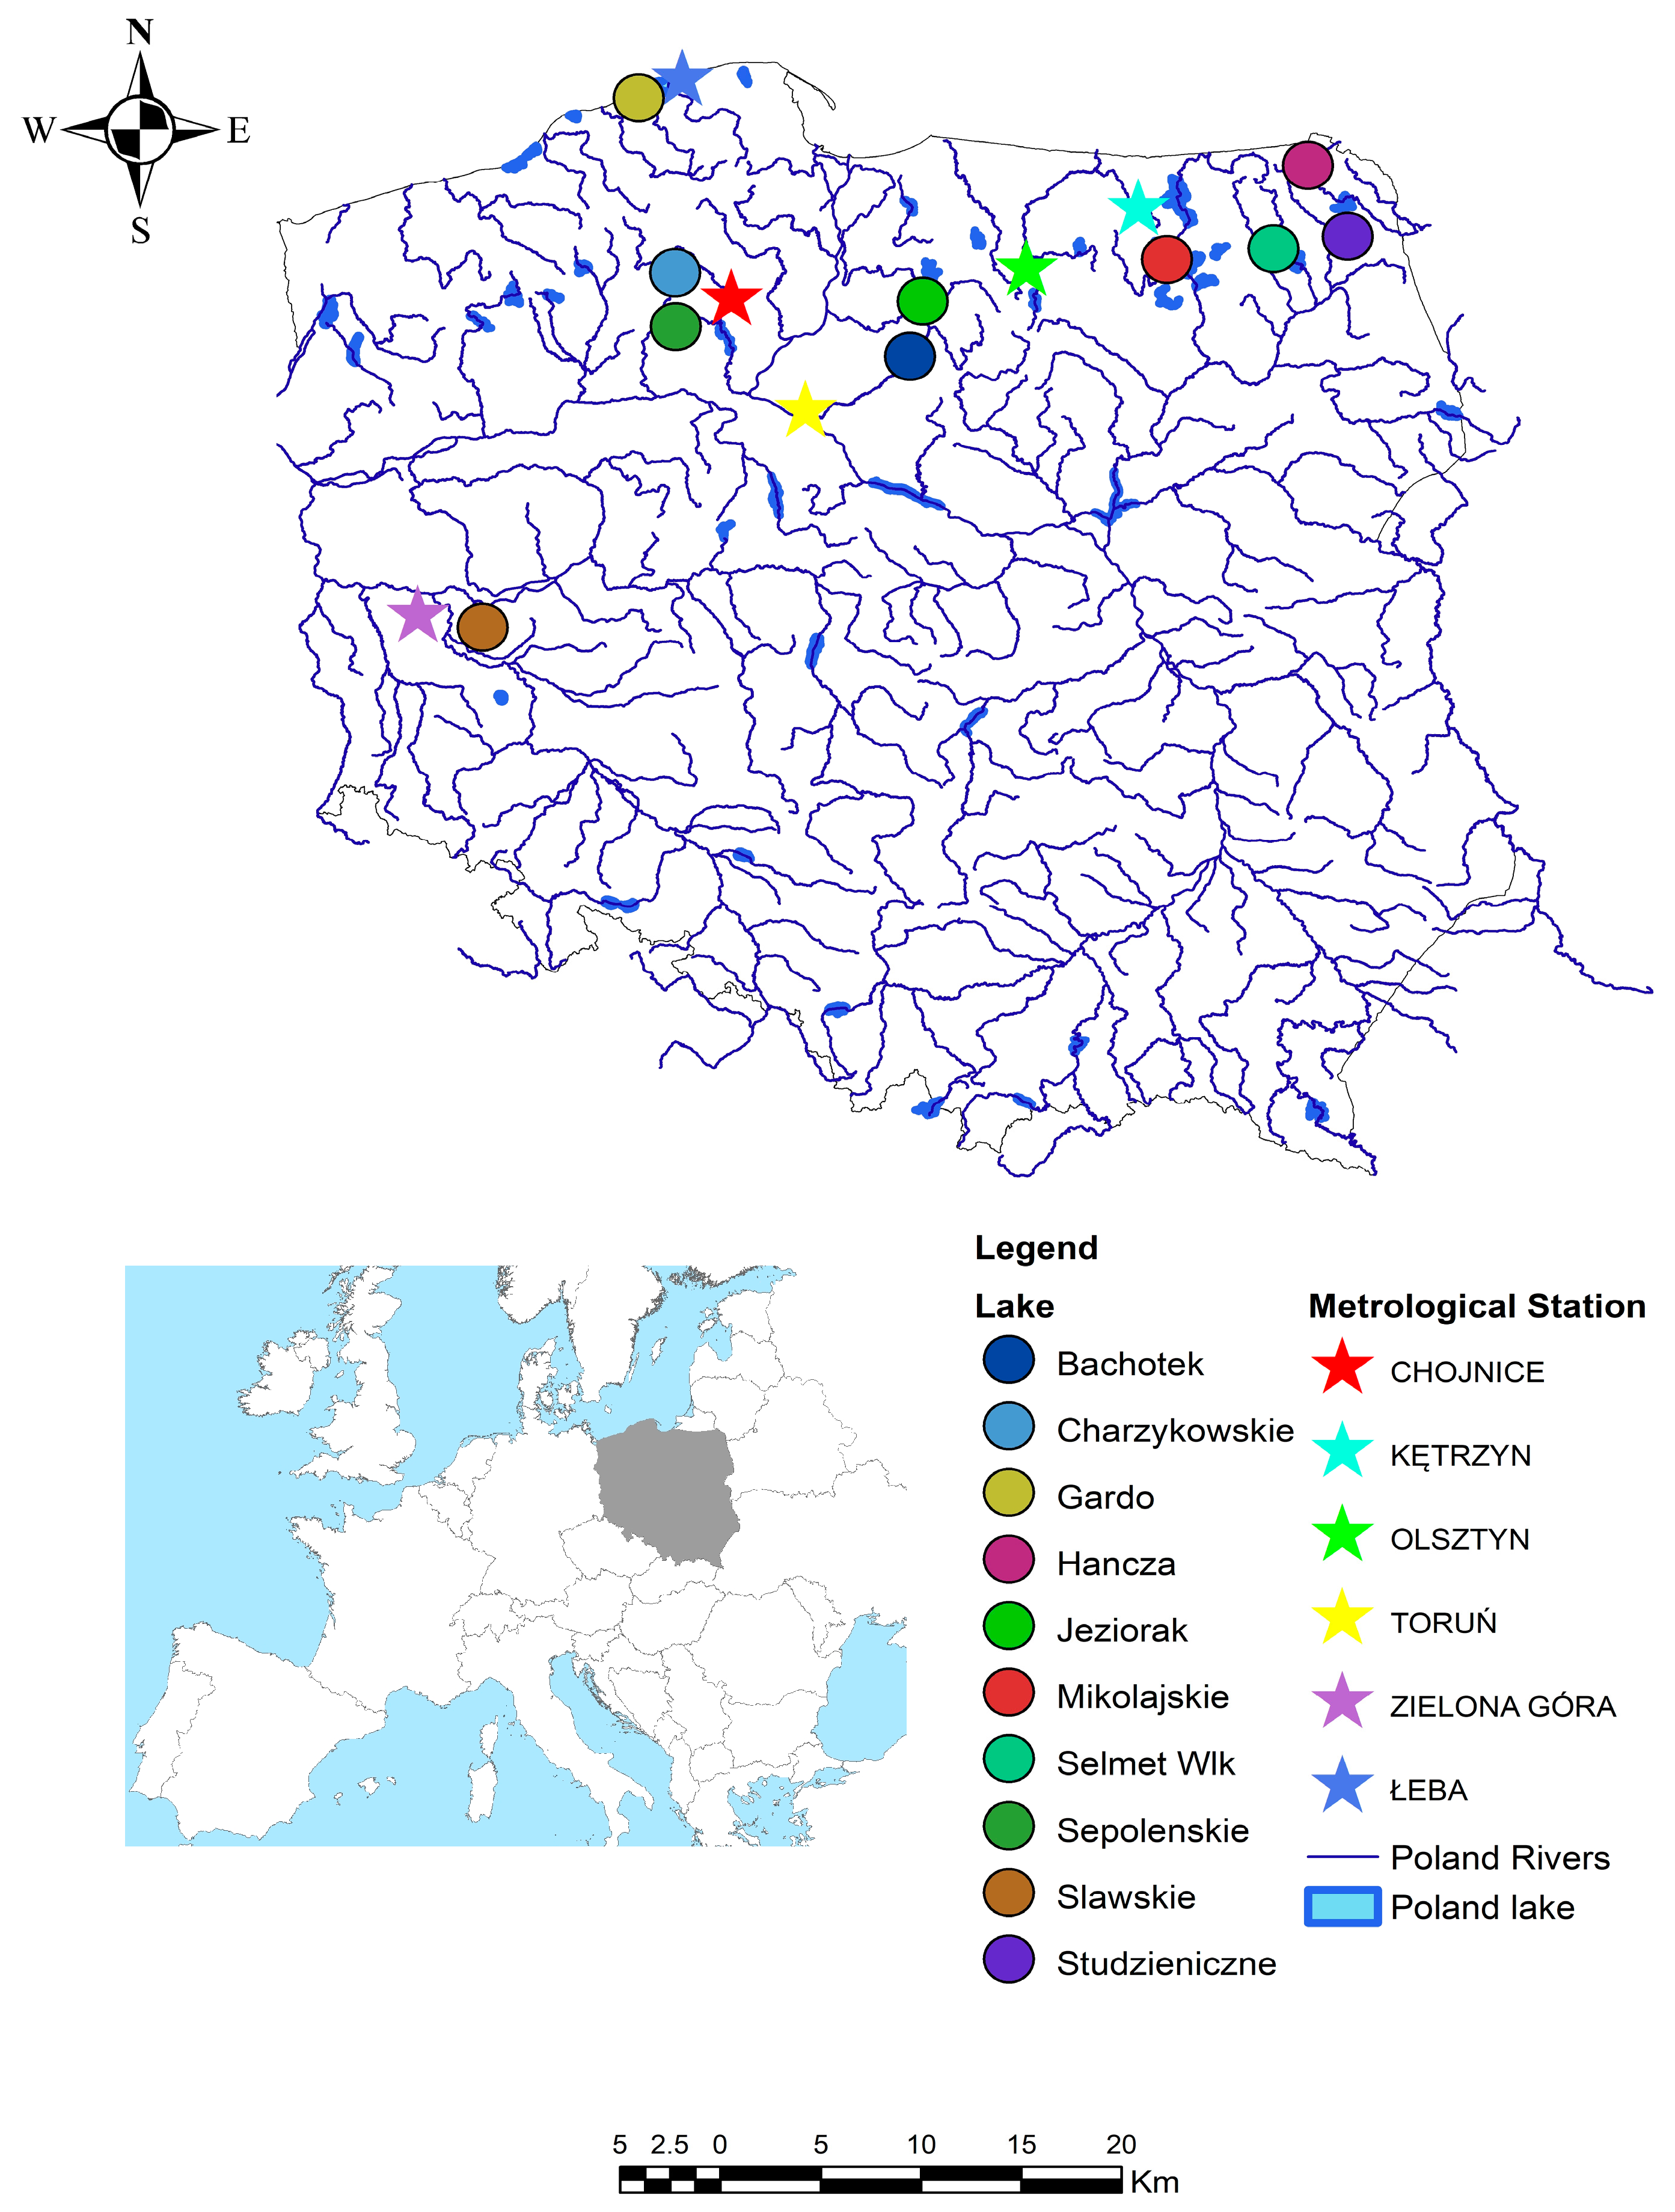
Figure 1. Location of the lakes studied in this paper.
Resources 12 00107 g001
Figure 2. Changes in minimum monthly water temperatures for the periods of 1972–2001, 1982–2011, 1992–2021, and 1972–2021, shown in °C per decade.
Resources 12 00107 g002
Figure 3. Changes in maximum monthly water temperatures for the periods of 1972–2001, 1982–2011, 1992–2021, and 1972–2021, shown in °C per decade.
Resources 12 00107 g003
Figure 4. The trend of minimum lake water temperature for the periods of 1972–2001 (red line), 1982–2021 (blue line), 1992–2021 (purple line), and 1972–2021 (green line).
Resources 12 00107 g004
Figure 5. The trend of maximum lake water temperature for the periods of 1972–2001 (red line), 1982–2021 (blue line), 1992–2021 (purple line), and 1972–2021 (green line).
Resources 12 00107 g005
Figure 6. Annual minimum water temperature changes in the analyzed lakes.
Resources 12 00107 g006
Figure 7. Annual maximum water temperature changes in the analyzed lakes.
Resources 12 00107 g007
Figure 8. Changes in minimum (a) and maximum (b) water temperatures for the studied periods.
Resources 12 00107 g008
Table 1. The lakes’ morphometric parameters [28,29] and environmental characteristics.
NoLakeLatitudeLongitudeArea
(ha)
Volume
(103 m3)
Mean Depth
(m)
Ice Cover
Max Thickness
(cm)
(Mean 1972–2021)
Köppen’s
Climate
Classification
1Sławskie51.8916.02822.542,664.85.220.0Cfb
2Sępoleńskie53.4617.51157.57501.64.822.6Cfb
3Charzykowskie53.7717.501336.0134,533.29.822.2Cfb
4Gardno54.7117.392337.530,950.51.318.8Cfb
5Bachotek53.3019.47215.015,394.27.224.8Cfb
6Jeziorak53.7219.623152.5141,594.24.122.4Cfb
7Mikołajskie53.7721.60424.055,739.711.227.6Dfb
8Selmęt Wielki53.8322.481207.59963.97.830.2Dfb
9Studzieniczne53.8723.12244.022,073.68.729.9Dfb
10Hańcza54.2722.81305.0120,000.038.724.1Dfb
Table 2. Mann–Kendall analysis of annual minimum and maximum temperatures.
Lake1972–20211972–20011982–20111992–2021
Z-Valuep-ValueZ-Valuep-ValueZ-Valuep-ValueZ-Valuep-Value
Minimum Temperature
Sławskie2.750.01 ****1.580.120.430.671.780.07
Gardno0.001.00−0.130.890.100.920.630.53
Sępoleńskie1.890.062.250.02 ****−0.450.651.110.27
Charzykowskie3.350.00 ****2.010.04 ****0.810.422.590.01 ****
Mikołajskie1.340.18−0.380.710.660.511.860.06
Jeziorak0.420.670.960.340.060.961.890.06
Selmęt Wielki5.070.00 ****4.750.00 ****1.370.171.290.20
Studzieniczne1.680.09−0.960.341.180.242.120.03 ****
Hańcza2.180.03 ****2.170.03 ****0.020.991.710.09
Bachotek3.150.00 ****2.480.01 ****0.840.402.190.03 ****
Maximum temperature
Sławskie4.440.00 ****2.010.04 ****2.270.02 ****1.890.06
Gardno1.970.05 ****−0.510.610.470.641.670.10
Sępoleńskie2.370.02 ****0.880.381.260.211.110.27
Charzykowskie3.510.00 ****0.770.443.280.00 ****1.890.06
Mikołajskie3.040.00 ****0.210.842.340.02 ****1.710.09
Jeziorak3.890.00 ****0.660.510.660.512.790.01 ****
Selmęt Wielki2.920.00 ****−0.470.641.070.282.490.01 ****
Studzieniczne4.440.00 ****0.990.322.980.00 ****2.490.01 ****
Hańcza2.960.00 ****0.001.002.570.01 ****2.460.01 ****
Bachotek3.510.00 ****1.410.162.080.04 ****1.560.12
**** 5% significance level.
Table 3. Magnitude and classification of changes in lake water temperature.
Change MagnitudeChange Classification
<0.10Very Low
0.10–0.34Low
0.35–0.64Moderate
0.65–0.94High
>0.94Very high
Table 4. Location of the lakes and meteorological stations.
LakesIdentifierMeteorological StationsIdentifier
Sławskie1Zielona GóraA
Sępoleńskie2ChojniceB
Charzykowskie3ŁebaC
Gardno4ToruńD
Bachotek5KętrzynE
Jeziorak6OlsztynF
Mikołajskie7KętrzynE
Selmęt Wielki8KętrzynE
Studzieniczne9KętrzynE
Hańcza10KętrzynE
Table 5. Statistical significance of the differences in mean and median values for minimum and maximum water temperatures in the chosen periods of 1972–2001, 1982–2011, 1992–2021, and 1972–2021.
PeriodAverage Trend
(°C per Decade)
Median Trend
(°C per Decade)
Minimum water temperature trend value
1972–20110.08 a*0.07 a
1982–20110.14 a0.04 a
1992–20210.430.46
1972–20210.07 a0.06 a
Maximum water temperature trend value
1972–20110.210.30
1982–20110.59 ab0.61 a
1992–20210.75 a0.65 a
1972–20210.52 b0.56 a
*—The same letter indicates no significant differences at the significance level of 0.05. Results of the t-test were presented with the background of the average value and the sign test with the background of the median value.
Disclaimer/Publisher’s Note: The statements, opinions and data contained in all publications are solely those of the individual author(s) and contributor(s) and not of MDPI and/or the editor(s). MDPI and/or the editor(s) disclaim responsibility for any injury to people or property resulting from any ideas, methods, instructions or products referred to in the content.