Article

Fluoride Removal from Aqueous Medium Using Biochar Produced from Coffee Ground

by
Hellem Victoria Ribeiro dos Santos
1,2,
Paulo Sérgio Scalize
1,2,*,
Francisco Javier Cuba Teran
1 and
Renata Medici Frayne Cuba
1
1
Post-Graduation Program in Environmental and Sanitary Engineering (PPGEAS), Federal University of Goiás, Goiânia 74000-000, Brazil
2
Post-Graduation Program in Environmental Sciences (CIAMB), Federal University of Goiás, Goiânia 74000-000, Brazil
*
Author to whom correspondence should be addressed.
Resources 2023, 12(7), 84; https://doi.org/10.3390/resources12070084
Submission received: 6 June 2023 / Revised: 9 July 2023 / Accepted: 11 July 2023 / Published: 17 July 2023
(This article belongs to the Special Issue Energy and Nutrient Recovery by Hydrothermal Treatments)

Abstract

:
Low concentrations of fluoride (F) in drinking water are beneficial for oral health, but the natural occurrence of high F content has been reported in various groundwater sources, posing a continuous ingestion threat to humans. The utilization of biochar (BC) produced from residual biomass has emerged as a technically, economically, and environmentally sustainable alternative for fluoride removal through adsorption. Therefore, this study aimed to investigate the physicochemical characteristics of BC derived from coffee grounds and the influence of various factors on the adsorption process of F in aqueous media, including pH, adsorbent dosage, contact time, temperature, and initial F concentration. The BC exhibited a surface area of 12.94 m2·g−1 and a pore volume of 0.0349 cm3·g−1. The adsorption process was strongly pH dependent, demonstrating a significant decline in performance as pH increased from 2.0 onwards. The majority of F removal occurred within the first 5 min, reaching adsorption equilibrium after 1 h of testing, regardless of the initial F concentration employed. The data fitting to the Webber–Morris model indicated a two-step adsorption process on BC, with the first step being external surface sorption and the second step being intra-articular diffusion. The process was determined to be endergonic, and the data satisfactorily matched both the Freundlich and Langmuir models, with a qm of 0.53 mg·L−1 (T = 55 °C), indicating the predominance of physisorption. The findings suggest the potential of coffee grounds for BC production; nevertheless, surface structure modifications are necessary to enhance F affinity and subsequently improve adsorption capacity.

Graphical Abstract

1. Introduction

From an epidemiological perspective, fluoride plays a crucial role in oral health by aiding in the prevention of dental caries. However, excessive fluoride levels in the body can lead to dental fluorosis and skeletal fluorosis [1,2], which is why the maximum acceptable fluorides in water intended for human consumption is set at 1.5 mg·L−1 [3].
Nevertheless, elevated fluoride concentrations above the recommended limit have been observed in groundwater within public and private water supply systems in various countries, including India [4], Brazil [5], Ethiopia [6], China, Pakistan, Thailand [7], Norway, Argentina, Canada, and Nigeria [8]. Water contamination by fluorides can occur due to the dissolution of minerals present in the Earth’s crust that contain fluoride such as fluorite (CaF2), fluorapatite (Ca5(PO4)3F), cryolite (Na3AlF6) [9] or by effluents from anthropogenic activities, especially semiconductor industries, electroplating, glass, steel, cement, etc. [10].
Various techniques have been employed for defluorination of water, including coagulation and/or precipitation using alum and lime [11], phytoremediation [12], reverse osmosis [13], nanofiltration [14], electrodialysis [15], ion exchange processes [16], electrocoagulation [17], and adsorption.
Among these methods, adsorption is widely recognized as the most sustainable approach from both technical and economic perspectives. It offers high removal efficiencies, ease of operation, lower operating costs in real-world applications, and the potential for adsorbent material recovery and regeneration [10,18,19]. To enhance the environmental sustainability of the process, researchers from various fields have focused on the development of adsorbent materials derived from pyrolyzed biomass waste, commonly referred to as biochar.
Biochar is a porous, carbon-rich material produced by carbonizing cellulosic or noncellulosic biomass in an anaerobic atmosphere or under limited oxygen conditions [20]. In comparison to conventional activated carbon, commonly generated from nonrenewable coal and requiring energy-intensive thermal activation to develop adsorption properties [21], biochar offers environmental sustainability, lower production costs, and increased precursor material availability [22].
The literature reports a wide range of raw materials that can be utilized for BC production, such as bovine bone [23], rice husks [24], coconut husks [25], tea residues [26], and sewage treatment plant sludge [27]. As the focus of most biochar studies is the removal of emerging pollutants [28] and heavy metals [29], few studies have focused on fluoride removal [10].
Kumar et al. [30] used biochar produced from peanut residues and obtained the removal of 3.66 mg·g−1 of fluoride. Similar values, 6.58 mg·g−1 and 3.42 mg·g−1, were achieved with biochar produced from bamboo and rice husks, respectively [31], and Sadhu et al. [10] removed 9.5 mg·g−1 of fluoride in groundwater samples using biochar produced from watermelon rind.
In recent years, various adsorbent materials have been proposed to improve the removal efficiency of anionic compounds. These include metal–organic frameworks (MOFs) [32,33], nanofibers composed of multivalent metals [34,35], and chemically modified biochars using acid compounds, basic compounds, polymers, and metals [36,37]. However, the utilization of these materials, as well as the chemical modification techniques of biochar, can significantly impact the production costs of the adsorbents [38], making it challenging to implement large-scale biochar usage in developing countries, as these costs represent a determining factor in the practical application of these materials [39]. Therefore, further research is needed to explore alternative precursor materials and optimize the parameters for biochar production.
The efficiency of contaminant removal is primarily associated with the physicochemical properties of biochar, which are influenced by factors such as the raw material used and the conditions of pyrolysis [40], including residence time, heat transfer rate, gas flow, and pyrolysis temperature. Pyrolysis temperature, in particular, has been extensively studied due to its influence on the surface area and porous structure of biochar. Researchers can optimize the pyrolysis conditions according to the desired results [40]. Typically, biochar studies are conducted within the temperature range of 300 °C to 700 °C [41], with increasing temperature generally leading to improved surface characteristics through the removal of alcoholic (-OH), aliphatic, and ester (-CO-) groups from the biomass during decomposition until stabilization [42].
However, it is important to note that increasing pyrolysis temperature does not always result in improved surface characteristics of biochar. Some studies [43] have observed a significant decrease in both porosity (0.112 cm3·g−1, 0.078 cm3·g−1, and 0.057 cm3·g−1) and surface area (70.290 m2·g−1, 61.809 m2·g−1, and 44.491 m2·g−1) of biochar produced from marine macroalgae residues and almond/nut shells at temperatures of 400 °C, 600 °C, and 800 °C, respectively. Biochars prepared from almond and nut shells at temperatures of 400 °C, 500 °C, and 800 °C also had reduced surface areas, measuring 0.840 m2·g−1, 0.440 m2·g−1 and 0.370 m2·g−1 for almond biochar and 2.410 m2·g−1, 0.350 m2·g−1, and 0.130 m2·g−1 for the respective temperatures [44]. This phenomenon can be attributed to pore widening, coalescence of adjacent pores, and partial pore blockage caused by the softening, melting, fusing, and carbonization of the biochar structure at high temperatures [45]. Conversely, performing pyrolysis at temperatures lower than the stabilization temperature of biochar can lead to incomplete carbonization of the biomass, resulting in reduced loss of volatiles and a lower surface area [42].
Therefore, the pyrolysis temperature plays a crucial role in determining the production costs and adsorption efficiency of biochar. Careful optimization of this parameter is necessary to strike a balance between cost-effectiveness and the desired adsorption performance.
In this context, coffee waste, whether it is residue from its production [46] or from beverage preparation [47], can be a viable alternative raw material for biochar production. Coffee is one of the most widely consumed beverages globally, and during its preparation, only a small fraction (0.2%) of the beans are extracted, leaving behind a significant amount of harmful residues (grounds) [48], which also incur high disposal costs [49]. Therefore, utilizing coffee grounds for adsorbent production can be an interesting approach, as they contain oxidizing organic chemical compounds, particularly those rich in oxygen and functional groups such as hydroxyl, carboxyl, amino, sulfonic, and phenolic groups [50], which contribute to the adsorption of organic compounds [51], metal ions [52], and anions [48].
Studies investigating the use of biochar produced from coffee grounds for anion removal are limited [10]. Kwak et al. [53] conducted a study on the adsorption of radioactive iodine using biochar derived from coffee grounds, achieving a favorable removal of 22.73 μg·g−1 at equilibrium. In another study, where biochar was impregnated with magnesium for subsequent phosphorus removal, the authors achieved a 24ch removal of 89.4%, equivalent to an adsorption capacity of 14 mg·g−1 [48]. Nitrate (N-NO3) removal has also been investigated using pristine biochar and biochar impregnated with aluminum and magnesium, resulting in the removal of 0.32 mg·g−1 and 2.82 mg·g−1, respectively [54].
Therefore, in light of the need to obtain potential precursor materials for the production of cost-effective adsorbents targeting fluoride removal from water, as well as the limited technical information available on biochar production from coffee waste for fluoride removal, this study presents the results of the physicochemical characteristics and fluoride removal capacity of biochar derived from coffee grounds. The biochar was produced at the biomass stabilization temperature without any chemical or physical modification, aiming to enhance economic and environmental sustainability during the production process. The pyrolysis temperature was determined using thermogravimetric analysis, followed by adsorption tests that involved manipulating the physicochemical parameters of the system to establish ideal sorption conditions. Additionally, the adsorption mechanism was investigated through kinetic, thermodynamic, and surface characterization studies.

2. Materials and Methods

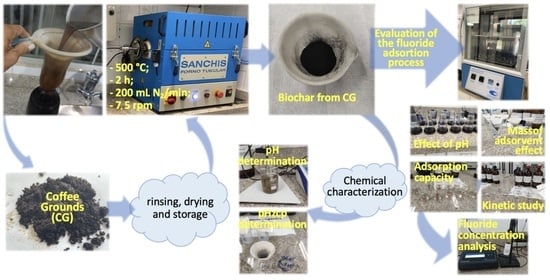
2.1. Obtaining the Precursor Material (Coffee Grounds)

The coffee grounds used were obtained from the domestic preparation of the beverage without the addition of other substances such as sugar or sweetener to the water or coffee powder. To remove water-soluble substances and impurities, the coffee grounds were rinsed with ultra-pure water (GEHAKA, Master System) with a conductivity of 1.35 µS·cm−1 at a temperature of 80 ± 5 °C and subsequently at room temperature (26 ± 2 °C) [55]. The rinsed coffee grounds were then dried in an oven at 105 ± 5 °C for 24 h to obtain the precursor material (PM), which was stored until further use.

2.2. BC Production

The BC was produced by pyrolyzing the PM in a rotary bipartite tubular furnace (approximately 7.25 rpm), Sanchis®, under an inert atmosphere created by a nitrogen flow of 200 mL·min−1. Pyrolysis was carried out for 2 h at a temperature of 500 °C with a heating rate of 10 °C·min−1 as determined based on a prior thermogravimetric study [55]. The average particle diameter used in the experiments was determined to be 0.21 mm using a set of graduated sieves from the Tyler Bertel series with mesh apertures of 600, 425, 250, 150, 75, and 53 μm.

2.3. Physicochemical Characterization of BC

The following analyses were conducted to characterize the BC: BC pH [56], zero charge point pH (pHZCP) determined by the 11-point method [57], and determination of carbon, nitrogen, and hydrogen contents using an elemental analyzer (Perkin Elmer Series II—CHNS/O Analyzer 2400), morphological visualization of the surface and elemental analysis using scanning electron microscopy with gold cathodic spraying of samples to obtain images (Jeol JSM—6610), evaluation of crystal structure using X-ray diffraction (XRD) with a diffractometer (Bruker D8 Discover), identification of surface functional groups using Fourier transform infrared (FTIR) spectroscopy (Bruker Vertex Spectrometer 70), determination of specific surface area (BET), total pore volume, distribution, and mean pore diameter (BJH) using the nitrogen adsorption–desorption isotherm (N2) method at −195.85 °C (ASAP2020 Plus, Micromeritics, Norcross, GA, USA).

2.4. Evaluation of the Fluoride Adsorption Process

All adsorption experiments were conducted in batch mode using a refrigerated shaker incubator (Solab—223) with a controlled temperature maintained at a constant speed of 100 rpm. When necessary, the pH of the solutions was adjusted using 1.0 M HCl or NaOH solutions prepared with ultra-pure water (GEHAKA, Master System) with a conductivity of 1.35 µS·cm−1.

2.4.1. Influence of pH and Adsorbent Dosage on Adsorption

To assess the influence of pH, 0.5 g of BC was exposed to 50 mL of sodium fluoride (NaF) solution with a concentration of 7 mg F·L−1 and pH ranging from 2 to 12. To evaluate the effect of adsorbent dosage, samples of 0.1 g, 0.5 g, 1.0 g, and 2.0 g of BC were exposed to 50 mL of NaF solution with a concentration of 7 mg F·L−1 at a pH of 2. In both experiments, the stirring period was 24 h, and the results were expressed as qe values (Equation (1)) and the percentage removal of F (Equation (2)).
q e = V ( C 0 C e ) m
R F = C 0 C e C 0 × 100
where RF represents the percentage removal of F, C0 is the initial concentration of F (mg·L−1), Ce is the equilibrium concentration of F (mg·L−1), V is the volume of the solution (L), and m is the mass of the adsorbent (g).

2.4.2. Influence of Initial Fluorine Concentration on Adsorption Kinetics

The experiments were conducted using 50 mL of NaF solutions (pH = 2) with initial concentrations of 7.0 mgF·L−1, 15.0 mgF·L−1, and 30 mgF·L−1 in contact with 0.5 g of BC under constant agitation. F concentration was measured in time intervals of 5, 10, 15, and 30 min, and 1, 2, 3, 4, 5, and 6 h were used. To determine the kinetic parameters, the F adsorption data as a function of time were fitted to the pseudo-first-order (Equation (3)), pseudo-second-order (Equation (4)), and Webber–Morris models (Equation (5)) [58,59].
q t = q e ( 1 e k 1   t )
q t = k 2   q e 2 t 1 + k 2   q e t
q t = k d . t 1 2 + C
where k1 is the pseudo-first-order rate constant (min−1), k2 is the pseudo-second-order rate constant (g mg−1 min−1), qe is the adsorption capacity at equilibrium (mg·g−1), qt is the adsorption capacity at time t (mg·g−1), t is the time (min), kd is the solid-phase diffusion coefficient (mg g−1 min−1/2), and C is the linear coefficient.

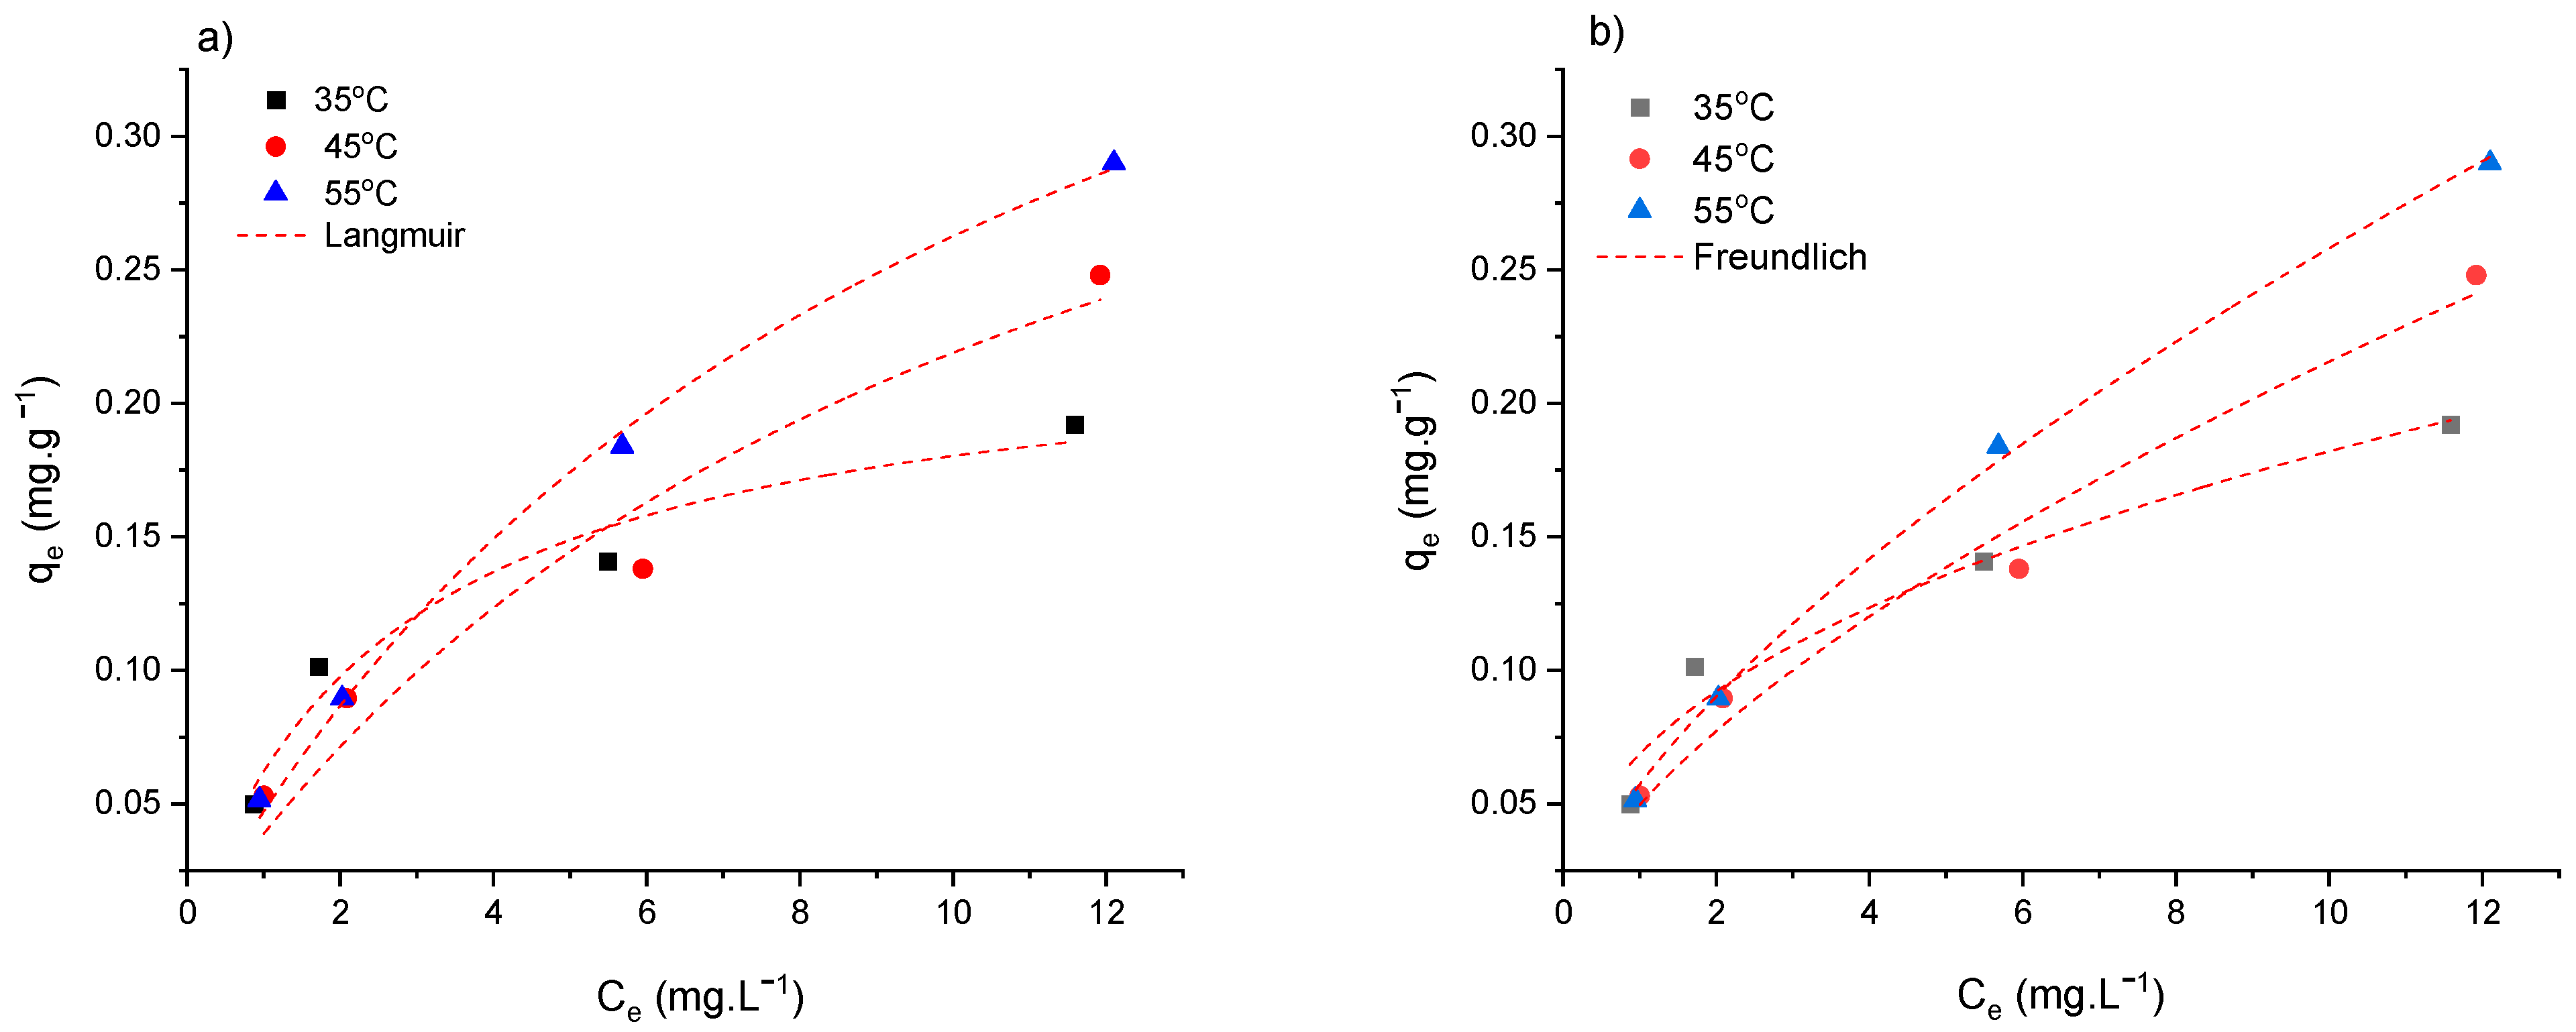
2.4.3. Evaluation of Adsorption Capacity

To evaluate the adsorption capacity of BC, adsorption isotherm experiments were conducted using 0.5 g of BC in contact with 50 mL of NaF solutions at concentrations of 1.5, 3.0, 7.0, 14.0, and 28.0 mg F·L−1 and a pH of 2. The F concentrations were selected based on the maximum concentration established by the World Health Organization (WHO) [3]. After 5 h of agitation, the adsorption capacity (qe) and F concentration were determined. The adsorption parameters were determined by fitting the Ce and qe data to the Langmuir (Equation (6)) and Freundlich (Equation (7)) models [60].
q e = q m   ·     K L   ·   C e 1 + ( K L   ·   C e )
q e = K F   ·   C e 1 n
where qe represents the amount of solute adsorbed in the solid phase in mg·g−1; qm is the maximum amount of solute adsorbed, corresponding to monolayer coverage in mg·g−1; KL denotes the adsorption equilibrium constant or Langmuir constant in L·mg−1; Ce is the equilibrium concentration of the solute in the fluid phase in mg·L−1; n is the dimensionless constant associated with the adsorption intensity, and KF is the constant related to the adsorption capacity in (mg·g−1) (L·mg−1)1/n.

2.4.4. Effect of Temperature on the Adsorption Process and Determination of Thermodynamic Parameters

To assess the influence of temperature and derive the thermodynamic parameters, adsorption isotherm experiments were conducted at constant temperatures of 35 °C, 45 °C, and 55 °C. The thermodynamic parameters were obtained using Equations (8)–(10) [61].
ln K d = Δ S R Δ H R · T
Δ G = Δ H ( T ·   Δ S )
K d = q e C e
The variation in Gibbs free energy (ΔG) is expressed in J·mol−1, while T represents the temperature in K. R is the universal gas constant with a value of 8.314 J·(K·mol)−1. ΔS refers to the standard entropy in J·(mol·K)−1, ΔH denotes the standard enthalpy in J·mol−1, and Kd represents the dimensionless thermodynamic equilibrium constant for fluorine adsorption in BC. The calculation of ΔH and ΔS involves plotting ln (Kd) against T−1, a graph known as the Van’t Hoff plot [30].

2.5. Preparation of Solutions and Physico-Chemical Analysis

The experimental solutions were prepared using analytical grade reagents and ultra-pure water (GEHAKA, Master System) with a conductivity of 1.35 µS·cm−1. pH values were measured using a pH meter (LUCA—Adsorption studies 210). Fluoride analysis was performed using a fluoride selective ion electrode (18AF Analyzer® 550 M) following procedure 4.500-F-C presented in Standard Methods for the Examination of Water and Wastewater [62]. Prior to analysis, the samples were filtered using quantitative filter paper.

3. Results

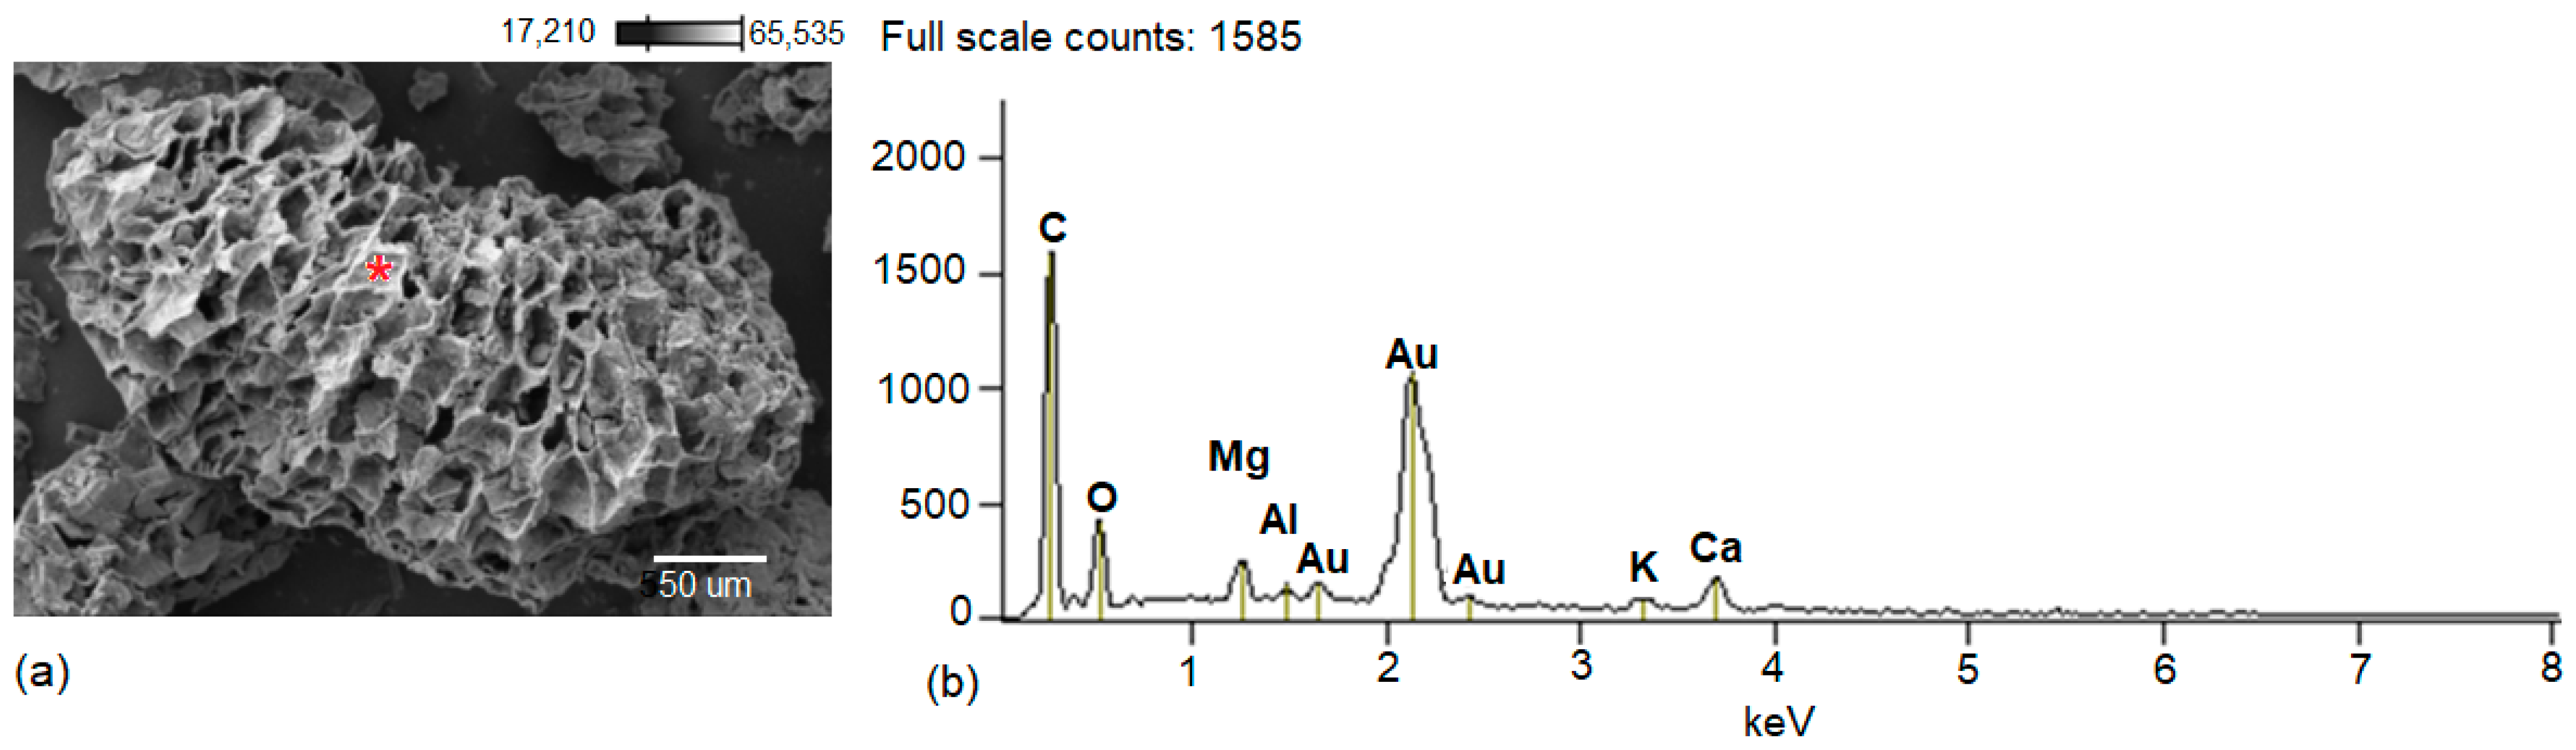
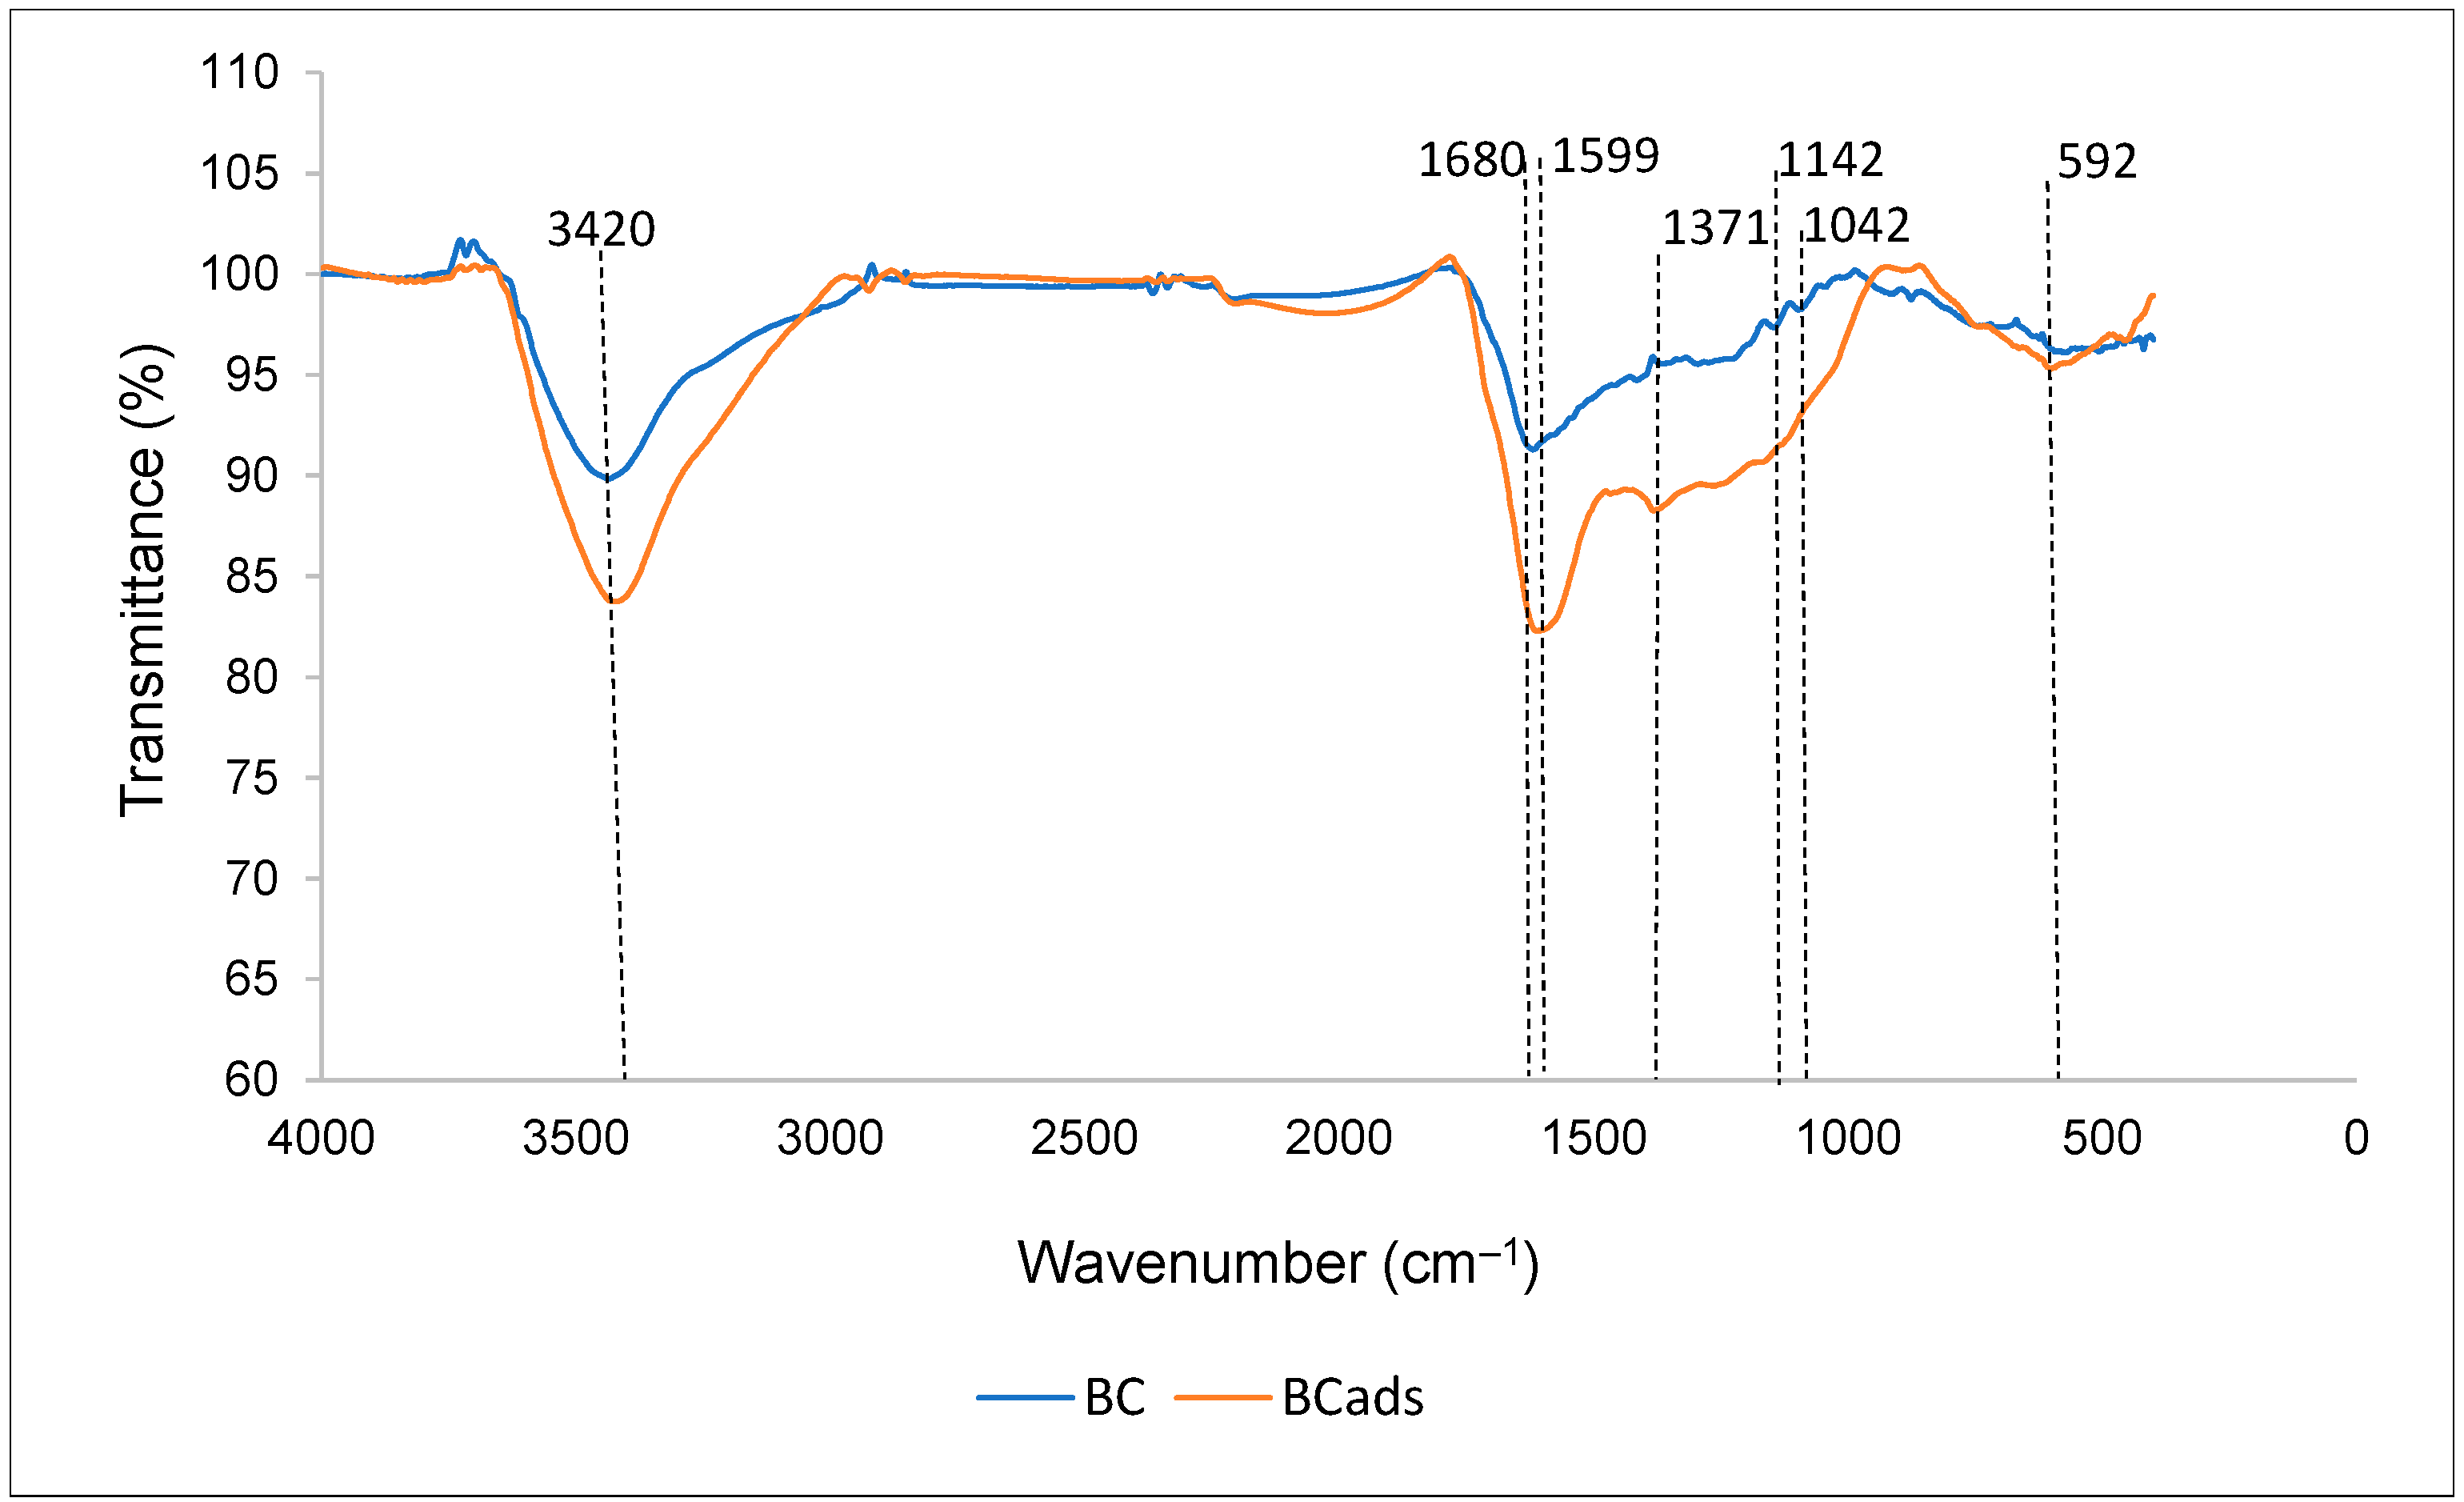
3.1. Physicochemical Characterization of BC

The yield of BC production from the precursor material (PM) was 16.72%, which is attributed to the loss of mass caused by the release of water from the coffee grounds and light volatile molecules that occurs at temperatures below 200 °C, as well as the release of volatile hydrocarbons, hemicellulose, cellulose, and some part of lignin in the temperature range of 200 to 650 °C, as reported in the literature on thermogravimetric analysis of coffee grounds [55,63,64].
The pH of BC was determined to be 6.74, while the zero charge point (pHZCP) was found to be 4.76. Thus, fluoride adsorption may be favorable in solutions with pH values below 4.76 because, under these conditions, the surface charge of BC tends to be positive, which would facilitate electrostatic attractions between the adsorbent and adsorbate. Table 1 presents the carbon, nitrogen, and oxygen contents identified in BC and coffee grounds.
The carbon content of BC exhibited an increase of 10.44 percentage points compared to coffee grounds. This increase can be attributed to the carbonization process, which involves the rearrangement of the carbonaceous structure by breaking less stable chemical bonds in coffee grounds and the elimination of heteroatoms in the form of simple compounds, either in the gaseous or liquid state [65].
On the other hand, the decrease in nitrogen content is a result of the release of volatile compounds, primarily nitrogen and oxygen, during the decomposition of organic matter present in coffee grounds [55]. Simultaneously, there was a gain in hydrogen content, with an increase of 2.76 percentage points. This gain can be attributed to the presence of hydrogen in controlled atmosphere carbonization processes, as carbon in the graphene structure is bonded to hydrogen [66].
The X-ray diffraction analysis of BC (Figure 1) revealed a pronounced background radiation, indicating a significant proportion of amorphous carbon in the adsorbent’s structure. The prominent diffraction peak observed at 2θ, approximately 25°, indicates the existence of a carbon-rich phase with low crystallinity [26].
In terms of surface morphology, BC exhibited a rugged and heterogeneous surface characterized by the presence of pores with diverse shapes and sizes, as depicted in Figure 2.
The heterogeneity of the surface was confirmed through the assessment of N2 adsorption and desorption isotherms at a temperature of −195.85 °C. The resulting curve (Figure 3a) exhibited a type III isotherm classification, indicating the prevalence of pores with varying sizes and the accumulation of adsorbed molecules around the most favorable sites on the solid surface [67,68]. The largest observed pore diameter was approximately 35 Å (Figure 3b), corresponding to mesopores, which play a significant role in the adsorption of large molecules such as dyes [68,69]. These findings suggest a favorable condition for the adsorption of fluorine ions, which have an ionic radius of 1.33 Å [70].
The mesoporous adsorbent exhibited a specific surface area of 12.94 m2 g−1 and a pore volume of 0.0349 cm3·g−1. In a similar study where biochar was produced from coffee grounds without activation at 500 °C, the specific surface area was reported to be 11.0 m2 g−1, with a lower pore volume of 0.009 cm3 g−1 [52]. However, the specific surface area of the biochar in our study was higher compared to biochar produced from coffee grounds treated with acid compounds [46] and biochar produced at a lower temperature [71], which exhibited specific surface areas of 0.6 m2 g−1 and 0.524 m2·g−1, respectively.
The lower surface area observed in the study by Ogata et al. [46] can be attributed to the destruction of pore walls caused by strong oxidizing conditions applied to the biochar [72]. Furthermore, in the study by Lee et al. [71], the lower pyrolysis temperature of 300 °C may have resulted in incomplete carbonization of the biomass, leading to reduced volatiles loss and surface area [42].
In our study, no oxidizing compounds were utilized for biochar surface modification, and the pyrolysis temperature of 500 °C was chosen based on the findings of a prior thermogravimetric analysis [55] to ensure the highest stability of the produced biochar.
In the energy-dispersive spectroscopy (EDS) analysis (Figure 4b), carbon was identified as the predominant element. Other elements detected in smaller quantities, such as oxygen, magnesium, potassium, and calcium, likely originate from the composition of coffee grounds [51].
The FTIR spectra of BC before and after fluoride adsorption are shown in Figure 5. Their interpretations were based on similar studies presented in the literature.
Figure 5 reveals changes in peak intensity and position, providing evidence of fluoride adsorption on the biochar surface [30]. The spectroscopic bands within the range of 3600 to 3200 cm−1 correspond to stretching vibrations of hydroxyl groups (OH) associated with carboxyl, alcohol, or phenol functional groups as well as amine (N-H) vibrations present in coffee grounds. The presence of NH functional groups and OH indicates the occurrence of strong intra- and intermolecular hydrogen bonding. Additionally, a characteristic peak of crystalline cellulose in coffee grounds is observed [73,74]. A broad peak is noticeable at 3420 cm−1, representing the association of the -OH group, which becomes more intense and broader after fluoride adsorption. This phenomenon has been attributed to the formation of hydrogen bonds during the adsorption process [75]. The nature of these bonds may be influenced by the dominant form of fluoride in the medium, which is HF (pKa = 3.16), given that the experimental pH was fixed at 2.
The peak observed at 1371 cm−1 is attributed to the flexion of phenolic -OH or C-O bonds, and its increased intensity after adsorption suggests the incorporation of F into the adsorbent [76]. These functional groups exhibit stronger interactions with fluoride ions [77]. Peaks around 1600 cm−1 may be attributed to water bonds or hydroxyl groups present on the surface [31].
Within the range of 1040 cm−1 to 1150 cm−1, subtle peaks (1042 cm−1–1142 cm−1) characteristic of SiO2 are observed, but they are not detected after fluoride adsorption. Silica is typically found in plant compositions (phytoliths), serving as protection against carbon degradation [78]. These groups are highly active and can interact with fluorine through the formation of hydrogen bonds [31].

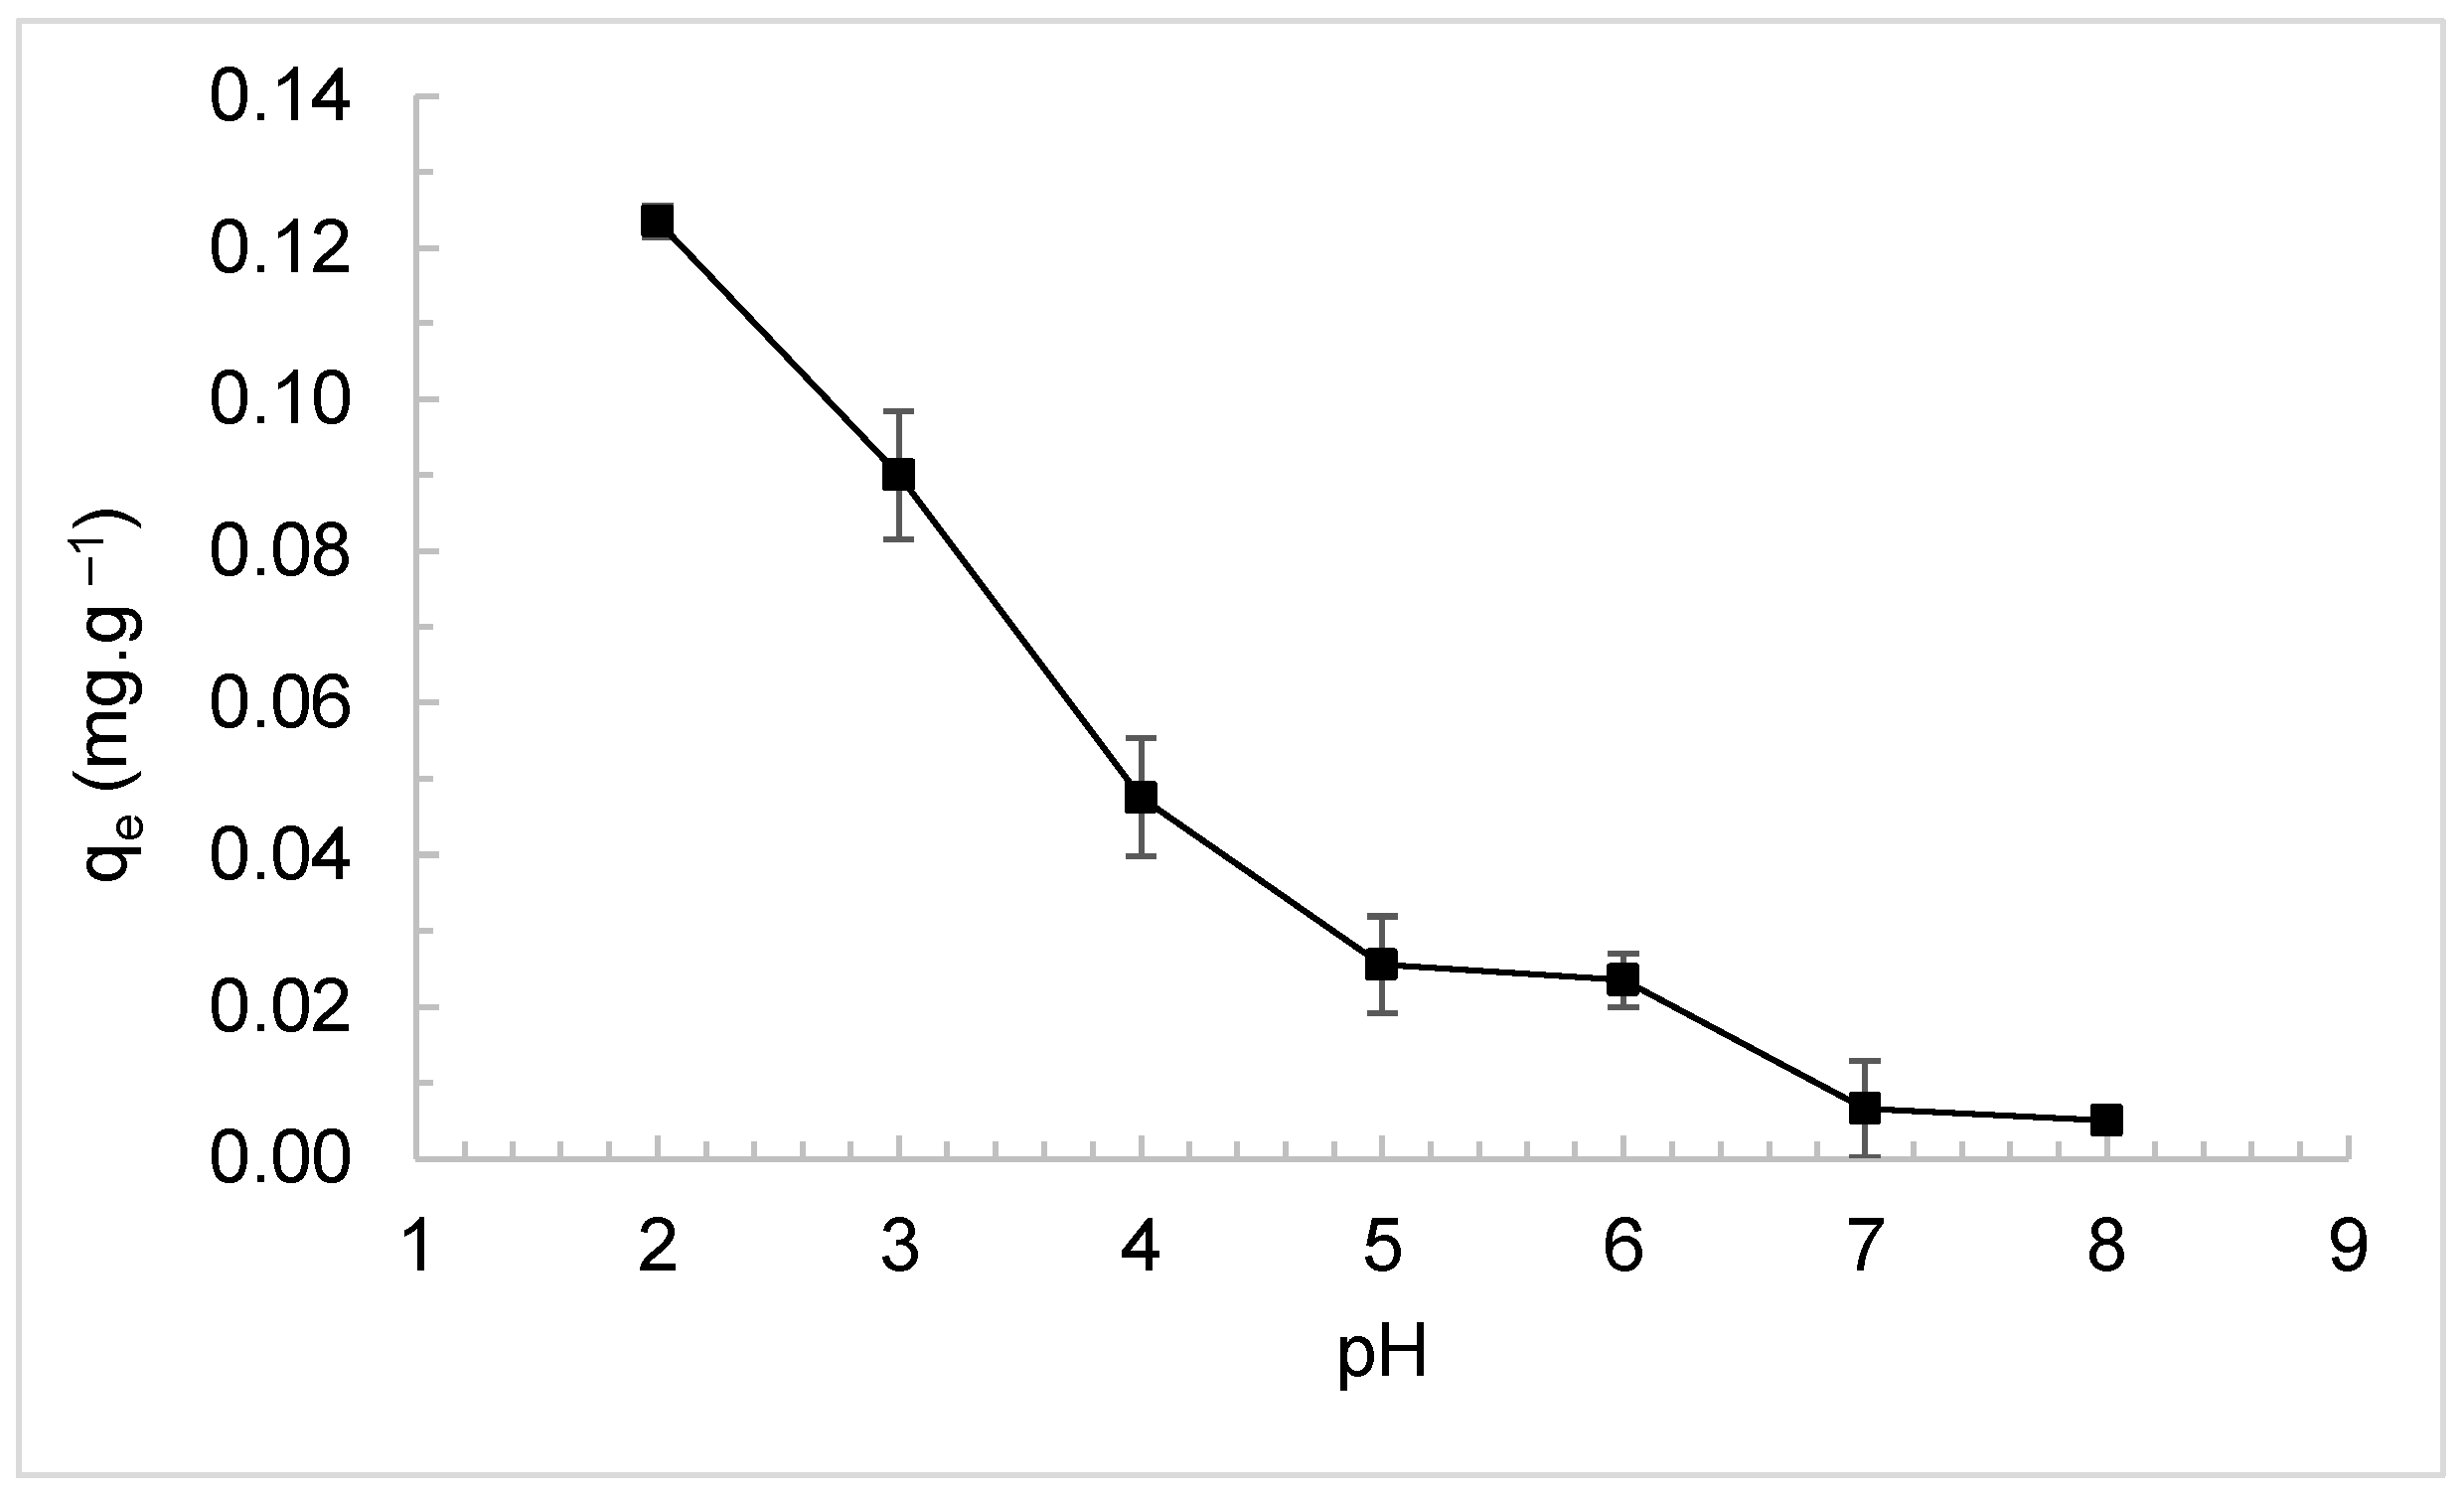
3.2. Effect of pH on Adsorption

The effect of pH values in the liquid medium on the adsorption of F is presented in Figure 6.
It was observed that the highest adsorption capacity and F removal efficiency were 0.124 mg·g−1 (20.62%) at pH 2. As the pH of the medium increased, both parameters significantly decreased. Adsorption at pH values above 8.0 did not yield significant results.
These findings are in line with previous studies in the literature, where the removal of fluoride using biochar derived from watermelon rind [10] and orange peel [79] has also been reported.
The high fluoride removal in an acidic medium is attributed to electrostatic attractions between F ions and positive charges on the adsorbent surface. At alkaline pH values, electrostatic repulsion becomes dominant, leading to decreased adsorption [77]. In this study, this hypothesis is supported by the obtained pHZCP value for BC (4.76), indicating positive surface characteristics due to the pH used (pH = 2.0).
The adsorption mechanism follows a double exchange mechanism in two steps, as indicated by the global Equations (11) and (12) [80].
C O H + H + + F C F + H 2 O
C O H + F C F + O H
where –COH represents the hydroxyl group present on the surface of BC.
In this study, it is believed that the mechanism described in Equation (12) was predominant, considering the increase in pH of the medium after the adsorption of F (data not shown). Thus, the decrease in BC adsorption capacity with increasing pH is attributed to the competition between fluoride and hydroxyl ions (–OH) for adsorption sites [26,60].

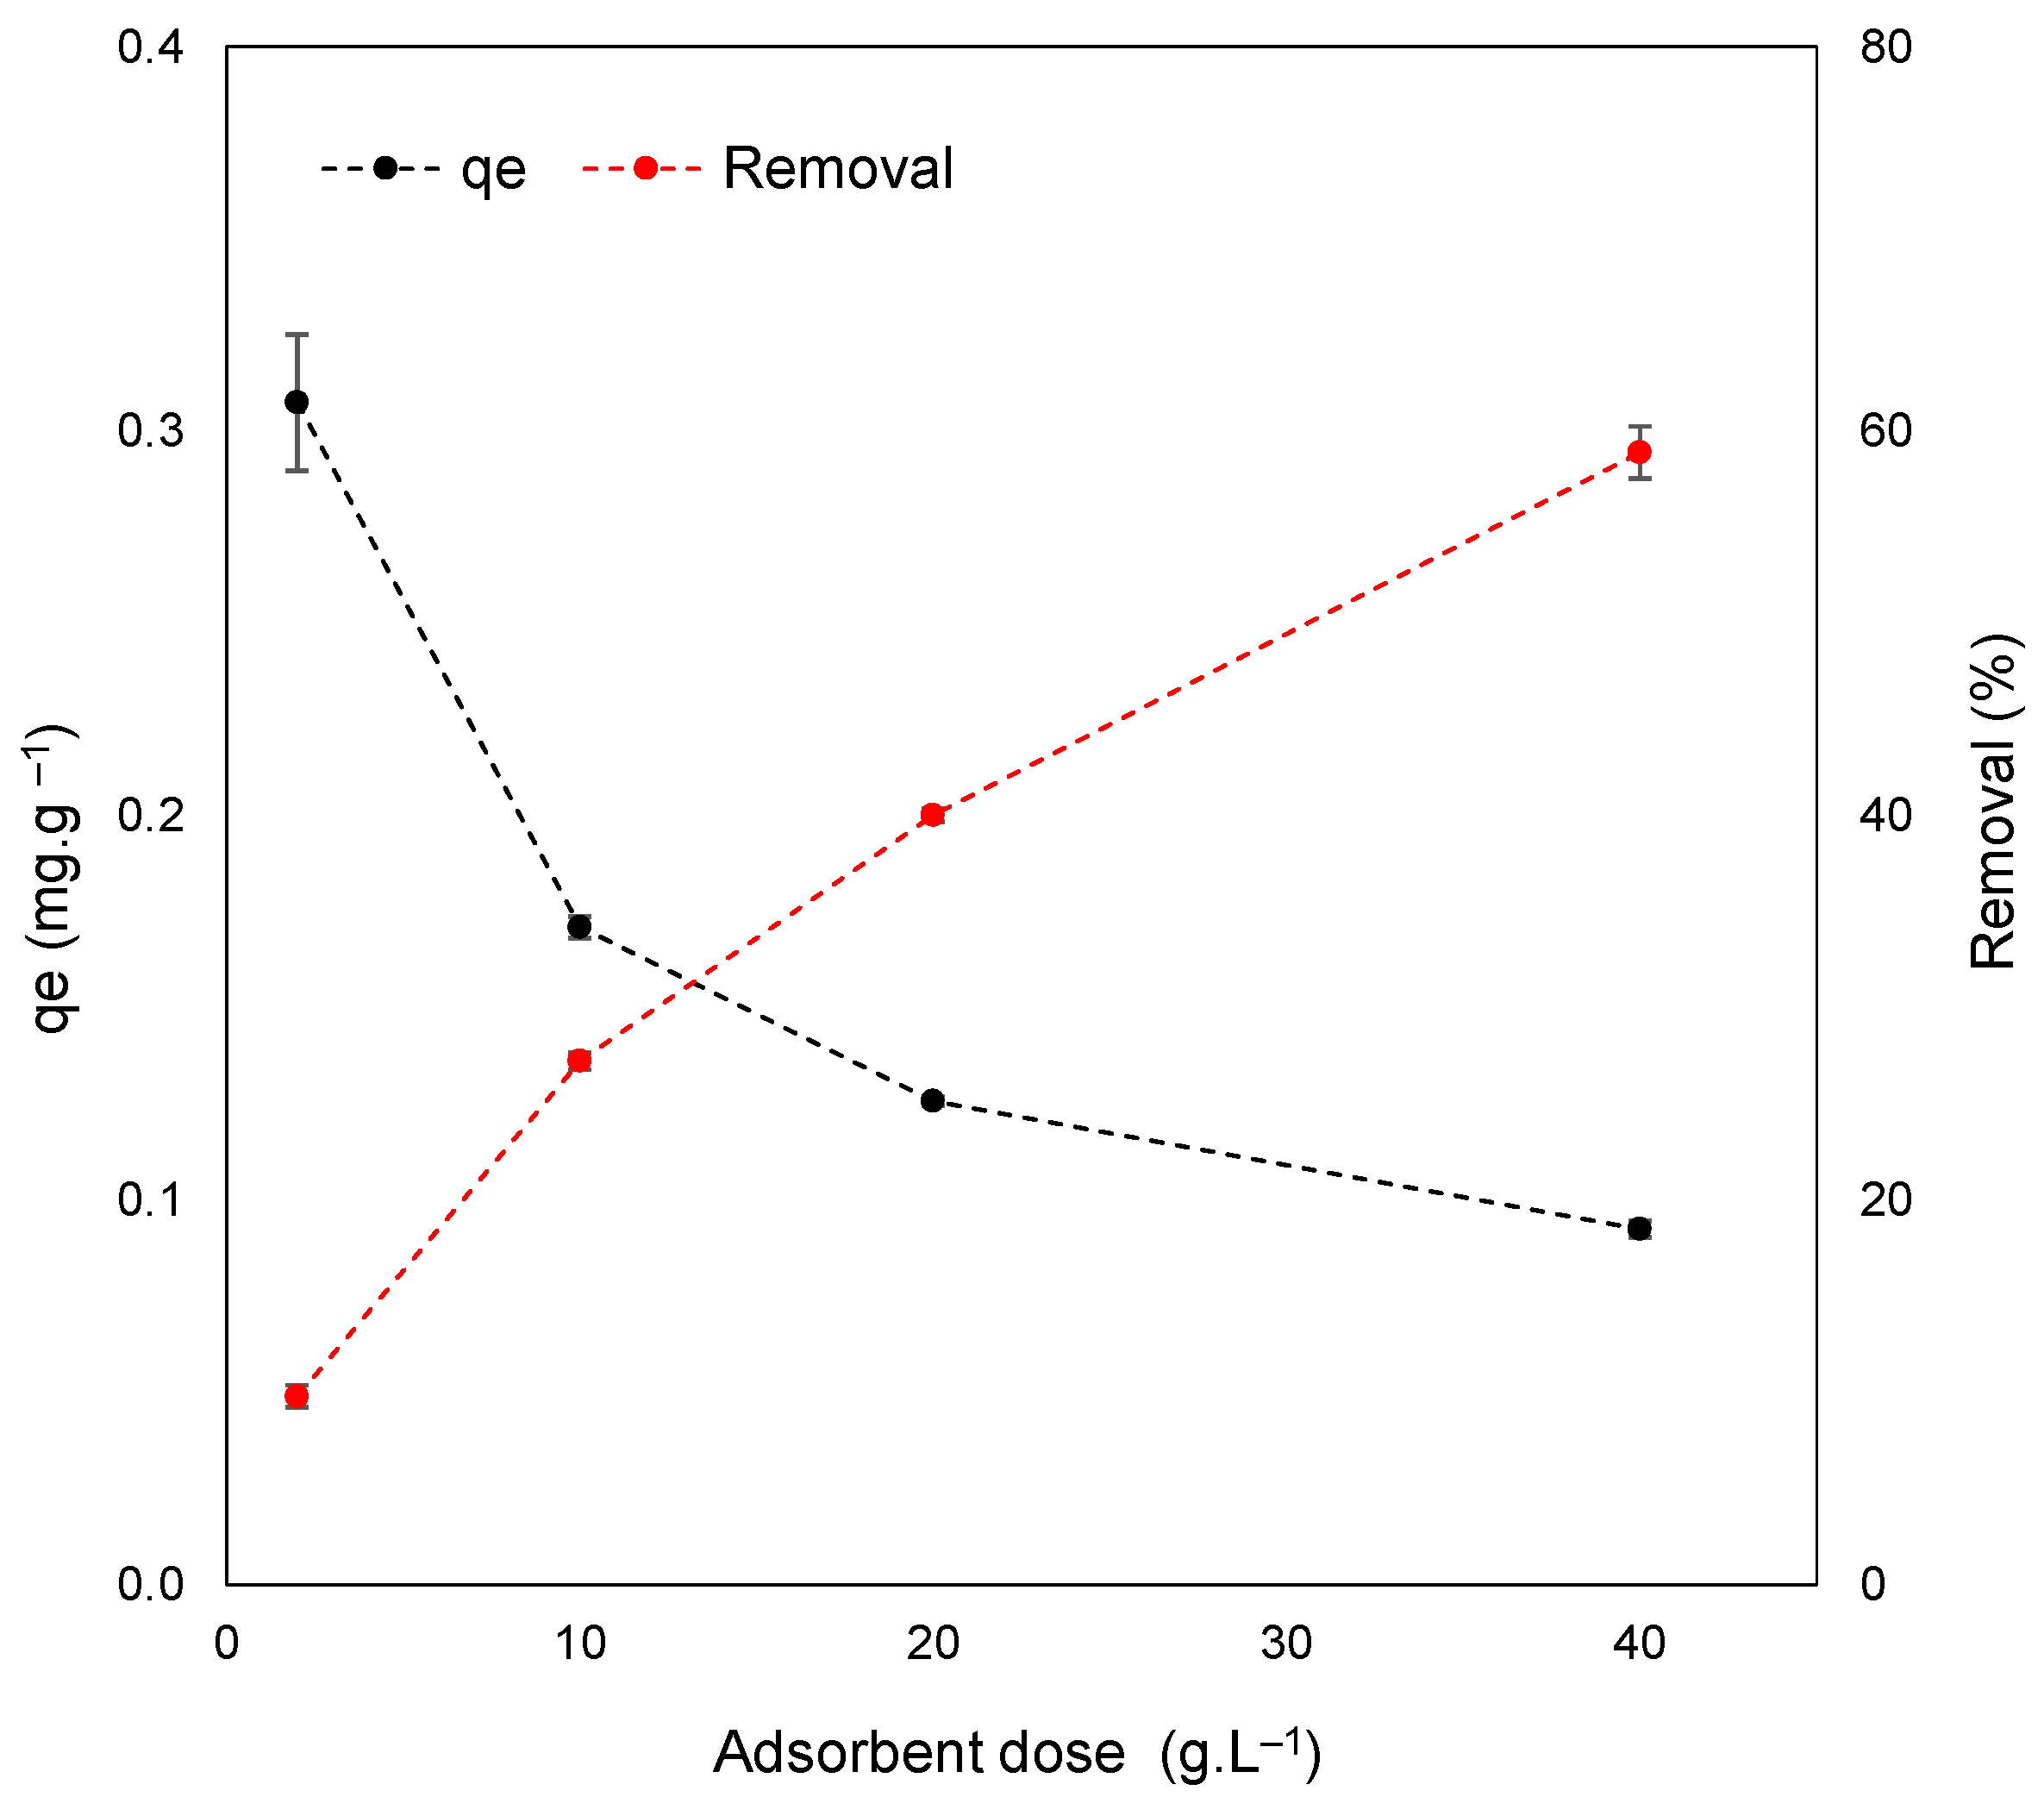
3.3. Effect of Adsorbent Dosage

The relationship between the adsorption capacity and fluoride removal efficiency of BC as a function of adsorbent dosage is illustrated in Figure 7.
Regarding removal efficiency, it is important to consider the availability of active sites, functional groups, and pores on the adsorbent surface [30]. Figure 7 demonstrates a gradual increase in removal efficiency from 10% to 59% when the BC dosage is increased from 2 g·L−1 to 40 g·L−1 under the same conditions. On the other hand, the adsorption capacity (qe) decreased from 0.3 mg·g−1 to 0.1 mg·g−1 with increasing dosage, which was justified by other researchers as a consequence of adsorbent aggregation or non-saturation of active sites on BC [81]. Similar behavior in terms of removal percentage and equilibrium adsorption capacity (qe) has been reported by Sha et al. [75], who investigated the removal of fluoride from an aqueous fluoride solution (500 mg L−1) using biochar derived from Platanus acerifoli leaves and eggshells.
Considering the cost factor, adsorption capacity, and removal efficiency, a BC dosage of 10 g·L−1 was selected as the appropriate dosage, resulting in an adsorption capacity of 0.17 mg·g−1 and a removal efficiency of 27%.

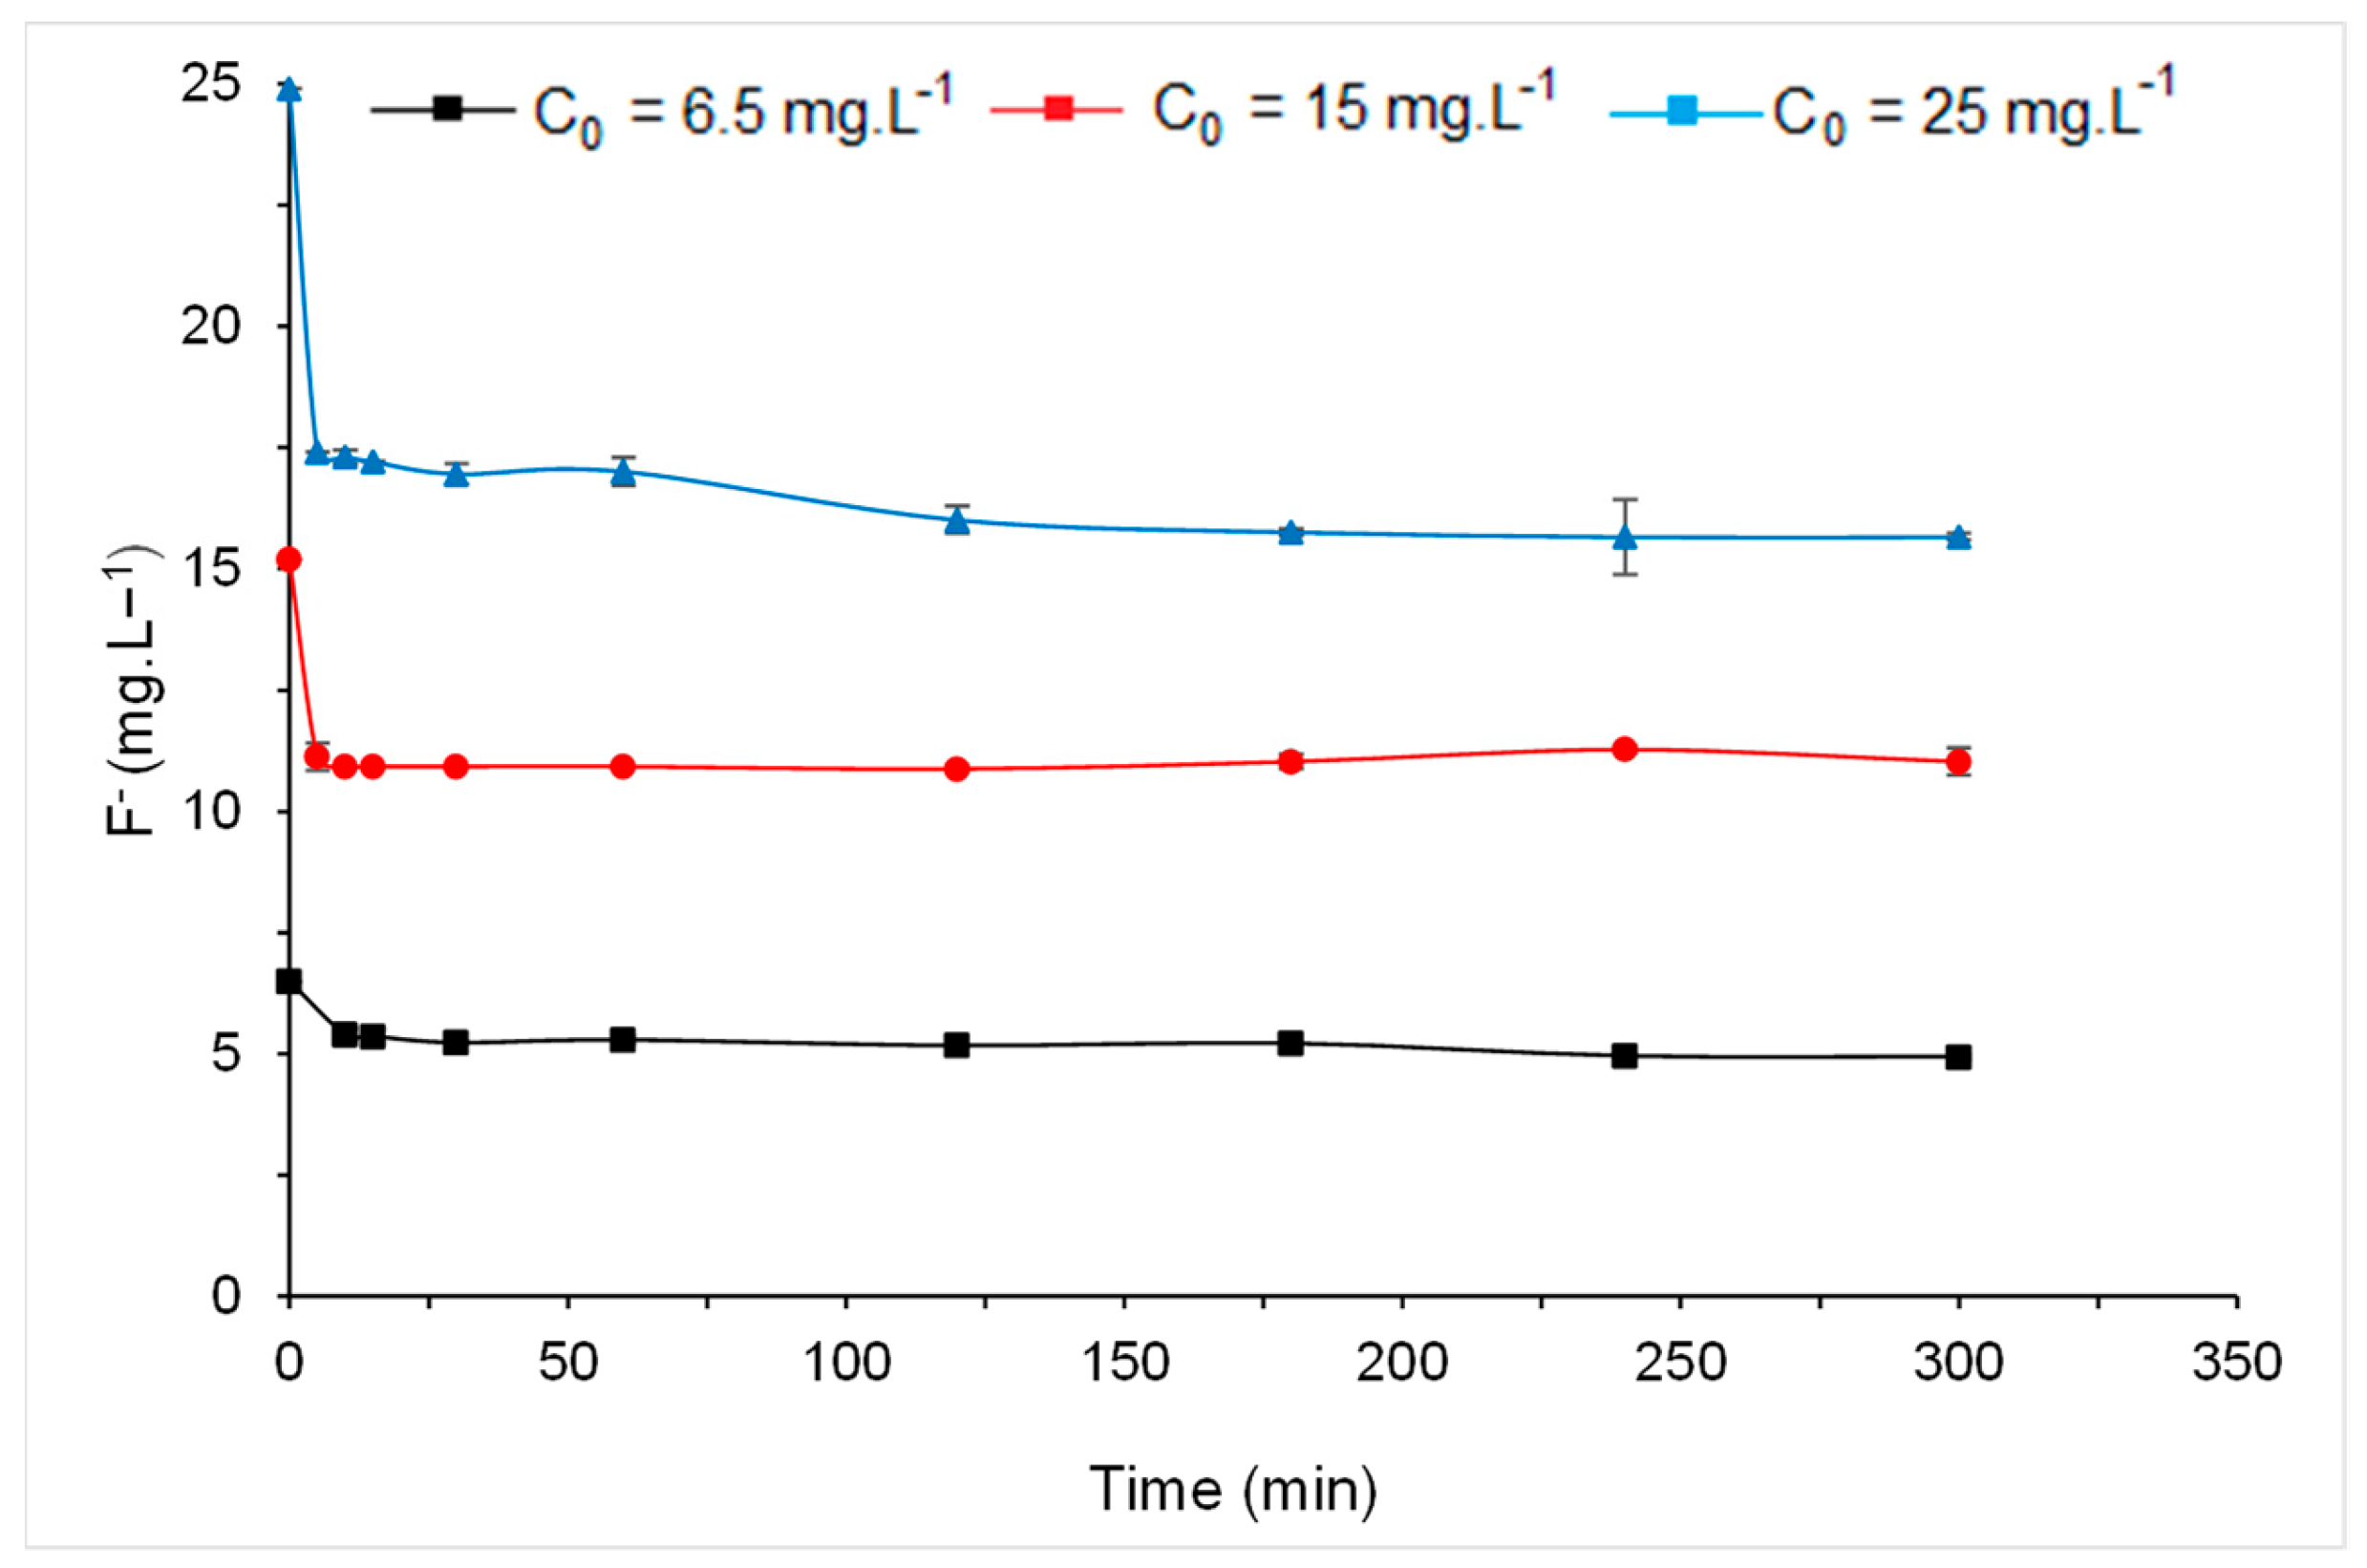
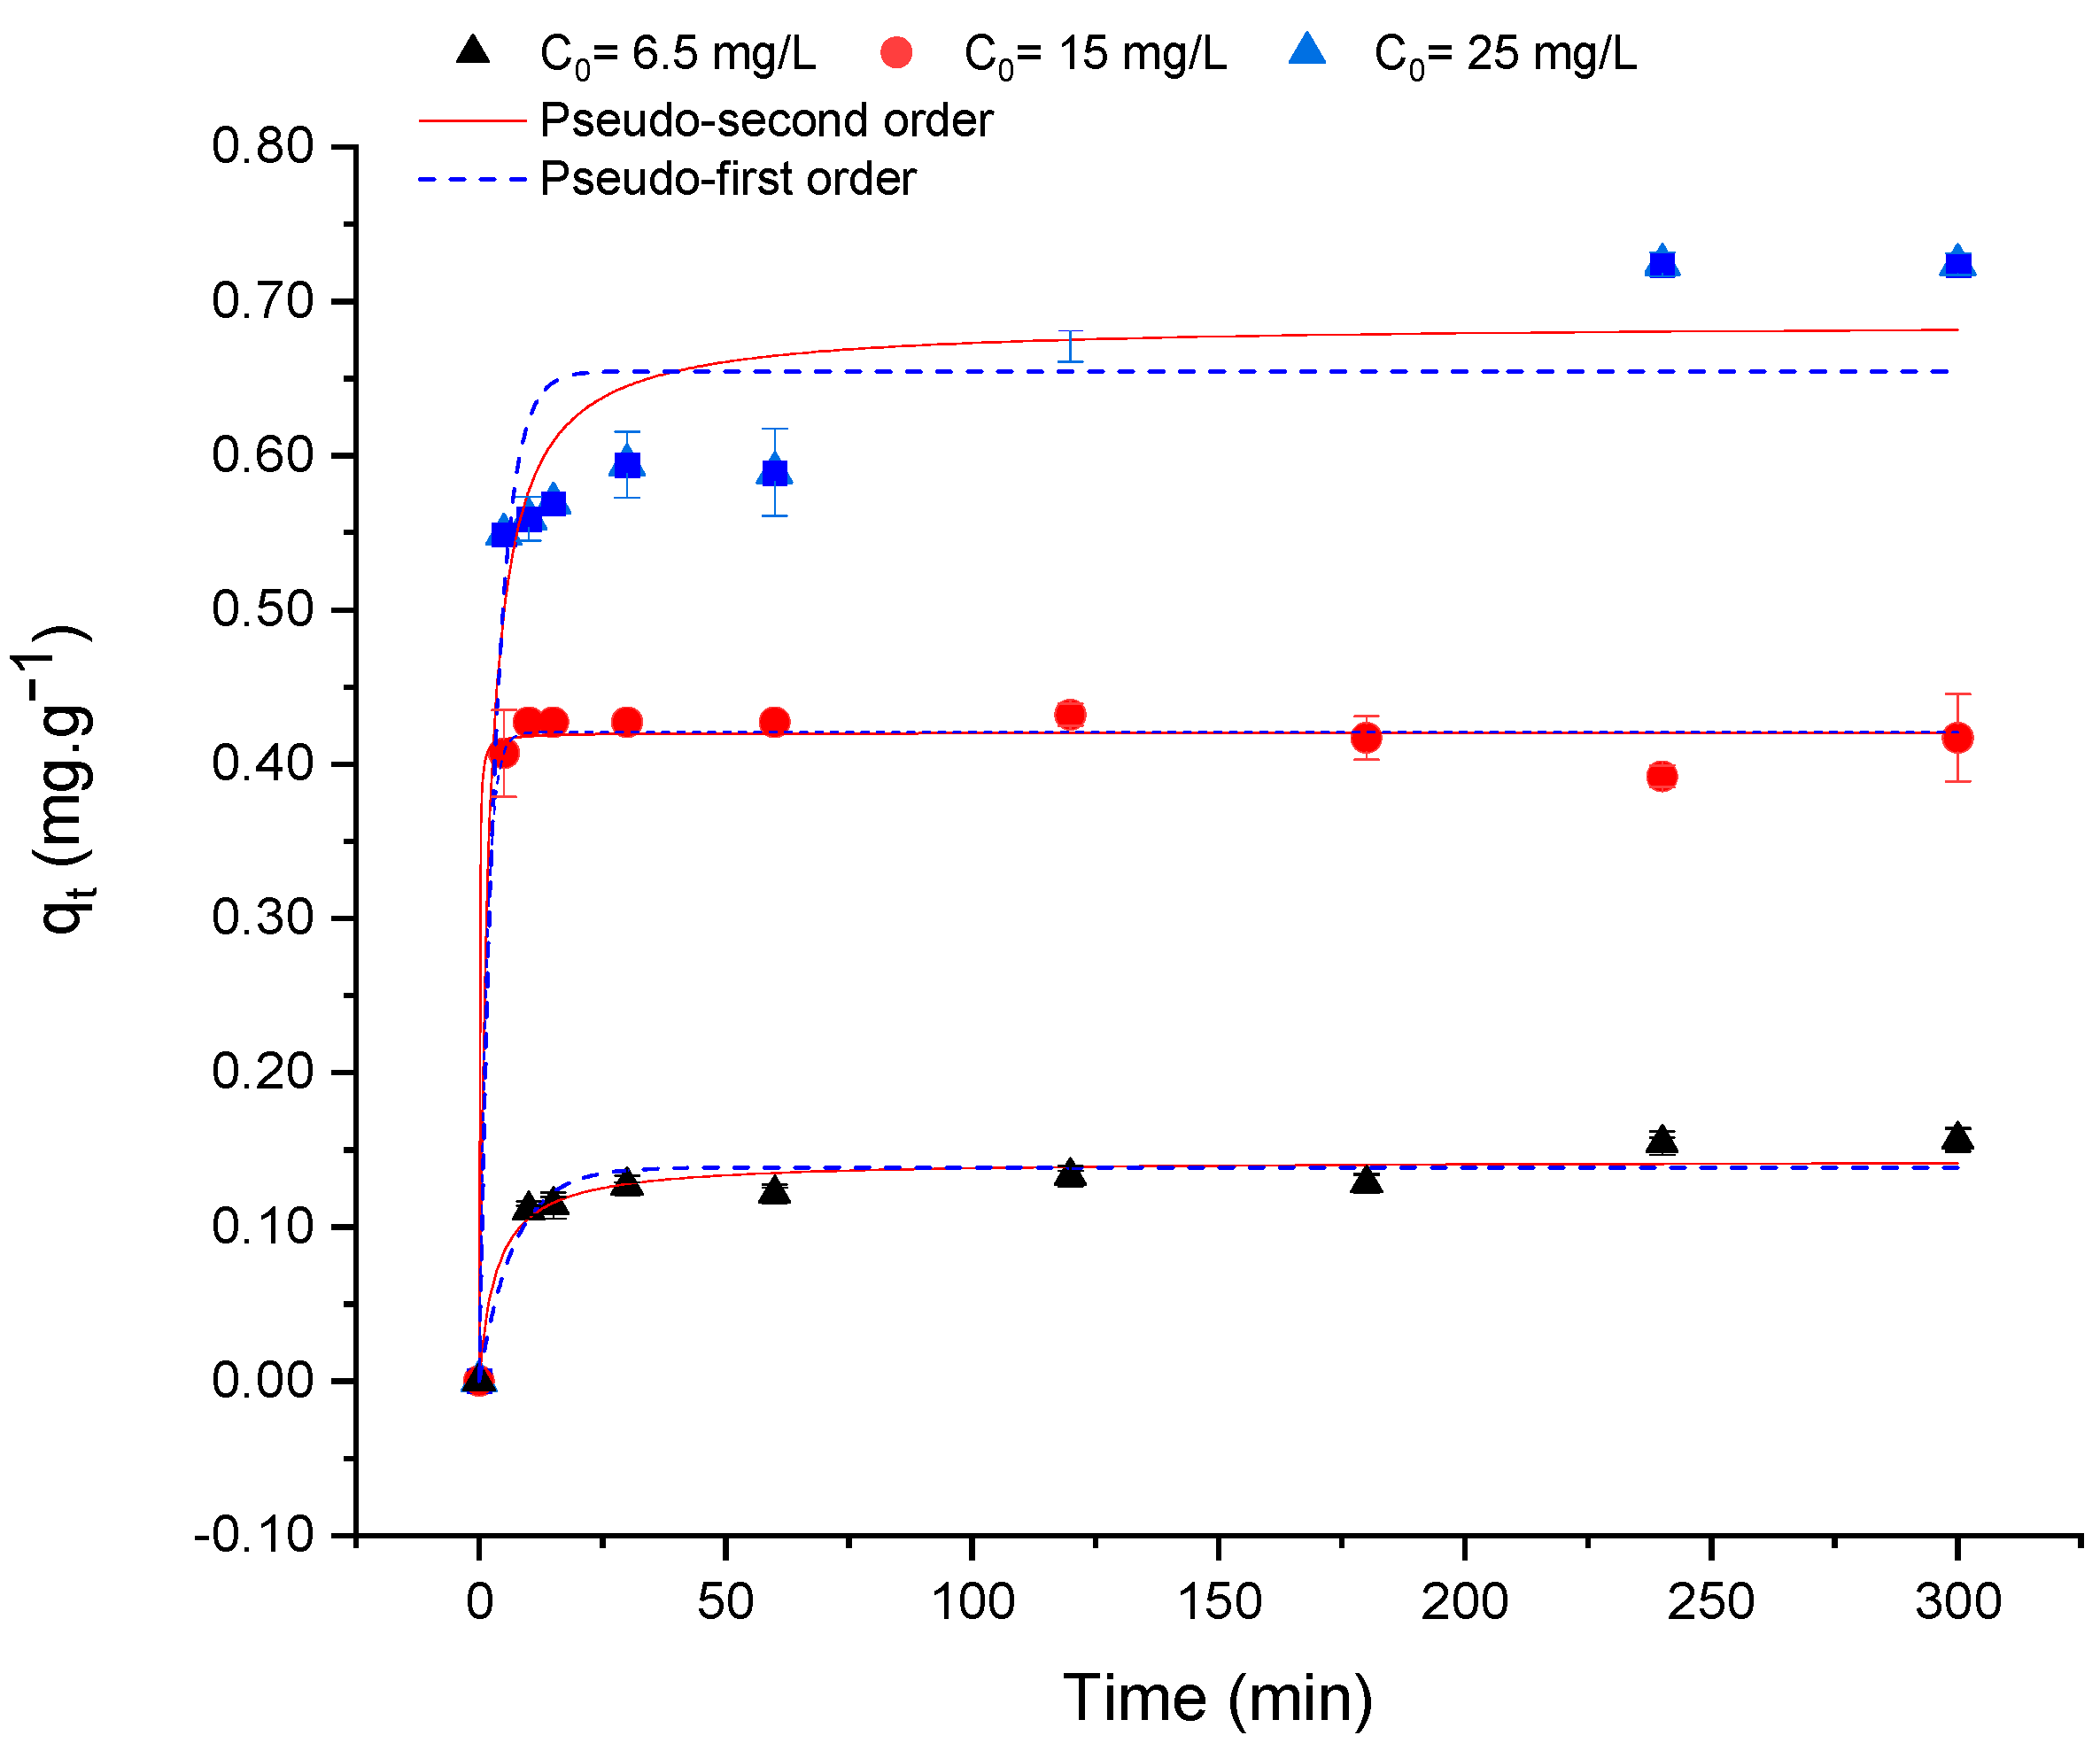
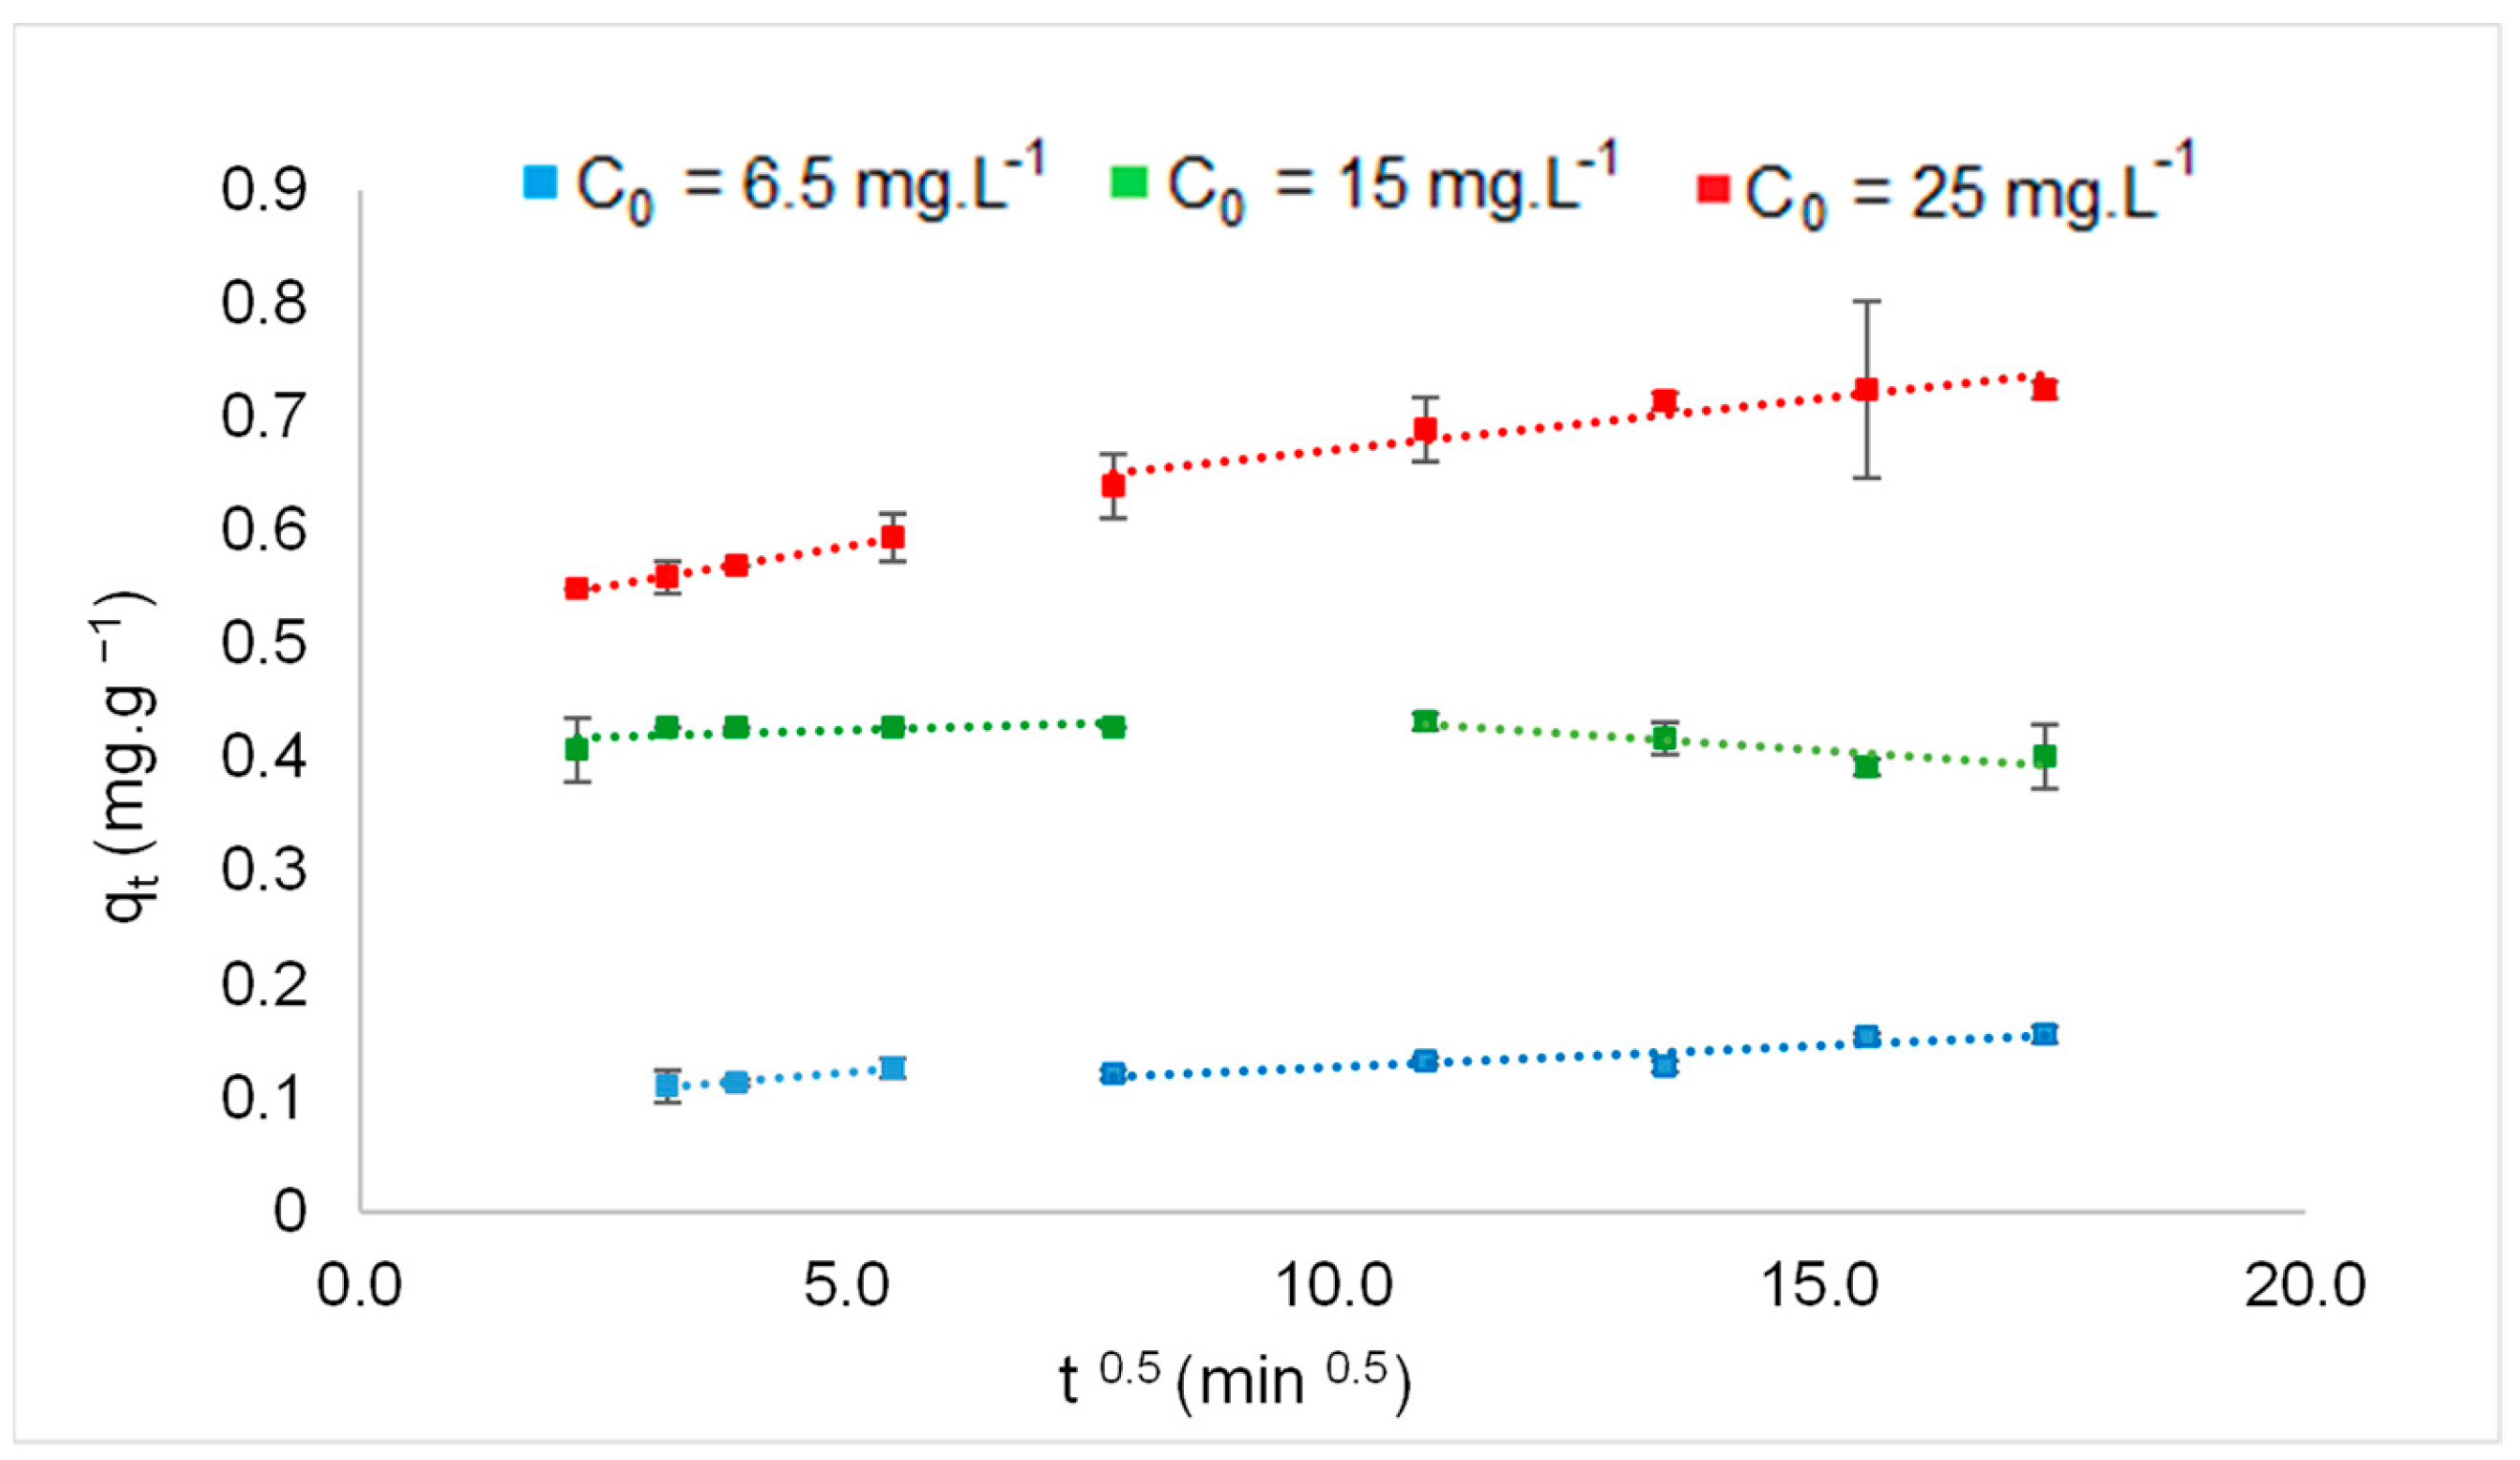
3.4. Influence of Contact Time for Different Concentrations of F

The influence of contact time on different initial concentrations of F is presented in Figure 8.
Regardless of the initial concentration of F, the majority of adsorption occurred within the first 5 min, resulting in adsorption capacities of 0.111 mg·g−1, 0.407 mg·g−1, and 0.549 mg·g−1 for concentrations of 6.5 mg·L−1, 15 mg·L−1, and 25 mg·L−1, respectively, corresponding to removals of 17%, 27%, and 25%. An increase in F concentration from 6.5 mg·L−1 to 15 mg·L−1 led to a 10% increase in removal. However, when the concentration increased to 25 mg·L−1, the removal remained relatively constant. Previous studies have reported similar results and attributed them to a high proportion of active sites in BC available for adsorption at low F concentrations, resulting in greater mass transfer and diffusion from the fluid to the adsorbents. However, at higher adsorbate concentrations, limited availability of active sites for F adsorption has been observed [23,30,80].
Over time, there is a slight oscillation of the adsorbate concentration in the solution, indicating recurring desorption, which is a consequence of interactions between the adsorbate, solution, temperature, and pH [82].
The fitting of kinetic models for different initial concentrations of F is presented in Figure 9, while the kinetic parameters are provided in Table 2.
An adsorption kinetics study was conducted to evaluate the adsorption mechanism, which determines the velocity and mass transfer from the solution to the adsorbent surface [30]. The results show that the experimental data for different concentrations of F satisfactorily fit both models (Figure 9). However, based on the R2 values and a comparison between the experimental adsorption capacity (qeexp) and the adsorption capacity (qe) calculated by Equations (3) and (4), it can be observed (Table 2) that a specific model predominates depending on the initial concentration of F, namely pseudo-first-order (F = 6.5 mg·L−1), pseudo-second-order (F = 25 mg·L−1), or no clear predominance (F = 15 mg·L−1).
The pseudo-first-order model postulates that the rate of occupation of active sites on the adsorbent surface is directly proportional to the number of unoccupied sites [83]. It suggests that the adsorption of F on the adsorbent is primarily governed by physical diffusion [75] and may occur prior to chemical adsorption during the slow adsorption step [36].
The pseudo-second-order model proposes electron exchange between the adsorbate and the adsorbent in a chemical adsorption process taking place on the active sites of the solid surface, forming a monolayer [26,84]. Generally, experimental data in the literature concerning F removal by adsorption better fit the pseudo-second-order model [23,24,26,80,85].
To gain insight into the limiting step of the adsorption process, the data were also fitted to the Weber–Morris model (Figure 10).
The results, as presented in Figure 10, suggest that the adsorption process of F on BC occurs in two stages, consistent with existing results that reported the occurrence of an initial stage of external surface sorption, followed by a second stage of intraparticle diffusion [42]. However, since the lines do not intersect the origin, it can be concluded that intraparticle diffusion is not the limiting step of the process [80].

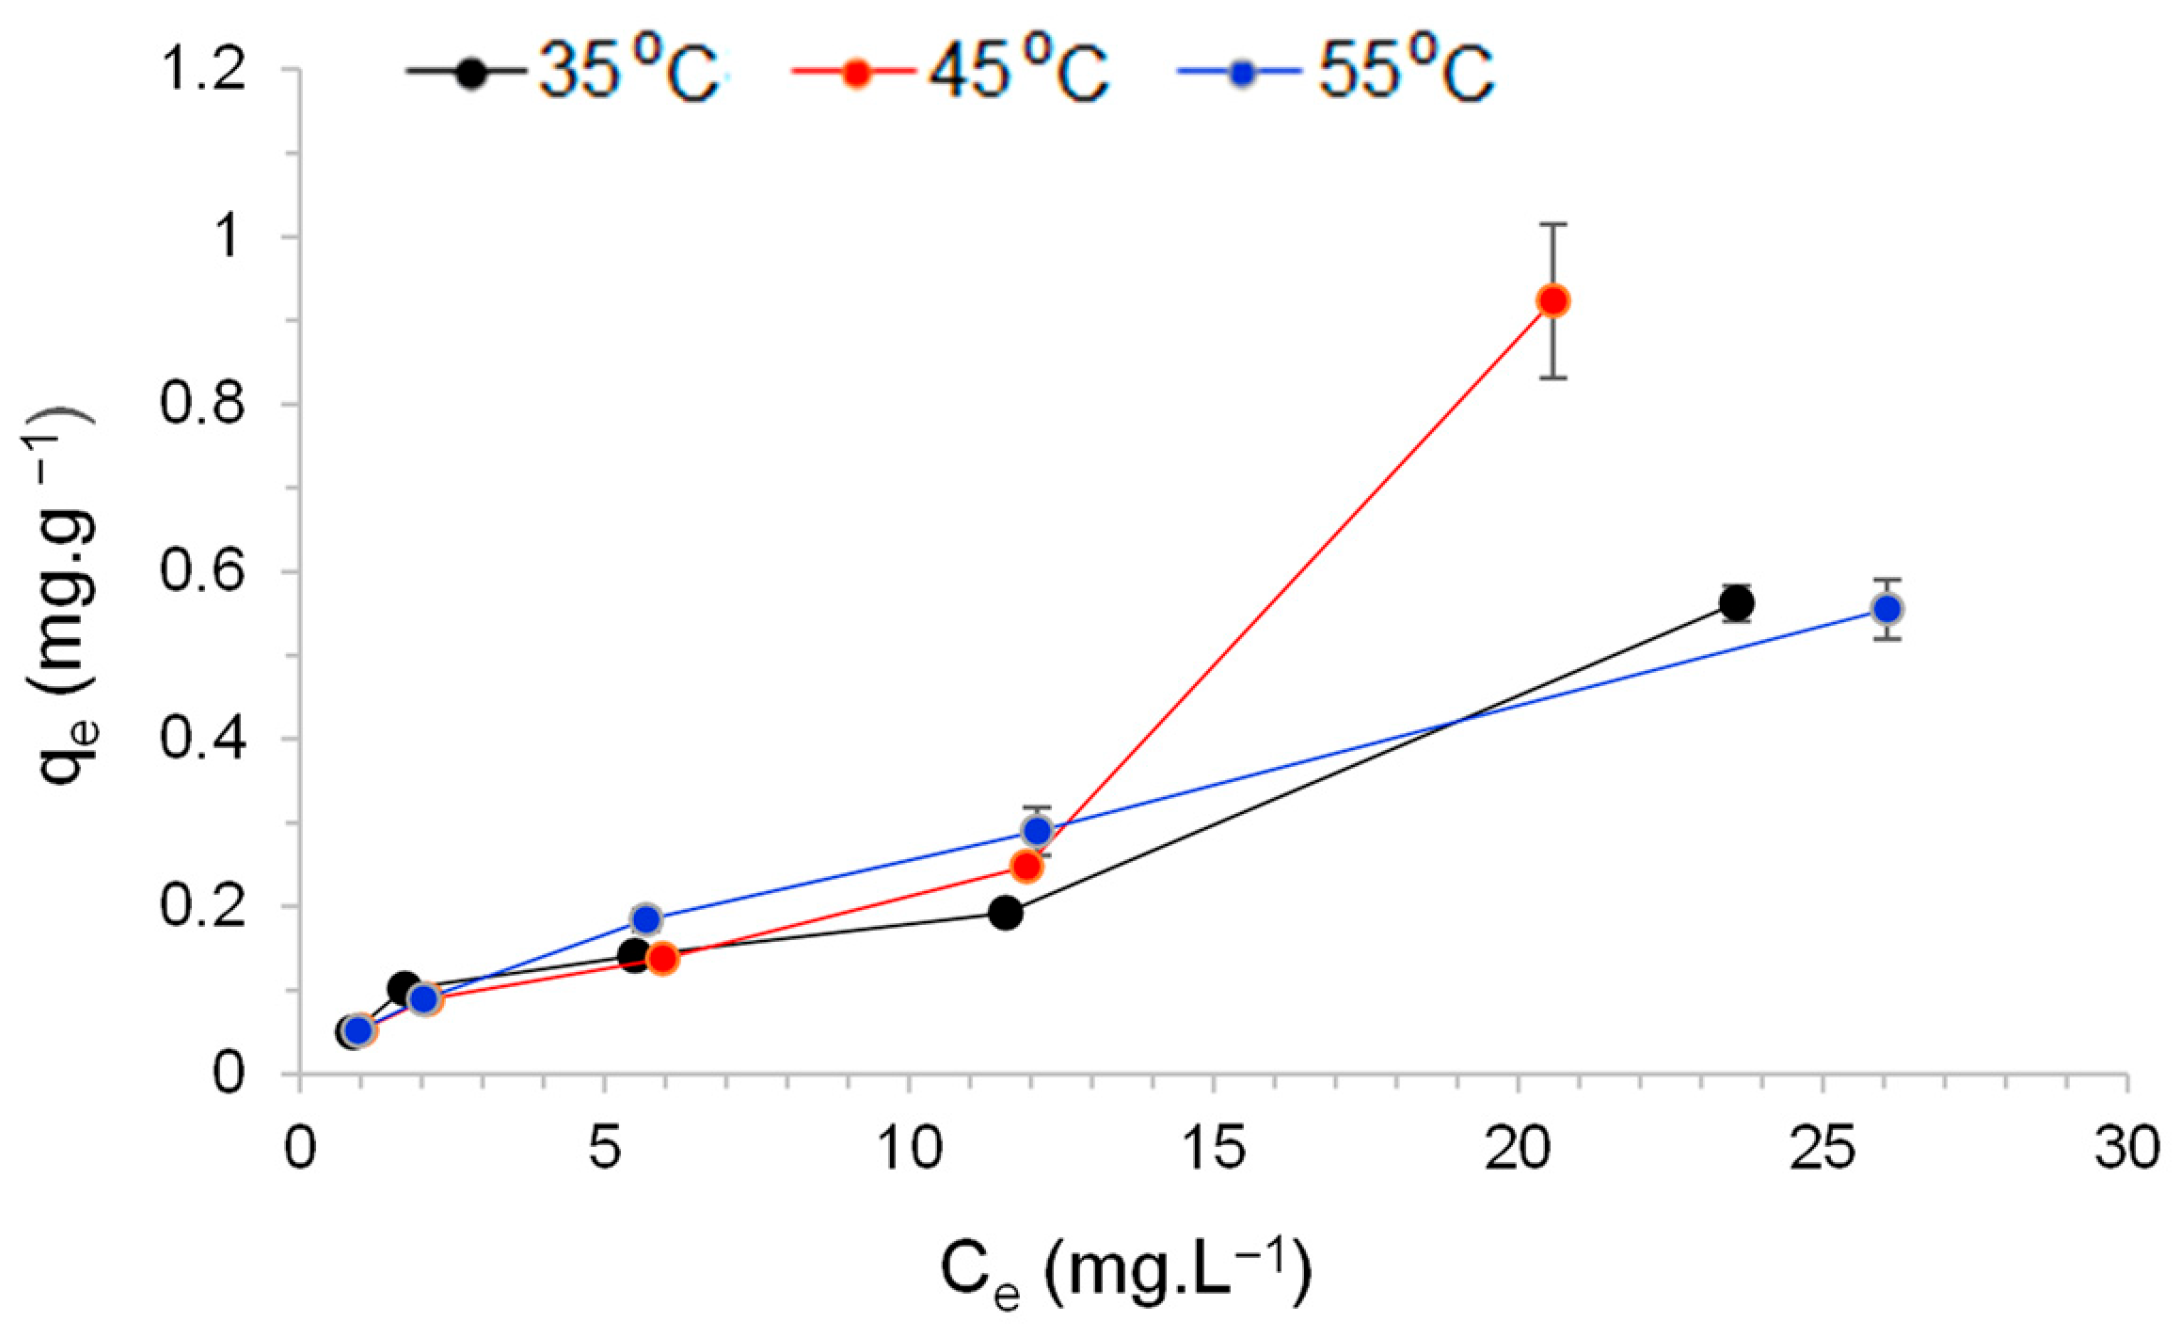
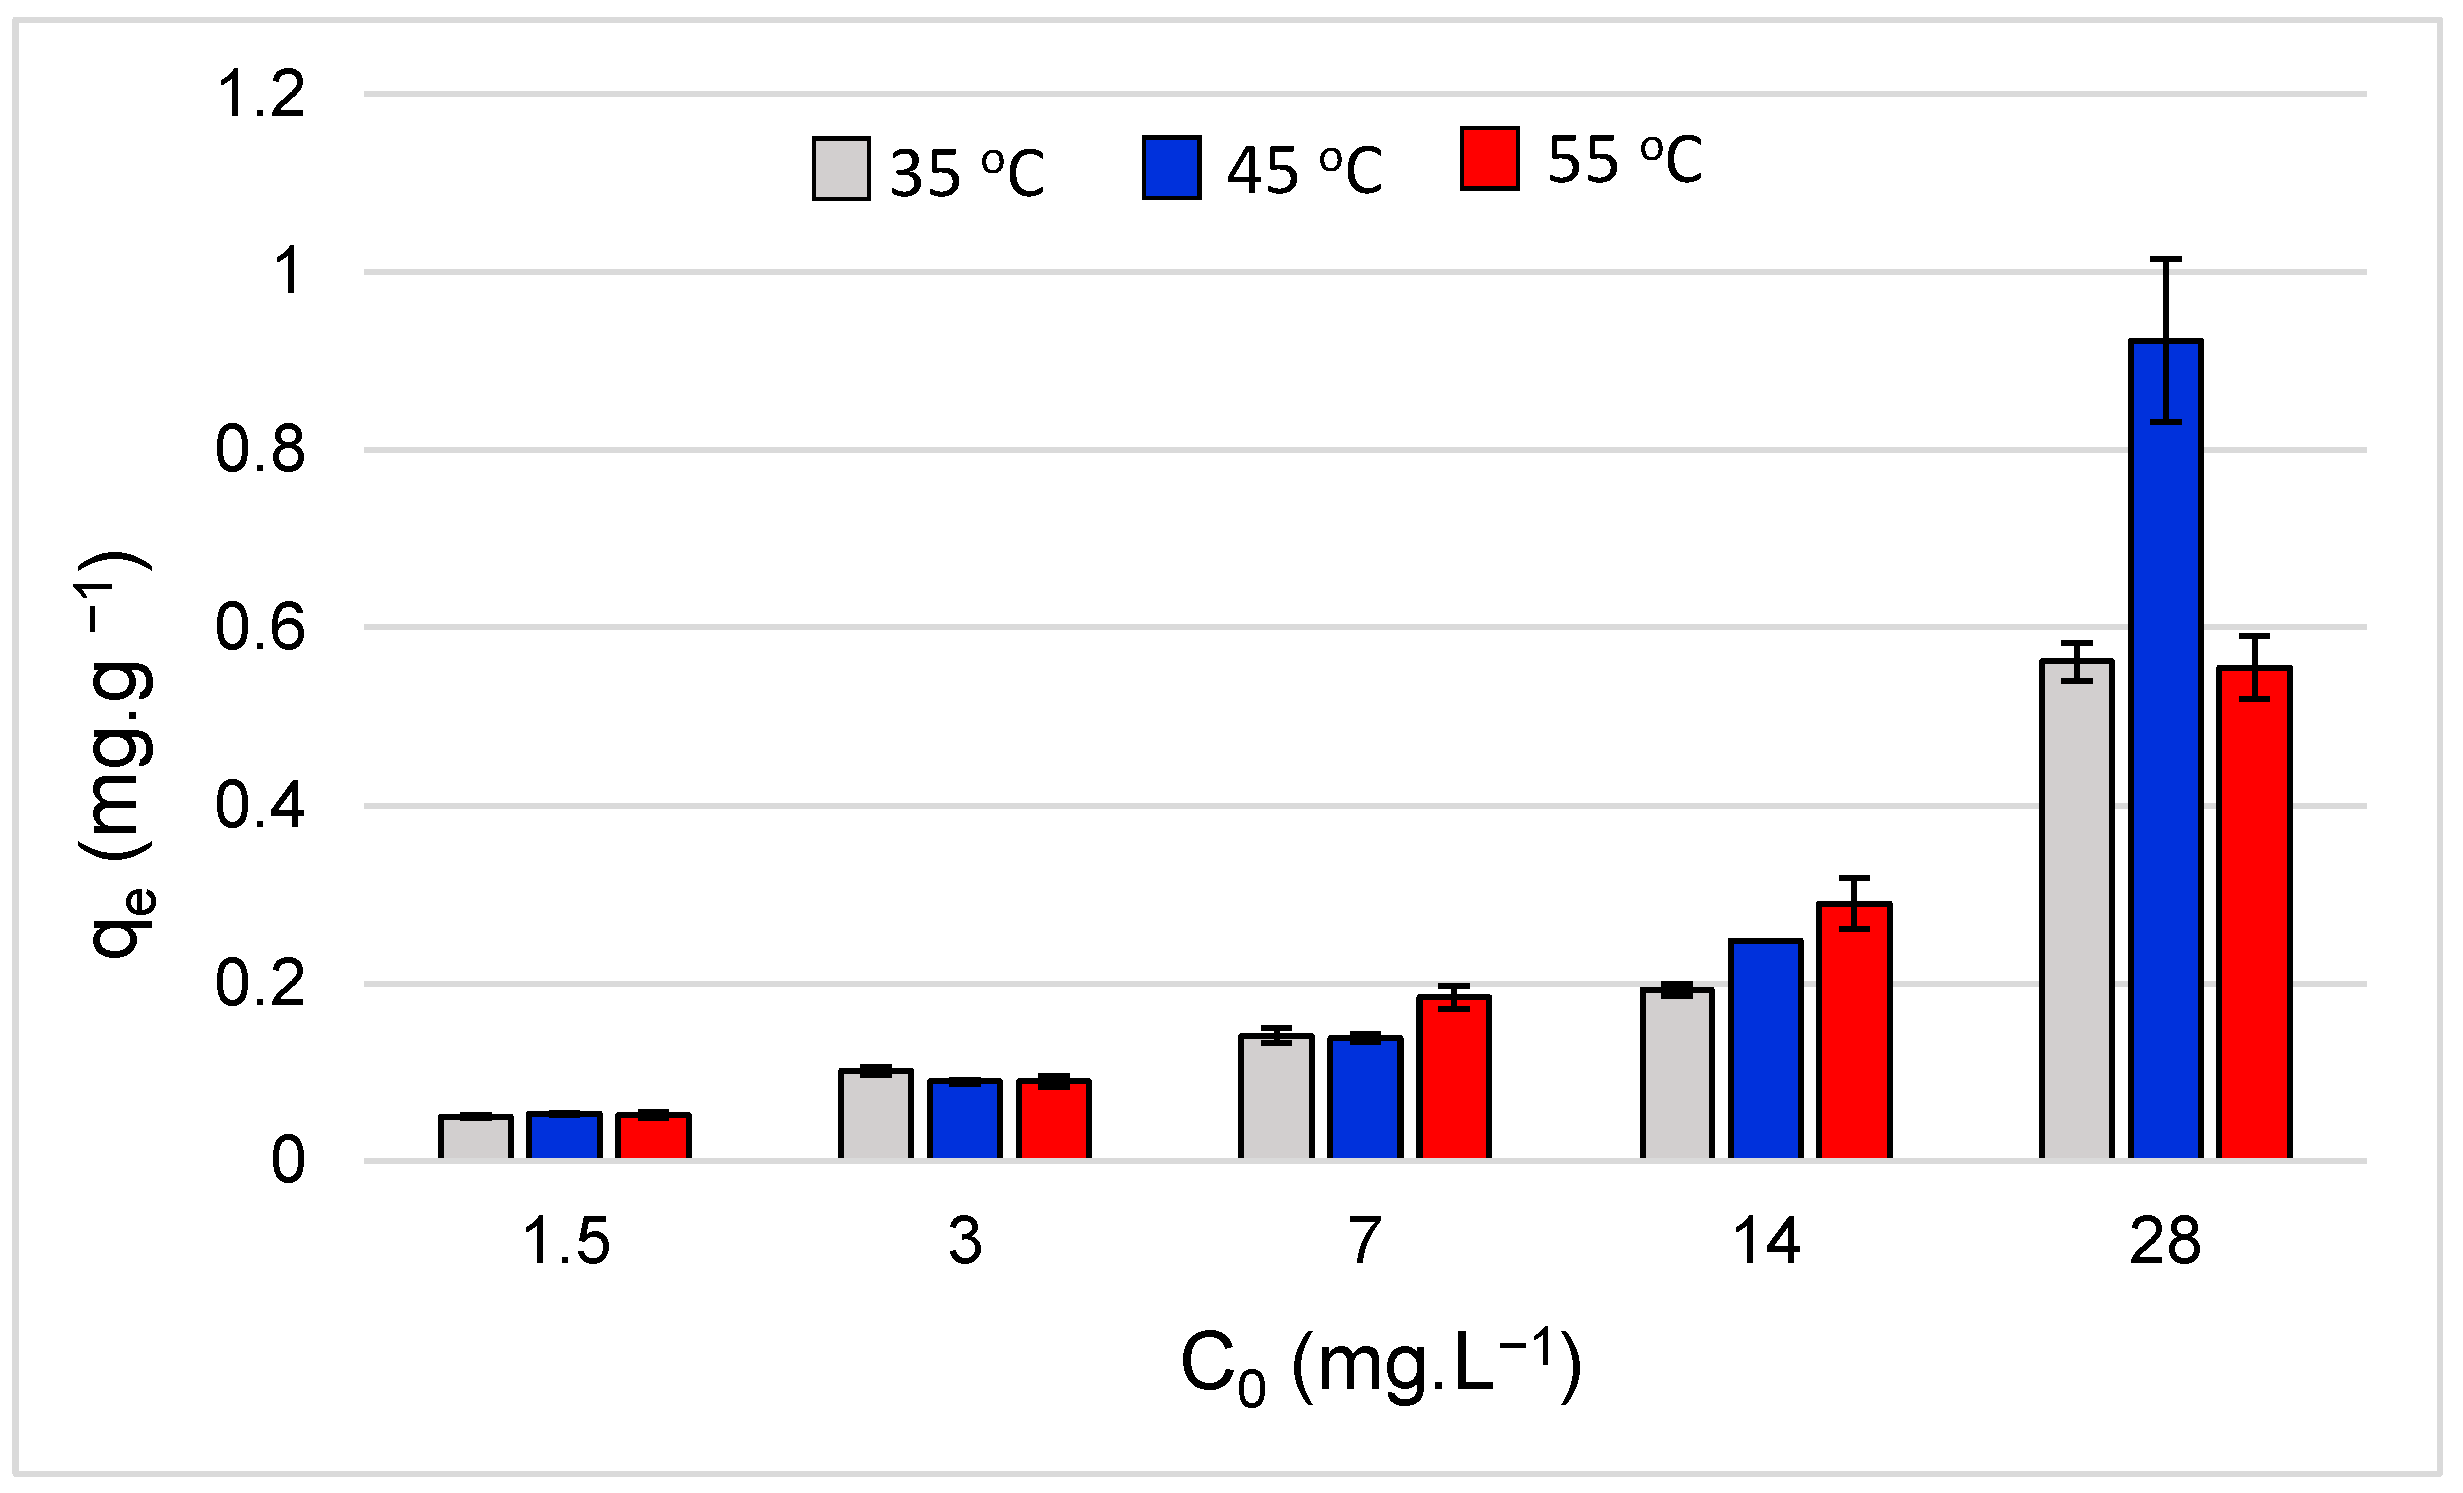
3.5. Influence of Temperature on Adsorption Capacity

Figure 11 illustrates the influence of temperature on the adsorption capacity (qe) of BC for different initial concentrations (Co) of F.
For the lowest C0 of F, temperature variations did not significantly affect the adsorption capacity, particularly for initial concentrations of 1.5 mg·L−1, 3.0 mg·L−1, and 7.0 mg·L−1. However, a more noticeable impact was observed in the behavior of the adsorption isotherms, especially at higher concentrations of F, as shown in Figure 12.
The Langmuir and Freundlich models were used to fit the isotherm curves, as depicted in Figure 13. Both models provided adequate adjustments for equilibrium concentrations (Ce) between 1 mg·L−1 and 12 mg·L−1. However, for higher Ce values, the adjustments were inconsistent (data not shown). A previous study reported a similar phenomenon and associated it with a two-phase adsorption process based on Ce (mg·L−1) of F. At low concentrations, the Langmuir model best described the process, indicating chemosorption and saturation of the adsorbent surface with a monolayer of F ions. In contrast, at higher concentrations, the process can be described as physisorption, as postulated by others [76].
Upon analyzing the adsorption parameters obtained for the Langmuir and Freundlich models (Table 3), it was observed that the R2 values for the Langmuir model, although high (R2 ≥ 0.95), were slightly lower than those obtained for the Freundlich model. Furthermore, the experimental adsorption capacity (qe) values (Ce interval between 1 mg·L−1 and 12 mg·L−1) at temperatures of 35 °C, 45 °C, and 55 °C were 0.192 mg·g−1, 0.248 mg·g−1, and 0.290 mg·g−1, respectively, deviating from the qm values calculated by the Langmuir model (equation 6) shown in Table 3. Authors studying the removal of F in BC produced from the stem of Catha edulis also observed a similar behavior and suggested that the Langmuir model may not be the predominant adsorption mechanism in such cases, as complete coverage of all available sites was not achieved [56].
The Freundlich isotherm postulates the existence of energetically heterogeneous adsorption sites on the adsorbent surface, allowing for multilayer adsorption and resulting in adsorbent saturation [56]. Examining the parameters of the Freundlich model, it is evident that all values of 1/n were >1, indicating weak and cooperative adsorption [86], where adsorbates interact with each other to form several layers on the surface, with the first layer remaining incomplete [87]. When both models exhibit high R2 values, it suggests that adsorption is the outcome of a combination of homogeneity and heterogeneity [88].
Another notable observation is that, at a temperature of 55 °C, not only were the adjustments more satisfactory, but the experimental qm value was also higher, increasing from 0.22863 mg·g−1 (at 35 °C) to 0.53203 mg·g−1 (at 55 °C). The solution temperature plays a vital role in governing physical–chemical surface adsorption, intraparticle diffusion rates, and internal chemical interactions [36]. In this case, as it has been postulated by others [89], the increase in obtained results indicates enhanced diffusion of the adsorbate molecules across the external and internal boundary layers within the BC particle pores.

3.6. Adsorption Thermodynamics

Table 4 presents the thermodynamic parameters, including the Gibbs free energy (∆G°), enthalpy (∆H°) and entropy (∆S°), derived from the adsorption isotherms of F at temperatures of 35 °C, 45 °C and 55 °C.
As ∆G > 0 and ∆H > 0, the process is characterized as endergonic, with energy being supplied during the F adsorption process [90]. Additionally, the increase in ∆G with rising temperature demonstrates the favorable nature of F adsorption with increasing temperature [30], which justifies the higher adsorption capacity (qe) observed at elevated temperatures. Notably, when ∆H assumes a positive value, with ∆H < 25 kJ·mol−1, it may indicate physisorption, wherein the adsorbate’s interaction with the adsorbent surface is relatively weak, keeping the chemical nature of the adsorbate intact and allowing for multilayers to form [91,92]. The negative value of ∆S suggests a low affinity of F for the adsorbent, leading to reduced randomness at the solid–liquid interface during adsorption [26].
The presented thermodynamic results can explain the lower adsorption capacities obtained compared to other studies reported in the literature (Table 5).
As observed in the data presented in Table 5, the maximum adsorption capacity (qm) achieved by the biochar (BC) in the present study was similar to that obtained in a study conducted with commercial granular activated carbon (GAC) [93]. GAC is known to have relatively low adsorption capacity and low affinity for inorganic pollutants such as fluoride [9].
On the other hand, the equilibrium adsorption capacity (qe) obtained in the present study was lower than the values reported for other biochars. However, considering that adsorption is also influenced by experimental conditions such as initial pH, adsorption temperature, adsorbent dosage, fluoride concentration, and so on, it is challenging to make direct comparisons [75]. Nonetheless, it is noteworthy that the difference in qm value obtained for the biochar in our study is significantly higher when compared to the qm values for biochar that underwent some form of chemical modification.
Chemical modification alters the surface properties of adsorbents, increasing their potential for adsorbing specific species [93]. Therefore, the chemical modification of the surface of the biochar produced from coffee grounds could enhance its potential as an adsorbent for fluoride removal in water.

4. Conclusions

The aim of this study was to evaluate the fluoride adsorption capacity of biochar (BC) produced from coffee grounds at the biomass stabilization temperature (500 °C) without any chemical or physical modification. The BC exhibited a surface area of 12.94 m2·g−1 and a pore volume of 0.0349 cm3·g−1.
The adsorption of fluoride onto BC was found to be pH dependent, with a decline in performance observed as the pH increased from 2.0 onwards.
The removal of F ions occurred within the initial 5 min and adsorption equilibrium was achieved after 1 h of testing, regardless of the initial concentration of F ions (6.5 mg·L−1, 15 mg·−1, and 25 mg·L−1). Fitting the experimental data to the Webber–Morris model revealed a two-step adsorption process for F ions in BC, involving external surface sorption followed by intra-particle diffusion.
Regarding the adsorption isotherms, both the Langmuir and Freundlich models provided satisfactory fits for initial F concentrations ranging from 1.5 mg·L−1 to 14 mg·L−1, yielding a maximum adsorption capacity (qm) of 0.53 mg·L−1 (at T = 55 °C). However, monolayer adsorption was not the dominant mechanism.
Based on the thermodynamic parameters (∆G > 0 and ∆H > 0), the adsorption process can be characterized as endergonic with a prevailing physisorption phenomenon. The negative value of ∆S indicates a low affinity of F ions for BC.
The obtained results suggest that coffee grounds have the potential for BC production. However, surface structure modifications are necessary to enhance the affinity of BC for F ions and thus increase its adsorption capacity.

Author Contributions

Conceptualization, H.V.R.d.S., R.M.F.C., P.S.S. and F.J.C.T.; methodology, R.M.F.C. and H.V.R.d.S.; software, R.M.F.C. and F.J.C.T.; validation, R.M.F.C., F.J.C.T., P.S.S. and H.V.R.d.S.; formal analysis, P.S.S., R.M.F.C., F.J.C.T. and H.V.R.d.S.; investigation, H.V.R.d.S. and R.M.F.C.; resources, P.S.S. and R.M.F.C.; data curation, H.V.R.d.S.; writing—preparation of the original draft, H.V.R.d.S. and R.M.F.C.; writing—proofreading and editing, R.M.F.C., P.S.S., F.J.C.T. and H.V.R.d.S.; visualization, R.M.F.C., P.S.S., F.J.C.T. and H.V.R.d.S.; supervision, R.M.F.C. and H.V.R.d.S.; project management, P.S.S.; financing acquisition, P.S.S. All authors have read and agreed to the published version of the manuscript.

Funding

Payment from APCN, Coordenação de Aperfeiçoamento de Pessoal de Nível Superior—CAPES—Brasil.

Data Availability Statement

Not applicable.

Acknowledgments

The authors gratefully acknowledge the financial support provided by the National Health Foundation (FUNASA) through the TED 02/2018 for the development of the research. We are grateful to CAPES (PROAP grant) for financial support of publication costs.

Conflicts of Interest

The authors declare no conflict of interest.

References

  1. Jullien, S. Prophylaxis of Caries with Fluoride for Children under Five Years. BMC Pediatrics 2021, 351 (Suppl. 1), 351. [Google Scholar] [CrossRef] [PubMed]
  2. Srivastava, S.; Flora, S. Fluoride in Drinking Water and Skeletal Fluorosis: A review of the global impact. Curr. Environ. Health Rep. 2020, 7, 140–146. [Google Scholar] [CrossRef] [PubMed]
  3. WHO—World Heath Organization. Fluoride in Drinking-Water. In Guidelines for Drinking-Water Quality; World Health Organization: Geneva, Switzerland, 2006. [Google Scholar]
  4. Raichur, A.M.; Basu, M.J. Adsorption of Fluoride onto Mixed Rare Earth Oxides. Sep. Purif. Technol. 2001, 24, 121–127. [Google Scholar] [CrossRef]
  5. Ezaki, S.; Pérez-Aguilar, A.; Hypolito, R.; Shinzato, M.C. Anomalias de Flúor nas Águas Subterrâneas do Estado de São Paulo. Rev. Inst. Geológico 2016, 37, 65–98. [Google Scholar] [CrossRef] [Green Version]
  6. Colombani, N.; Giuseppe, D.D.; Kebede, S.; Mastrocicco, M. Assessment of the Anthropogenic Fluoride Export in Addis Ababa Urban Environment (Ethiopia). J. Geochem. Explor. 2018, 190, 390–399. [Google Scholar] [CrossRef]
  7. Yadav, K.K.; Gupta, N.; Kumar, V.; Khan, S.A.; Kumar, A. A Review of Emerging Adsorbents and Current Demand for Defluoridation of Water: Bright future in water sustainability. Environ. Int. 2018, 111, 80–108. [Google Scholar] [CrossRef]
  8. Podgorski, J.; Berg, M. Global Analysis and Prediction of Fluoride in Groundwater. Nat. Commun. 2022, 13, 4232. [Google Scholar] [CrossRef]
  9. He, J.; Yang, Y.; Wu, Z.; Xie, C.; Zhang, K.; Kong, L.; Liu, J. Review of fluoride removal from water environment by adsorption. J. Environ. Chem. Eng. 2020, 8, 104516. [Google Scholar] [CrossRef]
  10. Sadhu, M.; Bhattacharya, P.; Vithanage, M.; Sudhakar, P.P. Adsorptive Removal of Fluoride Using Biochar—A Potential Application in Drinking Water Treatment. Sep. Purif. Technol. 2022, 278, 119106. [Google Scholar] [CrossRef]
  11. Waghmare, S.S.; Arfin, T. Fluoride Removal from Water by various techniques: Review. Int. J. Innov. Sci. Eng. Technol. 2015, 2, 560–571. Available online: https://ijiset.com/vol2/v2s9/IJISET_V2_I9_67.pdf (accessed on 7 December 2022).
  12. Khandare, R.V.; Desai, S.B.; Bhujbal, S.S.; Watharkar, A.D.; Biradar, S.P.; Pawar, P.K.; Govindwar, S.P. Phytoremediation of fluoride with garden ornamental Nerium oleander, Portulaca oleracea, and Pogonatherum crinitum. Environ. Sci. Pollut. Res. 2017, 24, 6833–6839. [Google Scholar] [CrossRef]
  13. Kurniawan, T.A.; Lo, W.; Liang, X.; Goh, H.H.; Othman, M.H.D.; Chong, K.-K.; Chew, K.W. Remediation Technologies for Contaminated Groundwater Due to Arsenic (As), Mercury (Hg), and/or Fluoride (F): A critical review and way forward to contribute to carbon neutrality. Sep. Purif. Technol. 2023, 314, 123474. [Google Scholar] [CrossRef]
  14. Gao, S.-L.; Li, L.-Q.; Huang, J.; Xu, Z.-L.; Tang, Y.-J. Fine-Tuning of Fully-Aromatic Polyamide Membrane for Fluorinated Water Purification. J. Appl. Polym. Sci. 2023, 140, e53967. [Google Scholar] [CrossRef]
  15. Gmar, S.; Sayadi, I.B.S.; Helali, N.; Tlili, M.; Amor, M.B. Desalination and Defluoridation of Tap Water by Electrodialysis. Environ. Process. 2015, 2, 209–222. [Google Scholar] [CrossRef]
  16. Rodríguez-Iglesias, J.; Alcalá, L.; Megido, L.; Castrillón, L. Removal of Fluoride from Coke Wastewater by Aluminum Doped Chelating Ion-Exchange Resins: A tertiary treatment. Environ. Sci. Pollut. Res. 2022, 29, 8705–8715. [Google Scholar] [CrossRef]
  17. Islam, S.M.D.-U. Electrochemical Remediation of Arsenic and Fluoride from Water: A review of the current state and future prospects. Environ. Technol. Innov. 2023, 31, 103148. [Google Scholar] [CrossRef]
  18. Jagtap, S.; Yenkie, M.K.; Labhsetwar, N.; Rayalu, S. Fluoride in Drinking Water and Defluoridation of Water. Chem. Rev. 2020, 112, 2454–2466. [Google Scholar] [CrossRef]
  19. Cao, H.; Wu, X.; Syed-Hassan, S.S.A.; Zhang, S.; Mood, S.H.; Milan, Y.J.; Garcia-Perez, M. Characteristics and mechanisms of phosphorous adsorption by rape straw-derived biochar functionalized with calcium from eggshell. Bioresour. Technol. 2020, 318, 124063. [Google Scholar] [CrossRef]
  20. Xiang, W.; Zhang, X.; Chen, J.; Zou, W.; He, F.; Hu, X.; Tsang, D.C.W.; Ok, Y.S.; Gao, B. Biochar technology in wastewater treatment: A critical review. Chemosphere 2020, 252, 126539. [Google Scholar] [CrossRef]
  21. Thompson, K.A.; Shimabuku, K.K.; Kearns, J.P.; Knappe, D.R.U.; Summers, R.S.; Cook, S.M. Environmental Comparison of Biochar and Activated Carbon for Tertiary Wastewater Treatment. Environ. Sci. Technol. 2016, 50, 11253–11262. [Google Scholar] [CrossRef]
  22. Dong, Q.; Yang, D.; Luo, L.; He, Q.; Cai, F.; Cheng, S.; Chen, Y. Engineering Porous Biochar for Capacitive Fluorine Removal. Sep. Purif. Technol. 2021, 257, 117932. [Google Scholar] [CrossRef]
  23. Shahid, M.K.; Kim, J.Y.; Choi, Y.G. Synthesis of Bone Char from Cattle Bones and its Application for Fluoride Removal from the Contaminated Water. Groundw. Sustain. Dev. 2019, 8, 324–331. [Google Scholar] [CrossRef]
  24. Goswami, R.; Kumar, M. Removal of Fluoride from Aqueous Solution Using Nanoscale Rice Husk Biochar. Groundw. Sustain. Dev. 2018, 7, 446–451. [Google Scholar] [CrossRef]
  25. George, L.Y.; Ma, L.; Zhang, W.; Yao, G. Parametric Modelling and Analysis to Optimize Adsorption of Atrazine by MgO/Fe3O4-Synthesized Porous Carbons in Water Environment. Environ. Sci. Eur. 2023, 35, 21. [Google Scholar] [CrossRef]
  26. Roy, S.; Sengupta, S.; Manna, S.; Das, P. Chemically Reduced Tea Waste Biochar and its Application in Treatment of Fluoride Containing Wastewater: Batch and optimization using response surface methodology. Process Saf. Environ. Prot. 2018, 116, 553–563. [Google Scholar] [CrossRef]
  27. Yang, L.; He, L.; Xue, J.; Wu, L.; Ma, Y.; Li, H.; Peng, P.; Li, M.; Zhang, Z. Highly efficient nickel (II) removal by sewage sludge biochar supported α-Fe2O3 and α-FeOOH: Sorption characteristics and mechanisms. PLoS ONE 2019, 14, e0218114. [Google Scholar] [CrossRef] [Green Version]
  28. Cheng, N.; Wang, B.; Wu, P.; Lee, X.; Xing, Y.; Chen, M.; Gao, B. Adsorption of emerging contaminants from water and wastewater by modified biochar: A review. Environ. Pollut. 2021, 273, 116448. [Google Scholar] [CrossRef]
  29. Liu, C.; Zhang, H.-X. Modified-biochar adsorbents (MBAs) for heavy-metal ions adsorption: A critical review. J. Environ. Chem. Eng. 2022, 10, 107393. [Google Scholar] [CrossRef]
  30. Kumar, P.; Prajapati, A.K.; Dixit, S.; Yadav, V.L. Adsorption of Fluoride from Aqueous Solution Using Biochar Prepared from Waste Peanut Hull. Mater. Res. Express 2019, 6, 125553. [Google Scholar] [CrossRef]
  31. Tang, J.; Xiang, B.; Li, Y.; Tan, T.; Zhu, Y. Adsorption Characteristics and Charge Transfer Kinetics of Fluoride in Water by Different Adsorbents. Front. Chem. 2022, 10, 917511. [Google Scholar] [CrossRef]
  32. Song, J.; Yang, W.; Han, X.; Jiang, S.; Zhang, C.; Pan, W.; Jian, S.; Hu, J. Performance of Rod-Shaped Ce Metal-Organic Frameworks for Defluoridation. Molecules 2023, 28, 3492. [Google Scholar] [CrossRef]
  33. Hu, J.; Song, J.; Han, X.; Wen, Q.; Yang, W.; Pan, W.; Jian, S.; Jiang, S. Fabrication of Ce-La-MOFs for defluoridation in aquatic systems: A kinetics, thermodynamics and mechanisms study. Sep. Purif. Technol. 2023, 314, 123562. [Google Scholar] [CrossRef]
  34. Jian, S.; Chen, Y.; Shi, F.; Liu, Y.; Jiang, W.; Hu, J.; Han, X.-U.; Jiang, S.; Yang, W. Template-Free Synthesis of Magnetic La-Mn-Fe Tri-Metal Oxide Nano-fibers for Efficient Fluoride Remediation: Kinetics, Isotherms, Thermodynamics and Reusability. Polymers 2022, 14, 5417. [Google Scholar] [CrossRef]
  35. Jian, S.; Shi, F.; Hu, R.; Liu, Y.; Chen, Y.; Jiang, W.; Yuan, X.; Hu, J.; Zhang, K.; Jiang, S.; et al. Electrospun magnetic La2O3–CeO2–Fe3O4 composite nanofibers for removal of fluoride from aqueous solution. Compos. Commun. 2022, 33, 101194. [Google Scholar] [CrossRef]
  36. Zhang, X.; Qi, Y.; Chen, Z.; Song, N.; Li, X.; Ren, D.; Zhang, S. Evaluation of Fluoride and Cadmium Adsorption Modification of Corn Stalk by Aluminum Trichloride. Appl. Surf. Sci. 2021, 543, 148727. [Google Scholar] [CrossRef]
  37. Obey, G.; Adelaide, M.; Ramaraj, R. Biochar derived from non-customized matamba fruit shell as an adsorbent for wastewater treatment. J. Bioresour. Bioprod. 2022, 7, 109–115. [Google Scholar] [CrossRef]
  38. Bianco, F.; Marcińczyk, M.; Race, M.; Papirio, S.; Esposito, G.; Oleszczuk, P. Low temperature–produced and VFA–coated biochar enhances phenanthrene adsorption and mitigates toxicity in marine sediments. Sep. Purif. Technol. 2022, 296, 121414. [Google Scholar] [CrossRef]
  39. Shin, J.; Kwak, J.; Kim, S.; Son, C.; Lee, Y.-G.; Kim, J.; Bae, S.; Park, Y.; Lee, S.-H.; Chon, K. Highly selective recovery of phosphate ions using a novel carbonaceous adsorbent synthesized via co-pyrolysis of spent coffee grounds and steel slags: A potential phosphatic fertilizer. Chem. Eng. J. 2023, 451, 138978. [Google Scholar] [CrossRef]
  40. Luo, Z.; Yao, B.; Yang, X.; Wang, L.; Xu, Z.; Yan, X.; Tian, L.; Zhou, H.; Zhou, Y. Novel Insights into the Adsorption of Organic Contaminants by Biochar: A review. Chemosphere 2022, 287, 132113. [Google Scholar] [CrossRef]
  41. Keerthanan, S.; Rajapaksha, S.M.; Trakal, L.; Vithanage, M. Caffeine removal by Gliricidia sepium biochar: Influence of pyrolysis temperature and physicochemical properties. Environ. Res. 2020, 189, 109865. [Google Scholar] [CrossRef]
  42. Shakya, A.; Vithanage, M.; Agarwal, T. Influence of Pyrolysis Temperature on Biochar Properties and Cr(VI) Adsorption from Water with Groundnut Shell Biochars: Mechanistic approach. Environ. Res. 2022, 215, 114243. [Google Scholar] [CrossRef] [PubMed]
  43. Jung, K.-W.; Kim, K.; Jeong, T.-U.; Ahn, K.-H. Influence of pyrolysis temperature on characteristics and phosphate adsorption capability of biochar derived from waste-marine macroalgae (Undaria pinnatifida roots). Bioresour. Technol. 2016, 200, 1024–1028. [Google Scholar] [CrossRef] [PubMed]
  44. Ortiz, L.R.; Torres, E.; Zalazar, D.; Zhang, H.; Rodriguez, R.; Mazza, G. Influence of pyrolysis temperature and bio-waste composition on biochar characteristics. Renew. Energy 2020, 155, 837–847. [Google Scholar] [CrossRef]
  45. Angin, D. Effect of pyrolysis temperature and heating rate on biochar obtained from pyrolysis of safflower seed press cake. Bioresour. Technol. 2013, 128, 593–597. [Google Scholar] [CrossRef]
  46. Ogata, F.; Tominaga, H.; Yabutani, H.; Kawasaki, N. Removal of Fluoride Ions from Water by Adsorption onto Carbonaceous Materials Produced from Coffee Grounds. J. Oleo Sci. 2011, 60, 619–625. [Google Scholar] [CrossRef] [Green Version]
  47. Hussain, N.; Chantrapromma, S.; Suwunwong, T.; Phoungthong, K. Cadmium (II) Removal from Aqueous Solution Using Magnetic Spent Coffee Ground Biochar: Kinetics, isotherm and thermodynamic adsorption. Mater. Res. Express 2020, 7, 085503. [Google Scholar] [CrossRef]
  48. Shin, H.; Tiwari, D.; Kim, D.-J. Phosphate Adsorption/Desorption Kinetics and P Bioavailability of Mg-Biochar from Ground Coffee Waste. J. Water Process Eng. 2020, 37, 101484. [Google Scholar] [CrossRef]
  49. Mcnutt, J.; He, S.Q. Spent coffee grounds: A review on current utilization. J. Ind. Eng. Chem. 2019, 71, 78–88. [Google Scholar] [CrossRef]
  50. Cherdchoo, W.; Nithettham, S.; Charoenpanich, J. Removal of Cr(VI) from Synthetic Wastewater by Adsorption Onto Coffee Ground and Mixed Waste Tea. Chemosphere 2019, 221, 758–767. [Google Scholar] [CrossRef]
  51. El-Azazy, M.; El-Shafie, A.S.; Morsy, H. Biochar of Spent Coffee Grounds as Per Se and impregnated with TiO2: Promising waste-derived adsorbents for balofloxacin. Molecules 2021, 26, 2295. [Google Scholar] [CrossRef]
  52. Shin, J.; Lee, S.-H.; Kim, S.; Ochir, D.; Park, Y.; Kim, J.; Lee, Y.-G.; Chon, K. Effects of Physicochemical Properties of Biochar Derived from Spent Coffee Grounds and commercial activated carbon on adsorption behavior and mechanisms of strontium ions (Sr2+). Environ. Sci. Pollut. Res. Int. 2021, 28, 40632. [Google Scholar] [CrossRef]
  53. Kwak, J.; Lee, S.-H.; Shin, J.; Lee, Y.-G.; Kim, S.; Son, C.; Ren, X.; Shin, J.-K.; Park, Y.; Chon, K. Synthesis and applications of bismuth-impregnated biochars originated from spent coffee grounds for efficient adsorption of radioactive iodine: A mechanism study. Environ. Pollut. 2022, 313, 120138. [Google Scholar] [CrossRef]
  54. Shin, J.; Kwak, J.; Kim, S.; Son, C.; Kang, B.; Lee, Y.-G.; Chon, K. Enhanced selectivity and recovery of phosphate and nitrate ions onto coffee ground waste biochars via co-precipitation of Mg/Al layered double hydroxides: A potential slow-release fertilizer. Environ. Res. 2023, 231, 116266. [Google Scholar] [CrossRef]
  55. Alves, A.C.F.; Antero, R.V.P.; Oliveira, S.B.; Ojala, S.A.; Scalize, P.S. Activated Carbon Produced from Waste Coffee Grounds for an Effective Removal of Bisphenol-A in Aqueous Medium. Environ. Sci. Pollut. Res. 2019, 26, 24850–24862. [Google Scholar] [CrossRef]
  56. APHA—American Public Health Association. Standard Methods for the Examination of Water and Wastewater; APHA: Washington, DC, USA, 2012. [Google Scholar]
  57. Fito, J.; Said, H.; Feleke, S.; Worku, A. Fluoride Removal from Aqueous Solution onto Activated Carbon of Catha edulis through the Adsorption Treatment Technology. Environ. Syst. Res. 2019, 8, 25. [Google Scholar] [CrossRef]
  58. Ben-Ali, S.; Souissi-Najar, S.; Ouederni, A. Comments on “Comments on ‘Characterization and adsorption capacity of raw pomegranate peel biosorbent for copper removal. J. Clean. Prod. 2017, 154, 269–275. [Google Scholar] [CrossRef]
  59. Webber, W.J., Jr.; Morris, J.C. Kinetics of Adsorption on Carbon from Solution. J. Sanit. Eng. Div. 1963, 89, 31–42. [Google Scholar] [CrossRef]
  60. Sen Gupta, S.; Bhattacharyya, K.G. Kinetics of Adsorption of Metal Ions on Inorganic Materials: A review. Adv. Colloid Interface Sci. 2011, 162, 39–58. [Google Scholar] [CrossRef]
  61. Nascimento, R.F.; Lima, A.C.A.; Vidal, C.B.; Melo, D.Q.; Raulino, G.S.C. Adsorção: Aspectos Teóricos e Aplicações Ambientais, 2nd ed.; Imprensa Universitária da Universidade Federal do Ceará (UFC): Fortaleza, Brazil, 2020; Available online: https://repositorio.ufc.br/handle/riufc/53271 (accessed on 19 May 2023).
  62. Almeida, E.; Silva, E.S.C.; Pinto, B.C.; Lima, A.S.; Oliveira, M.A.; Bezerra, A.C.S.; Souza, T.S.F.; Rodrigues, C.G.; Machado, A.R.T. Equilíbro de Adsorção do Corente Rodamina B em Carvão Ativado Obtido dos Resíduos do Coco Verde. J. Eng. Exact Sci. 2017, 3, 1051–1058. [Google Scholar] [CrossRef] [Green Version]
  63. Lee, K.-T.; Du, J.-T.; Chen, W.-H.; Ubando, A.T.; Lee, K.T. Green Additive to Upgrade Biochar from Spent Coffee Grounds by Torrefaction for Pollution Mitigation. Environ. Pollut. 2021, 285, 117244. [Google Scholar] [CrossRef]
  64. Singh, Y.D.; Mahanta, P.; Bora, U. Comprehensive characterization of lignocellulosic biomass through proximate, ultimate and compositional analysis for bioenergy production. Renew. Energy 2017, 103, 490–500. [Google Scholar] [CrossRef]
  65. Nowicki, P. Effect of heat treatment on the physicochemical properties of nitrogen-enriched activated carbons. J. Therm. Anal. Calorim. 2016, 125, 1017–1024. [Google Scholar] [CrossRef] [Green Version]
  66. Marsh, H.; Rodriguez-Reinoso, F. Activated Carbon, 1st ed.; Elsevier Science: Amsterdam, The Netherlands, 2006. [Google Scholar]
  67. IUPAC—International Union of Pure and Applied Chemistry; Thommes, M.; Kaneko, K.; Neimark, A.V.; Olivier, J.P.; Rodriguez-Reinoso, F.; Rouquerol, J.; Sing, K.S.W. Physisorption of Gases, with Special Reference to the Evaluation of Surface Area and Pore Size Distribution (IUPAC Technical Report). Pure Appl. Chem. 2015. Available online: https://www.posmat.cefetmg.br/wp-content/uploads/sites/120/2017/11/IUPAC_Recommendations_gas_sorption_2015.pdf (accessed on 19 May 2023). [CrossRef] [Green Version]
  68. Ruthven, D.M. Principles of Adsorption and Adsorption Process; John Wiley & Sons: New York, NY, USA, 1984. [Google Scholar]
  69. IUPAC—International Union of Pure and Applied Chemistry; Sing, K.S.W.; Evere, D.H.; Haul, R.A.W.; Moscou, L.; Pieroti, R.A.; Rouquerol, J.; Siemieniewska, T. Reporting Physisorption Data for Gas/Solid Systems with Special Reference to the Determination of Surface Area and Porosity. Pure Appl. Chem. 1985, 57, 603–619. Available online: https://www.degruyter.com/document/doi/10.1351/pac198254112201/html (accessed on 19 May 2023). [CrossRef]
  70. Clark, J. Atomic and Ionic Radius. Available online: https://www.chemguide.co.uk/atoms/properties/atradius.html (accessed on 20 April 2023).
  71. Lee, K.-T.; Cheng, C.-L.; Lee, D.-S.; Chen, W.-H.; Vo, D.-V.N.; Ding, L.; Lam, S.S. Spent coffee grounds biochar from torrefaction as a potential adsorbent for spilled diesel oil recovery and as an alternative fuel. Energy 2022, 239, 122467. [Google Scholar] [CrossRef]
  72. Güzel, F.; Sayğili, H.; Akkaya-Sayğili, G.; Koyuncu, F.; Yilmaz, C. Optimal oxida-tion with nitric acid of biochar derived from pyrolysis of weeds and its application in removal of hazardous dye methylene blue from aqueous solution. J. Clean. Prod. 2017, 144, 260–265. [Google Scholar] [CrossRef]
  73. Taskin, E.; Castro Bueno, C.; Allegretta, I.; Terzano, R.; Rosa, A.H.; Loffredo, E. Multianalytical Characterization of Biochar and Hydrochar Produced from Waste Biomasses for Environmental and Agricultural Applications. Chemosphere 2019, 233, 422–430. [Google Scholar] [CrossRef]
  74. Mukherjee, A.; Boruggada, V.B.; Dynes, J.J.; Niu, C.; Dalai, A.K. Carbon Dioxide Capture from Flue Gas in Biochar Produced from Spent Coffee Grounds: Effect of surface chemistry and porous structure. J. Environ. Chem. Eng. 2021, 9, 106049. [Google Scholar] [CrossRef]
  75. Sha, Q.; Xie, H.; Liu, W.; Yang, D.; He, Y.; Yang, C.; Wang, N.; Ge, C. Removal of Fluoride Using Platanus Acerifoli Leaves Biochar—An Efficient and Low-Cost Application in Wastewater Treatment. Environ. Technol. 2021, 44, 93–107. [Google Scholar] [CrossRef]
  76. Hettithanthri, O.; Rajapaksha, A.U.; Nanayakkara, N.; Vithanage, M. Temperature Influence on Layered Double Hydroxide Tailored Corncob Biochar and its Application for Fluoride Removal in Aqueous Media. Environ. Pollut. 2023, 320, 121054. [Google Scholar] [CrossRef]
  77. Araga, R.; Kali, S.; Sharma, C.S. Coconut-Shell-Derived Carbon/Carbon Nanotube Composite for Fluoride Adsorption from Aqueous Solution. Clean Soil Air Water 2019, 47, 1800286. [Google Scholar] [CrossRef]
  78. Tala, W.; Chantara, S. Use of Spent Coffee Ground Biochar as Ambient PAHs Sorbent and Novel Extraction Method for GC-MS Analysis. Environ. Sci. Pollut. Res. Int. 2019, 26, 13025–13040. [Google Scholar] [CrossRef]
  79. Oh, T.-K.; Choi, B.; Shinogi, Y.; Chikushi, J. Effect of pH Conditions on Actual and Apparent Fluoride Adsorption by Biochar in Aqueous Phase. Water Air Soil Pollut. 2012, 223, 3729–3738. [Google Scholar] [CrossRef]
  80. Daifullah, A.A.M.; Yakout, S.M.; Elreefy, S.A. Adsorption of Fluoride in Aqueous Solutions Using KMnO4-Modified Activated Carbon Derived from Steam Pyrolysis of Rice Straw. J. Hazard. Mater. 2007, 147, 633–643. [Google Scholar] [CrossRef]
  81. Ma, S.; Jing, F.; Sohi, S.P.; Chen, J. New Insights into Contrasting Mechanisms for PAE Adsorption on Millimeter, Micron- and Nano-Scale Biochar. Environ. Sci. Pollut. Res. Int. 2019, 26, 18636–18650. [Google Scholar] [CrossRef]
  82. Sivaraj, R.; Namasivayam, C.; Kadirvelu, K. Orange Peel as na Adsorbent in the Removal of Acid Violet 17 (Acid Dye) form Aqueous Solutions. Waste Manag. 2001, 21, 105–110. [Google Scholar] [CrossRef]
  83. Mohan, D.; Kumar, S.; Srivastava, A. Fluoride Removal from Ground Water Using Magnetic and Nonmagnetic Corn Stover Biochars. Ecol. Eng. 2014, 73, 798–808. [Google Scholar] [CrossRef]
  84. Ho, Y.S.; Mckay, G. A Comparison of Chemisorption Kinetic Models Applied to Pollutant Removal on Various Sorbents. Process Saf. Environ. Prot. 1998, 76, 332–340. [Google Scholar] [CrossRef] [Green Version]
  85. Alagumuthu, G.; Rajan, M. Equilibrium and Kinetics of Adsorption of Fluoride onto Zirconium Impregnated Cashew Nut Shell Carbon. Chem. Eng. J. 2010, 158, 451–457. [Google Scholar] [CrossRef]
  86. Huang, X.; An, G.; Zhu, S.; Wang, L.; Ma, F. Can Cd Translocation in Oryza sativa L. be Attenuated by Arbuscular Mycorrhizal Fungi in the Presence of EDTA? Environ. Sci. Pollut. Res. Int. 2018, 25, 9380–9390. [Google Scholar] [CrossRef]
  87. Heier, D.; Blackstock, T.; Stack, K.; Richardson, D.; Lewis, T. Adsorption of Wood Extractives and Model Compounds onto Bentonite. Physicochem. Eng. Asp. 2015, 482, 213–221. [Google Scholar] [CrossRef]
  88. Chunhui, L.; Jin, T.; Puli, Z.; Bin, Z.; Duo, B.; Xuebin, L. Simultaneous Removal of Fluoride and Arsenic in Geothermal Water in Tibet Using Modified Yak Dung Biochar as an Adsorbent. R. Soc. Open Sci. 2018, 5, 181266. [Google Scholar] [CrossRef] [PubMed] [Green Version]
  89. Dogan, M.; Alkan, M.; Demirbas, Ö.; Özdemir, Y.; Özmetin, C. Adsorption Kinetics of Maxilon Blue GRL Onto Sepiolite from Aqueous Solutions. Chem. Eng. J. 2006, 124, 89–101. [Google Scholar] [CrossRef]
  90. Braun, J.C.A.; Schommer, V.A.; Lima, F.O.; Dervanoski, A. Utilização de Adsorvente Natural para Remoção de Ferro(II) de Solução Aquosa—Tratamento Cinético e Equilíbrio Termodinâmico. Rev. CIATEC–UPF 2020, 12, 21–35. [Google Scholar]
  91. Gomide, R. Operações Unitárias—1° Volume: Operações com Sistemas Sólidos Granulares; Edição do autor: São Paulo, Brazil, 1983. [Google Scholar]
  92. Nascimento, R.F.; Lima, A.C.A.; Vidal, C.B.; Melo, D.Q.; Raulino, G.S.C. Adsorção: Aspectos Teóricos e Aplicações Ambientais; Imprensa Universitária da Universidade Federal do Ceará (UFC): Fortaleza, Brazil, 2014. [Google Scholar]
  93. Chiavola, A.; D’amato, E.; Di Marcantonio, C. Comparison of Adsorptive Removal of Fluoride from Water by Different Adsorbents under Laboratory and Real Conditions. Water 2022, 14, 1423. [Google Scholar] [CrossRef]
  94. Bibi, S.; Farooqi, A.; Yasmin, A.; Kamran, M.A.; Niazi, N.K. Arsenic and Fluoride Removal by Potato Peel and Rice Husk (PPRH) Ash in Aqueous Environment. Int. J. Phytoremed. 2017, 19, 1029–1036. [Google Scholar] [CrossRef]
Figure 1. X-ray diffractogram of biochar (BC).
Resources 12 00084 g001
Figure 2. Photomicrographs of BC samples. Note: magnification of resolution from 1 to 3/(a): magnification of 500 times/(b): magnification of 1500 times.
Resources 12 00084 g002
Figure 3. Isotherms of adsorption and desorption of N2 (−195.85 °C) (a) and pore volume (b).
Resources 12 00084 g003
Figure 4. (a) BC sample and (b) energy dispersive spectroscopy. Note: * place of incidence of electrons beam; magnification of 350 times.
Resources 12 00084 g004
Figure 5. FTIR spectra of biochar (BC) and biochar after adsorption of F (BCads).
Resources 12 00084 g005
Figure 6. Effect of pH on F adsorption. Note: stirring 100 rpm/temperature 22 °C/test lasting 24 h/C0 = 7 mg·L−1/adsorbent mass = 0.5 g/50 mL of solution/duplicate.
Resources 12 00084 g006
Figure 7. Adsorption capacity and F removal efficiency as a function of BC dosage. Note: stirring 100 rpm/temperature 23 °C/test lasting 24 h/C0 = 7 mg·L−1/pH = 2 (BC)/50 mL solution/duplicate.
Resources 12 00084 g007
Figure 8. Adsorption capacity on BC as a function of time for different initial concentrations of F. Note: stirring at 100 rpm/temperature at 22 °C/assay lasting 6 h/(c)/pH = 2/50 mL of solution/mass = 0.5 g/duplicate.
Resources 12 00084 g008
Figure 9. Adjustment kinetic models for the different initial concentrations of F. Note: agitation at 100 rpm/temperature of 22 °C/assay lasting 6 h/pH = 2/50 mL of solution/duplicate.
Resources 12 00084 g009
Figure 10. Webber–Morris kinetic model for BC.
Resources 12 00084 g010
Figure 11. Influence of temperature on the adsorption capacity (qe) of BC for different initial concentrations (C0) of F. Note: agitation at 100 rpm/temperature of 35 °C, 45 °C, and 55 °C/test lasting 5 h/pH = 2/50 mL of solution/duplicate.
Resources 12 00084 g011
Figure 12. Adsorption isotherms for temperatures of 35 °C, 45 °C, and 55 °C. Note: stirring at 100 rpm/test lasting 5 h/pH = 2/50 mL of solution/duplicate.
Resources 12 00084 g012
Figure 13. Adjustments of the results obtained to the Langmuir (a) and Freundlich (b) models for Ce between 1 mg·L−1 and 12 mg·L−1. Note: stirring at 100 rpm/test lasting 5 h/pH = 2/50 mL of solution/duplicate.
Resources 12 00084 g013
Table 1. Results of the elemental analysis of coffee grounds and biochar (BC).
MaterialsC (%)N (%)H (%)
Coffee grounds52.697.422.11
BC63.133.014.87
Table 2. Pseudo-first and pseudo-second order kinetic parameters of fluoride adsorption.
Fluorine Concentration (mg·L−1)qeexp (mg·g−1)Pseudo-First-OrderPseudo-Second-Order
6.50.156qe = 0.137
k1 = 0.144
R2 = 0.99283
qe = 0.143
k2 = 1.958
R2 = 0.94666
150.426qe = 0.421
k1 = 0.691
R2 = 0.99283
qe =0.420
k2 =44.931
R2 = 0.99091
250.721qe = 0.655
k1 = 0.300
R2 = 0.90627
qe = 0.686
k2 = 0.771
R2 = 0.95027
6.50.156qe = 0.137
k1 = 0.144
R2 = 0.99283
qe = 0.143
k2 = 1.958
R2 = 0.94666
k1 = (min−1); k2 = g·(mg·min)−1.
Table 3. Langmuir and Freundlich parameters obtained from the adjustment of models to data with Ce between 1 mg·L−1 and 12 mg·L−1.
Temperature (°C)LangmuirFreundlich
ParametersValueParametersValue
35qm
KL
R2
0.22863
0.37304
0.96437
KF
n
R2
0.06871
0.42304
0.96843
45qm
KL
R2
0.45222
0.09386
0.94872
KF
n
R2
0.04965
0.63778
0.97935
55qm
KL
R2
0.53203
0.09747
0.99636
KF
n
R2
0.05735
0.65319
0.99843
100 rpm/test lasting 5 h/pH = 2/50 mL of solution/duplicate. KF = (mg·g−1)·(mg·L−1)−1/n; KL = L·mg−1; qm = mg·g−1, n = dimensionless. Source: the authors.
Table 4. Thermodynamic parameters of F adsorption.
AdsorbentT (K)Kd∆G (kJ·mol−1)∆S [kJ·(molK)−1]∆H (kJ·mol−1)
BC308.150.83670.456344241−0.3635511.466
318.150.06137.379929863
328.150.06197.586640694
Table 5. Langmuir maximum adsorption capacity for different studies.
Adsorbentqm (mg·g−1)Reference
Biochar produced from coffee grounds0.53This study
Commercial granular activated carbon (GAC)0.54[93]
Chemically modified rice straw BC (KMnO4)18.9[80]
Raw sawdust and sugarcane bagasse BC1.73 and 1.15[7]
Rice husk ash2.91[94]
Chemically modified yak dung BC (FeCl2)4.85[88]
Chemically modified tea waste BC (H2SO4 + NaNO3 + KMnO4)24.56[26]
Cattle bone BC11.98[23]
Unmodified peanut shell BC3.66[30]
Chemically modified corn cob BC (MgCl2·6H2O e FeCl3·6H2O)7.24[76]
Disclaimer/Publisher’s Note: The statements, opinions and data contained in all publications are solely those of the individual author(s) and contributor(s) and not of MDPI and/or the editor(s). MDPI and/or the editor(s) disclaim responsibility for any injury to people or property resulting from any ideas, methods, instructions or products referred to in the content.

