Article

Improvement of MBBR Performance by the Addition of 3D-Printed Biocarriers Fabricated with 13X and Bentonite

by
Dimitra C. Banti
1,2,*,
Petros Samaras
2,
Afroditi G. Chioti
1,
Anastasios Mitsopoulos
1,
Michail Tsangas
3,
Antonis Zorpas
3 and
Themistoklis Sfetsas
1
1
QLAB Private Company, Research & Development, Quality Control and Testing Services, 57008 Thessaloniki, Greece
2
Department of Food Science and Technology, School of Geotechnical Sciences, International Hellenic University, 57400 Thessaloniki, Greece
3
Laboratory of Chemical Engineering and Engineering Sustainability, Faculty of Pure and Applied Sciences, Environmental Conservation and Management, Open University of Cyprus, Latsia, P.O. Box 12794, Nicosia 2252, Cyprus
*
Author to whom correspondence should be addressed.
Resources 2023, 12(7), 81; https://doi.org/10.3390/resources12070081
Submission received: 26 May 2023 / Revised: 5 July 2023 / Accepted: 6 July 2023 / Published: 10 July 2023

Abstract

:
The current study investigated the performance of a moving bed biofilm reactor (MBBR), when adding 3D-printed biocarriers fabricated with 13X and bentonite (MBBR 3D), when using K1 commercial biocarriers (MBBR K1) and when not adding biocarriers at all (control MBBR). For the evaluation of the MBBR efficiency, various physicochemical parameters were measured, while biofilm extracted from the biocarriers was evaluated. The findings suggest that there is an optimal biodegradation of the organic load in all MBBR units. The nitrification and denitrification processes were improved in MBBR 3D as compared to the control MBBR and MBBR K1. The dry mass of the biofilm in the 3D-printed biocarriers was two orders of magnitude larger than in the K1 biocarriers. Moreover, in the K1 biocarriers the mass of the biofilm varied in relation to time, since it could not be protected inside the holes, something that did not happen with the 3D-printed biocarriers. Finally, it was found, mostly in MBBR 3D and less in MBBR K1, that the growth of nitrifying bacteria and heterotrophs inside the units increased the biomass production in the form of soluble microbial products, which in turn favored the adhesion of biomass on the surface of biocarriers.

1. Introduction

Moving bed biofilm reactors (MBBRs) are widely used for applying biocarriers during aerobic wastewater treatment [1]. There are more than 1200 large-scale MBBR units with a capacity of 200 population equivalents (p.e.) or more and 7000 units with a capacity of less than 200 p.e. operating worldwide and processing either urban wastewater or industrial wastewater [1]. MBBRs constitute an advanced technology with low maintenance costs while at the same time they are simple, reliable, stable to use, and allow all processes to take place in one tank [2,3]. Compared to other wastewater treatment methods, the MBBR is a financially and environmentally competitive method, as it does not require the constant addition of costly reagents and it does not produce harmful residuals [1,4]. Moreover, MBBRs have high concentrations of active biomass, high diversity, extracellular polymeric substances (EPSs), reduced hydraulic retention time (HRT), higher pollutant removal efficiency, as well as low sludge production [5]. On the other hand, MBBRs also have some disadvantages, such as high energy costs associated with aeration responsible for the movement of the biocarriers inside the reactor, while in the event that the system is not well designed, problems related to the hydrodynamics may occur, such as the formation of stagnant regions. Moreover, the initial investment needed to construct the reactor and acquire the patented biocarriers may hamper the implementation of such systems [6].
The MBBR has been extensively investigated by the scientific community over the last decade and more than 70% of research articles on MBBRs and membrane bioreactors (MBRs) were published in the last decade [7]. MBBRs use freely moving submerged biocarriers in aeration tanks combining two different processes: the processes of attached and suspended biomass growth. All the biological processes that take place are mainly due to the biomass formed in the biocarriers [8]. Therefore, each biocarrier increases the performance of the unit by providing a protected surface for the growth of autotrophic and heterotrophic microorganisms in wastewater, thus achieving high rates of degradation. In systems like these, biomass can be grown both in suspended biocarriers and in fixed biofilters, resulting in an increase in the biomass in the reactor and achieving a better effluent quality [9]. For the biofilm reactors to function properly, a steady-state biofilm should be formed on the surface of the biocarriers [10].
Sequencing batch reactors (SBRs) are activated sludge processing units, in which all stages of wastewater processing are performed consecutively in the same reactor [11]. These reactors are processing systems which are highly flexible, cost-effective in construction, and particularly efficient. In these reactors, the time needed for aerobic and anoxic processes in an operating cycle can be alternated, something that provides flexibility during the removal of organic load, nitrogen, and phosphorus and at the same time the possibility for variation in the time needed for the different phases of the process, thus maximizing the performance of each phase [11]. The SBRs’ performance greatly increases when they are combined with the addition of biocarriers.
A critical parameter that determines the performance of MBBR technology is the appropriate design of the biocarrier. Some of the optimal biocarriers’ characteristics that significantly affect the MBBR performance are the large specific surface area per unit of volume, the material they are made of, their surface characteristics, their orientation, the distance among the pores, and their geometry [12,13]. Three-dimensional printing technology can contribute to the design of the optimal biocarrier by offering flexibility in its design and in the selection of its manufacturing material. A lot of research has been conducted to date attempting to analyze and improve this advanced wastewater treatment method. Tang et al. (2017) [10] have found out that, in moving bed bioreactors with biocarriers, COD removal reached a high percentage (>80%) after a very short period of time, fluctuating during the first 10 days, and then it increased, reaching a percentage which exceeded 90%. On the contrary, Elliot et al. (2017) [13] discovered a maximum removal of COD and NH4-N which reached 77% and 34%, respectively, in the first 5 days. They also observed that the amount of ammonia and nitrates was reduced over time, suggesting that processes of nitrification were taking place. Proano-Pena et al. (2020) [14] have studied various kinds of biocarriers that were manufactured using 3D printing while gradually increasing the specific surface area of the biocarriers for their studies. After comparing three biocarriers which did not have the same specific surface area, it was concluded that the optimal specific surface area for aerobic wastewater treatment was 1168 m2/m3. Song et al. (2021) [15] fabricated biocarriers with biochar and polyurethane sponge and they detected that biochar successfully improved biomass, bioactivity, and electron transfer rate for the denitrification process. Dong et al. (2015) [9] created a series of three-dimensional hollow honeycomb spherically structured biocarriers, formed from pentahedrons and hexahedrons for the removal of COD and NH3. These biocarriers activated an alternative method of mass transfer from the biocarriers towards the biofilm. Elliot et al. (2017) [13] created spherical biocarriers with a larger specific surface area, something that increased the NH3 removal rate by 1620 ppm/d compared to common biocarriers. It is worth mentioning that the research of Chioti et al. (2022) [16], who studied the efficiency of Kaldnes K1 commercial biocarriers and 3D-printed biocarriers with 13X and bentonite in aerobic wastewater treatment performed in lab reactors of 150 mL active volume, has also shown remarkable efficiency in wastewater treatment. According to other researchers [17], the synthetic biofilm carriers showed unstable COD removal rates, in contrast to the natural biofilm carriers that did not present any instability. This is due to the surface properties of the natural biofilm carriers, such as surface pores and roughness. According to Al-amshawee et al. (2022) [17], the Kaldnes K1 biocarriers delivered the shortest start-up in the first 3 days.
Zeolites and bentonites are types of porous aluminosilicates that contain alkali and alkaline earth cations. Their crystalline structure consists of SiO44− and AlO45− tetrahedra linked by shared oxygen atoms. They possess two significant properties: cation exchange, which allows them to swap cations, and adsorption, which enables them to attract molecules with specific cross-sectional diameters. These properties can be enhanced through chemical modification. The use of bentonite and zeolite to mitigate ammonia has been extensively studied [18].
Some of the main characteristics of the activated sludge that play an important role in each wastewater treatment process are the soluble microbial products (SMPs) and the extracellular polymeric substances (EPSs) [19]. SMPs and EPSs determine the physicochemical and biological characteristics of the activated sludge and constitute a basic component of its structure. More specifically, they comprise a gel-like biofilm matrix that is particularly hydrated and often loaded, in which microorganisms are integrated and immobilized. The percentage of EPS in the biofilm ranges from 50 to 90% of the total organic matter. Bassin et al. [20] have suggested that the organic matter at the initial stage enables the growth of nitrifying bacteria and heterotrophs. On the other hand, the growth of nitrifying bacteria and heterotrophs increases biomass production; thus, SMP and EPS generation is increased. The high production of SMPs and EPSs favors the adhesion of biomass on the surface of biocarriers [21].
This manuscript aims to study the beneficial effect of the commercial Kaldnes K1 biocarriers and 3D-printed biocarriers, fabricated from 13X zeolite and bentonite, on the performance of an MBBR unit during municipal wastewater treatment. The efficiency of the wastewater treatment process is evaluated according to the organic and nitrogen removal and is associated with the biofilm being grown on the biocarriers.

2. Materials and Methods

2.1. List of Reagents Used

Merck/Sigma Aldrich, Athens, Greece
D(+)glucose, anhydrous;
Starch from corn;
Ammonium chloride;
Proteose peptone;
Potassium phosphate monobasic;
Magnesium sulfate;
Manganese (II) sulfate monohydrate;
Ferrous sulfate;
Sodium bicarbonate;
Bentonite;
Organic binders;
Silica, colloidal;
Bovine serum albumin;
Na2Tartrate.2H2O;
Folin and Ciocalteu’s phenol reagent 2Ν;
Phenol;
Sulfuric acid 95–97%.
PanReac AppliChem, Darmstadt, Germany
Glucose;
Sodium chloride;
Sodium hydroxide;
Sodium carbonate;
Copper(II) sulfate 5-hydrate.
Illumina Inc., San Diego, California, USA
phiX control library;
Illumina MiSeqTM platform;
MiSeq Reagent Nano Kit version 2 chemistry (500-cycle).
Alfa Aesar, Ward Hill, Massachusetts, USA
13X zeolite.
Hack Lange, Athens, Greece
LCK kits for COD, total N, NH4-N, and NO3-N measurement.
QIAGEN, Hilden, Germany
DNeasy PowerSoil Pro Kit;
QIAseq Library Quant Assay Kit.
Eurofins Genomics, Ebersberg, Germany
341f/805r primer pair.
Thermo Fisher Scientific, Waltham, Massachusetts, USA
Qubit™ 4 fluorometer.
Chem-lab NV, Zedelgem, Belgium
Agarose low EEO for biochemistry.

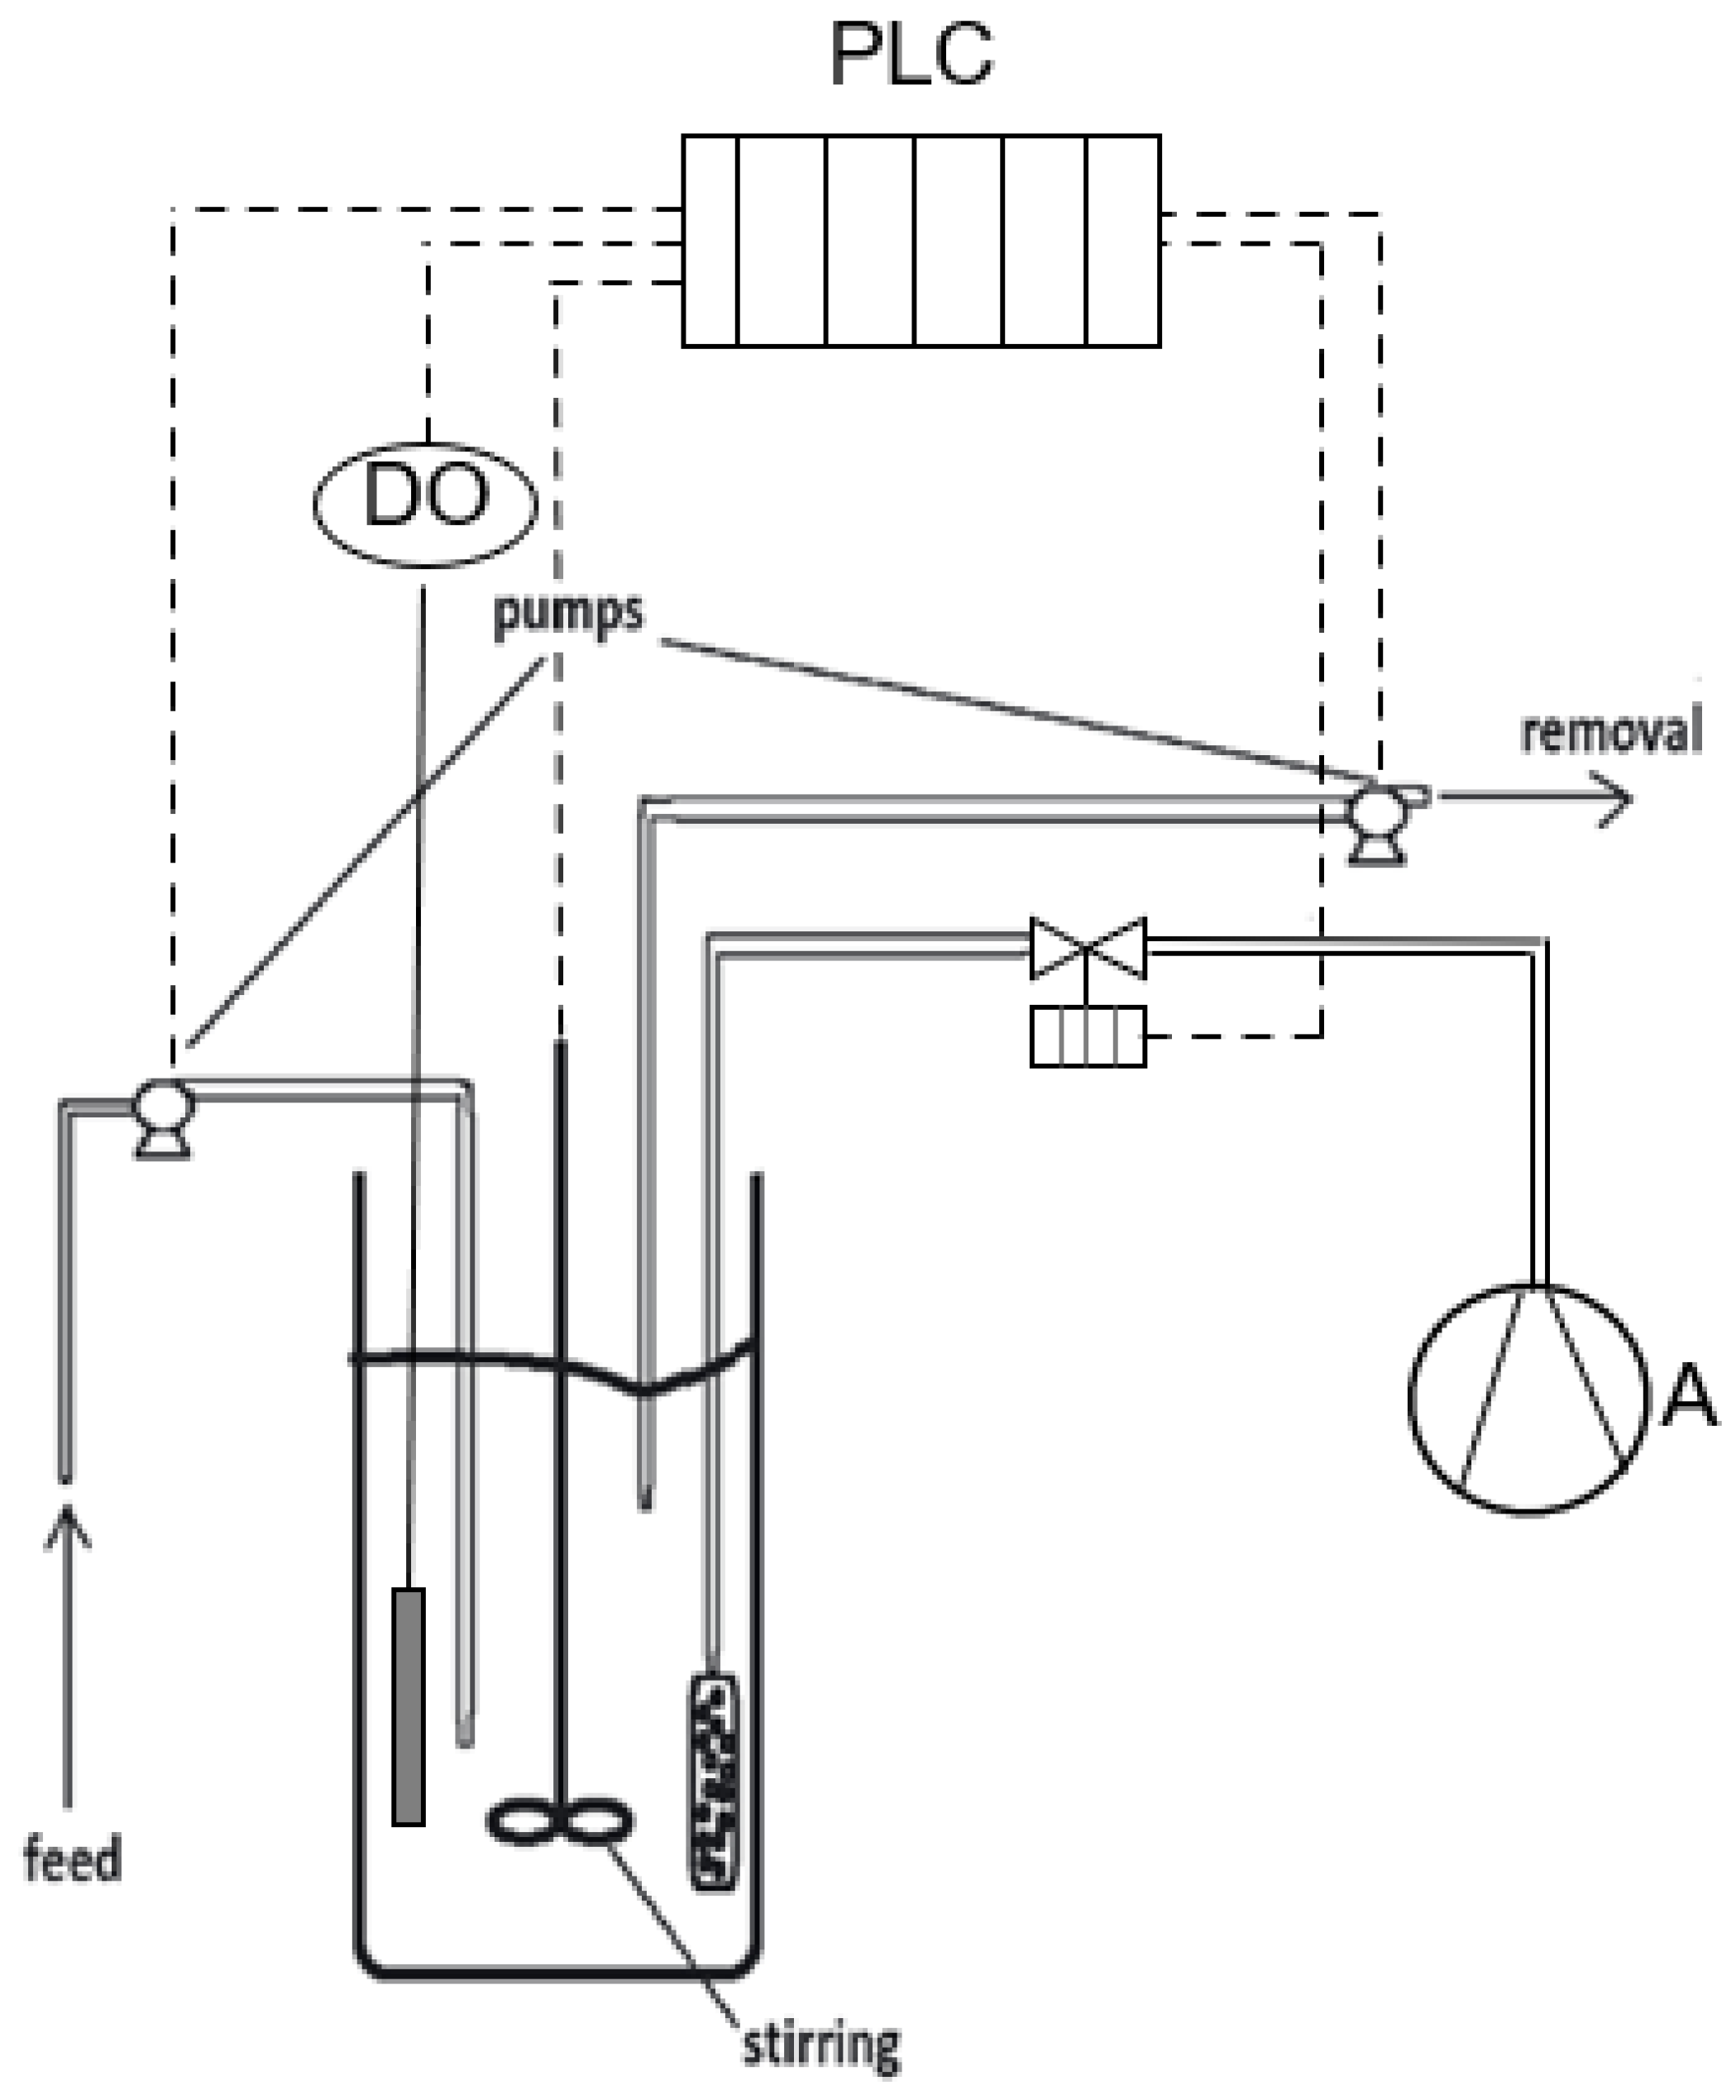
2.2. Moving Bed Biofilm Reactor Set-Up and Operating Conditions

For the purposes of this research, an MBBR [2] with a total active volume of 2.5 L was used, which operated according to the philosophy of a sequencing batch reactor (SBR) [22], the successive phases of which are presented in Figure 1 and its flow diagram in Figure 2. The used bioreactor could also be called a sequencing batch-moving bed bioreactor (SB-MBBR), but for convenience it is referred to as an MBBR. Each operating cycle of the unit included the following phases: feed (30 min) with a Qin = 1.8 L/h, anoxic phase (30 min), aerobic phase (6 h), sedimentation (30 min), and outflow (30 min) with a Qοut = 1.8 L/h. The MBBRs consisted of a dissolved oxygen (DO) measuring sensor, 2 peristaltic pumps, an air compressor, a thermometer, and a PLC system (Eutech Instruments, Waltham, MA, USA), which was used for documenting and controlling the operation parameters with the help of SCADA software (Simantec, Siemens, Athens, Greece). The parameters documented and set via SCADA software included the concentration of dissolved oxygen in the tank, the temperature, inflow, and outflow, as well as the alternate operation stages of the unit. The temperature in the MBBR units was kept constant in the range 20–22 °C, since the units were located in an indoor air-conditioned laboratory facility.
The MBBR was powered by synthetic sewage which was prepared twice a week with the following composition: glucose (250 mg/L), corn starch (250 mg/L), NH4Cl (100 mg/L), peptone (28 mg/L), KH2PO4 (26.5 mg/L), MgSO4·7H2O (9 mg/L), MnSO4·H2O (3.7 mg/L), FeSO4·7H2O (0.55 mg/L), and NaHCO3 (120 mg/L) [23,24]. At the beginning of the experiment, activated sludge from a wastewater treatment plant in Thessaloniki was added to the MBBR tank for the acclimatization of the synthetic sewage [24].
Three continuous flow experiments were conducted, each one lasting more than one month. Since during the first experiment no biocarriers were added to the unit, the first experiment will be hereinafter referred to as control MBBR. During the second experiment, commercial Kaldnes K1 biocarriers were added in the unit with a total volume of 1 L (Figure 3a). This experiment will be hereinafter referred to as MBBR K1. During the third experiment, 3D-printed biocarriers manufactured with 13X zeolite and bentonite (Figure 3b) with a total volume of 1 L were added in the unit. This experiment will be hereinafter referred to as MBBR 3D. Before adding the biocarriers in the unit in the second and third experiments, the biocarriers were placed in an aerated laboratory wastewater treatment tank for around two months, in order to facilitate the growth of biofilm on their surface [5].

2.3. Biofilm Extraction Method

Biocarrier samples were regularly taken from the MBBRs and the biofilm that was grown on their surface was extracted in order to determine its dry mass and its SMPs. The extraction of biofilm was carried out in the following way: the biocarrier sample was placed in deionized water of 10 mL volume, stirred in a vortex device for 1 min, then placed in an ultrasonic device for 2 min, and finally stirred again in a vortex device for an additional minute, using the method of Mandakhalikar et al. (2018) [25,26]. This methodology played a role in the complete removal of the biofilm.

2.4. Printing Methodology of the 3D-Printed Biocarriers with 13X and Bentonite and Their Characterization

For the preparation of the printing paste, the ceramic material (13X) and the inorganic (bentonite) and organic binders were mixed in a mortar until this mixture of solids was homogenized. Then, the deionized water was mixed with colloidal silica. Finally, the aqueous mixture of water and colloidal silica was gradually added to the above-mentioned mixture of solids, while at the same time the mixture was fused with a pestle until the paste was homogenized. A 45 μm hole diameter sieve was also used to remove all aggregates and grains from the paste. Table 1 below shows the zeolite and inorganic binder proportions.
The material was then centrifuged to remove any air bubbles, transferred to a syringe and finally to a Cellink Bio X6 (Gothenburg, Sweden) printer. The next process that took place was the preparation of the printer. This process included the creation of 3D geometry, during which parameters like the shape of the biocarrier, the recurring geometric pattern, the height of each layer, the nozzle diameter, the pressure, and the printing speed were determined. The recurring geometric pattern chosen for the biocarriers was rectilinear and the dimensions of the biocarrier were: 24 mm width, 14 mm length, 7 mm height, and 1.1264 g weight. The printing was performed using the ΒΙO Χ6 (Cellink) printer.
The results of BET analysis, carried out in past research of our research team [16], demonstrated that 13X zeolite possesses favorable characteristics, including a significant specific surface area, a substantial volume of micropores and a notable diameter of micro- and mesopores (Table 2). By combining zeolites with bentonite, a complex material with novel properties and diverse applications was created. The 13X/bentonite composite exhibited larger total pore and mesopore volumes compared to 13X alone, but there was a decrease in specific surface area, micropore volume, and diameter. Although 13X zeolite initially had a large specific surface area, its incorporation with inorganic materials resulted in its reduction.

2.5. Determination of the Physicochemical Parameters

The physicochemical parameters for the characterization of the influent and effluent wastewater as well as of the wastewater during the anoxic and aerobic phase (COD, total N, NH4-N, and NO3-N) were determined using the Hack–Lange LCK kits, along with a DR-2800 spectrophotometer. The soluble fraction of the activated sludge that was produced after filtration in a filtration device was measured in a filter with 1.2 μmc sized pores during the anoxic and aerobic phases. Mixed liquor suspended solids (MLSSs) were measured according to standard methods [27]. The measurements were performed regularly to evaluate the progress of the experiments and the performance of MBBR treatment.
Dissolved oxygen (DO) was measured, documented, and set on a constant basis. The measurement was performed using a Greisinger OXY 3610 MP measuring electrode.
Samples were taken on a regular basis during the anoxic and aerobic phases to measure SMPs and EPSs. For SMP and EPS extraction, a natural thermal extraction method was used [28,29]. To measure the extracted SMP and EPS protein content, the modified Lowry method was repeated three times [30], while to measure the SMP and EPS carbohydrate content the photometric method proposed by Dubois et al. (1956) [31] was repeated two times. Bovine serum albumin (ΒSA, Sigma Aldrich, Athens, Greece) was used for the preparation of the protein calibration curve while glucose (Panreac) was used for the preparation of the carbohydrates’ calibration curve.
Static light scattering (Mastersizer, Malvern Panalytical Ltd., Malvern, UK) was used to determine the size distribution of aggregates with a diameter larger than 10 μm in mixed liquor. Activated sludge was also viewed under a light sheet microscope (LSM, Observer Z1, Zeiss, Oberkochen, Germany) and filamentous index (FI) evaluation was also performed [32,33], during which the population of filamentous microorganisms in the activated sludge mixed liquor was measured. The microscope images were edited using ZEN software, v3.6.

2.6. DNA Extraction and 16S rRNA Gene Amplicon Sequencing

The biofilm suspensions were subjected to genomic DNA extraction using the DNeasy PowerSoil Pro Kit (QIAGEN, Hilde, Germany), following the manufacturer’s protocol. The 16S Metagenomic Sequencing Library Preparation protocol (IlluminaTM, Inc., San Diego, CA, USA) was used to prepare the library according to standard guidelines. Briefly, the 341f/805r primer pair, which targets the bacterial and archaeal V3–V4 hypervariable regions of the 16S rRNA gene (341f 5′-CCTACGGGNGGCWGCAG-3′, 805r 5′-GACTACHVGGTATCTAATCC-3′) (Eurofins Genomics, Ebersberg, Germany), was used to amplify the DNA. The produced DNA libraries were quantified with the Qubit™ 4 Fluorometer (Thermo Fisher Scientific, Waltham, MA, USA), and their size was verified by 1.5% agarose gel electrophoresis. Equimolar concentrations of the libraries were pooled, and a quantitative PCR was performed with the QIAseq Library Quant Assay Kit (QIAGEN, Germany) to evaluate the library concentration. The pooled library was spiked with 25% phiX control library (Illumina Inc., San Diego, CA, USA), denatured, and diluted to a final concentration of 6 pM. Sequencing was performed on an Illumina MiSeqTM platform (Illumina, Inc., San Diego, CA, USA) using the MiSeq Reagent Nano Kit version 2 chemistry (500-cycle) (Illumina, Inc., San Diego, CA, USA) for a paired-end, 2 × 250 bp cycle run.

2.7. Bioinformatics

The analysis of the data obtained from the sequencing was carried out using Quantitative Insights Into Microbial Ecology 2 (QIIME2) software, version 2022.2 [34]. The amplicon sequence variants (ASVs) were generated using the DADA2 algorithm [35], which involved quality-based trimming, filtering, and chimera detection and removal. The taxonomic annotation of the reads was carried out using the SILVA reference database (SSU, release 138) [36]. The phylogenetic diversity was measured using Faith’s phylogenetic diversity and weighted and unweighted UniFrac metrics. The q2-diversity plugin was used to compute several metrics for alpha and beta diversity analysis, and the resulting data were used to generate principal coordinates analysis (PCoA) plots using Emperor for each beta diversity.

3. Results

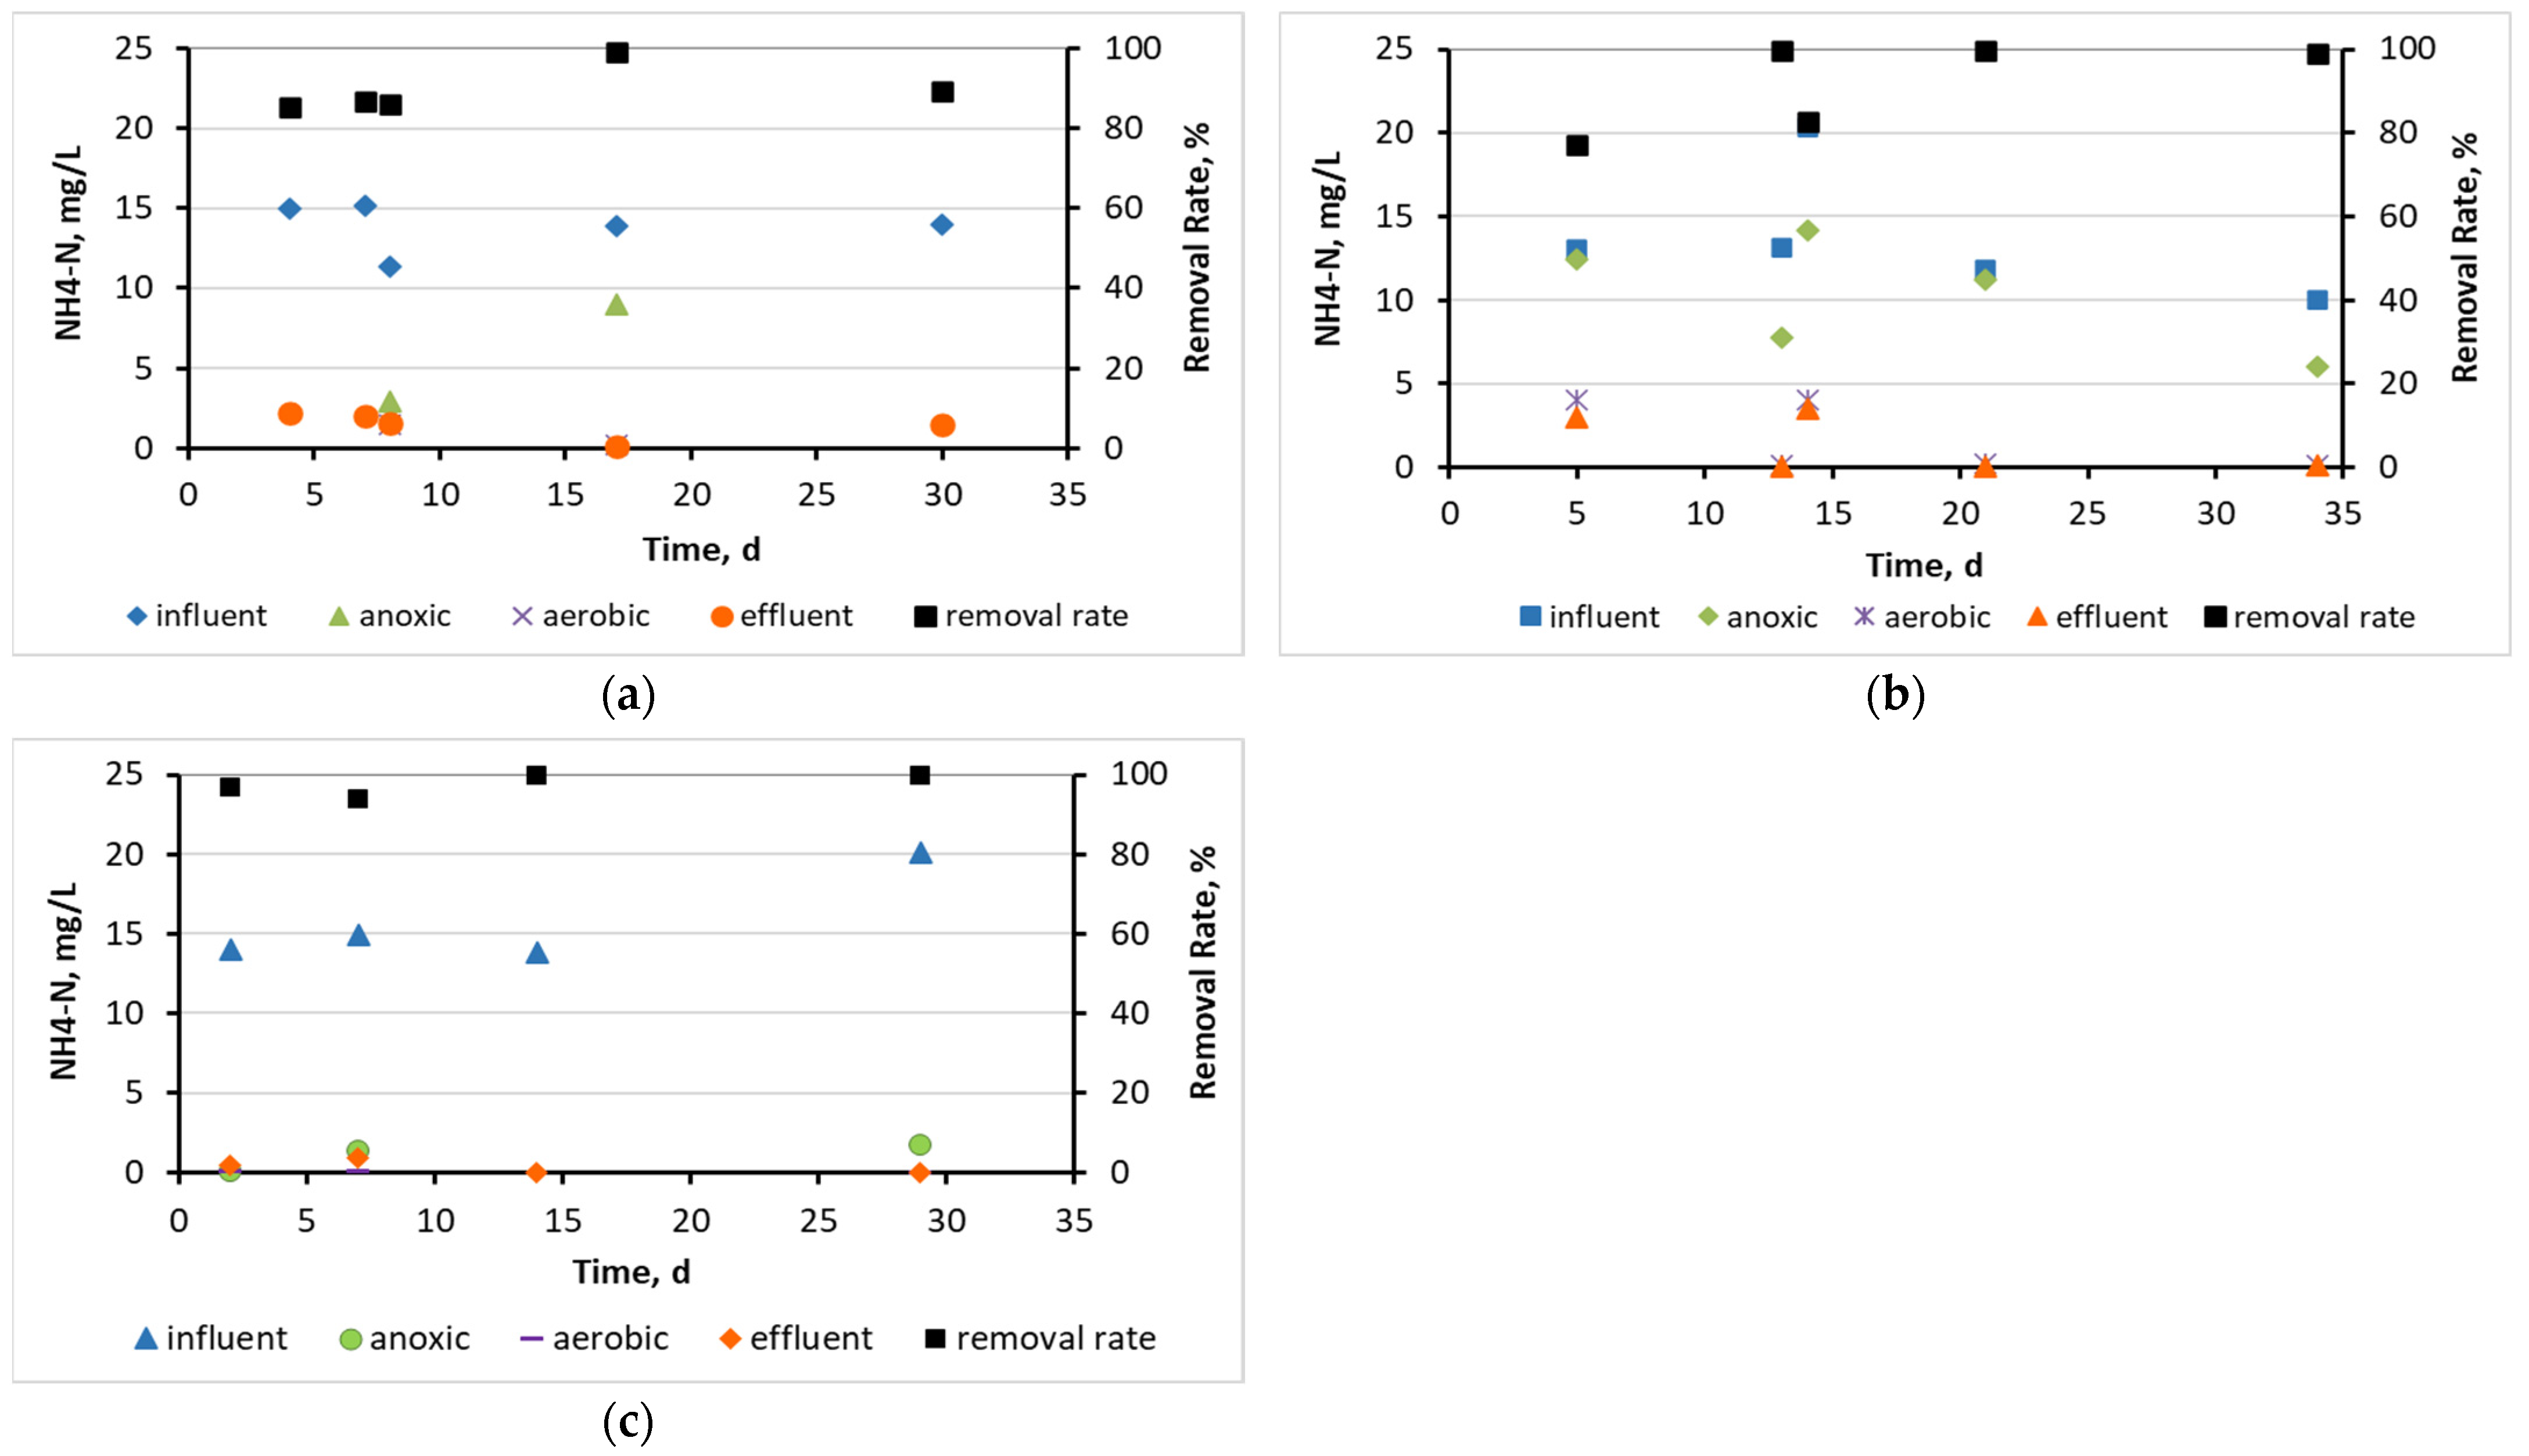
3.1. Wastewater Treatment Efficiency and Physicochemical Parameters in the Three MBBRs

In this section, the results of the three MBBR experiments are compared and presented. DO during the aerobic phase was controlled at 2.0–4.0 mg/L for an efficient wastewater biodegradation [37] but also to have similar conditions in all three experiments. More specifically, in control MBBR, DO ranged from 3.1 ± 0.7 mg/L, in ΜΒΒR K1 from 2.6 ± 0.8 mg/L, and in MBBR 3D from 2.8 ± 0.6 mg/L.
Figure 4 shows the COD concentration diagrams comparatively for the influent and effluent in all three experiments, as well as the soluble COD concentration for the anoxic and aerobic phases and the COD removal rate. As observed, a removal rate of 88% was achieved in the control MBBR, 92% in MBBR K1, and 84% in MBBR 3D. The COD variation in the inflow of all three units was 272 ± 22 mg/L, the MLSS was 2.3 ± 0.1 mg/L, and the hydraulic retention time (HRT) was 18 h. The value of food/microorganisms (F/M) loading equaled 0.08 g COD/g MLSS/d and therefore varied within the desirable value range for effective wastewater treatment in aerobic units. In all three experiments similar loading was used so that the results could be compared.
Figure 5, Figure 6 and Figure 7 show the NO3-N, NH4-N, and total N concentration diagrams comparatively for the influent and effluent in all three experiments, as well as the soluble NO3-N, NH4-N, and total N concentration for the anoxic and aerobic phases. Moreover, the removal rates of NH4-N and total N are presented. The values of NO3-N in the control MBBR increased by 89% (Figure 5) in the effluent of the unit, while during the anoxic and aerobic phase intermediate values were observed between the influent and the effluent values. In MBBR K1 NO3-N concentration increased at a lower rate by 68%, while in MBBR 3D it increased slightly more than the control MBBR, by 89.5%. As shown in Figure 6, there was an efficient decrease in ΝH4-Ν concentration in all three MBBR units, leading to an average effluent concentration of about 1.5 mg/L for control MBBR and MBBR K1, while the concentration decreased even more for MBBR 3D, in which it was equal to 0.4 mg/L. Finally, in the control MBBR, the value of total N (Figure 7) in the influent was 37 mg/L and it was reduced to 25 mg/L in the effluent. In MBBR K1, it was reduced a little more, from 37 mg/L in the influent to 23 mg/L in the effluent, and, finally, in MBBR 3D it started from 34 mg/L and was reduced to 18 mg/L.
Table 3 shows the SMP and EPS protein and carbohydrate concentration minimum, maximum, and average values for the anoxic and aerobic phases of all three MBBR units.
Figure 8 depicts a standard image of activated sludge taken from an optical microscope. In the anoxic phase, the aggregates’ size for the control MBBR was equal to 82 ± 20 μm, for MBBR K1 it was 72 ± 13 μm, and for MBBR 3D it was 174 ± 29 μm. The size of the aggregates seems to increase in relation to the operating time of the MBBR K1 and MBBR 3D units (Figure 9).

3.2. Evaluation of the Biofilm Developed on the Surfaces of Biocarriers

3.2.1. Biofilm Developed on the Kaldnes K1 Biocarriers

Figure 10 shows the biocarriers and the biofilm that was developed on the inside of their surfaces in relation to time. The dry mass of the biofilm that was developed in the biocarriers in relation to the operating time of the unit is presented in Table 4. The measurements regarded the biofilm that was developed on the surface of five biocarriers per day of measurement after its extraction. The SMP protein values in the biofilm of K1 biocarriers were 19 ± 3.5 mg/L and the SMP carbohydrate values were 4.0 ± 0.9 mg/L.

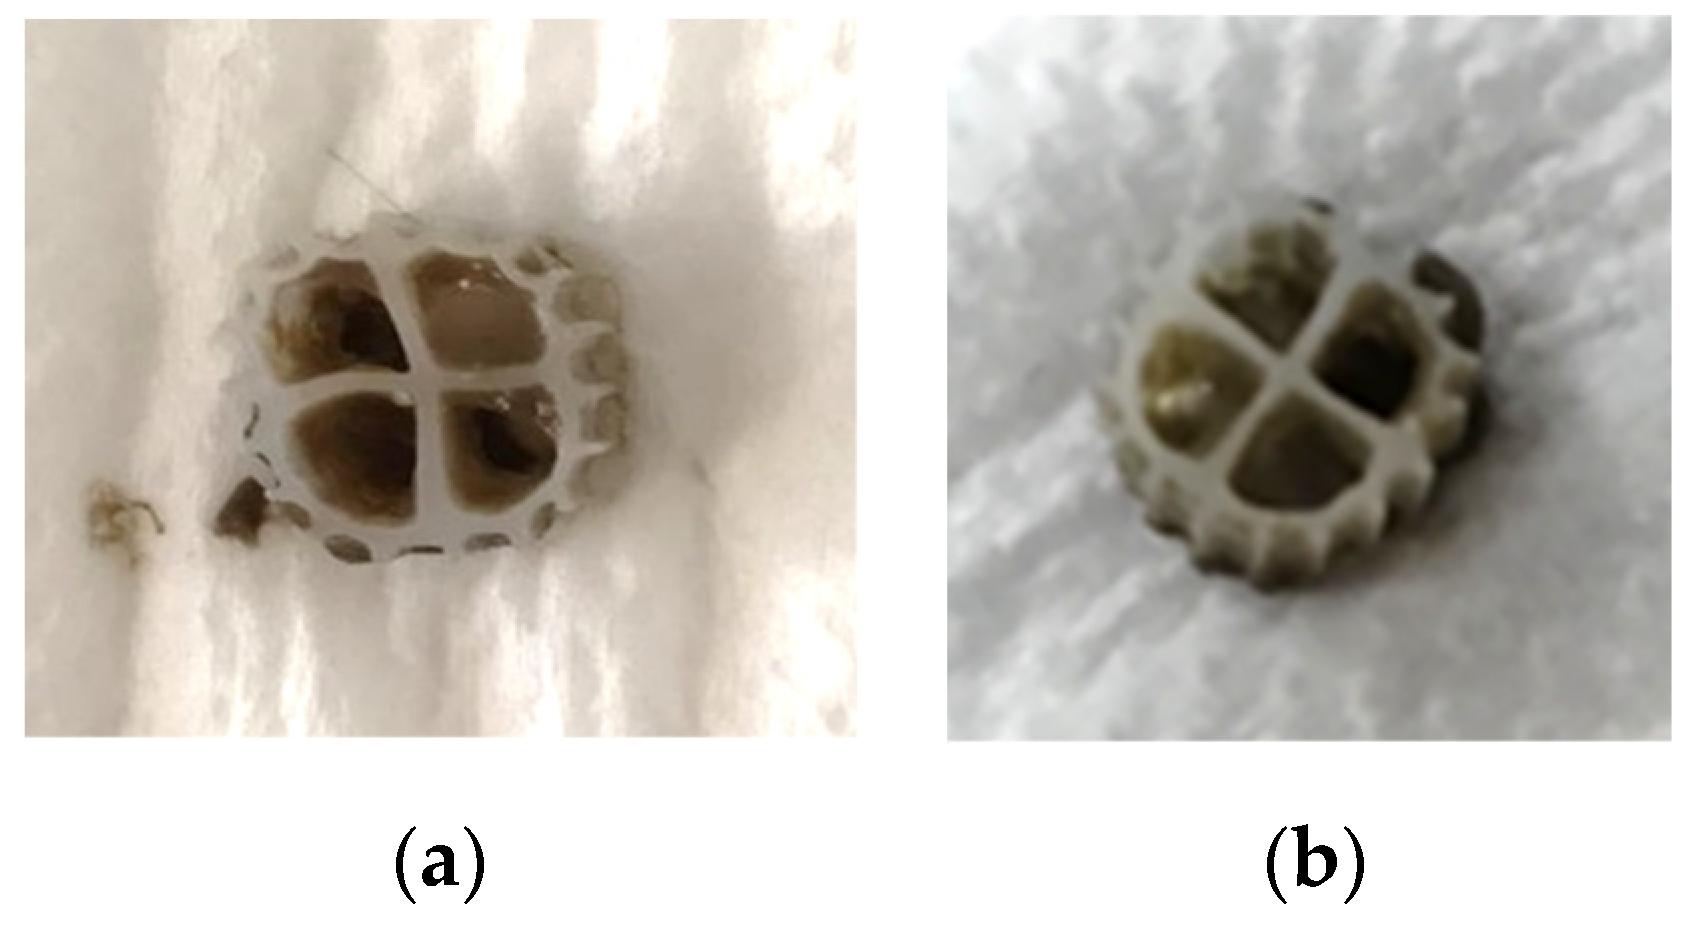
3.2.2. Biofilm on the 3D-Printed Biocarriers Developed with 13X and Bentonite

In the following figure, Figure 11, the biocarriers and the biofilm that was developed on the inside of their surfaces in relation to time are presented. The dry mass of the biofilm in relation to the operating time of the unit is presented in Table 5. The measurements in this case also regarded the biofilm that was developed on the surfaces of five biocarriers after its extraction. The SMP protein values in the biofilm of 3D-printed biocarriers were 17 ± 3.4 mg/L and the SMP carbohydrate values were 2.8 ± 2.5 mg/L.

3.2.3. Biofilm Microbiome Analysis on Biocarriers through 16S rRNA Sequencing

The results concerning the 16S rRNA microbiome analysis of the biofilm formed on the surface of both K1 and 3D-printed biocarriers on day 30 of the experiment showed that the most abundant phyla were Proteobacteria (27.7–45.1% of total reads), Actinobacteria (8.2–27.4%), Firmicutes (13.5–21.9%), and Bacteroidetes (1.25–13.1%) (Figure 12). The dominant classes for the 3D-printed biocarriers included Actinobacteria (27.4%), Alphaproteobacteria (18.14%), Bacilli (14.9%), and Clostridia (6.3%) while in the case of K1 Alphaproteobacteria (19.5%) prevailed, followed by Gammaproteobacteria (17.8%), Bacilli (10.8%), and Actinobacteria (8.2%). Planctomycentia were also found to a lesser degree with comparable abundances in both biocarriers (5.1% in 3D-printed and 6.1% in K1). At the family level, Bacillales Incertae Sedis family XII (8.4%), Planctomycetaceae (5.1%), Mycobacteriaceae (5%), Caulobacteraceae (4.9%), Carnobacteriaceae (3.7%), Rhodobacteraceae (3.5%), and Solirubrobacteraceae (3.5%) were highly enriched in 3D-printed biocarriers. Conversely, K1 biocarriers were mostly characterized by Rhodobacteraceae (13.5%), Moraxellaceae (7.3%), Planctomycetaceae (6.2%), Staphylococcaceae (4.8%), Saprospiraceae (4.7%), Aeromonadaceae (3.9%), and Caldilineaceae (3.6%). Among the genera detected, the most abundant in the case of the 3D-printed biocarriers were Exiguobacterium (8.4%), Mycobacterium (4.7%), Phenylobacterium (4.5%), Trichococcus (3.6%), and Solirubrobacter (2.7%), while in K1 biocarriers, Acinetobacter (7%) dominated, together with Gemmobacter (4.8%), Staphylococcus (4.7%), Paracoccus (3.4%), Litorilinea (2.9%), and Exiguobacterium (2.6%). The relative abundances of the microbial groups detected in the biofilm of 3D-printed carriers collected at 25 days of operation were slightly lower than those of 35 days regarding the aforementioned genera, except for Exiguobacterium (3.7%) and Trichococcus (0.4%), which exhibited quite lower numbers (data not shown). The corresponding sludge from which the 3D-printed biocarriers were collected (day 30) had a comparable microbial composition to the one within the biofilm on the biocarriers. Some families, though, were detected at differing levels, such as Planctomycetaceae (8.5%) and Carnobacteriaceae (6.4%), which were more enriched, or Caulobacteraceae (2.8%), Mycobacteriaceae (2.6%), and Bacillales Incertae Sedis family XII (0,4%), which were less abundant. Moreover, at the genus level, lower numbers of Mycobacterium (2.4%) and Phenylobacterium (2.7%) were observed and, interestingly, Exiguobacterium were only found at 0.4%. Slightly higher were the levels of Trichococcus (6.3%) and Candidatus saccharibacteria Incertae Sedis (2.3%), which were detected at 1.7% in the 3D-printed biocarriers. Figure 1 and Figure 2 depict the most highly abundant families and genera, respectively, found within the biofilm of K1 and 3D-printed biocarriers, as well as in the sludge of the latter.

4. Discussion

Based on Figure 4 and on the influent/effluent COD values, it can be concluded that there is an excellent effluent quality in all three cases, with a removal rate of 88% for the control MBBR, 92% for MBBR K1 (slightly increased), and of 84% for MBBR 3D (slightly decreased). Zinatizadeh et al. (2015) [38] found a 49–86% COD removal rate after the addition of K3 biocarriers in an MBBR with a 50% filling ratio, while Kora et al. (2020) [39] achieved a 84–96% COD removal rate after the addition of K3 biocarriers with a 33% filling ratio. Other researchers [17] concluded that COD removal when using synthetic biocarriers (including Kaldnes K1 biocarriers) was highly unstable. Therefore, on the one hand, the high performance of the current MBBR unit either after the addition of K1 biocarriers or after the addition of the 3D-printed biocarriers can be concluded. On the other hand, it turns out that the comparison between the different research results is quite difficult, as there is a huge variety of available or 3D-printed biocarriers being tested in each case and the result is highly dependent on the filling ratio and on the loading of the wastewater being tested in each case. The values of the soluble COD in the anoxic and aerobic phase in all three MBBR units were close to the effluent COD values, meaning that removal of the organic loading of wastewater had already taken place since the anoxic phase. The excellent effluent quality can be determined by comparing it to the COD limit values acceptable for wastewater discharge in water bodies. According to the World Bank Group, for the effluent quality to be characterized as excellent, either the effluent COD should be 125 mg/L or COD removal rate during wastewater treatment should be at least 75% [40].
The values of NO3-N in the control MBBR increased by 89% (Figure 5) in the effluent of the unit. In MBBR K1 NO3-N increased at a lower rate by 68%, while in MBBR 3D it increased slightly more than the control MBBR, by 89.5%. It can therefore be concluded that the nitrification process in control MBBR and MBBR 3D is more efficient than in MBBR K1. Given that the maximum permissible limit of drinking water pollution for nitrate nitrogen is 45 mg/L, it can also be concluded that, in all the MBBR units, the NO3-N values were within the limits even for drinking water [40], as shown in Figure 5.
As shown in Figure 6, the NH4-N removal rate in the control MBBR reached 89.3%, it was slightly lower in MBBR K1 with a value of 88.7%, while in MBBR 3D it reached 98%. Due to the fact that the 3D-printed biocarriers could not move enough inside the unit, more suspended biofilm was developed, something that, combined with the attached biofilm, provided additional nitrification capacity and significantly reduced the amount of ammonia in the effluent [41]. The inside surface of biocarriers is the best place for developing nitrifying bacteria and in the case of 3D-printed biocarriers, the size of the inside surface was large thanks to the appropriate design of the biocarriers. This explains their increased efficiency in the nitrification process [42]. Another crucial factor that contributed to the NH4-N removal and the corresponding NO3-N increase in MBBR 3D was zeolite, from which the 3D-printed biocarriers were fabricated, due to its cation exchange capacity [43]. Zeolite materials have strong ion exchange properties that enhance ammonia uptake by the microbes through the biocarriers.
Finally, the value of total N removal in control MBBR was 32.5%, in MBBR K1 it was higher (37%), and in MBBR 3D it was even higher (reaching 45%) (Figure 7). Consequently, it can be stated that, in MBBR K1 and even more so in MBBR 3D, the denitrification was more efficient than in control MBBR. This is due to the anoxic conditions created in the formed biofilm on the surfaces of the biocarriers, given that denitrification occurs in the absence of oxygen. The acceptable limit values of total N for wastewater discharge in water bodies are either a total N value of 10–15 mg/L or a minimum total N removal rate during wastewater treatment of 70–80% [40]. Based on this, it is concluded that in the first two MBBR cases, the total N removal rate was reduced, something that made the further treatment of wastewater necessary, while in the third case, a small improvement of the treatment method could potentially provide a sufficient total N removal. According to the survey of Zinatizabeh et al. (2015) [38], the K3 biocarriers’ addition in an MBBR resulted in 28.5–52% total N removal rate and therefore achieved similar removal of total N to the current research.
The value of SMP protein concentration (Table 3) in the control MBBR during the aerobic phase was 13 mg/L while during the anoxic phase it was slightly higher. The value of SMP carbohydrate concentration (Table 3) during aeration was 4.2 mg/L, and, similar to the case of the SMP proteins, it was slightly higher during the anoxic phase. However, in the MBBR K1 experiment the average value of SMP protein concentration was 21 mg/L during the aerobic phase while it did not change a lot during the anoxic phase. The value of SMP carbohydrate concentration during aeration was 3.3 mg/L and during the anoxic phase it was slightly higher. In the MBBR 3D experiment, the value of SMP protein concentration during aeration was 17 mg/L while during the anoxic phase the value was slightly lower. The value of SMP carbohydrate concentration during aeration was 15 mg/L, while during the anoxic phase it was slightly higher. These results show that the SMP protein concentration increased in MBBR K1 and MBBR 3D by 8 units in the former and 4 units in the latter, as compared to the control MBBR. On the contrary, the SMP carbohydrate concentration remained approximately on the same level for the first two experiments, but it increased in the activated sludge by 12 units when 3D-printed biocarriers were added.
As opposed to SMPs, the EPSs in the activated sludge were reduced in MBBR K1 compared to the control MBBR. For the aeration stage, the specific values were as follows: in the control MBBR experiment, the value of EPS proteins was 35 mg/g TSS and the value of EPS carbohydrates was 18 mg/g TSS, in the MBBR K1 experiment the value of EPS proteins was 20 mg/g TSS and the value of EPS carbohydrates was 11 mg/g TSS, and, finally, in the MBBR 3D experiment the value of EPS proteins was 15 mg/g TSS and the value of EPS carbohydrates was 6.1 mg/g TSS (Table 3).
Based on the increase in soluble SMPs produced and the decrease in bound EPSs in the MBBR K1 and MBBR 3D units, it can be concluded that the growth of nitrifying bacteria and heterotrophs inside the units increased biomass production and soluble SMP generation instead of bound EPSs. The generated SMPs favored the adhesion of biomass on the surface of biocarriers [20,21], as shown in Table 4 and Table 5.
As observed in the standard image of mixed liquor taken with an optical microscope (Figure 8), there are filamentous microorganisms protruding from the outer surfaces of the sludge flocculates, with the FI values ranging from 1–2 throughout the operation of the units for all three MBBRs [32].
In relation to the size of the aggregates, it is observed that in K1 biocarriers (Figure 9a) there is a very mild tendency for it to increase in the activated sludge, since the aggregates are light and, during agitation, they break up the developing sludge flocculates. However, this is not the case for 3D-printed biocarriers (Figure 9b) in which a larger tendency for the increase in sludge flocculates is observed because they are heavier than K1 and their agitation is much milder. As a result, sludge flocculates are properly developed in the activated sludge and biofilm is also produced on the surface of the biocarriers, combining attached and suspended biofilm growth.
As shown in Figure 10, biofilm is clearly produced not only inside the biocarriers of MBBR K1, but also on the trabecular surfaces of the biocarriers’ walls. On the 14th day of the unit operation, it was observed that biofilm was created inside three out of the four quadrants of the biocarrier as well as on its trabecular surfaces. On the 29th day of the unit operation, biofilm was created in all four quadrants of the biocarrier.
The dry mass of the biofilm that was developed in the Κ1 biocarriers ranged from 3.1–4.5 mg (Table 4). These fluctuations in the values are attributed to the large size of the holes in K1 biocarriers, due to which it is not possible to sufficiently maintain the biofilm created. The generated biofilm is quite fluid and as a result it easily detaches due to the aeration and the agitation that take place in the unit. This periodic reduction of biofilm in the biocarriers is the reason for the reduced performance of biocarriers in wastewater treatment using the MBBR K1 unit. Consequently, it could be suggested that biocarriers with smaller but more holes could potentially resolve the issue of biofilm detachment during aerobic wastewater treatment.
In the case of 3D-printed biocarriers with 13X and bentonite, the above issue was resolved, as the biocarriers were produced with holes smaller in size but more in quantity. As shown in Figure 11 and mostly in Table 5, 3D-printed biocarriers managed to hold much more biofilm mass, ranging from 641–867 mg, which means that the biofilm mass was two orders of magnitude larger compared to K1 biocarriers. A small fluctuation in the values is also observed in this case during the operation of the units, which is due to the aeration. Nevertheless, this can be considered negligible, as most of the biofilm is retained inside the holes and protected. The very high biofilm growth and retention in the case of 3D biocarriers is the reason why the nitrification and denitrification performance during wastewater treatment was significantly improved while EPS proteins and carbohydrates in the mixed liquor activated sludge were reduced.
According to Figure 12, the microbial community analysis showed an enhanced presence of the Clostridia class in the 3D-printed biocarriers, which have sulfate-reducing capabilities [44] and are known glucose fermenters, generating products critically involved in methane production [16]. Their greater prevalence together with Bacilli compared to the K1 ring may indicate that 3D-printed biocarriers are likely to favor the formation of thicker biofilm, composed of anaerobic bacterial groups that are linked to methane production pathways. Moreover, Exiguobacterium, belonging to Bacillales Incertae Sedis family XII, which were found in higher abundance in 3D-printed carriers than in K1 or sludge, have been reported to form biofilm on the surface of biocarriers [45]. Another genus found more enriched in 3D-printed biocarriers compared to K1 was Trichococcus (Carnobacteriaceae), which is involved in the degradation of various substrates, like polysaccharides, alcohols, and sugars [46], and participates in denitrification [47]. Additionally, Phenylobacterium (Caulobacteraceae) is a genus more commonly observed with biofilm succession, due to limited motility, which potentially hampers its ability to colonize surfaces early on [48]. Of note, this genus was more evident in the biofilm of 3D-printed biocarriers in comparison with the one of the K1 ring, corroborating the possibility of a faster biofilm formation on the surface of 3D-printed carriers. Acinetobacter (Moraxellaceae), on the other hand, were substantially more abundant in K1 than in both the 3D-printed carriers and the sludge. This group is implicated in denitrification, nitrification, and phosphorus removal, however, its function in fermentation can be readily substituted by other fermenters under anaerobic conditions [49]. Rhodobacteraceae, mainly composed of Gemmobacter and Paracoccus, were also found higher in numbers in the biofilm of the K1 ring, and members of this group are typically among the first organisms to colonize and contribute to biofilm formation [50], suggesting that the biofilm development on the K1 carriers might have been in a more primary stage at the time of sampling.

5. Conclusions

The findings of this research suggest that the effluent quality in relation to COD removal for all three MBBR units is excellent since the removal rate percentage reaches 84–92%. During the outflow phase in the unit, the value of NO3-N was increased by 89% in the control MBBR, by 68% in MBBR K1, and by 89.5% in MBBR 3D. The NH4-N removal rate reached 89.3% in control MBBR, 88.7% in MBBR K1, while it reached 98% in MBBR 3D. Finally, the value of total N removal was 32.5% in control MBBR, 37% in MBBR K1, and 45% in MBBR 3D. For all three parameters, it is clear that the addition of 3D-printed biocarriers is the most profitable option, as it allows the nitrification and denitrification processes to be carried out more efficiently due to the growth of a large amount of biofilm, which is kept protected in the biocarriers’ holes for the whole duration of the unit operation. The inside of the biocarriers is the most suitable area for nitrifying bacterial growth. The nitrifying bacteria help improve nitrification and at the same time create anoxic conditions in the inside of biofilm which improves denitrification.
More specifically, the dry mass of the biofilm that was developed in the Κ1 biocarriers ranged from 3.1–4.5 mg, while in 3D-printed biocarriers it was increased by two orders of magnitude to 641–867 mg. Furthermore, in the K1 biocarriers, the mass of the biofilm fluctuated in relation to time, due to the fact that they could not keep the biofilm inside the holes, something that was not observed in the 3D-printed biocarriers.
Furthermore, it can be concluded that the cumulative values of soluble SMP increased from 17 mg/L in the control MBBR, to 24 mg/L in MBBR K1 and to 32 mg/L in MBBR 3D. Therefore, it is concluded that the growth of nitrifying bacteria and heterotrophs inside the units increased biomass production in the form of soluble SMP, which in turn favored the adhesion of biomass on the surface of biocarriers.

Author Contributions

Funding acquisition, T.S.; Investigation, D.C.B.; Methodology, D.C.B., A.G.C., A.M. and M.T.; Software, D.C.B.; Supervision, D.C.B., P.S. and T.S.; Validation, D.C.B., P.S., A.G.C., A.M. and A.Z.; Writing—original draft, D.C.B.; Writing—review and editing, D.C.B. All authors have read and agreed to the published version of the manuscript.

Funding

This research was co-funded by the European Regional Development Fund of the European Union and Greek national funds through the Operational Program Competitiveness, Entrepreneurship and Innovation, under the call RESEARCH—CREATE—INNOVATE (project code: T2EDK-00362).

Data Availability Statement

Data presented in this study are available upon request from the corresponding author.

Acknowledgments

The authors wish to acknowledge colleague Ioannis Lemonidis and student Maria Andreou from the Department of Food Science and Technology, International Hellenic University, who contributed to the implementation of this study.

Conflicts of Interest

The authors declare that they have no known competing financial interests or personal relationships that could have appeared to influence the work reported in this paper.

References

  1. Boltz, J.P.; Smets, B.F.; Rittmann, B.E.; Van Loosdrecht, M.C.M.; Morgenroth, E.; Daigger, G.T. From biofilm ecology to reactors: A focused review. Water Sci. Technol. 2017, 75, 1753–1760. [Google Scholar] [CrossRef]
  2. Kawan, J.A.; Abu Hasan, H.; Suja, F.; Jaafar, O.; Abd-Rahman, R. A review on sewage treatment and polishing using moving bed bioreactor (MBBR). J. Eng. Sci. Technol. 2016, 11, 1098–1120. [Google Scholar]
  3. Avellán, T.; Hahn, A.; Kirschke, S.; Müller, A.; Benavides, L.; Caucci, S. Co-generating knowledge in nexus research for sustainable wastewater treatment. Resources 2022, 11, 93. [Google Scholar] [CrossRef]
  4. Banti, D.C.; Tsangas, M.; Samaras, P.; Zorpas, A. LCA of a membrane bioreactor compared to activated sludge system for municipal wastewater treatment. Membranes 2020, 10, 421. [Google Scholar] [CrossRef]
  5. Zhao, Y.; Liu, D.; Huang, W.; Yang, Y.; Ji, M.; Nghiem, L.D.; Trinh, Q.T.; Tran, N.H. Insights into biofilm carriers for biological wastewater treatment processes: Current state-of-the-art, challenges, and opportunities. Bioresour. Technol. 2019, 288, 121619. [Google Scholar] [CrossRef] [PubMed]
  6. Dezotti, M.; Lippel, G.; Bassin, J.P. Advanced Biological Processes for Wastewater Treatment: Emerging, Consolidated Technologies and Introduction to Molecular Techniques; Springer: Berlin, Germany, 2017; ISBN 9783319588353. [Google Scholar]
  7. Saidulu, D.; Majumder, A.; Gupta, A.K. A systematic review of moving bed biofilm reactor, membrane bioreactor, and moving bed membrane bioreactor for wastewater treatment: Comparison of research trends, removal mechanisms, and performance. J. Environ. Chem. Eng. 2021, 9, 106112. [Google Scholar] [CrossRef]
  8. Conserva, S.; Tatti, F.; Torretta, V.; Ferronato, N.; Viotti, P. An integrated approach to the biological reactor-sedimentation tank system. Resources 2019, 8, 94. [Google Scholar] [CrossRef] [Green Version]
  9. Dong, Y.; Fan, S.Q.; Shen, Y.; Yang, J.X.; Yan, P.; Chen, Y.P.; Li, J.; Guo, J.S.; Duan, X.M.; Fang, F.; et al. A novel bio-carrier fabricated using 3D Printing technique for wastewater treatment. Sci. Rep. 2015, 5, 12400. [Google Scholar] [CrossRef] [PubMed] [Green Version]
  10. Tang, B.; Song, H.; Bin, L.; Huang, S.; Zhang, W.; Fu, F.; Zhao, Y.; Chen, Q. Bioresource Technology Determination of the profile of DO and its mass transferring coefficient in a biofilm reactor packed with semi-suspended bio-carriers. Bioresour. Technol. 2017, 241, 54–62. [Google Scholar] [CrossRef] [PubMed]
  11. Gerard, M.H. Troubleshooting the Sequencing Batch Reactor; John Wiley & Sons, Inc., Publication: Hoboken, NJ, USA, 2011; ISBN 9781118058220. [Google Scholar]
  12. Felföldi, T.; Jurecska, L.; Vajna, B.; Barkács, K.; Makk, J.; Cebe, G.; Szabó, A.; Záray, G.; Márialigeti, K. Texture and type of polymer fiber carrier determine bacterial colonization and biofilm properties in wastewater treatment. Chem. Eng. J. 2015, 264, 824–834. [Google Scholar] [CrossRef]
  13. Elliott, O.; Gray, S.; Mcclay, M.; Nassief, B.; Nunnelley, A.; Ekong, J.; Kardel, K.; Khoshkhoo, A.; Proaño, G.; David, M.; et al. Design and Manufacturing of High Surface Area 3D-Printed Media for Moving Bed Bioreactors for Wastewater Treatment. J. Contemp. Water Res. Educ. 2017, 160, 144–156. [Google Scholar] [CrossRef] [Green Version]
  14. Proano-Pena, G.; Carrano, A.L.; Blersch, D.M. Analysis of very-high surface area 3D-printed media in a moving bed biofilm reactor for wastewater treatment. PLoS ONE 2020, 15, e0238386. [Google Scholar] [CrossRef]
  15. Song, Z.; Su, X.; Li, P.; Sun, F.; Dong, W.; Zhao, Z.; Wen, Z.; Liao, R. Facial fabricated biocompatible homogeneous biocarriers involving biochar to enhance denitrification performance in an anoxic moving bed biofilm reactor. Bioresour. Technol. 2021, 341, 125866. [Google Scholar] [CrossRef]
  16. Chioti, A.G.; Tsioni, V.; Patsatzis, S.; Filidou, E.; Banti, D.; Samaras, P.; Economou, E.A.; Kostopoulou, E.; Sfetsas, T. Characterization of biofilm microbiome formation developed on novel 3D-printed zeolite biocarriers during aerobic and anaerobic digestion processes. Fermentation 2022, 8, 746. [Google Scholar] [CrossRef]
  17. Al-amshawee, S.K.A.; Bin, Y.; Yunus, M. Experimental investigation of bio fi lm carriers of varying shapes, sizes, and materials for wastewater treatment in fi xed bed bio fi lm reactor: A qualitative study of biocarrier performance. J. Chem. Technol. Biotechnol. 2022, 97, 2592–2606. [Google Scholar] [CrossRef]
  18. Szymula, A.; Wlazło, Ł.; Sasáková, N.; Wnuk, W.; Nowakowicz-Dębek, B. The use of natural sorbents to reduce ammonia emissions from cattle faeces. Agronomy 2021, 11, 2543. [Google Scholar] [CrossRef]
  19. Gkotsis, P.; Banti, D.; Pritsa, A.; Mitrakas, M.; Samaras, P.; Peleka, E.; Zouboulis, A. Effect of operating conditions on membrane fouling in pilot-scale mbrs; filaments growth, diminishing dissolved oxygen and recirculation rate of the activated sludge. Membranes 2021, 11, 490. [Google Scholar] [CrossRef]
  20. Bassin, J.P.; Kleerebezem, R.; Rosado, A.S.; Van Loosdrecht, M.C.M.; Dezotti, M. Effect of different operational conditions on biofilm development, nitrification, and nitrifying microbial population in moving-bed biofilm reactors. Environ. Sci. Technol. 2012, 46, 1546–1555. [Google Scholar] [CrossRef]
  21. Gupta, B.; Kumar, A.; Sarathi, P.; Lal, S. Journal of Environmental Chemical Engineering Recent advances in application of moving bed biofilm reactor for wastewater treatment: Insights into critical operational parameters, modifications, field-scale performance, and sustainable aspects. J. Environ. Chem. Eng. 2022, 10, 107742. [Google Scholar] [CrossRef]
  22. Poltak, R.F. Sequencing Batch Reactor Design and Operational Considerations Manual; New England Interstate Water Pollution Control Commission: Lowell, MA, USA, 2005; Volume 27, p. 104. [Google Scholar]
  23. Banti, D.C.; Karayannakidis, P.D.; Samaras, P.; Mitrakas, M.G. An innovative bioreactor set-up that reduces membrane fouling by adjusting the filamentous bacterial population. J. Membr. Sci. 2017, 542, 430–438. [Google Scholar] [CrossRef]
  24. Banti, D.; Mitrakas, M.; Fytianos, G.; Tsali, A.; Samaras, P. Combined effect of colloids and SMP on membrane fouling in MBRs. Membranes 2020, 10, 118. [Google Scholar] [CrossRef]
  25. Mandakhalikar, K.D.; Rahmat, J.N.; Chiong, E.; Neoh, K.G.; Shen, L.; Tambyah, P.A. Extraction and quantification of biofilm bacteria: Method optimized for urinary catheters. Sci. Rep. 2018, 8, 8069. [Google Scholar] [CrossRef]
  26. Mohamed, A.; Rajaa, A.M.; Khalid, Z.; Fouad, M.; Naima, R. Comparison of three methods for the detection of biofilm formation by clinical isolates of Staphylococcus aureus isolated in Casablanca. Int. J. Sci. Res. 2013, 5, 2319–7064. [Google Scholar]
  27. APHA (American Public Health Association). Standard Methods for the Examination of Water and Wastewater; American Public Health Association: Washington, DC, USA, 1998. [Google Scholar]
  28. Hwang, B.K.; Kim, J.H.; Ahn, C.H.; Lee, C.H.; Song, J.Y.; Ra, Y.H. Effect of disintegrated sludge recycling on membrane permeability in a membrane bioreactor combined with a turbulent jet flow ozone contactor. Water Res. 2010, 44, 1833–1840. [Google Scholar] [CrossRef]
  29. Banti, D.C.; Samaras, P.; Tsioptsias, C.; Zouboulis, A.; Mitrakas, M. Mechanism of SMP aggregation within the pores of hydrophilic and hydrophobic MBR membranes and aggregates detachment. Sep. Purif. Technol. 2018, 202, 119–129. [Google Scholar] [CrossRef]
  30. Hartree, E.F. Determination of protein: A modification of the Lowry method that gives a lineart photometric response. Anal. Biochem. 1972, 48, 422–427. [Google Scholar] [CrossRef]
  31. Dubois, M.; Gilles, K.A.; Hamilton, J.K.; Rebers, P.A.; Smith, F. Colorimetric Method for Determination of Sugars and Related Substances. Anal. Chem. 1956, 28, 350–356. [Google Scholar] [CrossRef]
  32. Eikelboom, D.H. Process Control of Activated Sludge Plants by Microscopic Investigation; IWA Publishing: Zutphen, The Netherlands, 2000. [Google Scholar]
  33. Banti, D.C.; Mitrakas, M.; Samaras, P. Membrane fouling controlled by adjustment of biological treatment parameters in step-aerating MBR. Membranes 2021, 11, 553. [Google Scholar] [CrossRef]
  34. Bolyen, E.; Rideout, J.R.; Dillon, M.R.; Bokulich, N.A.; Abnet, C.C.; Al-Ghalith, G.A.; Alexander, H.; Alm, E.J.; Arumugam, M.; Asnicar, F.; et al. Reproducible, interactive, scalable and extensible microbiome data science using QIIME 2. Nat. Biotechnol. 2019, 37, 852–857. [Google Scholar] [CrossRef]
  35. Benjamin, C.; McMurdie, P.; Rosen, M.; Han, A.; Johnson, A.; Holmes, S. DADA2:High resolution sample inference from Illumina amplicon data. Encycl. Med. Immunol. 2020, 13, 581–583. [Google Scholar]
  36. Quast, C.; Pruesse, E.; Yilmaz, P.; Gerken, J.; Schweer, T.; Yarza, P.; Peplies, J.; Glöckner, F.O. The SILVA ribosomal RNA gene database project: Improved data processing and web-based tools. Nucleic Acids Res. 2013, 41, 590–596. [Google Scholar] [CrossRef]
  37. Banti, D.C.; Tsali, A.; Mitrakas, M.; Samaras, P. The Dissolved Oxygen Effect on the Controlled Growth of Filamentous Microorganisms in Membrane Bioreactors. EWaS5 2020, 2, 39. [Google Scholar]
  38. Zinatizadeh, A.A.L.; Ghaytooli, E. Simultaneous nitrogen and carbon removal from wastewater at different operating conditions in a moving bed biofilm reactor (MBBR): Process modeling and optimization. J. Taiwan Inst. Chem. Eng. 2015, 53, 98–111. [Google Scholar] [CrossRef]
  39. Kora, E.; Theodorelou, D.; Gatidou, G.; Fountoulakis, M.S.; Stasinakis, A.S. Removal of polar micropollutants from domestic wastewater using a methanogenic—Aerobic moving bed biofilm reactor system. Chem. Eng. J. 2020, 382, 122983. [Google Scholar] [CrossRef]
  40. IFC. Environmental, Health, and Safety General Guidelines; IFC: Washington, DC, USA, 2007. [Google Scholar]
  41. Waqas, S.; Bilad, M.R.; Man, Z.; Wibisono, Y.; Jaafar, J.; Mahlia, T.M.I.; Khan, A.L.; Aslam, M. Recent progress in integrated fixed-film activated sludge process for wastewater treatment: A review. J. Environ. Manag. 2020, 268, 110718. [Google Scholar] [CrossRef]
  42. Waqas, S.; Bilad, M.R.; Man, Z.B. Performance and energy consumption evaluation of rotating biological contactor for domestic wastewater treatment. Indones. J. Sci. Technol. 2021, 6, 101–112. [Google Scholar] [CrossRef]
  43. Das, P.; Prasad, B.; Singh, K.K.K. Applicability of Zeolite Based Systems for Ammonia Removal and Recovery From Wastewater. Water Environ. Res. 2017, 89, 840–845. [Google Scholar] [CrossRef]
  44. Biswas, K.; Turner, S.J. Microbial community composition and dynamics of moving bed biofilm reactor systems treating municipal sewage. Appl. Environ. Microbiol. 2012, 78, 855–864. [Google Scholar] [CrossRef] [Green Version]
  45. Sakdapetsiri, C.; Kaokhum, N.; Pinyakong, O. Biodegradation of crude oil by immobilized Exiguobacterium sp. AO-11 and shelf life evaluation. Sci. Rep. 2021, 11, 12990. [Google Scholar] [CrossRef]
  46. Doloman, A.; Boeren, S.; Miller, C.D.; Sousa, D.Z. Stimulating Effect of Trichococcus flocculiformis on a Coculture of Syntrophomonas wolfei and Methanospirillum hungatei. Appl. Environ. Microbiol. 2022, 88, e00391-22. [Google Scholar] [CrossRef]
  47. Rodriguez-Sanchez, A.; Muñoz-Palazon, B.; Hurtado-Martinez, M.; Mikola, A.; Gonzalez-Lopez, J.; Vahala, R.; Gonzalez-Martinez, A. Analysis of microbial communities involved in organic matter and nitrogen removal in a full-scale moving bed biofilm reactor located near the Polar Arctic Circle. Int. Biodeterior. Biodegrad. 2020, 146, 104830. [Google Scholar] [CrossRef]
  48. Niederdorfer, R.; Besemer, K.; Battin, T.J.; Peter, H. Ecological strategies and metabolic trade-offs of complex environmental biofilms. Npj Biofilms Microbiomes 2017, 3, 21. [Google Scholar] [CrossRef] [Green Version]
  49. Cheng, H.; Cheng, D.; Mao, J.; Lu, T.; Hong, P.Y. Identification and characterization of core sludge and biofilm microbiota in anaerobic membrane bioreactors. Environ. Int. 2019, 133, 105165. [Google Scholar] [CrossRef]
  50. Cinà, P.; Bacci, G.; Arancio, W.; Gallo, G.; Fani, R.; Puglia, A.M.; Di Trapani, D.; Mannina, G. Assessment and characterization of the bacterial community structure in advanced activated sludge systems. Bioresour. Technol. 2019, 282, 254–261. [Google Scholar] [CrossRef]
Figure 1. Successive phases of operation of the MBBR unit.
Resources 12 00081 g001
Figure 2. MBBR flow diagram in which A: air compressor, DO: dissolved oxygen-measuring device, and PLC: programmable logic controller.
Resources 12 00081 g002
Figure 3. (a) Commercial Kaldnes Κ1 biocarriers and (b) 3D-printed biocarriers manufactured with 13Χ and bentonite.
Resources 12 00081 g003
Figure 4. COD concentration diagrams for (a) control MBBR, (b) MBBR K1, and (c) MBBR 3D.
Resources 12 00081 g004
Figure 5. ΝO3-Ν concentration diagrams for (a) control MBBR, (b) MBBR K1, and (c) MBBR 3D.
Resources 12 00081 g005
Figure 6. ΝH4-Ν concentration diagrams for (a) control MBBR, (b) MBBR K1, and (c) MBBR 3D.
Resources 12 00081 g006
Figure 7. Total N concentration diagrams for (a) control MBBR, (b) MBBR K1, and (c) MBBR 3D.
Resources 12 00081 g007
Figure 8. Standard image of the activated sludge mixed liquor during the operation of the units.
Resources 12 00081 g008
Figure 9. Size of the aggregates in the mixed liquor of the anoxic phase (a) for the MBBR Κ1 and (b) for the ΜΒΒR 3D experiments. Linear regression line is included in the graphs.
Resources 12 00081 g009
Figure 10. Biocarriers with the formed biofilm on the (a) 14th day and (b) 29th day of unit operation.
Resources 12 00081 g010
Figure 11. Biocarriers with the formed biofilm on the (a) 13th day and (b) 26th day of unit operation.
Resources 12 00081 g011
Figure 12. Relative abundance of the major families detected on the biofilm of K1 ring, 3D-printed biocarriers, and sludge at 30 days of operation.
Resources 12 00081 g012
Table 1. Zeolite and clay proportion.
MaterialPaste ContentZeolite/Clay Percentage
Zeolite13X45%89%
Inorganic binderBentonite6%11%
Colloidal silicaLudox AS-4014%
Water34%
Organic binderMethyl cellulose1%
Table 2. Special surface area, pore volume, and size of 13X/bentonite 3D-printed biocarrier compared to the values of the original materials [16].
MaterialsSpecific
Surface Area
(m2/g)
Total Pore
Volume
(cc/g)
Micropore
Volume
(cc/g)
Mesopore
Volume
(cc/g)
Micropore
Diameter
(Å)
Mesopore
Diameter
(Å)
13X6880.350.290.0610.255
Bentonite520.150.020.13na55
13X/Bentonite5900.420.240.18942,116
Table 3. SMP and EPS protein and carbohydrate concentrations for the anoxic and aerobic phase for the three MBBR units.
Control MBBRMBBR K1MBBR 3D
MinMaxAverageMinMaxAverageMinMaxAverage
SMP proteins
Anoxic phase
102216 ± 4.3103320 ± 7.5102115 ± 4.6
SMP proteins
Aerobic phase
6.11813 ± 4.3122921 ± 6.6132017 ± 3.6
SMP carbohydrates
Anoxic phase
1.9125.6 ± 3.62.7125.9 ± 3.30.66.53.0 ± 3.0
SMP carbohydrates
Aerobic phase
0.99.44.2 ± 2.90.35.43.3 ± 2.10.162.6 ± 2.2
EPS proteins
Anoxic phase
404241 ± 1.07.63821 ± 8.6102217 ± 5.9
EPS proteins
Aerobic phase
284235 ± 7.0113820 ± 8.36.52015 ± 6.5
EPS carbohydrates
Anoxic phase
122319 ± 5.0112114 ± 3.32.5137.3 ± 4.9
EPS carbohydrates
Aerobic phase
132318 ± 5.05.71611 ± 3.62.7106.1 ± 3.3
Table 4. Dry mass of the biofilm developed in the biocarriers in relation to the operating time of the unit.
t, dDry Mass of Biofilm, mg
143.5 ± 0.003
213.2 ± 0.007
294.5 ± 0.004
353.1 ± 0.004
Table 5. Dry mass of the biofilm developed in the biocarriers in relation to the operating time of the unit.
t, dDry Mass of Biofilm, mg
7772 ± 117
13831 ± 46
21700 ± 121
26641 ± 76
35867 ± 161
Disclaimer/Publisher’s Note: The statements, opinions and data contained in all publications are solely those of the individual author(s) and contributor(s) and not of MDPI and/or the editor(s). MDPI and/or the editor(s) disclaim responsibility for any injury to people or property resulting from any ideas, methods, instructions or products referred to in the content.

