
Understanding the Socio-Demographic Profile of Waste Re-Users in a Suburban Setting in South Africa


Abstract
:1. Introduction
2. Materials and Methods
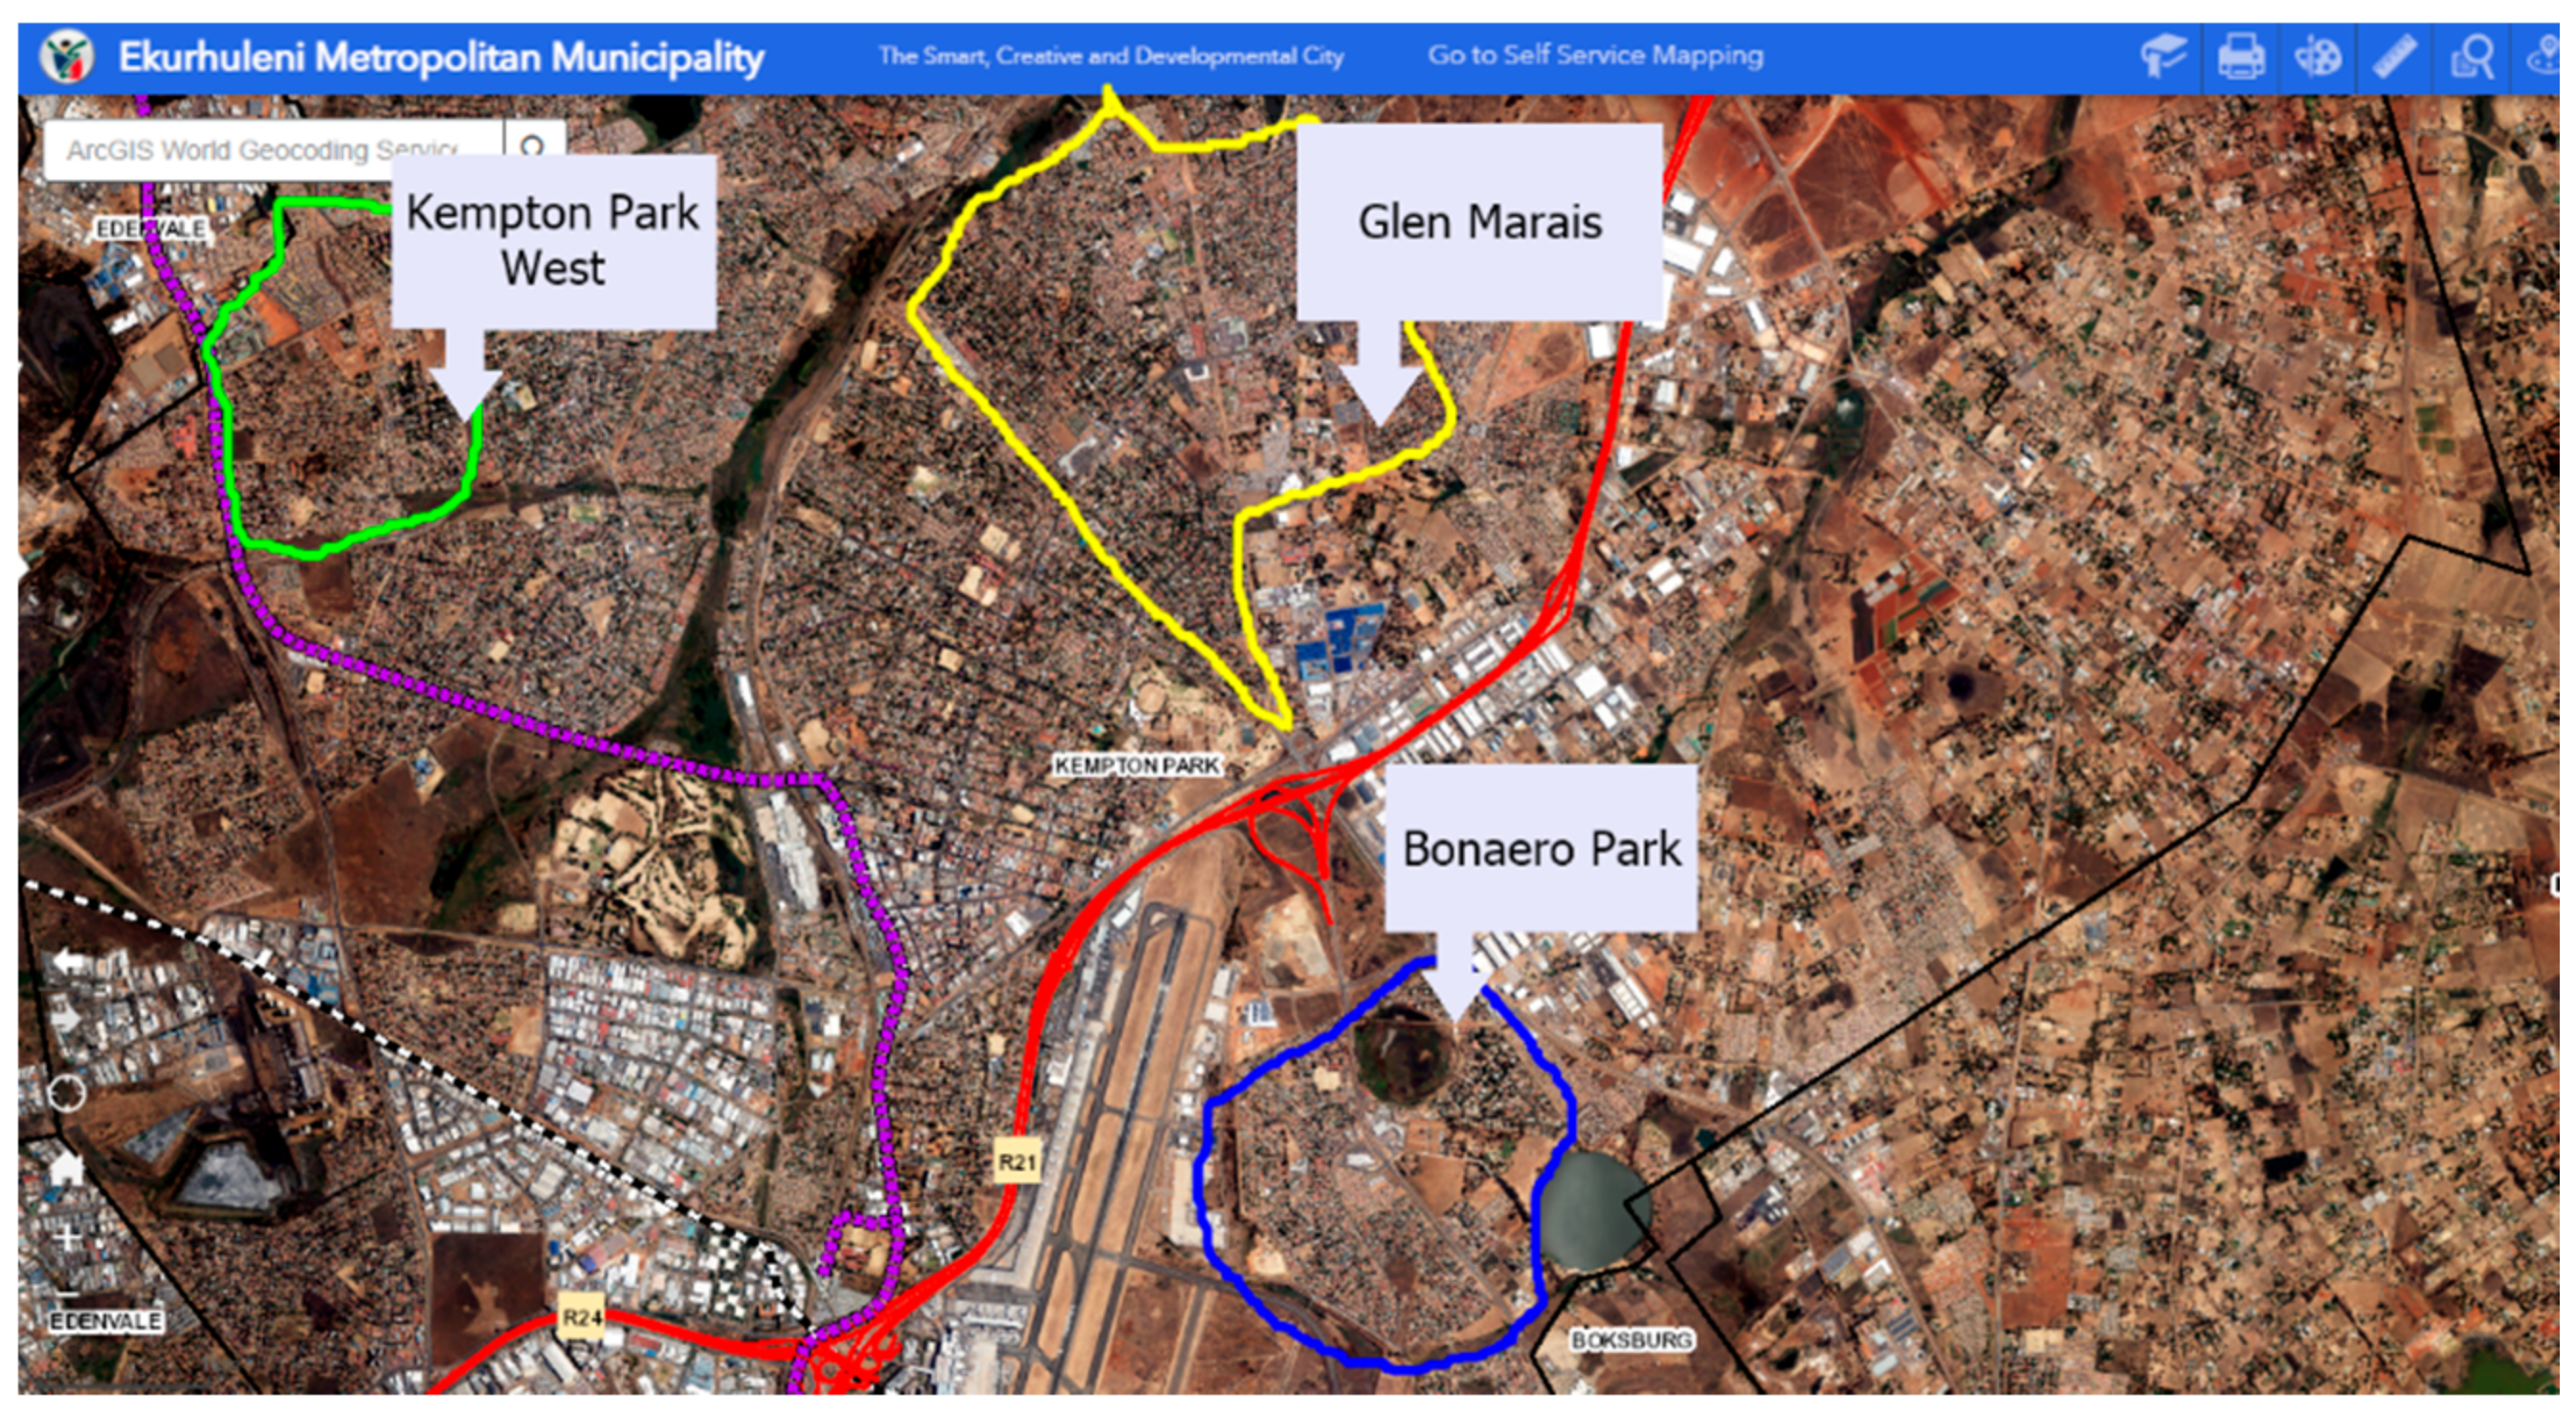
2.1. Study Area
2.2. Sampling
2.3. Data Collection Tool
2.4. Statistical Analysis
3. Results
3.1. Re-Use Activities
3.2. Influences of Re-Use Behaviour
4. Discussion
5. Conclusions
Author Contributions
Funding
Institutional Review Board Statement
Informed Consent Statement
Data Availability Statement
Conflicts of Interest
References
- Pires, A.; Martinho, G. Waste hierarchy index for circular economy in waste management. Waste Manag. 2019, 95, 298–305. [Google Scholar] [CrossRef] [PubMed]
- Department of Environmental Affairs (DEA). National Waste Management Strategy; Department of Environmental Affairs: Pretoria, South Africa, 2020.
- Republic of South Africa: Department of Environmental Affairs. National Environmental Management Act: Waste Act; Act 59 of 2008; Government Printer: Pretoria, South Africa, 2008.
- Rasmeni, Z.Z.; Madyira, D.M. A review of the current municipal solid waste management practices in Johannesburg city townships. Procedia Manuf. 2019, 35, 1025–1031. [Google Scholar] [CrossRef]
- Zelaziński, T.; Słoma, J.; Skudlarski, J.; Ekielski, A. The rape pomace and microcrystalline cellulose composites made by press processing. Sustainability 2020, 12, 1311. [Google Scholar] [CrossRef] [Green Version]
- Dilkes-Hoffman, L.S.; Lane, J.L.; Grant, T.; Pratt, S.; Lant, P.A.; Laycock, B. Environmental impact of biodegradable food packaging when considering food waste. J. Clean. Prod. 2018, 180, 325–334. [Google Scholar] [CrossRef]
- Kakadellis, S.; Woods, J.; Harris, Z.M. Friend or foe: Stakeholder attitudes towards biodegradable plastic packaging in food waste anaerobic digestion. Resour. Conserv. Recycl. 2021, 169, 105529. [Google Scholar] [CrossRef]
- Van Ewijk, S.; Stegemann, J.A. Limitations of the waste hierarchy for achieving absolute reductions in material throughput. J. Clean. Prod. 2016, 132, 122–128. [Google Scholar] [CrossRef] [Green Version]
- Oelofse, S.; Godfrey, L. Moving beyond the age of waste. S. Afr. J. Sci. 2008, 104, 242–246. [Google Scholar]
- Birhanu, Y.; Berisa, G. Assessment of Solid Waste Management Practices and the Role of Public Participation in Jigjiga Town, Somali Regional State, Ethiopia. Int. J. Environ. Prot. Policy 2015, 3, 153–168. [Google Scholar] [CrossRef] [Green Version]
- Monella, J.; Leyaro, V. Determinants of Households Willingness to Participate in Solid Waste Separation for Reduce, Reuse and Recycle: The Case of Dar es Salaam. Tanzan. Econ. Rev. 2017, 3, 57–82. [Google Scholar]
- Numata, D.; Managi, S. Demand for refilled reusable products. Environ. Econ. Policy Stud. 2012, 14, 421–436. [Google Scholar] [CrossRef]
- Viljoen, J.M.M.; Schenck, C.J.; Volschenk, L.; Blaauw, P.F.; Grobler, L. Household waste management practices and challenges in a rural remote town in the Hantam Municipality in the Northern Cape, South Africa. Sustainability 2021, 13, 5903. [Google Scholar] [CrossRef]
- Ncube, L.K.; Ude, A.U.; Ogunmuyiwa, E.N.; Zulkifli, R.; Beas, I.N. Environmental impact of food packaging materials: A review of contemporary development from conventional plastics to polylactic acid based materials. Materials 2020, 13, 4994. [Google Scholar] [CrossRef] [PubMed]
- Balundė, A.; Perlaviciute, G.; Steg, L. The relationship between people’s environmental considerations and pro-environmental behavior in Lithuania. Front. Psychol. 2019, 10, 02319. [Google Scholar] [CrossRef] [PubMed] [Green Version]
- Longhi, S. Individual Pro-Environmental Behaviour in the Household Context; ISER Working Paper Series; Institute for Social and Economic Research (ISER), University of Essex: Colchester, UK, 2013; p. 31. [Google Scholar]
- Patel, J.; Modi, A.; Paul, J. Pro-environmental behavior and socio-demographic factors in an emerging market. Asian J. Bus. Ethics 2017, 6, 189–214. [Google Scholar] [CrossRef]
- Chen, X.; Peterson, M.N.; Hull, V.; Lu, C.; Lee, G.D.; Hong, D.; Liu, J. Effects of attitudinal and sociodemographic factors on pro-environmental behaviour in urban China. Environ. Conserv. 2011, 38, 45–52. [Google Scholar] [CrossRef] [Green Version]
- Chapman, J. Who Does What? The Pro-Environmental Behaviours of Australian Workers; Centre for Work + Life, University of South Australia: Adelaide, Australia.
- Shafiei, A.; Maleksaeidi, H. Pro-environmental behavior of university students: Application of protection motivation theory. Glob. Ecol. Conserv. 2020, 22, e00908. [Google Scholar] [CrossRef]
- Palupi, T.; Sawitri, D.R. The Importance of Pro-Environmental Behavior in Adolescent. In Proceedings of the 2nd International Conference on Energy, Environmental and Information System (ICENIS 2017), Semarang, Indonesia, 15–16 August 2018; Volume 31, pp. 2–5. [Google Scholar] [CrossRef]
- Lange, S.L. The behaviour and attitudes of Kempton Park communities with reference to reusing domestic waste. Int. J. Environ. Waste Manag. 2019, 24, 117–130. [Google Scholar] [CrossRef]
- Statistics South Africa. General Household Survey: 2019; Statistics South Africa: Pretoria, South Africa, 2019; Volume 21, p. 482.
- Francis, J.J.; Eccles, M.P.; Johnston, M.; Walker, A.; Grimshaw, J.; Kaner, E.F.S.; Smith, L.; Bonnetti, D. Constructing Questionnaires Based on the Theory of Planned Behaviour (Manual); Centre for Health Services Research: Newcastle upon Tyne, UK, 2004. [Google Scholar]
- Borusiak, B.; Szymkowiak, A.; Horska, E.; Raszka, N.; Zelichowska, E. Towards building sustainable consumption: A study of second-hand buying intentions. Sustainability 2020, 12, 875. [Google Scholar] [CrossRef] [Green Version]
- Statistics South Africa. Quarterly Labour Force Survey; Statistics South Africa: Pretoria, South Africa, 2021; pp. 1–70.
- Kamara, A.J. Household Participation in Domestic Waste Disposal and Recycling in the Tshwane Metropolitan Area: A Perspective. Master’s Thesis, University of South Africa, Pretoria, South Africa, 2006. [Google Scholar]
- Sekarningrum, B.; Yunita, D.; Suprayogi, Y. Assessing the Level of Community Social Awareness in Realizing Waste-Free Zone. Rev. Integr. Bus. Econ. Res. 2020, 9, 125–133. [Google Scholar]
- Asteria, D.; Haryanto, J.T. Empowerment key factors in shaping women’s awareness of household waste management. Glob. J. Environ. Sci. Manag. 2021, 7, 317–330. [Google Scholar] [CrossRef]


| Respondents | Shopping Bags | Glass Jars | Plastic Containers | Repair Broken Items | Creative Projects | No Re-Use | Donating Items to Charity | Donating Items to Domestic | Selling Items | Buying Second-Hand | Alternate Uses | Other | ||
|---|---|---|---|---|---|---|---|---|---|---|---|---|---|---|
| n = 150 | 125 (83.3%) | 97 (64.7%) | 100 (66.7%) | 56 (37.3%) | 57 (38.0%) | 9 (6.0%) | 105 (70.0%) | 99 (66.0%) | 30 (20.0%) | 52 (34.7%) | 39 (26.0%) | 1 (0.7%) | ||
| Gender | Male | 70 (46.7%) | 56 (80.0%) | 40 (57.1%) | 38 (54.3%) | 30 (42.8%) | 21 (30.0%) | 5 (7.0%) | 45 (64.2%) | 42 (60.0%) | 16 (22.8%) | 31 (44.3%) | 18 25.7%) | 0 (0.0%) |
| Female | 80 (53.3%) | 69 (86.2%) | 57 (71.2%) | 62 (77.5%) | 26 32.5%) | 36 (78.7%) | 4 (5.0%) | 60 (75.0%) | 57 (71.2%) | 14 (17.5%) | 21 (26.2%) | 21 (26.2%) | 1 (1.2%) | |
| p Value | 0.306 | 0.710 | 0.003 | 0.191 | 0.059 | 0.581 | 0.153 | 0.147 | 0.413 | 0.021 | 0.941 | 0.348 | ||
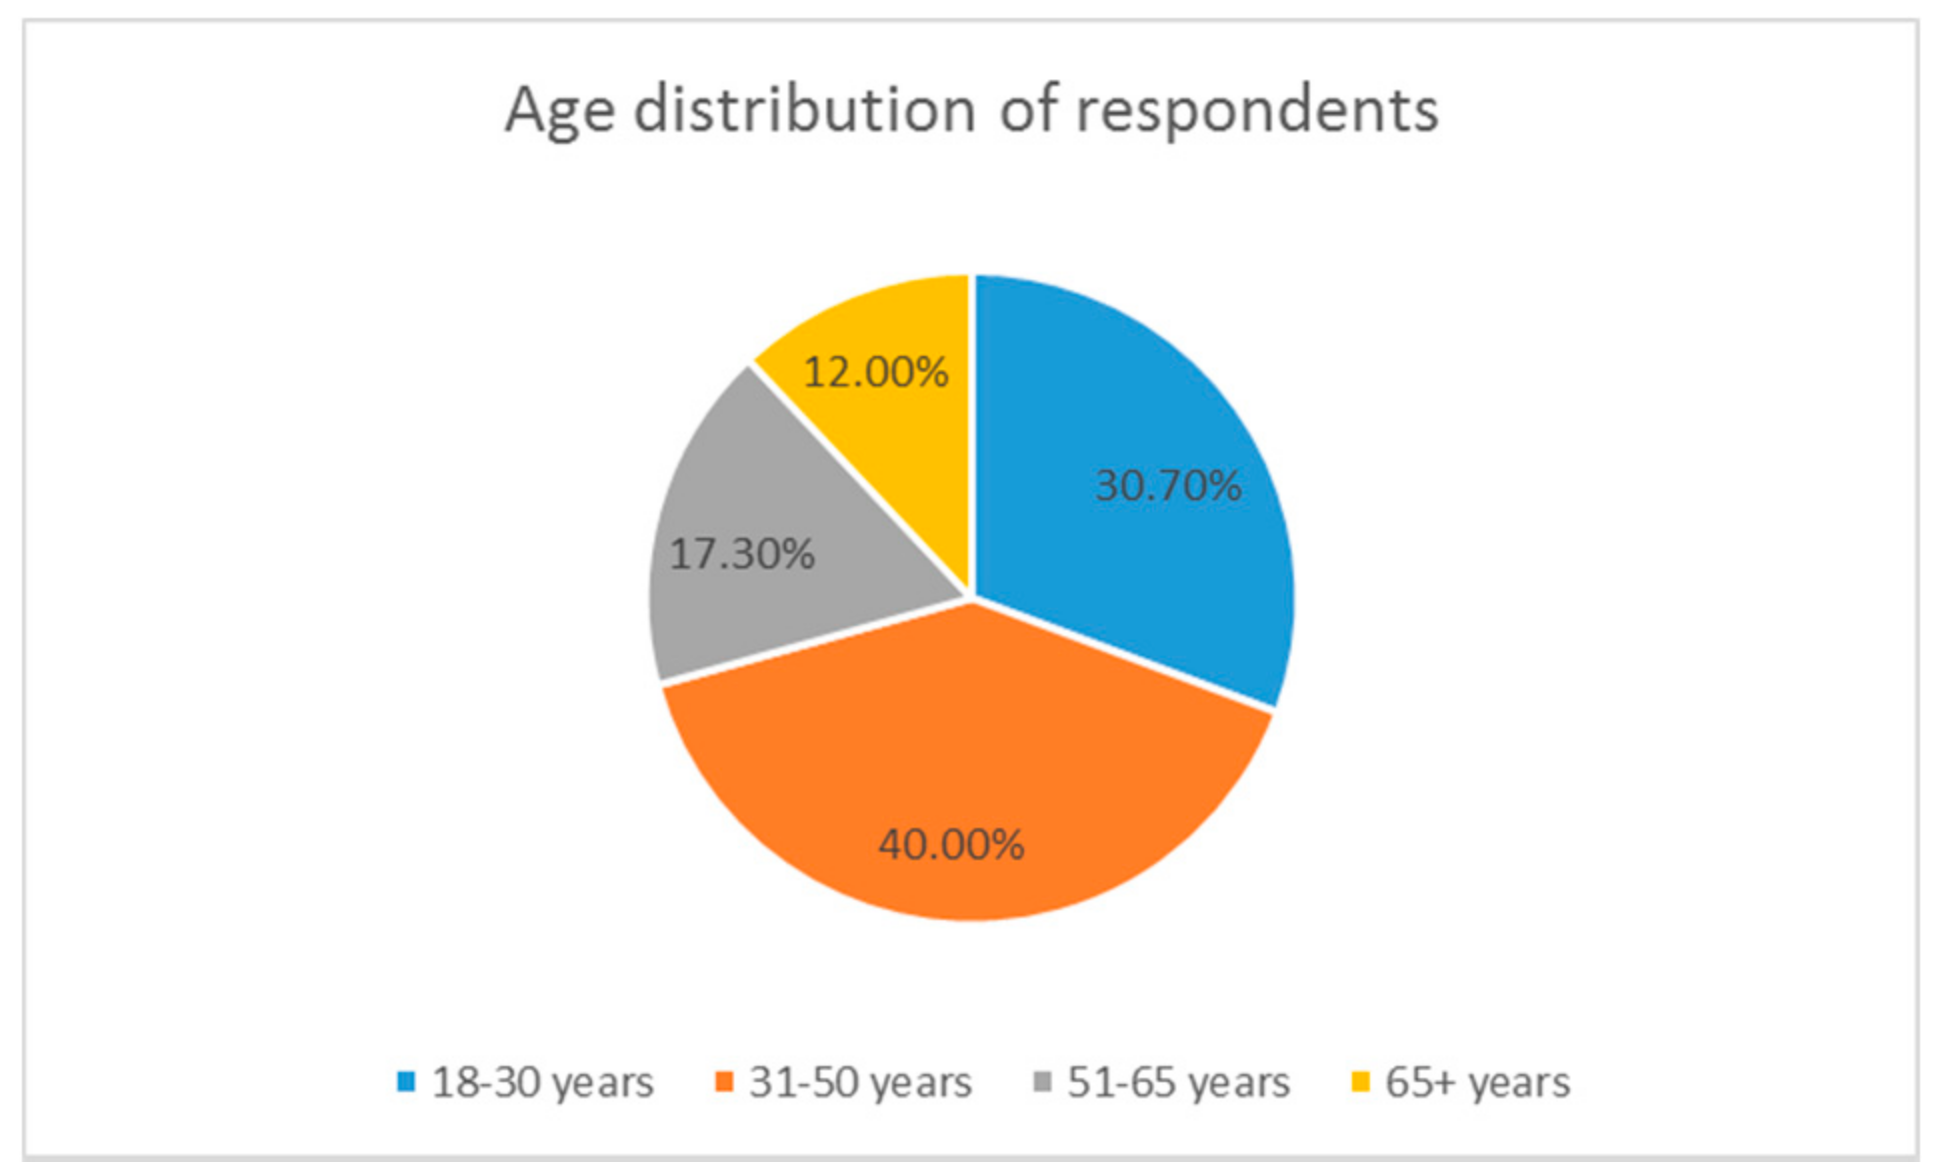
| Age Group | 18–30 years | 46 (30.7%) | 35 (76.0%) | 29 (63.0%) | 29 (63.0%) | 17 (37.0%) | 17 (37.0%) | 4 (8.7%) | 29 (63.0%) | 23 (50.0%) | 12 (26.1%) | 22 (47.8%) | 11 (23.9%) | 1 (2.1%) |
| 31–50 years | 60 (40.0%) | 52 (86.7%) | 36 (60.0%) | 43 (71.7%) | 24 (40.0%) | 24 (40.0%) | 3 (5.0%) | 42 (70.0%) | 45 (75.0%) | 15 (25.0%) | 22 (36.7%) | 13 (21.7%) | 0 (0.0%) | |
| 51–65 years | 26 (17.3%) | 23 (88.5%) | 20 (76.9%) | 17 (65.4%) | 7 (26.9%) | 11 (42.3%) | 1 (3.8%) | 20 (76.9%) | 20 (76.9%) | 1 (3.8%) | 3 (11.5%) | 8 (30.8%) | 0 (0.0%) | |
| >65 years | 18 (12.0%) | 15 (83.3%) | 12 (66.7%) | 11 (61.1%) | 8 (44.4%) | 5 (27.8%) | 1 (5.6%) | 14 (77.8%) | 11 (61.1%) | 2 (11.1%) | 5 (27.8%) | 7 (38.9%) | 0 (0.0%) | |
| p Value | 0.438 | 0.500 | 0.749 | 0.620 | 0.771 | 0.821 | 0.537 | 0.029 | 0.068 | 0.017 | 0.466 | 0.517 | ||
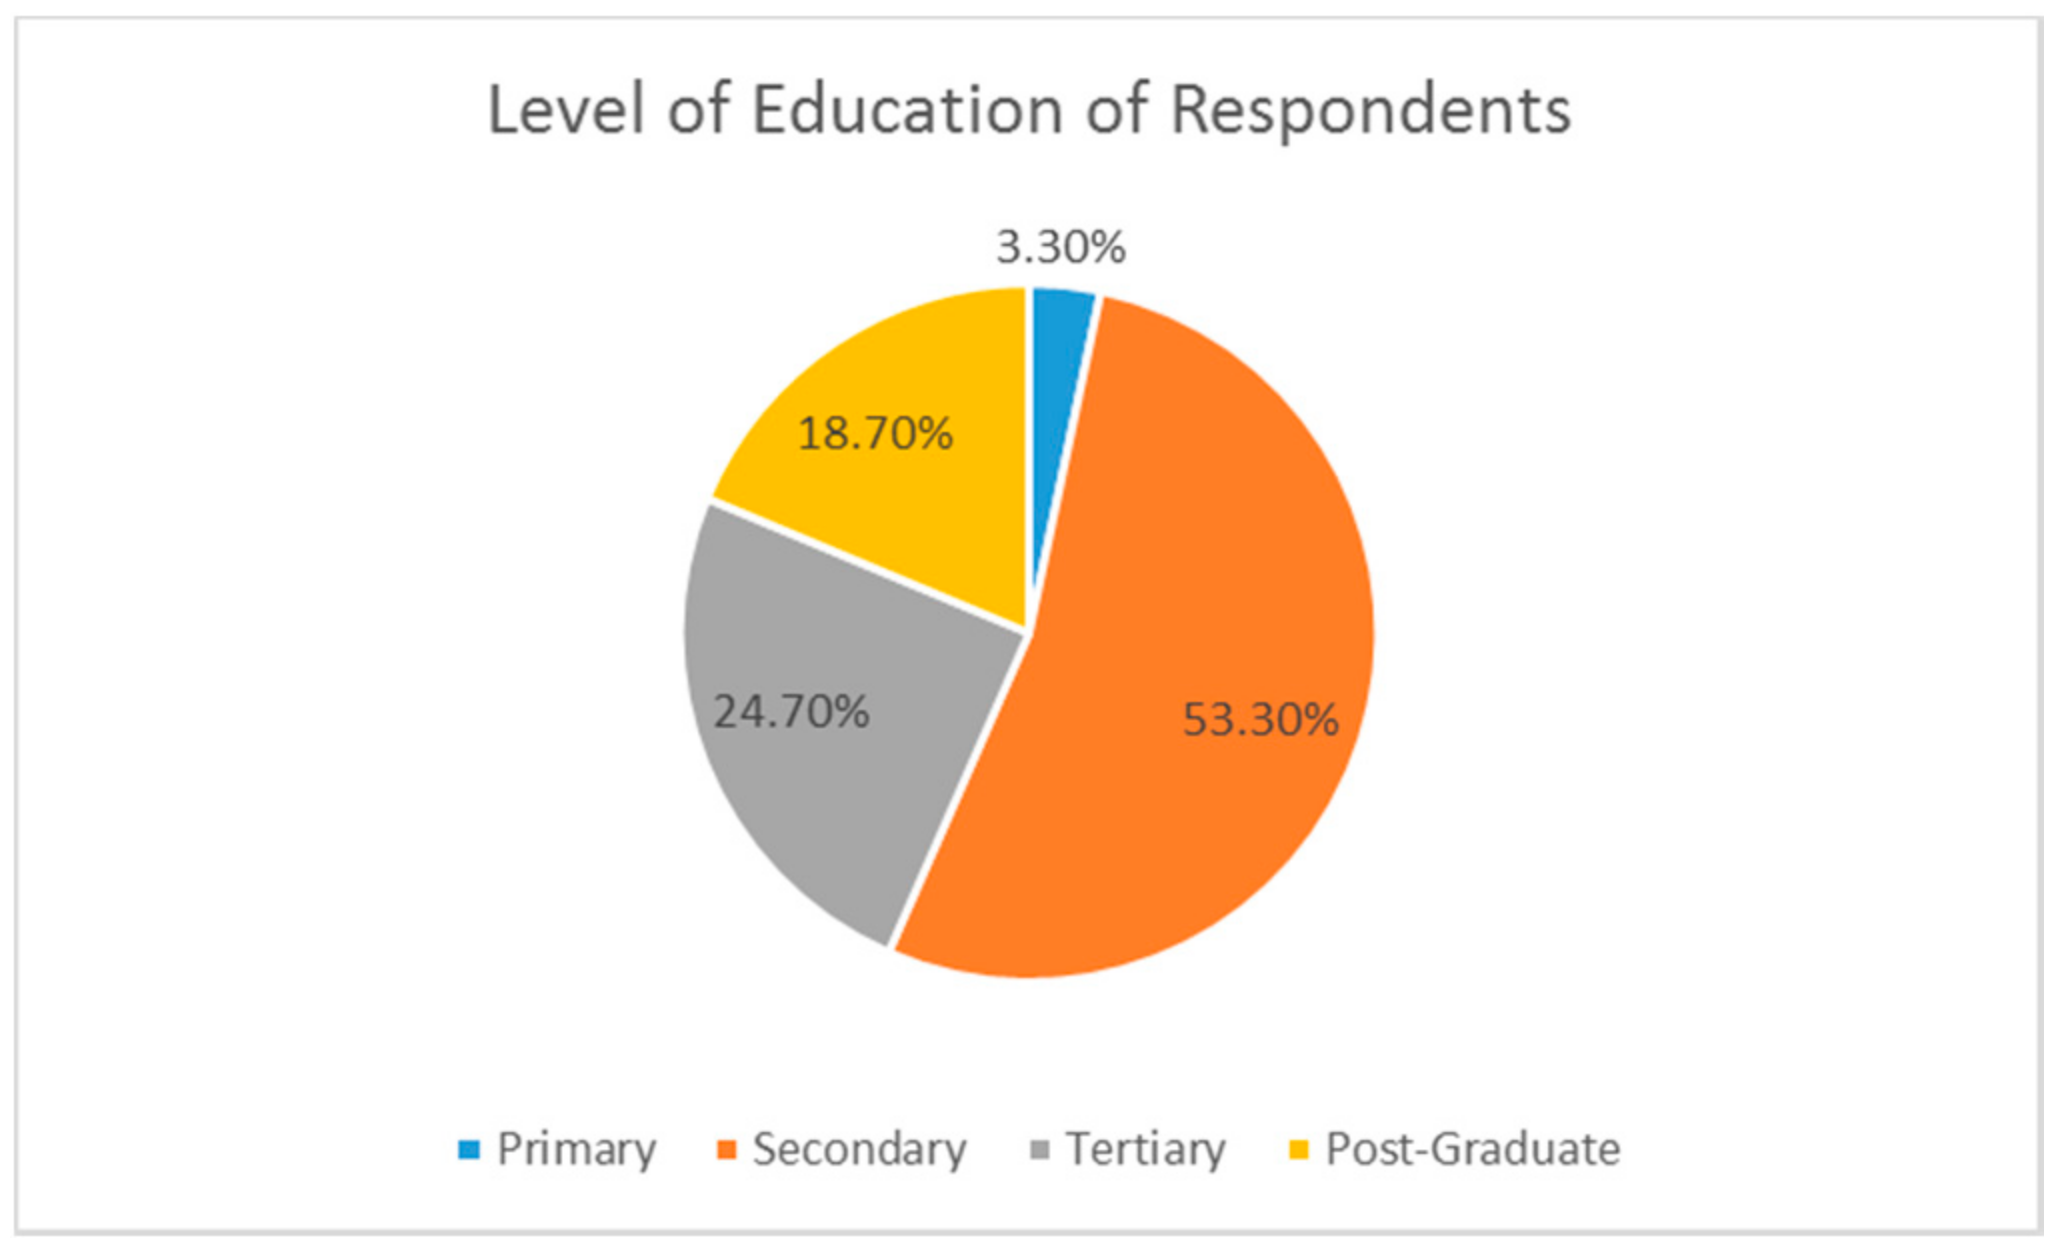
| Level of Education | Primary | 5 (3.3%) | 4 (80.0%) | 2 (40.0%) | 2 (40.0%) | 1 (20.0%) | 2 (40.0%) | 0 (0.0%) | 2 (40.0%) | 1 (20.0%) | 2 (40.0%) | 2 (20.0%) | 2 (20.0%) | 0 (0.0%) |
| Secondary | 80 (53.3%) | 65 (81.2%) | 55 (68.7%) | 57 (71.2%) | 30 (37.5%) | 24 (30.0%) | 7 (8.7%) | 57 (71.2%) | 54 (67.5%) | 13 (16.2%) | 32 (40.0%) | 19 (23.7%) | 1 (1.2%) | |
| Tertiary | 37 (24.7%) | 30 (81.1%) | 23 (62.2%) | 20 (54.0%) | 14 (37.8%) | 16 (43.2%) | 1 (2.7%) | 25 (67.6%) | 25 (67.6%) | 9 ;(24.3%) | 11 (29.7%) | 11 (29.7%) | 0 (0.0%) | |
| Post-Graduate | 28 (18.7%) | 26 (92.8%) | 17 (60.7%) | 21 (75.0%) | 11 (39.3%) | 15 (53.6%) | 1 (3.5%) | 21 (75.0%) | 19 (67.8%) | 6 (21.4%) | 7 (25.0%) | 7 (25.0%) | 0 (0.0%) | |
| p Value | 0.521 | 0.530 | 0.118 | 0.875 | 0.139 | 0.494 | 0.451 | 0.181 | 0.490 | 0.454 | 0.801 | 0.830 | ||
| Domestic Responsibility | Myself | 99 (66.0%) | 83 (83.8%) | 67 (67.7%) | 66 (66.7%) | 40 (40.4%) | 37 (37.4%) | 5 (5.0%) | 68 (68.7%) | 60 (60.6%) | 17 (17.2%) | 33 (33.3%) | 26 (26.3%) | 1 (1.0%) |
| My spouse | 11 (7.3%) | 9 (81.8%) | 5 (55.5%) | 6 (54.5%) | 3 (27.3%) | 3 (27.3%) | 3 (27.3%) | 7 (63.6%) | 8 (72.7%) | 3 (27.3%) | 2 (18.2%) | 5 (45.4%) | 0 (0.0%) | |
| My Children | 3 (2.0%) | 3 (100.0%) | 2 (66.7%) | 2 (66.7%) | 2 (66.7%) | 2 (66.7%) | 0 (0.0%) | 2 (66.7%) | 3 (100.0%) | 1 (33.3%) | 1 (33.3%) | 1 (33.3%) | 0 (0.0%) | |
| My domestic worker | 24 (16.0%) | 19 (79.2%) | 12 (50.0%) | 18 (75.0%) | 10 (41.7%) | 10 (41.7%) | 1 (4.2%) | 17 70.8%) | 20 (83.3%) | 6 (25.0%) | 8 (33.3%) | 3 (12.5%) | 0 (0.0%) | |
| Other | 13 (8.7%) | 11 (84.6%) | 11 (84.6%) | 8 (61.5%) | 1 (7.7%) | 5 (38.5%) | 0 (0.0%) | 11 (84.6%0 | 8 (61.5%) | 3 (23.0%) | 8 (61.5%) | 4 (30.8%) | 0 (0.0%) | |
| p Value | 0.917 | 0.153 | 0.803 | 0.133 | 0.784 | 0.038 | 0.802 | 0.173 | 0.801 | 0.234 | 0.322 | 0.972 | ||
| Residential status | No Response | 4 (2.7%) | 3 (75.0%) | 1 (25.0%) | 2 (50.0%) | 2 (50.0%) | 3 (75.0%) | 0 (0.0%) | 4 (100.0%) | 3 (75.0%) | 1 (25.0%) | 1 (25.0%) | 0 (0.0%) | 0 (0.0%) |
| Homeowner | 84 (56.0%) | 75 (89.3%) | 62 (73.8%) | 63 (75.0%) | 29 (34.5%) | 36 (42.8%) | 4 (4.8%) | 84 (100.0%) | 66 (78.6%) | 15 (17.8%) | 25 (29.8%) | 22 (26.2%) | 0 (0.0%) | |
| Tenant | 61 (40.7%) | 46 (75.4%) | 33 (54.1%) | 34 (55.7%) | 25 (41.0%) | 18 (29.5%) | 5 (8.1%) | 61 (100.0%) | 30 (49.2%) | 14 (23.0%) | 26 (42.6%) | 17 (27.9%) | 1 (1.6%) | |
| Other | 1 (0.7%) | 1 (100%) | 1 (100%) | 1 (100%) | 0 (0.0%) | 0 (0.0%) | 0 (0.0%) | 1 (100%) | 0 (0.0%) | 0 (0.0%) | 0 (0.0%) | 0 (0.0%) | 0 (0.0%) | |
| p Value | 0.151 | 0.025 | 0.075 | 0.682 | 0.130 | 0.784 | 0.009 | 0.001 | 0.829 | 0.349 | 0.600 | 0.689 |
| Statement | % | +Mean | SD | α * | % | Mean ** | SD *** |
|---|---|---|---|---|---|---|---|
| Re-use: Exclusivity of practice | 0.877 | 85 | 21.21 | 3.74 | |||
| Only children under 18 years of age should participate in reusing domestic waste | 82 | 4.12 | 1.00 | ||||
| Only females should participate in reusing domestic waste | 87 | 4.35 | 0.83 | ||||
| Only males should participate in reusing domestic waste | 88 | 4.39 | 0.79 | ||||
| Only environmentally aware people should re-use waste | 82 | 4.10 | 1.03 | ||||
| Only municipal employees should participate in reusing domestic waste | 85 | 4.24 | 0.89 | ||||
| Re-use: Positive influences | 0.838 | 60 | 14.89 | 4.99 | |||
| Reusing domestic waste makes me feel useful | 42 | 2.12 | 0.98 | ||||
| Reusing domestic waste will help future generations | 31 | 1.57 | 0.84 | ||||
| Reusing domestic waste reduces the amount of waste I throw away | 35 | 1.75 | 0.90 | ||||
| Reusing domestic waste is a convenient activity for me | 50 | 2.49 | 1.09 | ||||
| Reusing domestic waste keeps our brains active by thinking about creativity | 44 | 2.21 | 1.08 | ||||
| Reusing domestic waste reduces waste to the landfill site | 33 | 1.65 | 0.78 | ||||
| Reusing domestic waste keeps our environment clean and healthy | 31 | 1.54 | 0.79 | ||||
| I feel reusing domestic waste is a positive activity | 31 | 1.55 | 0.78 | ||||
| Re-use: Negative influences | 0.749 | 56 | 14.18 | 3.45 | |||
| Reusing domestic waste can sometimes be expensive | 75 | 3.77 | 1.04 | ||||
| Reusing domestic waste is time consuming | 67 | 3.37 | 1.24 | ||||
| Reusing domestic waste is unhygienic | 3.39 | 1.18 | |||||
| Reusing domestic waste is harmful to me | 3.65 | 1.09 |
| Exclusivity of Practice | Positive Influences | Negative Influences | ||||
|---|---|---|---|---|---|---|
| Wilks’ Lambda | Sig. | Wilks’ Lambda | Sig. | Wilks’ Lambda | Sig. | |
| Gender | 0.961 | 0.328 | 0.971 | 0.834 | 0.932 | 0.036 |
| Age group | 0.903 | 0.470 | 0.850 | 0.053 | 0.837 | 0.012 |
| Level of education | 0.899 | 0.321 | 0.803 | 0.145 | 0.903 | 0.252 |
| Domestic responsibility | 0.930 | 0.960 | 0.747 | 0.121 | 0.903 | 0.540 |
| Residential status | 0.786 | 0.003 | 0.789 | 0.088 | 0.761 | 0.000 |
Publisher’s Note: MDPI stays neutral with regard to jurisdictional claims in published maps and institutional affiliations. |
© 2022 by the authors. Licensee MDPI, Basel, Switzerland. This article is an open access article distributed under the terms and conditions of the Creative Commons Attribution (CC BY) license (https://creativecommons.org/licenses/by/4.0/).
Share and Cite
Lange, S.L.; Senekane, M.F.; Naicker, N. Understanding the Socio-Demographic Profile of Waste Re-Users in a Suburban Setting in South Africa. Resources 2022, 11, 45. https://doi.org/10.3390/resources11050045
Lange SL, Senekane MF, Naicker N. Understanding the Socio-Demographic Profile of Waste Re-Users in a Suburban Setting in South Africa. Resources. 2022; 11(5):45. https://doi.org/10.3390/resources11050045
Chicago/Turabian StyleLange, Samantha Louise, Mpinane Flory Senekane, and Nisha Naicker. 2022. "Understanding the Socio-Demographic Profile of Waste Re-Users in a Suburban Setting in South Africa" Resources 11, no. 5: 45. https://doi.org/10.3390/resources11050045
APA StyleLange, S. L., Senekane, M. F., & Naicker, N. (2022). Understanding the Socio-Demographic Profile of Waste Re-Users in a Suburban Setting in South Africa. Resources, 11(5), 45. https://doi.org/10.3390/resources11050045