Abstract
Despite the improvements made in recent decades on the emission control of waste combustion plants, the chronically low public acceptance still influences the strategical choices of local authorities, who may decide to export waste to other regions instead of treating waste locally in a waste-to-energy (WtE) plant. The present paper proposes a method to identify a more sustainable solution between local waste treatment and the export of waste. To do this, two waste-management scenarios were compared: (1) an in situ WtE scenario, considering a WtE plant in a region of about 500,000 inhabitants; and (2) an ex situ WtE scenario, considering the road transportation of waste to a WtE plant located in another region. This method yields an estimation of the maximum distance that trucks may cover to balance the emissions of the air pollutants released in the in situ WtE scenario. The methodology is based on the COPERT emission model and on emission factors of WtE processes. The results show that the maximum distance is limited by the emissions of polycyclic aromatic hydrocarbons by road trucks. Finally, the paper discusses the results considering the energy efficiency of WtE processes and proposes alternative WtE strategies to increase the level of public acceptance.
1. Introduction
Besides pursuing the principles of the Waste Framework Directive, the European Union (EU) member states must implement actions to meet the requirements imposed by the Landfill Directive [1]. This directive establishes that the amount of municipal solid waste (MSW) landfilled must be limited to 10% by 2035. Thus, member states have the following (non-mutually exclusive) options [2,3]:
- To fully embrace the waste hierarchy principles and reduce MSW production by re-organizing the supply chains and enhance resource efficiency;
- To improve the selective collection of MSW by investing in communication campaigns, adopting more persuasive tariff schemes, re-organizing waste collection and investing in research and recycling facilities;
- To reduce the volume of residual MSW (rMSW) produced and, preferably, recover energy from it.
The transition towards ambitious “zero waste” targets cannot do without the advantages given by waste-to-energy (WtE) processes in terms of waste reduction and energy recovery. In a broad context, WtE may refer to every process generating energy from waste, including anaerobic digestion (AD) and the direct or indirect combustion of waste, respectively, as well as the incineration and gasification of waste-derived syngas. The present paper focuses only on MSW and combustion processes. The latter aims to reduce the amount of rMSW landfilled and, meanwhile, recover energy from it. The advantages of the AD of food waste have been broadly discussed in the literature [4,5,6]. AD was proved to not contribute to the significant emissions of air pollutants, especially if the target produces bio-methane instead of burning biogas locally in a combined heat and power generator. On the other hand, waste combustion inevitably generates high emission rates of toxic air pollutants. Depending on the mass fraction of waste with a fossil origin, waste combustion offers a higher contribution to climate change [7]. However, the energy recovery from WtE processes avoids resorting to conventional sources of energy that may contribute more to global warming [8].
Despite the fact that the WtE sector is crucial in waste management and in integrated waste-management plans [9,10], public acceptance of WtE facilities is still negatively influenced by “not in my backyard” (NIMBY) syndrome [11,12]. The reasons for the chronically low public acceptance of WtE plants are mainly related to past levels of emissions of toxic compounds released by waste combustion, especially dioxin (PCDD/Fs) and dioxin-like polychlorinated biphenyls (dl-PCBs). In recent decades, the WtE sector has considerably improved from the point of view of air pollution control [13]. In the EU, the PCDD/F and dl-PCB concentration limit values at the stack of a WtE plant are now limited to 0.1 ngI-TEQ/ Nm3 for both groups of pollutants [14]. Large combustion plants (like MSW incinerators or gasifiers burning syngas from waste conversion) are regarded as point emissions sources: indeed, exhaust gas is released by one or more stacks, whose height and diameter are designed to minimize the impact on the surrounding areas. Compared to other emission activities located at ground levels (e.g., road traffic), the exhaust gas exiting the stack(s) is directed upwards due to the relatively high velocity of the gas. This condition helps the dispersion of the air pollutants within the atmosphere, compared to diffuse sources at the ground [15]. Conversely, road traffic is characterized by a multitude of emissions sources that are located at ground level and are usually in the proximity of people, who are directly exposed to the inhalation of traffic-related air pollutants [16,17].
Both sectors also contribute to net greenhouse gas (GHG) emissions. In spite of the increasing share of electric vehicles, road transportation still mainly relies on fossil fuels. In the EU, for instance, battery electric vehicles (BEVs) only accounted for 0.4% of the total passenger cars on roads in 2019 [18]. In addition, the use of BEVs does not guarantee that the electric energy used to charge them is generated by renewable sources. Residual MSW (rMSW), on the other hand, is a mixture of materials with fossil, biogenic and inert origins [19]. Biogenic waste mainly includes ligno-cellulosic materials and, in the case of untreated rMSW, food waste [20]. Contrarily to the fuel mix adopted by the road transportation sector worldwide, the share of materials with a non-biogenic origin is generally lower. According to Pfadt-Trilling [21], in the USA, the mass fraction of non-biogenic material in the input waste to MSW incinerators ranges between 35% and 45%. Higher values may occur, reflecting situations where a highly efficient and selective collection of MSW has been implemented. In this case, the higher content of fossil carbon is balanced by the lower amount of rMSW sent to WtE plants, thanks to the higher interception rate of recyclable fractions through selective collection. The EU is aware of the crucial role of the WtE sector in recovering energy and replacing energy production processes based on fossil fuels. For this reason, the EU has excluded MSW incineration from the European Emission Trading System [22].
According to the EU Waste Framework Directive [23], member states are obliged to prepare waste-management plans to define the current situation, future targets, strategies and measures to meet the targets. This directive also allows local/regional authorities to prepare waste-management plans instead of a whole country. The choices made during the preparation of a waste-management plan may influence the local air quality of an area if, for example, the local authority is planning the construction of an MSW incinerator or to transfer waste to other destinations. In the EU, according to Directive 2008/50/EC [24], member states must also prepare air-quality plans in the areas/regions where the ambient-air-concentration limit values of the regulated pollutants are exceeded. In addition, decisions on waste management may positively or negatively affect the achievement of the EU clean air targets set for 2030 [25]. When planning air-quality strategies, atmospheric emission inventories are fundamental tools that provide key information to carry out atmospheric-dispersion modeling [26]. The latter, upon its turn, is crucial to assess both the present situation and the expected one in terms of air quality [27,28].
The present paper aims to highlight the extent to which the export of MSW may be sustainable for a province/region in terms of the emissions of local and global air pollutants, compared to in situ MSW incineration. This approach is based on a comparison of the emissions from road transportation and MSW incineration. It is expected to help decision makers when elaborating waste-management plans and facing the possible opposition of a part of the population to new WtE facilities. This approach shows the close relationship with local atmospheric emission inventories and air-quality plans.
The present paper compares two scenarios for WtE treatment in a small region with a hypothetical resident population of about 500,000 inhabitants. The first scenario considers that the rMSW produced in the region is sent to a local MSW incinerator to generate electric energy (in situ WtE). The second scenario considers that the rMSW produced in the area is transferred to an MSW incinerator located in an adjacent region (ex situ WtE). Trucks are assumed to be the means of transportation of the waste to the outer destination. Quantitative estimations are formulated to evaluate the sustainability of exporting waste compared to in situ WtE, in terms of the emissions of air pollutants and GHGs. The paper also formulates qualitative considerations on possible additional comparisons, considering other variables, such as the electric-energy-conversion efficiency of WtE plants and alternatives to the conventional and centralized direct/indirect combustion of waste.
2. Materials and Methods
2.1. Reference WtE Plant
The first step in comparing in situ and ex situ WtE processes is to consider a reference WtE plant. To do this, a survey on WtE plants was carried out considering Italian waste facilities in operation when the present paper was written. The survey focused on mid-sized WtE plants (50,000–150,000 t/y of input waste), representing a small Italian region/province. The survey selected WtE plants based on the same combustion technology (moving grate incineration) to avoid misleading conclusions in terms of conversion efficiency and exhaust airflow rate. For each WtE plant, the data considered in the survey refer to the maximum input waste capacity, the type of input waste authorized for processing, the exhaust airflow rate authorized, the nominal combustion power, the maximum electric power generated and the net-to-gross ratio of the electric energy generated (to account for the WtE plant’s self-consumption). The WtE plants included in the survey were selected on the basis of the public availability of the environmental authorizations released by the environmental protection agencies in charge. The WtE plants considered are presented in Table 1.

Table 1.
Results of the survey on the mid-sized Italian moving grate incinerators in operation at the time the present paper was written.
Based on the data reported, an input waste capacity of 100,000 t/y was selected for the reference WtE plant. The exhaust airflow rate was estimated by multiplying the reference input waste capacity by the average of the ratios between the exhaust airflow rate and the input waste capacity of each plant. The resulting exhaust airflow rate was 88,435 Nm3/h.
2.2. Emission Calculation
2.2.1. WtE Plant
The emission factors (EFs) of the air pollutants related to municipal waste incineration in Europe (EFWtE,i, expressed as g/t) were retrieved from the latest version of the Emission Inventory Guidebook (2019), prepared by the European Monitoring and Evaluation Program/European Environment Agency (EMEP/EEA), which is the European reference document for emission calculations from several civil and industrial sectors [37]. The emission inventory includes the EFs of the following pollutants: nitrogen oxides (NOx), carbon monoxide (CO), volatile organic compounds (VOCs), sulfur dioxide (SO2), ammonia (NH3), total suspended particles (here regarded as particulate matter, PM, for direct comparison with traffic-related emissions), lead (Pb), cadmium (Cd), mercury (Hg), arsenic (As), chromium (Cr), copper (Cu), nickel (Ni), selenium (Se), zinc (Zn), PCBs, PCDD/Fs, polycyclic aromatic hydrocarbons (PAHs), such as benzo(a)pyrene, benzo(b)fluoranthene, benzo(k)fluoranthene, indeno(1,2,3-c,d)pyrene, and hexachlorobenzene (HCB).
The emission inventory does not include any EFs of greenhouse gases (GHGs), whose net emissions depend on the composition of the input waste and on the combustion efficiency. Thus, the EFs of carbon dioxide (CO2) related to the oxidation of fossil carbon was calculated separately, based on the work of Viganò et al. [38]. After taking 20 waste samples on the two lines of an Italian waste incinerator, the authors measured an average waste mass fraction of fossil origin of 0.152 and a carbon content in the waste of fossil origin of 783 g/kg. The resulting mass content of fossil carbon in the total waste mass was 119 g/kg. Assuming the conversion to CO and organic pollutants is neglectable compared to the CO2 formation, the complete oxidation of one mole of carbon generates one mole of CO2. Considering the molecular mass of CO2 (44 g/mol) and the atomic mass of carbon (12 g/mol), the CO2 EFs from the WtE plant can be easily estimated as follows:
where Xf,C is the mass content of fossil carbon in the total waste mass (g/kg). The complete set of EFWtE,i values proposed for municipal waste incineration is presented in Table 2.
Table 2.
EFs of municipal waste incineration in Europe, expressed as grams of pollutant per ton of input waste [37,38].
For each i-th pollutant, the emission from the reference WtE plant (Ei, expressed as t/y) can be calculated as follows:
where Q is the input waste mass flow rate (t/y).
2.2.2. Road Transportation
The estimation of the emissions from road transportation is a necessary step to calculate the maximum distance that makes the ex situ WtE scenario as sustainable in terms of the emissions of GHGs and local air pollutants of the region where the waste is generated. The maximum distance dmax,i (km), intended as the maximum distance for which the emission of the i-th pollutant is sustainable, can be estimated as follows:
where Ei is the emission rate of the i-th pollutant released by the WtE plant (t/y) as calculated in Section 2.2.1, N is the number of trips needed to transfer the waste to the WtE plant of destination (1/y), EFi,fl is the EF of the i-th pollutant related to a truck fully loaded with waste (g/km) and EFi,e is the EF of the i-th pollutant related to an empty truck (g/km). The use of two different EFs of road transportation (EFi,fl and EFi,e) is necessary to account for the additional contribution given by the waste load of the emissions of each truck.
EFs of transportation by trucks were retrieved by COPERT (version 5.5.1) software [39]. COPERT is the reference algorithm used for the calculation of vehicle emissions in the EU. Its development is supported by the EEA. COPERT yields estimations of the exhaust (hot, cold and evaporative) and non-exhaust emissions of several pollutants under different driving conditions (urban peak, urban off-peak, rural and highway routes, as well as user-defined slopes and vehicle loads). COPERT differentiates between different categories of vehicles (passenger cars, light commercial vehicles, trucks, buses, mopeds, motorcycles, quads and mini-cars), subdivided into a total of 432 vehicle classes [39]. The pollutants regarded by COPERT are the same as those included in the EMEP/EEA Emission Inventory Guidebook [37], except for HCB, for which an EF is not provided. Thus, HCB was excluded from the comparison.
COPERT computes the emissions of the selected pollutants from a user-defined dataset of vehicles, fuels, speeds and driving modes, basing its calculation on a wide database of EFs and correction factors.
For simplicity, the following assumptions were made when estimating the emissions from waste transportation by trucks:
- the route from the collection area to the WtE plant is the same in both directions;
- the slope of the route from the collection area to the WtE plant and vice versa is assumed to be null;
- the same type of trucks was used during every trip, specifically, 26 t diesel-fueled trucks (maximum gross weight) with a 16 t capacity, belonging to the latest European emission standard, i.e., EURO VI [40].
In this study, the EFs considered hot exhaust, cold-start and (for PM) non-exhaust emissions. Evaporative emissions were only relevant for gasoline-fueled vehicles [39]; thus, they were neglected in the present paper. The CO2 EFs were calculated according to the COPERT methodology, which considers the contribution of fuel combustion, lube oil and urea consumption by NOx abatement technologies in EURO VI trucks [37]. The CO2, CH4 and N2O EFs were combined in a CO2-equivalent (CO2eq) EF, considering the latest global warming potentials for CH4 and N2O on a 100-year horizon: 21 and 310, respectively [41].
The EFs considered in the present article are reported in Table 3. The PM EFs include the contribution of non-exhaust particles generated by tire, brake and road-surface wear [39]. Variations to these basic conditions can be easily made by selecting the most proper correction factors in COPERT for any specific situation to be modeled.
Table 3.
Values of the COPERT EFs of the selected pollutants and referred to 26 t trucks in full-load (EFi,fl) and empty (EFi,e) conditions [39].
Because the SO2 EF is null, thanks to the desulfurization of diesel fuel, this pollutant was excluded from the comparison. Based on the reference amount of waste to be treated (100,000 t/y) and a truck load capacity equal to 16 t, the total number of round trips needed in a year (N) was 6250.
As presented in Table 2 and Table 3, the fingerprints of waste incineration and road transportation are particularly different, because each sector contributes differently to the emissions of the specific pollutants considered. What both sectors have in common is a large contribution to CO2eq emissions, which account for 96.7% and 99.9% of the emissions from MSW incineration and road transportation, respectively. Figure 1 provides a visual representation of the frequency distributions of the EFs of local air pollutants in the case of MSW incineration and transportation by the trucks considered in this work. The EFs considered for road transportation are the mean values between EFi,fl and EFi,e, because the route is assumed to be the same in both directions.
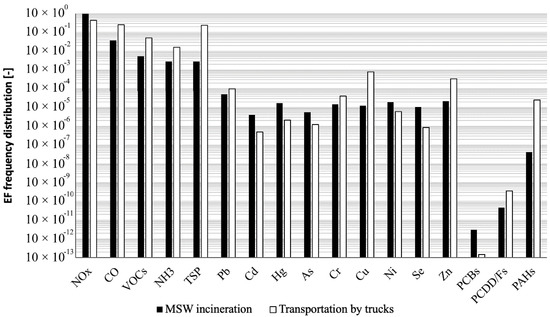
Figure 1.
Comparison between the frequency distribution of the EFs related to waste incineration and the transportation by trucks (results expressed in logarithmic scale).
For both sectors, the highest EFs were related to NOx, followed by CO. The lowest EFs were related to PCBs and PCDD/Fs. The remaining pollutants had different weights between the two sectors. In particular, PAHs contribute to 0.0025% of the total emissions from road transportation and to only 0.000004% of the total emissions from MSW incineration.
2.3. Energy Conversion Efficiency
If the energy conversion efficiency of the ex situ WtE plant is relatively high, it may be possible that the joint contribution of the ex situ WtE plant and waste transportation to the emission of air pollutants is equal or lower than the contribution of a local (though less efficient) WtE plant. To account for this possibility, the comparison between the in situ and ex situ WtE scenarios considered WtE plants with the same conversion efficiency initially. A second comparison determined dmax,i in the hypothesis that: (1) the ex situ WtE plant is characterized by the highest net-to-gross electric energy ratio reported in Table 1 (0.85); and (2) the in situ WtE plant is characterized by the lowest net-to-gross electric energy ratio reported in Table 1 (0.68).
3. Results and Discussion
Equations (2) and (3) yield the calculation of the distance (dmax,i) between the collection area and the WtE plant located outside the region where the waste is generated, at which the pollutant-specific emissions from waste transportation equalize the respective emissions from a local WtE plant. The results of the calculations are presented in Table 4. The same WtE plant was assumed for the in situ and ex situ scenarios.
Table 4.
Results of the calculations of the distance (dmax,i) at which the transportation-related emission of the i-th pollutant equalizes the emission of the same pollutant from a local WtE plant (Ei).
As expected, the dmax values were dependent on the pollutant, because road transportation and waste incineration contribute differently to the emissions of the specific pollutants considered in this work (Figure 1). Up to a distance of 400 km, waste transportation contributed more than waste incineration for only two pollutants: PM and PAHs. In terms of the local emissions of air pollutants, the transportation of waste to an outer destination would be absolutely preferable if the distance between the collection area and the destination was lower than the lowest dmax value reported in Table 4 (55 km). Despite the relatively low waste mass fraction with fossil origins (15.2%) found by Viganò et al. [38], non-biogenic CO2 emissions from MSW incineration were significantly higher compared to road transportation, allowing trucks to cover a round trip of almost 1500 km without exceeding the CO2eq emitted by a hypothetical in- situ WtE plant. This means that, from the point of view of global pollutants, the in situ WtE scenario may not be seen as clearly preferable.
The previous considerations of dmax obviously identifies the preferable solution to minimize the atmospheric emissions of local and global pollutants, only with regards to the province/region where waste is produced. If the ex situ WtE process was carried out in an MSW incinerator with the same characteristics of the in situ WtE scenario, the joint contribution of the two adjacent regions would be higher than the in situ scenario, due to the additional contribution of waste transportation. However, two WtE plants may have different conversion efficiencies. Considering the assumption made in Section 2.3, to generate the same amount of electric energy, the in situ WtE plant should burn 25% more MSW than the ex situ WtE plant. This would result in 25% higher atmospheric emissions from the in situ WtE plant. Consequently, the dmax values reported in Table 4 should be increased by 25%. In a future context, the carbon footprint and the emissions of local pollutants in the ex situ WtE scenario could be reduced by using part of the electric energy generated by the plant to feed battery electric vehicles, replacing the current vehicle fleets and remaining mainly based on combustion engines. This environmental assessment could be improved by considering the potential heat recovery and the consequent production and distribution of heat to the population living in the vicinity of WtE plants. Public acceptance might also be influenced by the energy potential of the waste produced in the reference region, which could be estimated with a recent methodology [42]. Communicating this information to the population may generate positive or negative responses in case the calorific power of the waste is relatively high or low, respectively. In the first case, people might show more interest in an additional source of energy, especially during worldwide energy crises. This could incentivize people to further improve the selective collection of waste, which increases the calorific power of rMSW, decreases the production of rMSW, and thus increases the energy efficiency of rMSW combustion.
It is worth highlighting that this comparison does not consider the additional environmental impacts induced by the ex- situ WtE plant that takes charge of the waste transported from the reference region. Indeed, the ex situ WtE plant may already treat the waste generated locally. However, the environmental impact of a WtE plant must be assessed at its maximum capacity during the evaluation of the project. Thus, the ex situ WtE plant would not generate unexpected impacts when accepting the additional amount of waste transported from the reference region.
It is also necessary to point out that such a comparison does not consider the potential adverse effects on human health deriving from exposure to toxic air pollutants. As mentioned above, MSW incineration and road transportation are characterized by different mechanisms of the emission and dispersion of air pollutants in the atmosphere. A detailed air-pollutant-dispersion study should be carried out to estimate the potential risks to health. Dispersion calculations should appropriately consider a complete meteorological characterization of the area for at least one year. Point (i.e, the stacks of the WtE plant), linear or volumetric sources (i.e., road traffic) should be accurately defined. Finally, land use data, presence of population and, if necessary, orography should be included in the modeling activity.
Local authorities and decision makers may consider alternative WtE approaches to reduce the expected environmental impacts, as proposed by Ragazzi et al. [43]. A first approach may consider the construction of smaller WtE plants in the area, instead of one full-scale WtE plant. Each small-scale plant would release lower fluxes of pollutants compared to a single full-scale plant. This would induce proportionally lower impacts on health, provided that the main characteristics of the emissions (e.g., release height, exhaust–gas velocity and temperature) are kept as close as possible to the full-scale plant. However, this approach would require higher investment costs and land consumption with respect to a single full-scale plant. A second alternative is preferable: it consists of the gasification of waste with a transformation of the syngas into fuels and chemicals. This approach would avoid local syngas combustion, would create substitutes for fossil fuels, recover chemicals for industrial and commercial use and increase the public acceptance of WtE technologies.
4. Conclusions
The comparison made in the present paper between the in situ and ex situ WtE scenarios revealed that the role of the road transportation of waste must be considered during the elaboration of waste-management plans. The results showed that waste transportation and waste combustion in an outer WtE plant would be absolutely preferable, only if the latter is located within a maximum distance that could be calculated with the methodology developed in the present paper. PAH emissions are the limiting factors that define the maximum distance covered by waste transportation to consider an ex situ WtE plant to be a more sustainable approach than an in situ WtE. However, such a distance could be increased if the energy efficiency of the outer WtE plant is expected to be higher than the energy efficiency of the potential in situ WtE plant. Regarding this last point, the methodology presented here may also help identify cases where NIMBY syndrome is technically justified, providing scientific evidence to support the worries of the local population. However, ex situ scenarios might be complicated because of the need for local administrations to draw up convenient contracts with waste -management or transportation companies.
The methodology developed in this study could be adapted to every context to support decision makers when planning future waste-management strategies. This methodology could be applied to different WtE processes, which can be compared to assess the environmental convenience of different in situ and ex situ scenarios. This may be an interesting future development of this research. Another possible future development consists of a deeper assessment of WtE scenarios, not only based on emissions, but also on the population’s exposure to air pollutants. This deeper evaluation may identify the most virtuous transportation routes from the point of view of the population exposure and account for the cumulative risk induced by both transportation and the operation of the WtE plant.
Finally, two alternatives to the conventional idea of waste incineration with energy recovery were discussed as possible options to increase the public acceptance of the WtE sector.
Author Contributions
Conceptualization, L.A. and M.S.; Methodology, M.S.; Validation, L.A. and M.S.; Investigation, M.S.; Data Curation, M.S.; Writing—Original Draft Preparation, M.S.; Writing—Review & Editing, L.A. All authors have read and agreed to the published version of the manuscript.
Funding
This research received no external funding.
Data Availability Statement
All the data presented in this study are available in the article itself.
Conflicts of Interest
The authors declare no conflict of interest.
References
- Directive (EU) 2018/850 of the European Parliament and of the Council of 30 May 2018 Amending Directive 1999/31/EC on the Landfill of Waste. Available online: https://eur-lex.europa.eu/legal-content/EN/TXT/HTML/?uri=CELEX:32018L0850&from=EN (accessed on 30 August 2022).
- Lorena, A.; Carvalho, S. 2035 MSW Targets: A scenario analysis for the Portuguese MSW management system. In Wastes: Solutions, Treatments and Opportunities III, 1st ed.; Vilarinho, C., Castro, F., Gonçalves, M., Fernando, A.L., Eds.; CRC Press: London, UK, 2019; pp. 381–387. [Google Scholar]
- Den Boer, E.; Banaszkiewicz, K.; Den Boer, J.; Pasiecznik, I. Energy recovery from waste—Closing the municipal loop. Energies 2022, 15, 1246. [Google Scholar] [CrossRef]
- Pham, T.P.T.; Kaushik, R.; Parshetti, G.K.; Mahmood, R.; Balasubramanian, R. Food waste-to-energy conversion technologies: Current status and future directions. Waste Manag. 2015, 38, 399–408. [Google Scholar] [CrossRef]
- Nayak, A.; Bhushan, B. An overview of the recent trends on the waste valorization techniques for food wastes. J. Environ. Manag. 2019, 233, 352–370. [Google Scholar] [CrossRef]
- Deena, S.R.; Vickram, A.S.; Manikandan, S.; Subbaiya, R.; Karmegam, N.; Ravindran, B.; Chang, S.W.; Awasthi, M.K. Enhanced biogas production from food waste and activated sludge using advanced techniques—A review. Bioresour. Technol. 2022, 355, 127234. [Google Scholar] [CrossRef]
- Tan, S.T.; Ho, W.S.; Hashim, H.; Lee, C.T.; Taib, M.R.; Ho, C.S. Energy, economic and environmental (3E) analysis of waste-to-energy (WTE) strategies for municipal solid waste (MSW) management in Malaysia. Energy Convers. Manag. 2015, 102, 111–120. [Google Scholar] [CrossRef]
- Bogner, J.; Pipatti, R.; Hashimoto, S.; Diaz, C.; Mareckova, K.; Diaz, L.; Kjeldsen, P.; Monni, S.; Faaij, A.; Gao, Q.; et al. Mitigation of global greenhouse gas emissions from waste: Conclusions and strategies from the Intergovernmental Panel on Climate Change (IPCC) Fourth Assessment Report. Working Group III (Mitigation). Waste Manag. Res. 2008, 26, 11–32. [Google Scholar] [CrossRef]
- Ionescu, G.; Rada, E.C.; Ragazzi, M.; Mărculescu, C.; Badea, A.; Apostol, T. Integrated municipal solid waste scenario model using advanced pretreatment and waste to energy processes. Energy Cons. Recycl. 2013, 76, 1083–1092. [Google Scholar] [CrossRef]
- Moya, D.; Aldás, C.; López, G.; Kaparaju, P. Municipal solid waste as a valuable renewable energy resource: A worldwide opportunity of energy recovery by using Waste-To-Energy Technologies. Energy Proced. 2017, 134, 286–295. [Google Scholar] [CrossRef]
- Achillas, C.; Vlachokostas, C.; Moussiopoulos, N.; Banias, G.; Kafetzopoulos, G.; Karagiannidis, A. Social acceptance for the development of a waste-to-energy plant in an urban area. Resour. Cons. Recycl. 2011, 55, 857–863. [Google Scholar] [CrossRef]
- Zheng, J.; Yu, L.; Ma, G.; Mi, H.; Jiao, Y. Residents’ acceptance towards waste-to-energy facilities: Formation, diffusion and policy implications. J. Clean. Prod. 2021, 287, 125560. [Google Scholar] [CrossRef]
- Rada, E.C.; Schiavon, M.; Torretta, V. A regulatory strategy for the emission control of hexavalent chromium from waste-to-energy plants. J. Clean. Prod. 2021, 278, 123415. [Google Scholar] [CrossRef]
- Directive 2010/75/EU of the European Parliament and of the Council of 24 November 2010 on Industrial Emissions (Integrated Pollution Prevention and Control). Available online: https://eur-lex.europa.eu/legal-content/EN/TXT/HTML/?uri=CELEX:32010L0075&from=EN (accessed on 29 August 2022).
- Adami, L.; Schiavon, M.; Rada, E.C. Potential environmental benefits of direct electric heating powered by waste-to-energy processes as a replacement of solid-fuel combustion in semi-rural and remote areas. Sci. Total Environ. 2020, 740, 140078. [Google Scholar] [CrossRef] [PubMed]
- Luo, J.; Boriboonsomsin, K.; Barth, M. Reducing pedestrians’ inhalation of traffic-related air pollution through route choices: Case study in California suburb. J. Transp. Health 2018, 10, 111–123. [Google Scholar] [CrossRef]
- Yao, Y.; Jin, X.; Cao, K.; Zhao, M.; Zhu, T.; Zhang, J.; Zeng, Y. Residential proximity to major roadways and cognitive function among Chinese adults 65 years and older. Sci. Total Environ. 2021, 766, 142607. [Google Scholar] [CrossRef] [PubMed]
- Passenger Car Fleet by Fuel Type, European Union—ACEA—European Automobile Manufacturers’ Association. Available online: https://www.acea.auto/figure/passenger-car-fleet-by-fuel-type/ (accessed on 29 August 2022).
- Giani, H.; Borchers, B.; Kaufeld, S.; Feil, A.; Pretz, T. Fine grain separation for the production of biomass fuel from mixed municipal solid waste. Waste Manag. 2016, 47, 174–183. [Google Scholar] [CrossRef]
- Lombardi, F.; Zingaretti, D.; Verginelli, I.; Costa, G. Optimization of the Biostabilization Process of an Italian Mechanical–Biological Treatment Plant to Account for Changes in Waste Composition. Waste Biomass Valoriz. 2022, 13, 3787–3800. [Google Scholar] [CrossRef]
- Pfadt-Trilling, A.R.; Volk, T.A.; Fortier, M.-O.P. Climate Change Impacts of Electricity Generated at a Waste-to-Energy Facility. Environ. Sci. Technol. 2021, 55, 1436–1445. [Google Scholar] [CrossRef]
- Parliamentary Question—P-000678/20—European Parliament. Available online: https://www.europarl.europa.eu/doceo/document/P-9-2020-000678-ASW_EN.html (accessed on 29 August 2022).
- Directive 2008/98/EC of the European Parliament and of the Council of 19 November 2008 on Waste and Repealing Certain Directives. Available online: https://eur-lex.europa.eu/legal-content/EN/TXT/HTML/?uri=CELEX:02008L0098-20180705&from=EN (accessed on 30 August 2022).
- Directive 2008/50/EC of the European Parliament and of the Council of 21 May 2008 on Ambient Air Quality and Cleaner Air for Europe. Available online: https://eur-lex.europa.eu/legal-content/EN/TXT/HTML/?uri=CELEX:32008L0050&from=en (accessed on 30 August 2022).
- Air. Available online: https://environment.ec.europa.eu/topics/air_en (accessed on 30 August 2022).
- Miranda, A.; Silveira, C.; Ferreira, J.; Monteiro, A.; Lopes, D.; Relvas, H.; Borrego, C.; Roebeling, P. Current air quality plans in Europe designed to support air quality management policies. Atmos. Pollut. Res. 2015, 6, 434–443. [Google Scholar] [CrossRef]
- Todorov, V.; Dimov, I. Innovative Digital Stochastic Methods for Multidimensional Sensitivity Analysis in Air Pollution Modelling. Mathematics 2022, 10, 2146. [Google Scholar] [CrossRef]
- Piracha, A.; Chaudhary, M.T. Urban Air Pollution, Urban Heat Island and Human Health: A Review of the Literature. Sustainability 2022, 14, 9234. [Google Scholar] [CrossRef]
- Termovalorizzatore Bolzano. Available online: https://www.eco-center.it/it/attivita-servizi/ambiente/impianti/impianto-di-termovalorizzazione-897.html (accessed on 23 August 2022).
- Termovalorizzatore Piacenza—Iren. Available online: https://www.irenambiente.it/termovalorizzatore-piacenza (accessed on 23 August 2022).
- Termovalorizzatore Rifiuti Urbani a Forlì—HERAmbiente. Available online: https://ha.gruppohera.it/impianti/termovalorizzatori/forli (accessed on 23 August 2022).
- Termovalorizzatore di Rimini—HERAmbiente. Available online: https://ha.gruppohera.it/impianti/termovalorizzatori/rimini (accessed on 23 August 2022).
- Acea Ambiente—Sintesi Non Tecnica. Available online: https://www.regione.umbria.it/documents/18/1820474/Scheda+E.pdf/66c27f76-d984-4702-92d9-d3fb296809d6?version=1.0 (accessed on 23 August 2022).
- Acsm Agam Ambiente. Available online: https://www.acsmagamambiente.it/documents/39547/141169/AIA+n.++4922+del+30.05.2016.pdf/5eaf65bd-c3e5-acc2-2617-3e2f3dc050aa?t=1532353894244 (accessed on 23 August 2022).
- Sienambiente—Report Ambientale 2020. Available online: https://www.comune.poggibonsi.si.it/comune-poggibonsi-media/immagini/ReportAnnualeAmbientale_Trm_2020-medcom52654.pdf (accessed on 23 August 2022).
- APPIA ENERGY S.r.l.—Dichiarazione Ambientale 2019–2021. Available online: http://www.appiaenergy.com/pdf/DA_Appia%20Energy_convalidato.pdf (accessed on 23 August 2022).
- European Environment Agency. Municipal Waste Incineration 2019. Available online: https://www.eea.europa.eu/publications/emep-eea-guidebook-2019/part-b-sectoral-guidance-chapters/5-waste/5-c-1-a-municipal/view (accessed on 24 August 2022).
- Viganò, M.; Guandalini, R.; Grosso, M. Determinazione in continuo della quota di energia rinnovabile prodotta dai termovalorizzatori di rifiuti. Ing. Ambiente 2014, 1, 65–80. [Google Scholar]
- COPERT (EMISIA SA). Available online: https://www.emisia.com/utilities/copert/ (accessed on 24 August 2022).
- Regulation (EC) No 595/2009 of the European Parliament and of the Council of 18 June 2009 on Type-Approval of Motor Vehicles and Engines with Respect to Emissions from Heavy Duty Vehicles (Euro VI) and Amending Regulation (EC) No 715/2007 and Directive 2007/46/EC and Repealing Directives 80/1269/EEC, 2005/55/EC and 2005/78/EC. Available online: https://eur-lex.europa.eu/legal-content/EN/TXT/HTML/?uri=CELEX:02009R0595-20200901&from=EN (accessed on 24 August 2022).
- Global Warming Potentials (IPCC Second Assessment Report). Available online: https://unfccc.int/process/transparency-and-reporting/greenhouse-gas-data/greenhouse-gas-data-unfccc/global-warming-potentials (accessed on 24 August 2022).
- Ungureanu, M.; Jozsef, J.; Brezoczki, V.M.; Monka, P.; Ungureanu, N.S. Research Regarding the Energy Recovery from Municipal Solid Waste in Maramures County Using Incineration. Processes 2021, 9, 514. [Google Scholar] [CrossRef]
- Ragazzi, M.; Torretta, V.; Torres, E.A.; Schiavon, M.; Rada, E.C. Perspectives of decentralised gasification of residual municipal solid waste. Energy Rep. 2022, 8, 1115–1124. [Google Scholar] [CrossRef]
Publisher’s Note: MDPI stays neutral with regard to jurisdictional claims in published maps and institutional affiliations. |
© 2022 by the authors. Licensee MDPI, Basel, Switzerland. This article is an open access article distributed under the terms and conditions of the Creative Commons Attribution (CC BY) license (https://creativecommons.org/licenses/by/4.0/).