Article

Current and Foreseen Tungsten Production in Portugal, and the Need of Safeguarding the Access to Relevant Known Resources

by
António Mateus
1,2,*,
Catarina Lopes
3,
Luís Martins
4 and
Mário Abel Gonçalves
1,2
1
Departamento de Geologia, Faculdade de Ciências, Universidade de Lisboa, Ed. C6, Piso 4, Campo Grande, 1749-016 Lisboa, Portugal
2
Instituto Dom Luiz (IDL), Faculdade de Ciências, Universidade de Lisboa, Ed. C1, Piso 0, Campo Grande, 1749-016 Lisboa, Portugal
3
Earth Sciences Centre, University of Minho-Campus of Gualtar, 4710-057 Braga, Portugal
4
Cluster Portugal Mineral Resources, Praça Luís de Camões nº 38, 7100-512 Estremoz, Portugal
*
Author to whom correspondence should be addressed.
Resources 2021, 10(6), 64; https://doi.org/10.3390/resources10060064
Submission received: 29 April 2021 / Revised: 11 June 2021 / Accepted: 15 June 2021 / Published: 18 June 2021

Abstract

:
The economic and strategic importance of tungsten is widely recognized, but several concerns exist on its stable future supply. Portugal is one of the main tungsten producers in Europe, having generated ≈121 kt of contained tungsten in mineral concentrates from 1910 to 2020, i.e., ≈3.3% of the global production documented for the same time period. Since the early nineties, tungsten mining in Portugal is confined to the Panasqueira deposit which accounts for 79% of the country reserves (≈5.4 kt). However, according to the performed Generalized Verhulst and Richards curve-fitting forecasts, there is a significant future potential for increasing production in Portugal due to the low (<2%) depletion rates of the remaining known tungsten resources (≈141 kt). This projected growth is not necessarily guaranteed, depending on many unpredictable economic, technological, and political factors, besides appropriate social consents. Even so, a prudent land-use planning oriented to long-term needs should avoid the sterilization of the most relevant tungsten resources so far identified in the country. These are resources of “public importance”, as objectively demonstrated with a weighed multi-dimensional (geological, economic, environmental, and social) approach. Safeguarding the access to these resources does not implicate more than ≈6% of the Portugal mainland territory. The joint interpretation of results independently gathered for tungsten production forecasts and for the definition of areas hosting tungsten resources of public importance, provides additional support to political decisions on the urgent need to reconcile mineral exploration surveys and mining with other land uses.

1. Introduction

Tungsten has unique properties and the intensive use of tungsten-bearing products in a wide range of industrial applications (some of them highly specialized) explains the economic and strategic value commonly ascribed to this metal, e.g., [1,2]. The global supply chain of tungsten, as many other mineral-related commodities, depends significantly on mining and subsequent processing of mineral concentrates, which are subjected to the basic market laws [3,4]. Therefore, instabilities affecting the production of these upstream industrial activities have potential to variably disturb the stability of tungsten supply globally. According to the “opportunity cost paradigm”, e.g., [5,6], the cumulative availability curves [7,8] should be used to assess the total amount of tungsten that can be produced economically at various prices with known technologies and considering other operational constraints. Even so, indications provided by the remaining ultimately recoverable mineral resources [9] are also valuable if viewed as an exploratory inspection of the problem. The same is true when reserves, i.e., the cost-effective fraction of mineral resources, are used in preliminary surveys on potential short-run shortages caused by possible supply/demand imbalances. In both approaches, the mineral resources and reserves are not seen as fixed stocks but rather as valid estimations of the mineral-contained metal that potentially could be recovered during a specific time-window.
In a recent assessment [10], tungsten was included in a particular group of metals for which mining production is dominated by a few countries not existing in many other viable alternatives to quickly change the intertwines that support the current global supply chain. Actually, the world supply flow is dominated by production in China and exports from China [11]. This country is also the main world’s tungsten consumer, followed by the USA and EU [11]. Recent restrictions to the tungsten industry in China have created some concerns about the world supply pattern for this mineral commodity in the future [3,12,13]. Therefore, considering the common market regulators, e.g., [7,14], production in other countries is expected to increase via resuming exploitation works in old mines (making use of up-to-date technologies) and the launch of new mining projects in known deposits. In addition, increased investments in mineral exploration surveys are also likely, which may lead to new discoveries (even in well-explored districts) that will expand the resources so far identified.
Contrary to other mineral commodities, assessments on possible future depletion of tungsten resources are scarce, limited in time and often focused on the Chinese territory [15,
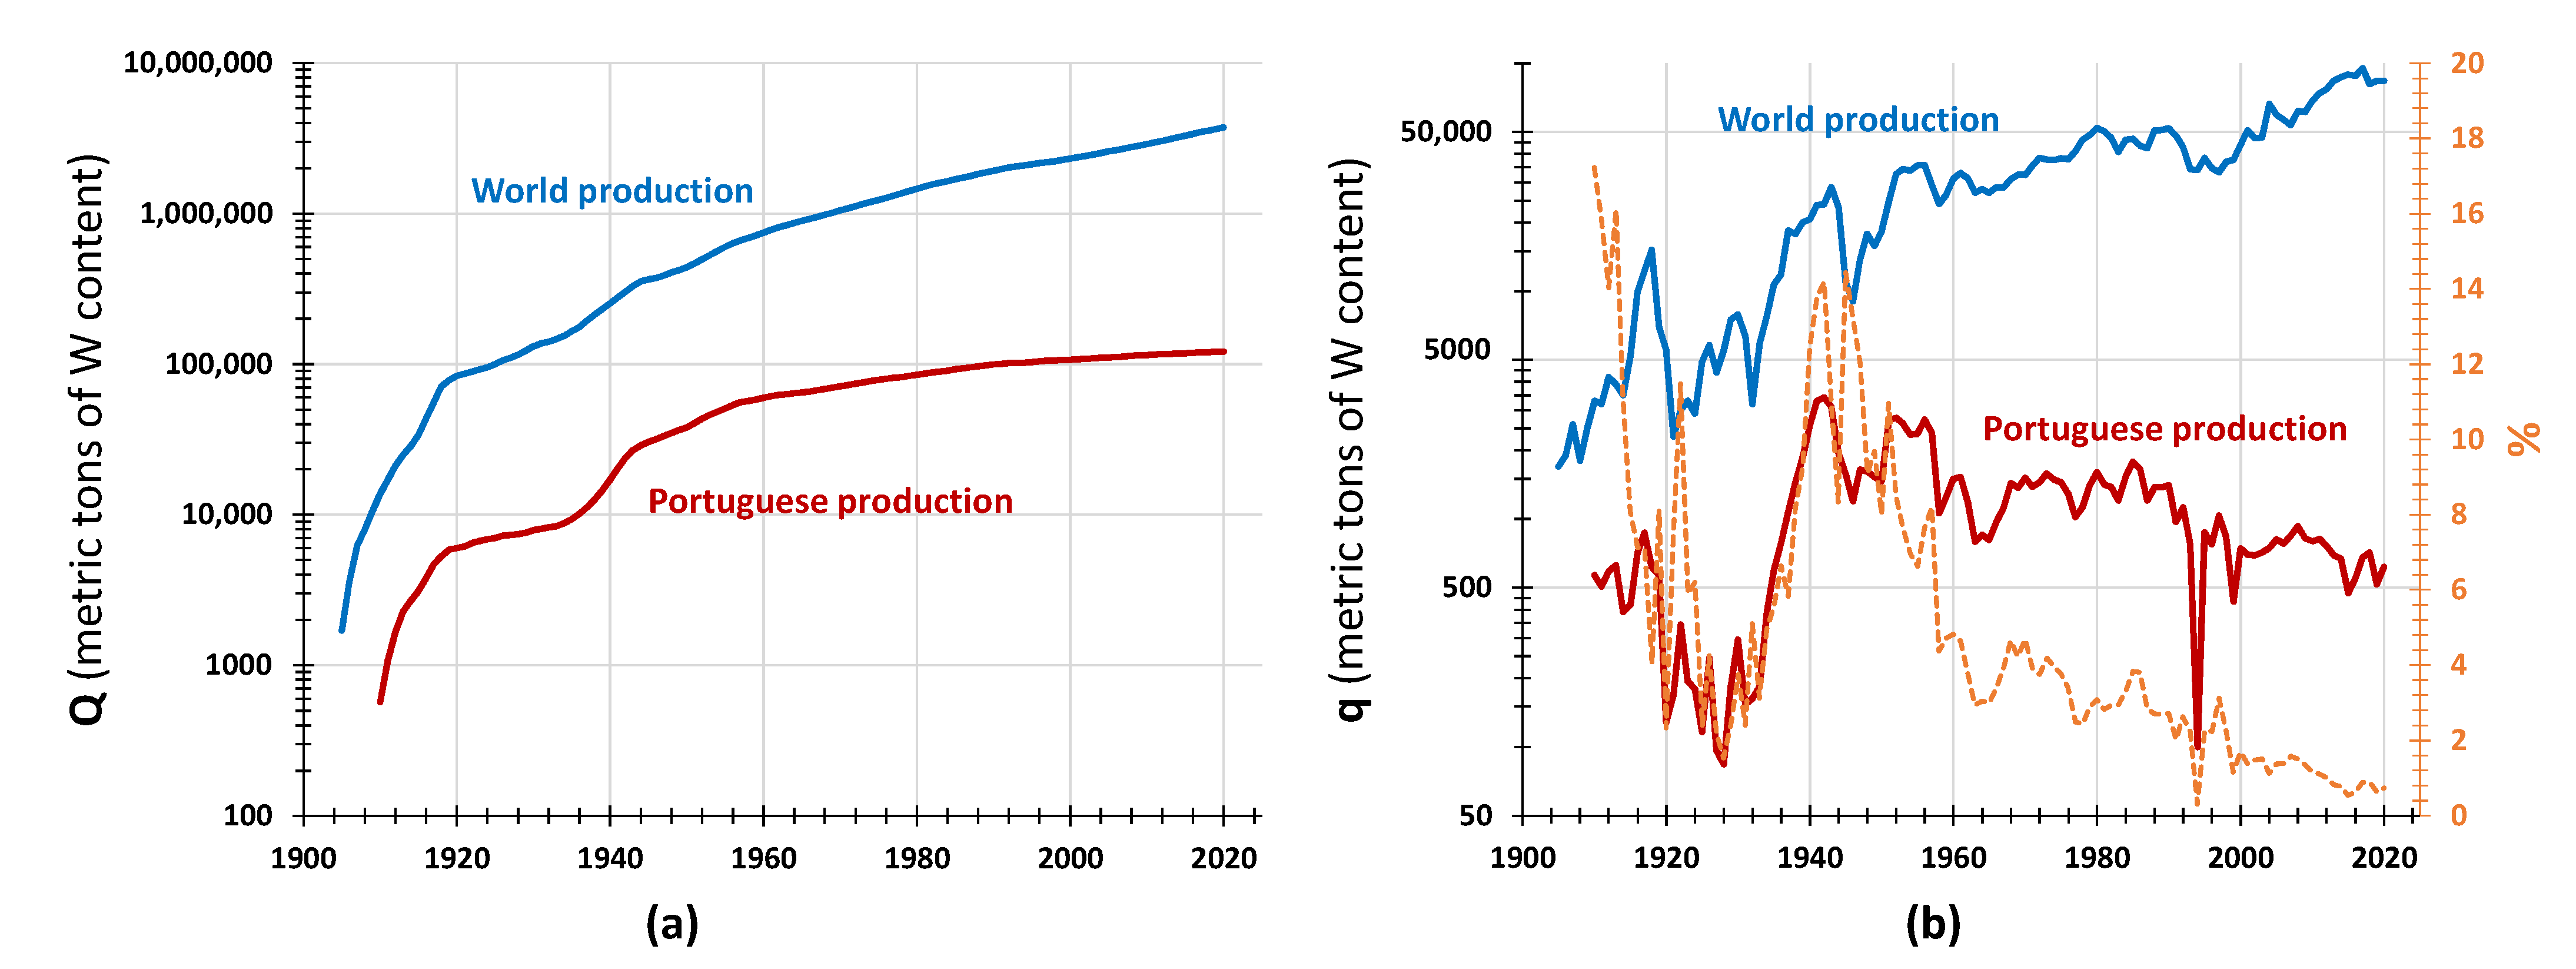
16]. Historically, for more than a century, Portugal has maintained a meaningful share of the global production of tungsten mineral concentrates [17]. The main goal of the present study is to evaluate the prevalent tendency for worldwide tungsten production in the future and the possible growth of the Portuguese tungsten production, thus reducing the EU reliance on imports. To this end, the known tungsten resources and reserves, and the historical tungsten production at a global and national level, will be used to constrain the Generalized Verhulst and Richards curve-fitting models. The forecasts for mining outputs (wolframite and scheelite mineral concentrates) in Portugal will be discussed taking into account the long-term trends also estimated for the world primary production. Subsequently, the need of safeguarding the access to the most promising tungsten resources in Portugal will be addressed, weighing the available geological knowledge with the economic, environmental, and social dimensions implicated in the current or foreseen exploitation activities. Consistent information regarding the collection and recycling of tungsten-based scrap in Portugal is missing, but some thoughts on prospective contributions of this secondary source for the country outputs will be provided.

2. Current Main Concerns about the Tungsten Supply Chain

The ammonium paratungstate (APT) and tungsten oxide, along with tungsten metal powder and tungsten carbide, are fundamental components of the global supply chain. The manufacture of all these products is supported by the exploitation, transformation, and beneficiation (≈70%) of wolframite and scheelite mineral concentrates, besides recycling (≈30%) of tungsten-based scrap, e.g., [3]. Cemented carbides (60–65%), steel and metal alloys (10–15%), mill products (15–20%), and chemicals (<10%) are the main tungsten applications, mostly consumed in the manufacture of a large variety of automotive components, wear resistant cutting and grinding tools, catalysts and electrical/electronic devices, e.g., [2,18]. However, the increasing importance of tungsten-containing supper-alloys in aerospace/satellite applications, and of tungsten electron emitters and voltage regulators in modern electronics, should rule future market expansions, e.g., [19,20].
The global tungsten market is projected to reach ≈125,000 metric tons (kt) by 2025, despite the tendency for destocking by some tungsten first-users (i.e., relevant players in the automotive, aerospace and tooling sectors) and their recent unpredicted reductions in production during the SARS-Cov2 pandemic [21]. This figure represents the cumulative effect of an average annual increase of ≈2.5% for the tungsten demand since 2017, considering the consolidated global consumption of 105 kt in that year. The forecasted average demand growth is small and below previous estimates for the 2015–2020 period (3 to 4.5%), but has potential to cause several instabilities in the worldwide tungsten supply chain.
According to data compiled by the United States Geological Survey (USGS) [22], global primary production in the 2015–2020 time period decreased from 89.4 to 84 kt of the contained tungsten in mineral concentrates. This production was completed in a large number of countries, although clearly dominated (>80%) by the Chinese output. Many efforts have been made in the last decade to expand the geological knowledge on the tungsten-rich belts in China, e.g., [16,23]. Nonetheless, further developments of tungsten mining activities in China will be largely constrained by the limited availability of high-quality ores and new legal restrictions to some industrial routines [12,13]. This tendency will gradually change the continuous path of increased production of mineral concentrates over the last 40 years by this country, despite the sustained decline of tungsten prices since 2014 (often below the break-even mining costs). The existing APT stocks (mostly in China) and improvements in recycling of tungsten-based scrap have been instrumental in the fulfilment of the most recent market needs and short-term demand growths. Even so, the depletion rates of APT stocks in China are accelerating due to a consistent increase of domestic consumption, thus reducing their lifetime and restraining exports of tungsten-bearing products [13].
Inputs from recycling, although significant, are not enough to overcome strong reductions of tungsten primary production. In China, the largest world consumer (≈55% of the whole tungsten market), recycling rates of tungsten-based scrap do not exceed ≈10% [13,24], well below the global average value of 30% [3,25,26]. Furthermore, in many applications, tungsten recycling is very demanding, highly expensive, and sometimes impossible due to dispersion or dilution effects [3,25,26,27,28]. There are some options for tungsten substitution in several applications but these result in losses of product performance and/or higher manufacturing costs [2,28]. Therefore, (1) the hegemony of China in tungsten-producer/consumer chains, (2) the challenges posed by tungsten recycling along with the lack of appropriate and widespread post-consumer collection systems, and (3) the poor merit of potential tungsten substitutes, generate concerns about the supply stability of tungsten-bearing products in the future. These concerns combined with the economic and strategic importance of tungsten have justified its classification as a critical raw material by some main consumers, such as the USA, Japan, Australia, and the EU [29,30,31,32,33].
The use of tungsten-bearing products in the EU has reached a significant share (14 to 19%) of the global amount consumed yearly since 2011 [30]. The domestic production of tungsten intermediates (APT and tungsten oxide) is negligible and the maximum contribution from recycling is estimated on 49% of the total tungsten material input in the region [34]. The EU output of mineral concentrates has remained relatively constant over the past 20 years with production coming from Austria and Portugal and, from 2008 onwards, mostly complemented by the tungsten exploitation resurgence in Spain. Yet, this output represents less than 15% of the non-Chinese primary production [29,30]. Reduction of the EU reliance on tungsten imports implies concerted political/industrial actions that definitely encourage the development of domestic endeavors on mineral exploration, mining and processing of mineral concentrates, besides the ongoing agendas on reuse and recycling, e.g., [35].

3. Databases and Data Handling

The open data series available on the USGS website was used to characterize the historical global production of tungsten from 1910 to 2020 [22]. Reference values for the tungsten world resources and reserves were also compiled from the same source to ensure internal data consistency. The historical record of tungsten production in Portugal from 1910 to 2020 was obtained in official reports of the General Directorate for Energy and Geology (DGEG—https://www.dgeg.gov.pt/pt/estatistica/geologia/, accessed on 18 January 2021). Data on tungsten resources and reserves in Portugal were collected from DGEG inventories and cross-checked with figures reported in the Information System of the Portuguese Mineral Occurrences and Resources (SIORMINP, [36]) managed by the Portuguese Geological Survey (LNEG), also summarized in a recent published assessment [17]. All these numbers are in Table S1 of Supplementary Materials.
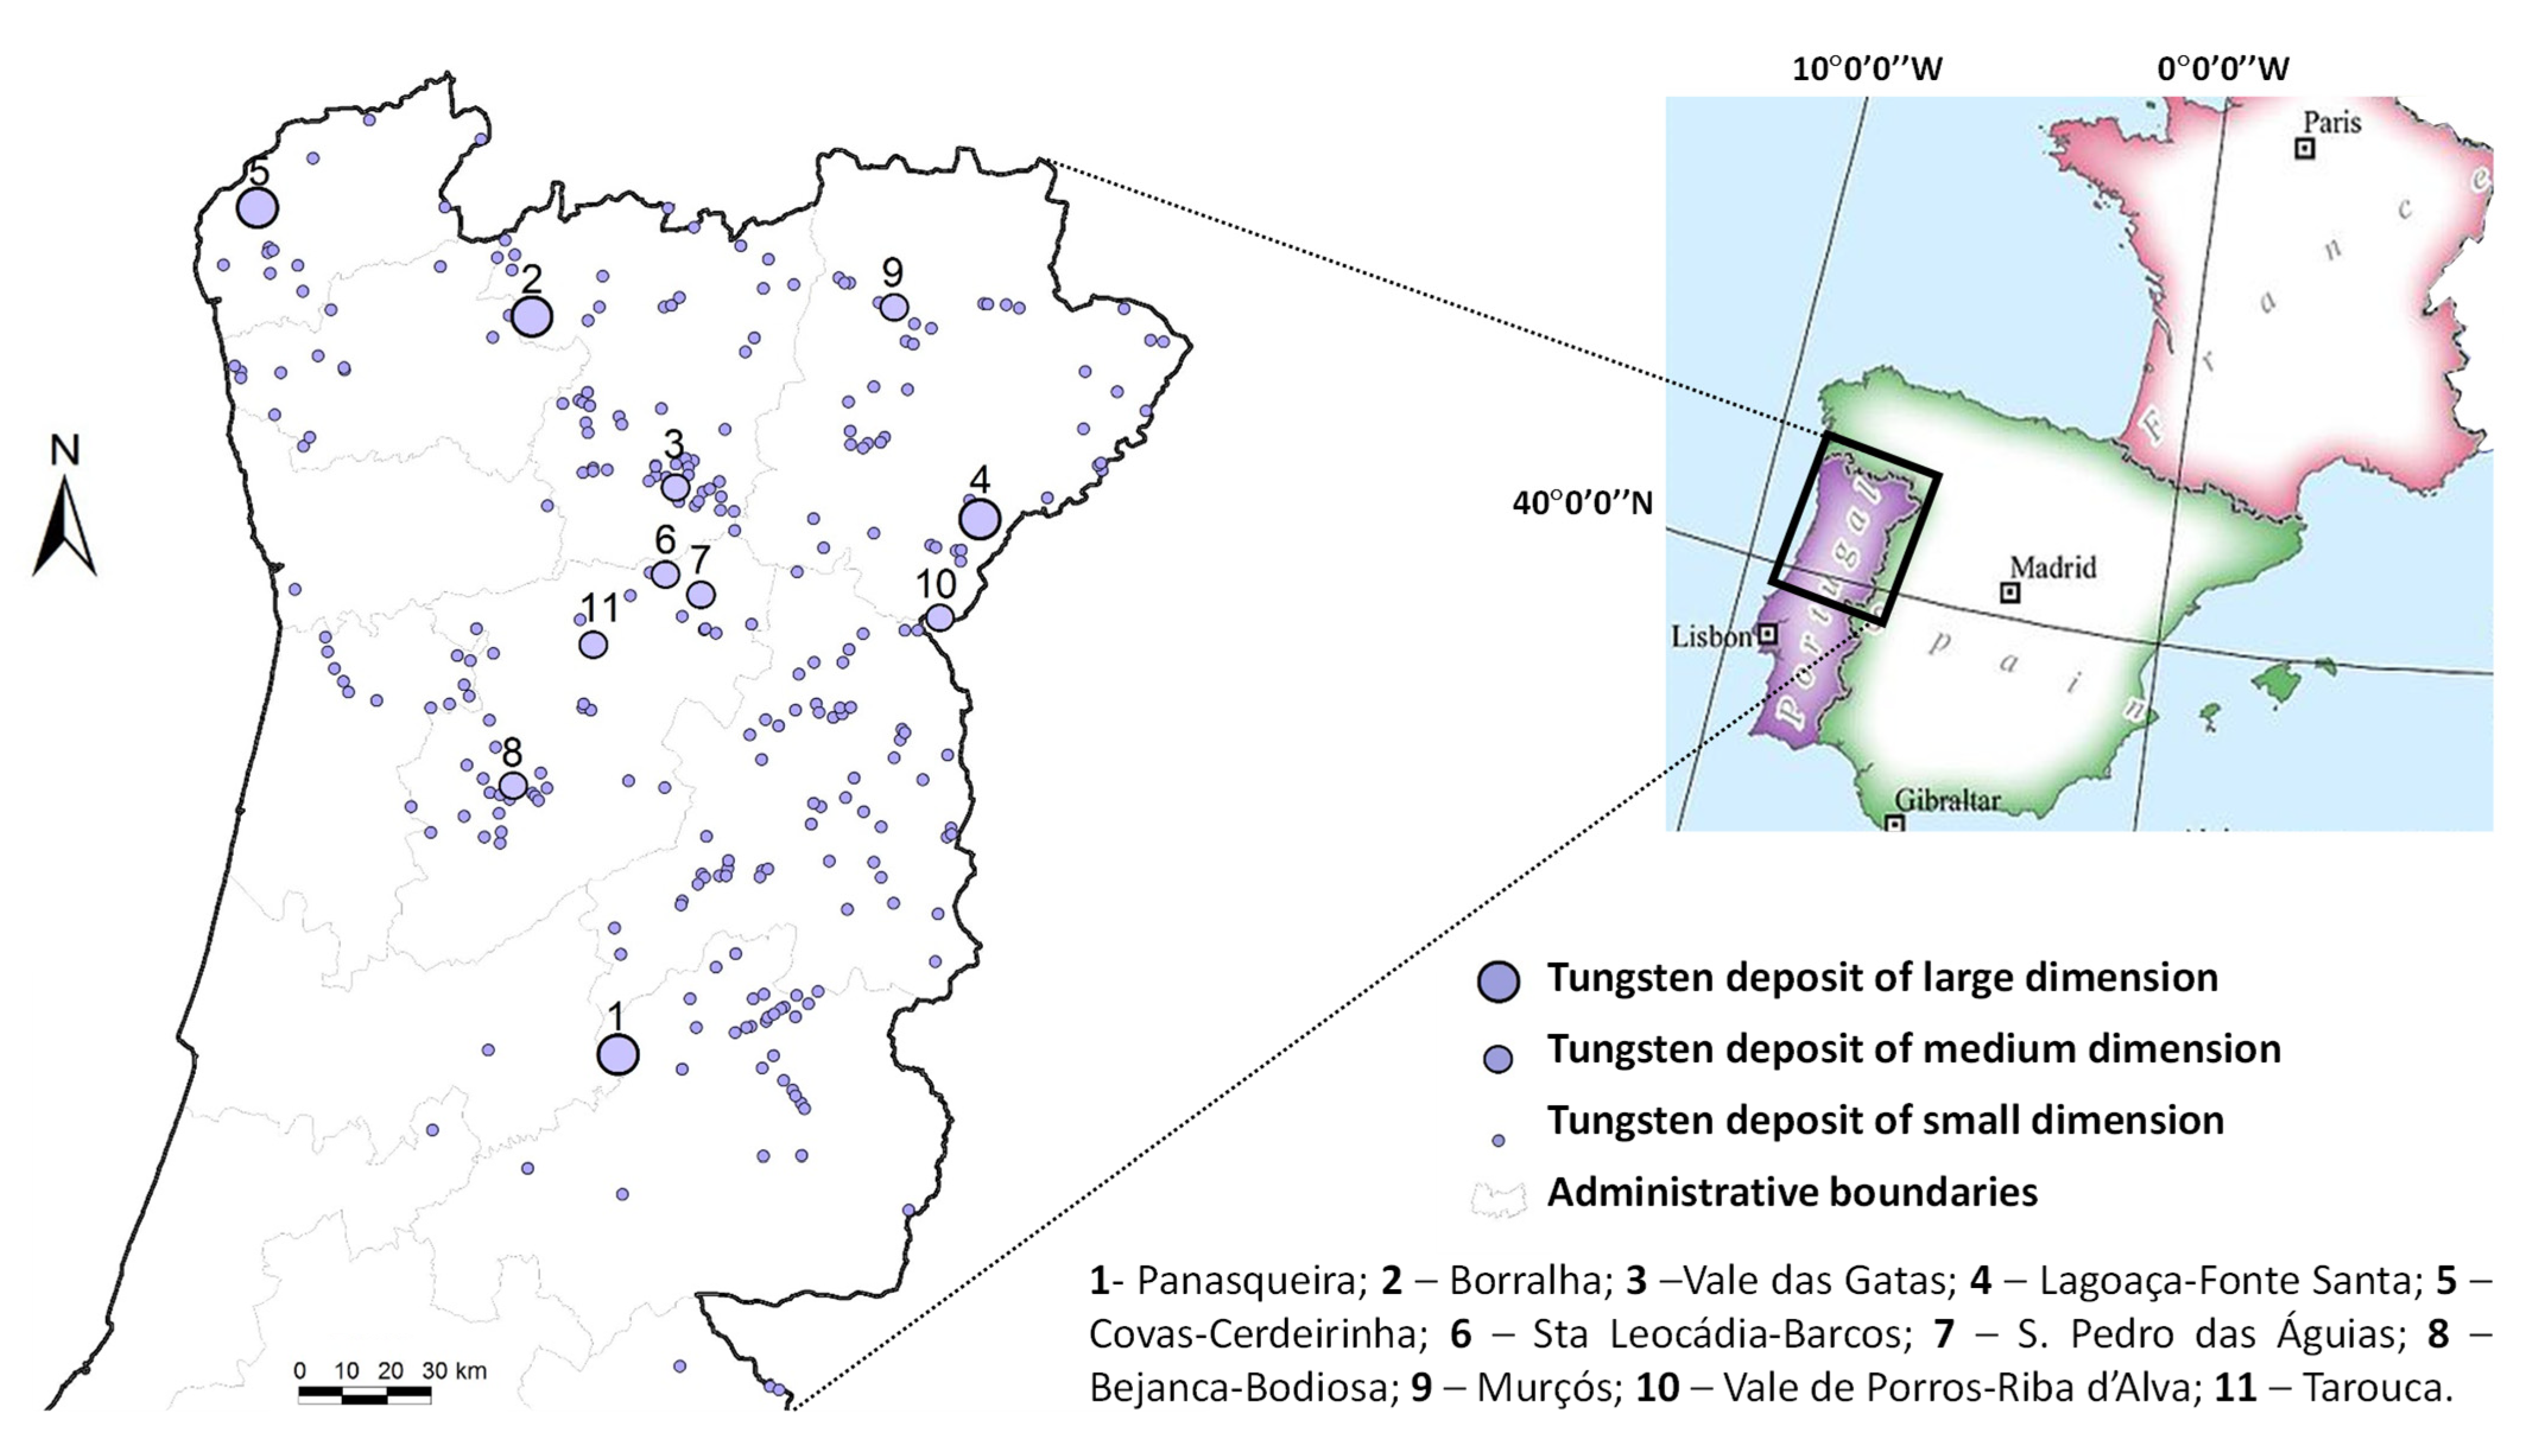
The SIORMINP national catalogue was used to collect the baseline information on all the documented tungsten occurrences/deposits in Portugal, further complemented with details provided by DGEG about areas granted for mineral exploration and exploitation (https://www.dgeg.gov.pt/pt/areas-setoriais/geologia/depositos-minerais-minas/, accessed on 27 January 2021), and with up-to-date technical information on the most relevant tungsten ore systems so far recognized in the country. The resulting database assisted the multi-criteria methodology explained in Section 3.2, aiming at a safeguarding recommendation/decision on the current and future access to the Portuguese tungsten resources.

3.1. Curve-Fitting Models for Tungsten Production Forecasting

As reported in many studies, e.g., [37,38,39,40,41], mineral production over time are mostly often described by bell-shaped or logistic curves. The numerical approaches so far tested differ in several details, but the Generalized Verhulst Model (GVM)
q ( t ) = U R R ( t ) × k n × ( 2 n 1 ) e ( k ( t t m ) ) [ 1 + ( 2 n 1 ) e ( k ( t t m ) ) ] n + 1 n
and the Richards Model (RM)
Q ( t ) = U R R ( t ) × [ 1 + b × e ( k ( t t m ) ) ] 1 b
cover suitably the range of curve-fitting solutions to historic production data. In fact, GVM reproduces the Hubbert model when the distribution of the annual production q ( t ) is symmetrical, i.e., when the curve shape parameters ( k and n ) match 1 and tm = 50 (the time at which the resource is one-half depleted). The RM replicates the Logistic curve for the cumulative production over time Q ( t ) when the shape parameter b = 1, being equivalent to the Gompertz model when b → 0, see also [38,42]. In both Equations (1) and (2), U R R ( t ) denotes the ultimately recoverable resources, i.e., the upper limit to cumulative production. This is a critical parameter, often uncertain and variable with time due to advancements in geological knowledge and/or technology, besides externalities related to the evolution of economy/market conditions and/or to political factors. Therefore, U R R ( t ) values are not fixed stocks. They represent instead a time-dependent estimation of variably characterized quantities that should be reviewed regularly in accordance to the results of mineral exploration surveys, e.g., [43]. The fraction of resources that could be economically exploited in a specific time-frame is classified as reserves. The latter are also time-dependent amounts vulnerable to a large number of economic, financial, regulatory, legal, social, and environmental parameters related to mining, mineral processing, and trading, e.g., [43]. Accordingly, forecasts constrained by current estimations of resources and reserves are controversial [7,43], despite their usefulness if correctly interpreted.
In this study, the long-term tungsten production in Portugal was estimated with GVM and RM curve-fitting models and compared with trends similarly obtained for global production. Modelling results were fitted to historical production data series from 1910 to 2020 using least squares minimization and U R R ( t ) as a first constraint. The currently estimated values for tungsten resources and reserves worldwide and in Portugal were cautiously used to confine a plausible range for U R R ( t ) . The Portuguese output of tungsten mineral concentrates over time shows a significant irregularity that could be tentatively ascribed to distinct production cycles, but an adequate numerical inspection of this possible multi-cycle pattern [44] is hindered by data quality compiled for some periods, namely those previous to 1950. Therefore, a single production cycle was assumed during modelling.
The depletion rate, a measure of how rapidly recoverable resources are exhausted, e.g., [45], was also examined. Using the U R R ( t ) values as reference, the depletion rate at a time t is
d U R R , t = q ( t ) U R R t
However, considering the remaining recoverable resources at a certain time, the resulting depletion rate
d R R R , t = q ( t ) U R R t Q ( t )
is far more useful in prospective analysis [45]. This measure is not influenced by the curve shape nor by the number of cycles in modelling [42]. However, it can be used to prevent models from reaching mathematically optimal but unrealistic production rates [39,46]. The numerical approaches in this study were constrained by an allowed maximum d R R R , t of ca. 5% [45]. Nonetheless, it should be noted that none of the models reported in Section 4.1 for the global tungsten production actually reaches this d R R R , t upper limit. In what concerns the Portuguese production, the limitation imposed to d R R R , t was useful in forecasting the analysis constrained by minimum U R R ( t ) values. Considering the dynamic character of U R R ( t ) , high depletion rates do not necessarily indicate “imminent collapses” in production. They could simply be interpreted as an alert to the need to intensify efforts on mineral exploration and improve the efficiency of mining/processing activities, together with research seeking for suitable mixings of secondary sources of raw materials [47] and references therein.

3.2. Multi-Criteria Methodology for Delimit Tungsten Resources of Public Importance

The safeguarding of current and future access to mineral resources is a key issue in any objective agenda for social-economic development. However, the need to assign specific areas to mining activities and to reconcile active or latent conflicts with other land uses is not free of controversy, being additionally of problematical implementation. Different approaches have been recently proposed to deal with these issues [48,49,50]. In this study, we will use the multi-criteria methodology reported in [48], which relies on the concept of mineral resources of public importance (MRoPI). This implies that decision-makers and authorities have the responsibility to justify their judgement on the basis of a comprehensive analysis of what mineral resources should be safeguarded, evaluating what benefits would be gained and by who, with which costs and risks [51,52,53,54]. Accordingly, none of the identified mineral resources or promising exploration targets is excluded a priori, as long as the available information is sufficiently robust and credible to support a safeguarding decision and fully understood by all the concerned stakeholders.
The intended assessment, necessarily valid for a certain time range, is based on various sets of criteria that should rank the relative importance of: (i) All the deposits with proven or probable reserves; (ii) all the known uneconomic deposits with measured, indicated or inferred resources; and (iii) all the tracts hosting hypothetical deposits for which there are exploration results. Four main sets of criteria were defined, allowing an integrated appraisal of: (i) The level of geological knowledge ( L G K ) available for each specific tract; and (ii) the past, ongoing or foreseen exploitation activities in a specific tract, pondering equally the economic ( E c ), environmental ( E v ), and social development and acceptance ( S D A ) dimensions. Factors backing each criteria ( L G K = i = 1 4 G i ; E c = J = 1 5 E c j ; E v = l = 1 7 E v l ; S D A = w = 1 5 S D A w ) were variably weighed ( k i   k w ), and a general MRoPI ranking (= M R o P I r ) was established by means of:
M R o P I r = 5.5 i = 1 4 ( G i k i ) Q D A i + 1.5 ( j = 1 5 ( E c j k j ) Q D A j + l = 1 7 ( E v l k l ) Q D A l + w = 1 5 ( S D A w k w ) Q D A w )
where ( Q D A i   Q D A w ) represent a general “qualitative data assessment”, which equals 1.00 if the data is considered sufficient to assist the appraisal or 0.00 if there is no data available to support a credible assessment. Table 1 provides a summary of the criteria used and their weigh, and further details can be found in [48]. Other application examples are provided in published studies [55,56].
Different combinations of G 1 to G 4 criteria show that high levels of geological knowledge (i.e., L G K 0.73 ), supporting M R o P I r 4 , offer the confidence needed to substantiate a safeguarding recommendation/decision on the maintenance of current use and/or future access to the mineral resource recognized. Priorities about the use/access of safeguarding of specific tracts scored in the interval 4 M R o P I r 10 can also be objectively defined with this methodology, indicating:
  • As a first priority, specific tracts with M R o P I r 7 where mining/quarrying activities or detailed exploration surveys should have prevalence over any other kind of land use;
  • As a second priority, specific tracts with 6 M R o P I r < 7 where the land access/use should be preferentially, but not exclusively, assigned to exploration and/or exploitation works; alternative land uses are thus possible provided that they do not lead to partial or total sterilization of the identified resources;
  • As a third priority, specific tracts with 4 M R o P I r < 6 where land planning should be managed carefully, favoring the progression of exploration surveys whenever needed and avoiding circumstantial or long-lasting alternative land uses that can jeopardize further endeavors that may guide to viable mining operations.
In addition, it should be noted that the E c , E v , and S D A dimensions were only considered in specific tracts scoring M R o P I r 4 and whenever independent and up-to-date studies on these issues could be consulted, otherwise, nil values for Q D A j , Q D A l , Q D A w were used.
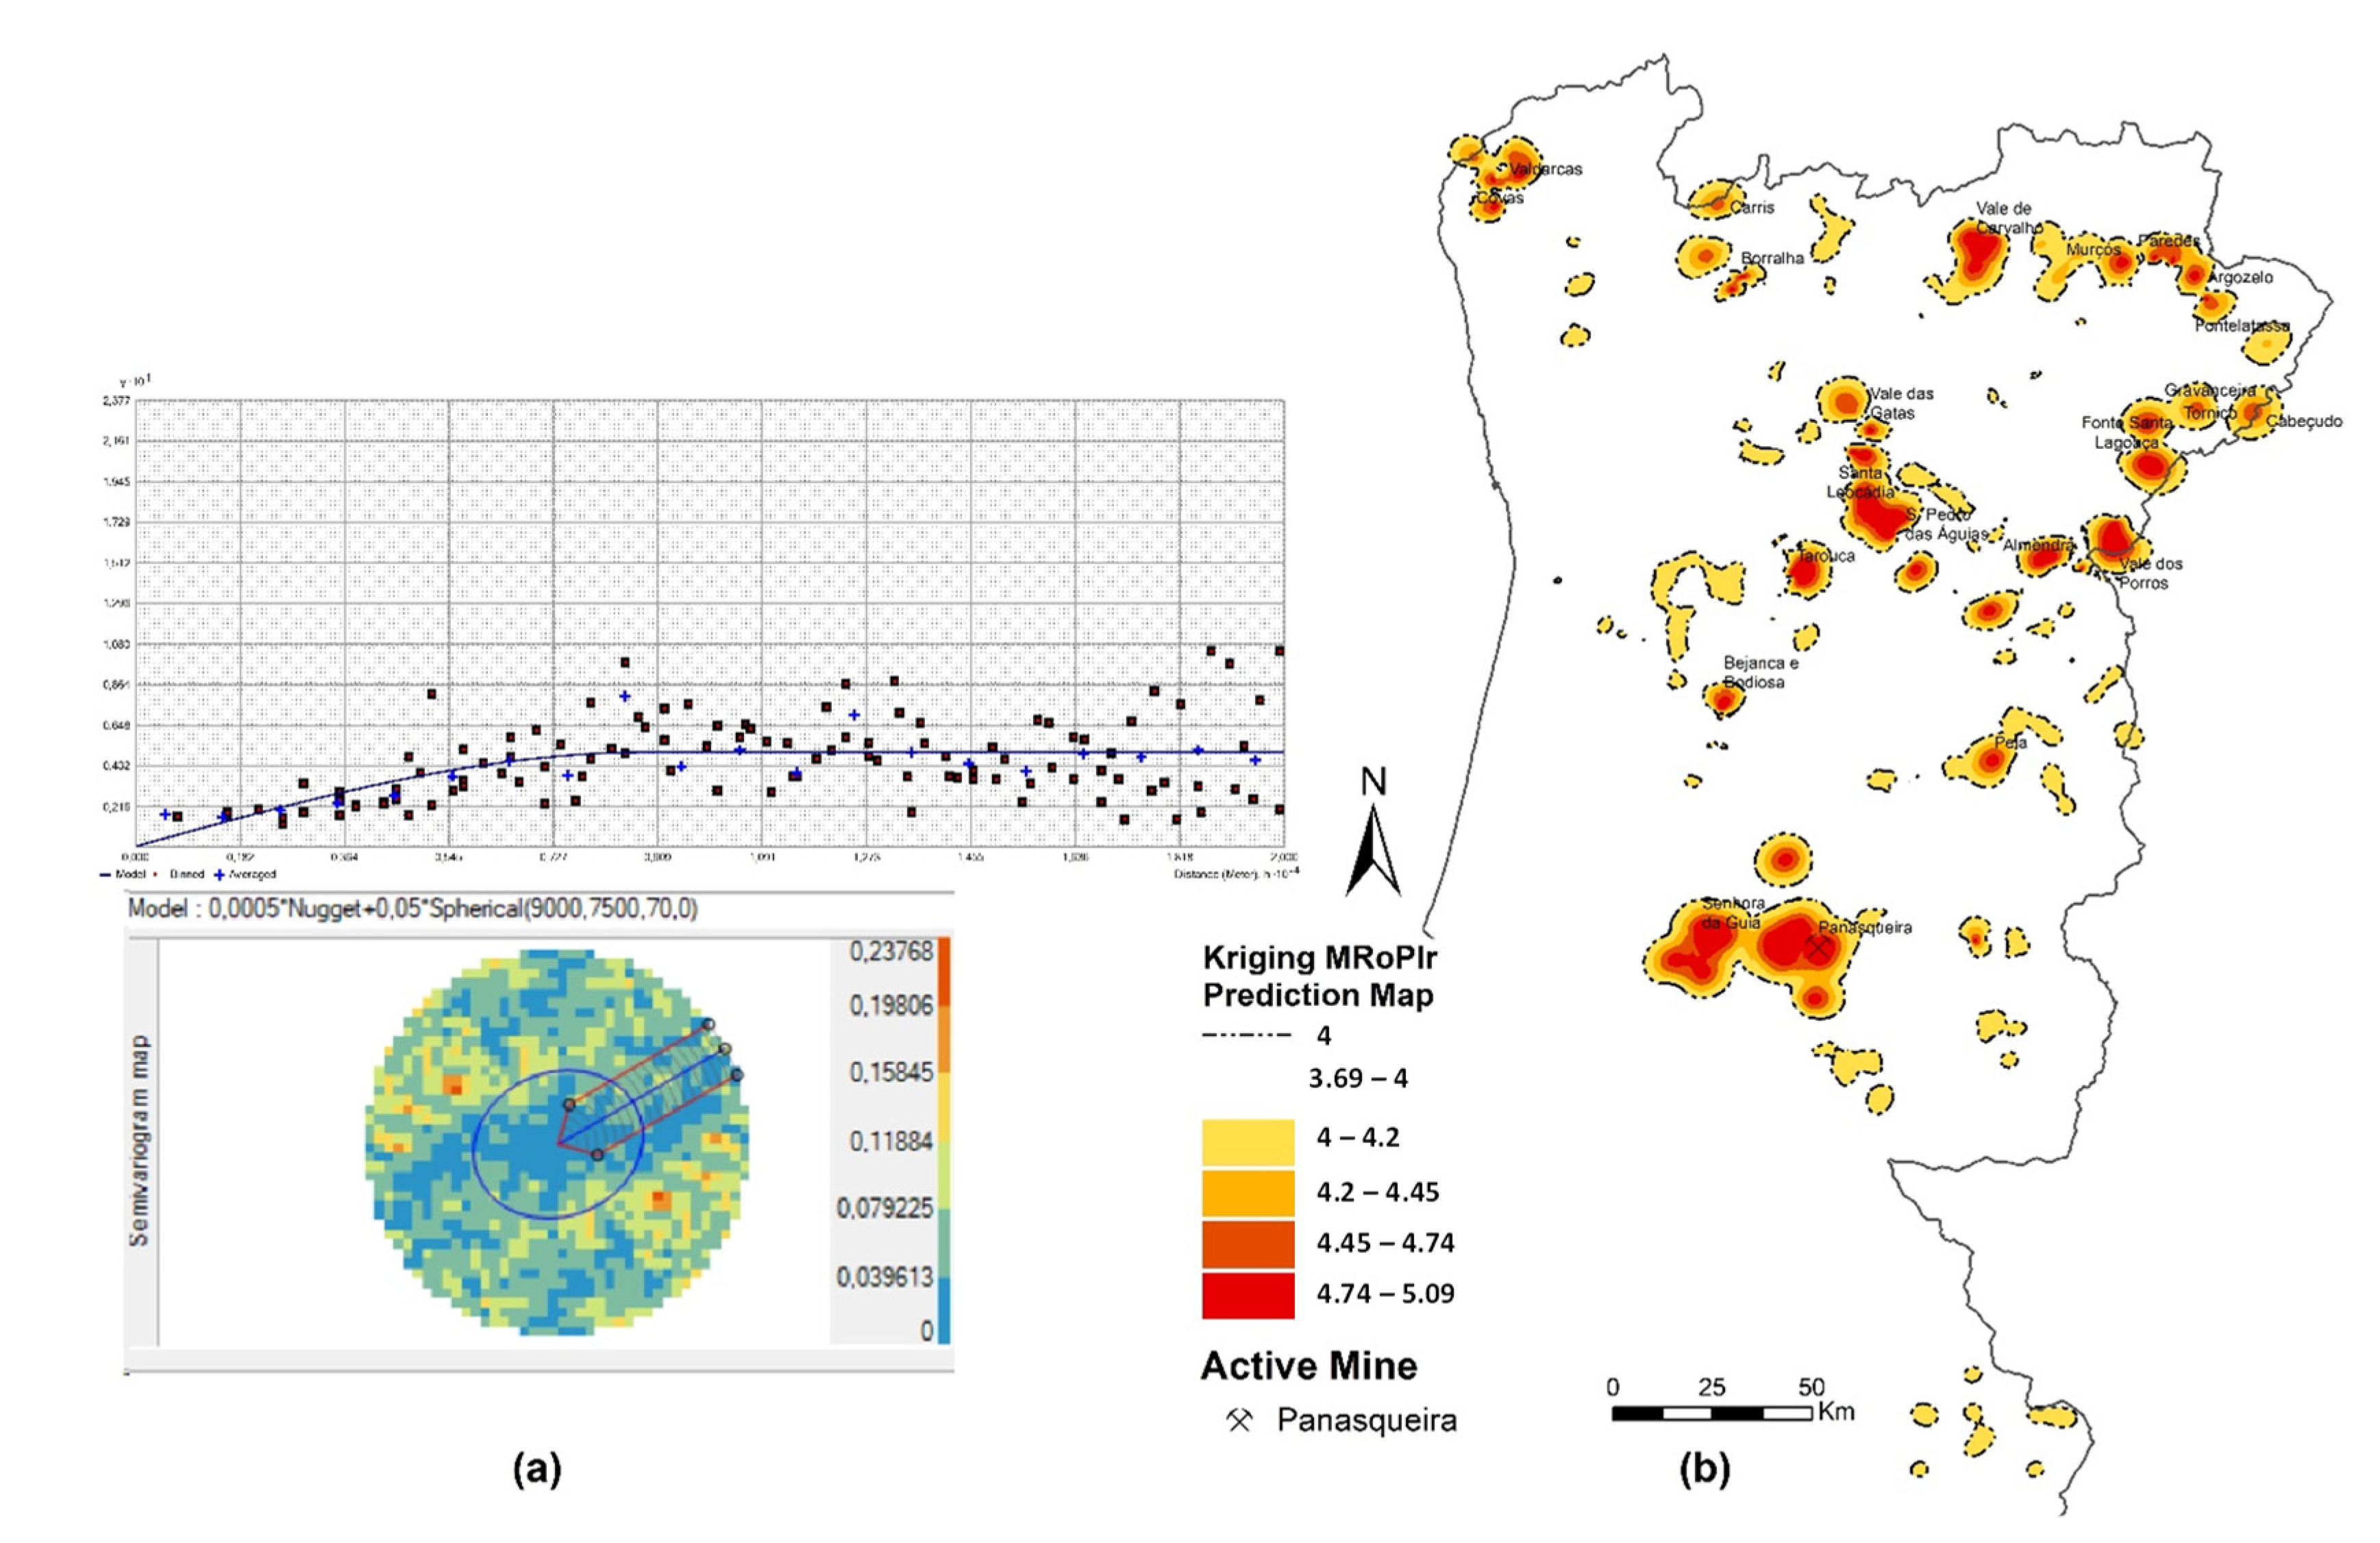
The final outputs were produced in ArcGIS 10.4.1 and all data information referred to the PT-TM06/ETRS89—European Terrestrial Reference System 1989. Whenever needed, the Geostatistical Analyst tool of ArcGIS was used in data handling and, as discussed in [30], the variography-supported simple kriging interpolation was chosen to delimit the areas hosting tungsten resources of public importance.

4. Results

4.1. The Portuguese Share of Tungsten Global Primary Production

All the available statistics show that Portugal has had a significant participation in the global primary production of tungsten mineral concentrates, being one of the most relevant players in Europe for more than a century. From 1910 to 2020, the Portuguese input totaled 121.53 kt of the contained tungsten in mineral concentrates, representing ca. 3.3% of the world production documented for the same time period (3.71 million metric tons, Mt)—Figure 1a (data in Table S1 of Supplementary Materials). The golden periods of production occurred in the 1910–1920 and 1940–1950 decades during which Portugal accomplished more than 10% of the global production (Figure 1b).
Intensive mining of several quartz-lode deposits along with many artisanal panning and digging exploitation works (mostly in low-tonnage and low-grade cropping-out quartz-lode occurrences) were decisive to the annual tungsten production increase in Portugal between 1937 (overcoming for the first time 1 kt) and 1945. This combined effort allowed achieving tungsten productions above 3 kt/year from 1941 to 1943, peaking at 3.42 kt in 1942. However, these were very particular years when the war effort in Europe (1939–1945) encouraged production growths at any cost, using all the possible means. In general, tungsten production in Portugal remained consistently above 1 kt/year between 1937 and 1990, excluding the brief 1963–1966 period when the outputs ranged from ≈0.80 and 0.97 kt/year. From 1991 onwards, the tungsten produced yearly in Portugal was narrowed to the interval 0.5–1 kt.
Empirical evidence show that operational difficulties in some underground mines affected the tungsten mining production in Portugal during the late sixties and most of the seventies. Several technical setbacks (or investment shortages) in the upgrading of processing lines for specific ore types (often showing a complex mineralogical matrix) also occurred in that period. Therefore, the Portuguese tungsten industry was vulnerable when the rapid decline in international prices of tungsten began in 1980, determined by the large quantities of low-priced Chinese ores in the market. All these factors led to the gradual closure of extractive operations in the country. In the early nineties, only the Panasqueira Mine was active and, despite various critical episodes (the most serious in 1994), it was possible to continue the production in this important industrial center up to the present time.

4.2. Future Trends of Tungsten Primary Production in Portugal

As briefly addressed in Section 3.1, the upper limit to cumulative production ( U R R ( t ) ) and the depletion rates of remaining recoverable resources ( d R R R , t ) are the most important constraining factors of the intended GVM and RM curve-fitting models. Both factors will be examined in the next two subsections, preceding the report of modelling results.

4.2.1. Reserves and Resources

Information on tungsten reserves and resources so far recognized in the most important Portuguese deposits [17,36] is summarized in Table 2. Estimates on tungsten reserves (proved and probable) are only available for three quartz-lode deposits: Panasqueira, Borralha (also comprising mineralized quartz-breccias), and Vale das Gatas. Jointly, the Portuguese reserves make 5.4 kt of contained tungsten in wolframite-dominant mineral concentrates, representing 0.16% of the world reserves (3.4 Mt) indicated by the USGS database. Circa 79% of the country reserves are confined to Panasqueira, but these figures could change in a near future as a result of ongoing studies about the economic feasibility to resume the exploitation works at Borralha and Vale das Gatas (both suspended in the late eighties).
Computation of total tungsten resources in Portugal is not free of controversy as data presented in different studies and technical reports vary significantly, also reflecting the use of distinct measurement procedures and criteria over time. Thus, the numbers in Table 2 should be understood as the best possible approximation, being certainly influenced by inaccuracies that cannot be suitably assessed. Tungsten resources (measured, indicated, and inferred) reported for the 11 deposits listed in Table 2 totalize 122.6 kt and ≈60% of this amount corresponds to scheelite-dominant mineral concentrates that could be obtained in skarn-type deposits and endo- to exo-granite batholith stockworks.
On the basis of the figures in Table 2, one may conclude that tungsten reserves so far recognized in Panasqueira, Borralha, and Vale das Gatas could be used as a conservative threshold for U R R ( t ) . In other words, the 5.4 kt of tungsten could be viewed as the upper limit to short-term cumulative production in Portugal, assuming that mining will proceed in Panasqueira and that exploitation works will restart soon in Borralha and Vale das Gatas. However, the tungsten production forecasting over longer time runs should consider the known resources in the country, besides its reserves. The 128 kt (122.6 + 5.4) documented in Table 2 represents a good starting number to estimate a plausible maximum value for U R R ( t ) , which must include the resources of many other (small) tungsten deposits (Figure 2). The main problem is that no reliable estimates exist on this part of the whole tungsten endowment of the Portuguese territory. This difficulty was circumvented by assuming that resources related to all these small deposits represent 10% of the amount listed for the 11 main deposits in Table 2, i.e., 12.8 kt of tungsten. As a result, the upper limit to long-term cumulative production of tungsten in Portugal was tentatively placed at 141 kt (=122.6 + 12.8 + 5.4), which corresponds to 2% of the tungsten world resources (7 Mt) indicated by the USGS database.

4.2.2. Depletion Rates

The variation of depletion rates over time can be evaluated considering the historical production of tungsten in Portugal and worldwide, and the range of U R R ( t ) imposed by current estimates for the country and global reserves and resources (Figure 3; see also Table S2 of Supplementary Materials).
Making use of minimum U R R ( t ) values, i.e., the known reserves, the highest (>2%) d U R R , t rates were achieved in Portugal during 1940–1943 and 1951–1953, besides the year of 1957 (Figure 3a). With the exception of these periods, d U R R , t remained around 1.2–1.3% from 1938 to 1990, despite some occasional fluctuations, and from 1991 onwards, d U R R , t values dropped to 0.5–0.7%. This general tendency for d U R R , t decreasing with time in Portugal does not follow the consistent rising trend of depletion rates of world reserves from ≈0.3% in 1938 to ≈1.2% in 2020 (Figure 3a). As expected, similar conclusions can be drawn for the record of depletion rates referred to maximum U R R ( t ) values, i.e., the known resources, only lowering the absolute d U R R , t values in each year (Figure 3a).
The scenario changes significantly when the difference U R R ( t ) Q(t) is used to assess the variation of depletion rates over time (Figure 3b). Taking into account the Portuguese tungsten reserves, d R R R , t values ranged from 2 to 4% during 1940–1944, 1951–1957, 1960–1961, and 1968–1983, exceeded 4% in the course of 1984–1990, 1995–1998, and 2000–2004 periods, and went above 5% from 2005 onwards. This progression, suitably described by a 5th-order polynomial function (Figure 3b), reflects a marked depletion of Portuguese reserves over time, which has accelerated in the last 15 years in consequence of intense mining confined to the Panasqueira deposit. The evolution registered for the annual depletion rates of world tungsten reserves is not so fast (Figure 3b), consistently exceeding 1% only after 2000. However, in the last 19 years, the depletion rate of the remaining tungsten global reserves has increased significantly, reaching 2% in 2012 and 2.7% in 2020.
When the remaining global recoverable resources of tungsten are taken as reference, the d R R R , t values are necessarily lower but the trend of gradual increase in depletion rates (exceeding 1% in 2011) is not modified. On the contrary, the figures for Portugal show a clear decline since 1986, from ≈1 to 0.4% in 2020, with a mean value of ≈0.5% throughout these 34 years. This record, being consistent with the slowdown and subsequent ceasing of tungsten mining in many Portuguese deposits during the eighties, suggests that the remaining resources could be the target of future exploration and exploitation endeavors.

4.2.3. Modelling the Long-Term Primary Tungsten Production

Fundamental results of the performed modelling are summarized in Table 3. The complete datasets, also supporting the cross-plots provided in this subsection, are listed in Tables S3 and S4 of Supplementary Materials. Additional cross-plots, using the annual tungsten production, q ( t ) , rather than cumulative production, Q ( t ) , are in Figure S1 of Supplementary Materials.
Curve-fitting models for tungsten production in Portugal are shown in Figure 4b. Using the known reserves as the lower U R R ( t )   threshold, the peak year estimated with GVM and RM are comparable, differing in just 4 years. The time expected for the depletion of one-half of these reserves is also similar in both models (1962 in GVM and 1961 in RM). When the upper U R R ( t )   threshold is used as reference, i.e., total resources, the GVM-, and RM-projected peak years differ significantly, although displaying analogous maximum productions. The peak year indicated by the GVM curve-fitting precedes in 14 years the time at which one-half of the Portuguese tungsten resources should have been exploited (1972), which is attained 12 years earlier than predicted by the RM approach. The goodness-of-fit to historical data is higher in the GVM-derived solution, but indications provided by RM are not necessarily unreasonable, as discussed in Section 5.1.
According to GVM curve-fitting results, maximum (≈4.4%) depletion rates of the remaining recoverable reserves in Portugal were reached during the early nineties, quickly declining afterwards (Figure 4c). The RM curve-fitting results also placed depletion rates around 4.4% in the same time-span, but d R R R , t growth continues until the limiting level of 5.0–5.1% is reached from 2017 onwards (Figure 4d). Depletion rates of the remaining recoverable resources in Portugal progressed at a substantially lower range of values, as expected. For the GVM curve, d R R R , t peaked at ≈0.9% in 1964–1965, gently falling in the subsequent years (Figure 4c). The logistic progression inherent to the RM approach predicts a smooth increase of d R R R , t over time, attaining 0.9% in 1965 and advancing until values above ≈1.5% from 2009 onwards, although never exceeding 2%.
For the global production of tungsten (Figure 5a,b), GVM and RM approaches yield similar estimates in peak year, only differing 6–7 years. The peak years forecasted with GVM (2020 and 2029) occur 3 years after the time at which the world reserves should be half depleted, but precedes in 10 years the expected consumption of half of the known global resources. The peak years estimated with RM (2014 and 2036) coincide with the projected time for the reduction to one-half of the world reserves and resources so far recognized.
In agreement with GVM curve-fitting results, maximum depletion rates of the remaining world tungsten reserves (≈3.7%) should be reached by 2075, but only 23 years (from 2018 to 2041) will be needed to accelerate the progression of d R R R , t from ≈2 to ≈3% (Figure 5c). If RM-derived results are considered, the d R R R , t plateau of ≈3.7% will be achieved from 2087 onwards, exceeding for the first time ≈2 and ≈3% by 2015 and 2043, respectively (Figure 5d). Possible future scenarios could be “less stressful” if the remaining known tungsten resources are considered in modelling. In fact, when the evolution of tungsten global production over time is constrained by the maximum U R R ( t ) value, the GVM-estimated production generates d R R R , t rates that never exceed 2%, coming close to ≈1.9% only by 2100 (Figure 5c). For the same starting conditions, the RM curve-fitting results yield depletion rates that attain 2% by 2046, further increasing up to ≈3% until 2089 before reaching the plateau level (≈3.2%) several decades after 2100.

4.3. Tungsten Resources of Public Importance in Portugal

The methodological procedure introduced in Section 3.2 was applied to 385 specific tracts listed in SIORMINP, which include the 284 tungsten occurrences/deposits, plus 101 more where tungsten stands as an important, although not the prevalent, metal (Figure 6a). This allowed scoring each specific tract with a M R o P I r value. However, for land-use planning objectives, the scattering of data points in a map is insufficient, being necessary to delimit areas. To this end, simple kriging interpolation was used, considering the vertices and centroids of polygons hosting the main tungsten exploration targets in the country besides the 385 specific tracts (Figure 6b). These polygons represent areas recently (2007–2016) granted by DGEG for tungsten exploration and exploitation in Portugal, after selecting solely those whose centroid was positioned within a maximum distance of ca. 1000 m from a mineral deposit/occurrence. When in the presence of superimposed and geometrically (dis)similar prospects assigned to one or more companies during 2007–2016, the smallest polygon was preferably chosen.

4.3.1. The Level of Geological Knowledge ( L G K )

According to the methodology used [48], the public importance of mineral resources and their safeguarding rely on geological attributes. Therefore, criteria supporting the L G K appraisal will determine the M R o P I r value. The subsequent assessment of economic, environmental, and social dimensions will contribute with added-value features to specific tracts having M R o P I r 4 , and should be based on results of up-to-date studies.
The background geological data ( G 1 ) for the region where tungsten deposits/occurrences were recognized is suitably detailed and of good quality. The existing/documented results on regional mineral exploration ( G 2 ) are satisfactory (covering several areas with a reasonable sampling density for soil and stream sediments geochemistry, locally complemented with whole-rock geochemical data), although needing some improvements besides surveys aiming at the search of concealed deposits. Information regarding old and current tungsten mining activity ( G 3 ) in the country is also available in many technical reports that can be consulted in DGEG, fulfilling the requirements of the selected approach. Thus, for all the 385 specific tracts, the values 1.00, 0.75, and 1.00 were set for criteria G 1 , G 2 , and G 3 , respectively. The basis of G 4 scoring was the resource category as reported in the official catalogue SIORMINP, which follows the United Nations Framework Classification for Reserves and Resources (version 1997), also covering mineral occurrences (Table 4). As a result, three specific tracts host deposits with assessed reserves, 32 specific tracts host deposits with estimated resources, and 350 specific tracts represent prospects with promising exploration results or sites where some kind of exploitation was completed in the past. The lowest category (“Mineral”) was further divided into different classes (0.15, 0.25, and 0.35) by adding or subtracting 0.10 in function of bonus or penalty sub-criteria, respectively (Table 4). The objective was to weigh the existing information about these particular tracts gathered through exploration and/or exploitation works carried out in the past.
The application of L G K criteria allowed scoring 104 specific tracts with M R o P I r 4 , i.e., 27% of the 385 entries listed in SIORMINP (Figure 7). These tracts include 69 prospects with promising mineral exploration results in addition to the tungsten deposits with assessed reserves (3) or estimated resources (32). A large part of these tracts coincide, as expected, with those classified as “high potential” in some most recent appraisals, e.g., [17,57]. The M R o P I r values obtained for the tungsten resources listed in Table 2 range from 4.68 to 5.09 (for a possible maximum of 5.5.), the lower scores depicting examples from Serra d’Arga with the exception of Covas.

4.3.2. Economic ( E c ), Environmental ( E v ), and Social Development/Acceptance ( S D A ) Dimensions

Of the 104 specific tracts with M R o P I r 4 , Panasqueira is the only one that can be objectively assessed in terms of E c , E v , and S D A dimensions because it is the sole tungsten mine active in the country since the early nineties, which also has been subjected to recent studies providing factual data for the criteria listed in Table 1.
The Panasqueira is a well-known world-class tungsten deposit recording a long-lasting exploitation activity and far from being exhausted [58,59] and references therein. Considering the natural attributes of this tract and the relevance of mining production in Panasqueira to the global tungsten supply chain, criteria E c 1 and E c 2 were scored with 1.00, regardless of some concerns raised in [60]. As there is no domestic cluster for specific added-value beneficiation of tungsten mineral concentrates, nor any smelter, the minimum score (0.25) was ascribed to E c 3 . All the produced tungsten mineral concentrates are exported to countries out of Europe, having as prime destiny the USA, not really contributing to the European market, but impacting on the Portuguese exports trade, therefore justifying the scores of 0.25 and of 1.00 assigned to E c 4   and E c 5 , respectively.
The E v dimension was evaluated according to results of the “Environmental Impact Assessment” released by the Portuguese Environment Agency (APA) and the information reported in [60]. Regarding E v 1 , Panasqueira scores 0.75, fulfilling all the requirements imposed by the mandatory environmental licence. The 0.50 score credited to E v 2 reflects the long mining history at Panasqueira and the very significant impact inheritance, although being minimised through a series of recent and well-succeeded rehabilitation programs. No attempts were made to quantify E v 3 given the inexistence of reliable data to do so. A score of 0.50 was ascribed to E v 4 since active measures to minimise impacts related to ores exploitation and subsequent production of mineral concentrates exist and are monitored, resulting in moderate levels of natural flows disturbance. Impacts associated with the old mining inheritance require an expensive maintenance and long-lasting systematic monitoring, justifying the 0.50 score attributed to E v 5 . As Panasqueira is an underground mine with large-scale processing facilities, E v 6 was settled at 0.50. The E v 7 was also scored at 0.50, reflecting the production of significant amounts of wastes/residues correctly accumulated and buffered.
The S D A assessment was based on results reported in [61], addressing the social perception of risk in two Portuguese mining communities (Panasqueira and Aljustrel). A score of 0.50 was ascribed to S D A 1 , denoting a “sceptic to apprehensive social acceptance in relation to mining operations” performed at Panasqueira. The S D A 2 scores 1.00, since the compatibility with other land uses is strong, according to the information in recently updated Municipal Land-Use Plans. The considerable impact in population settlement and growth and in jobs creation, despite the less favorable perception of population [43], support the 0.75 score assigned to S D A 3 and S D A 4 criteria. The industrial activity directly and indirectly related to the Panasqueira Mine has also significant impacts in wealth improvement, as factually documented by the official institute “Statistics Portugal” (https://eportugal.gov.pt/entidades/instituto-nacional-de-estatistica, last accessed on 3 February 2021), thus supporting an S D A 5 of 0.75.
Assembling the scores gathered for criteria behind L G K , E c , E v , and S D A dimensions, a final M R o P I r of 8.07 (in 10.00) results for the Panasqueira tract when Equation (5) in Section 3.2 is applied.

4.3.3. Mapping the Tungsten Resources of Public Importance in Portugal

The use of vertices and centroids of polygons hosting the main tungsten exploration targets in the country increased the spatial point-density and improved the interpolation outputs. The M R o P I r value ascribed to vertices and centroids was done separately, in both cases considering the L G K appraisal results previously obtained for the 385 specific tracts. Based on the combination of two spatial union operations, the M R o P I r value of the nearest neighboring specific tract was compiled for each vertex and centroid, together with some numerical attributes (higher, lower, and average values) of the group formed by the “cloud” of closest points. This procedure led to a total of 1360 data points, including the original 385 specific tracts. Table 5 summarizes the allocation of M R o P I r values assigned to vertices and centroids of polygons considering the nearest neighboring specific tract with M R o P I r 4 , as well as the higher and lower M R o P I r   value obtained for the “cloud” of closest points. The resultant “ M R o P I r (higher)” distribution for the whole set of specific tracts and polygon vertices/centroids is slightly better dispersed around the M R o P I r average values than those yielded by “ M R o P I r (lower)” and “ M R o P I r (nearest)” distributions, and so the former distribution was selected for the subsequent interpolation.
Despite the spatial point-density enhancement provided by the vertices and centroids of polygons, the low variability of M R o P I r persisted. Even so, an acceptable mean square relative error was obtained for simple kriging interpolation of “ M R o P I r (higher)” data modelled with anisotropy (Figure 8a), thus considering the prevalent direction of regional geological structures. The mapped areas are plausible and fully consistent with the current knowledge about tungsten resources in Portugal, often coming along with tin and some other metals of economic interest (Figure 8b). Safeguarding the access to all these resources does not implicate more than ≈6% of the Portugal mainland territory.

5. Discussion

Curve-fitting models can provide important indications about long-term trends of mining production. However, as discussed in several studies, e.g., [38,39,40,41,42,43,44,45,
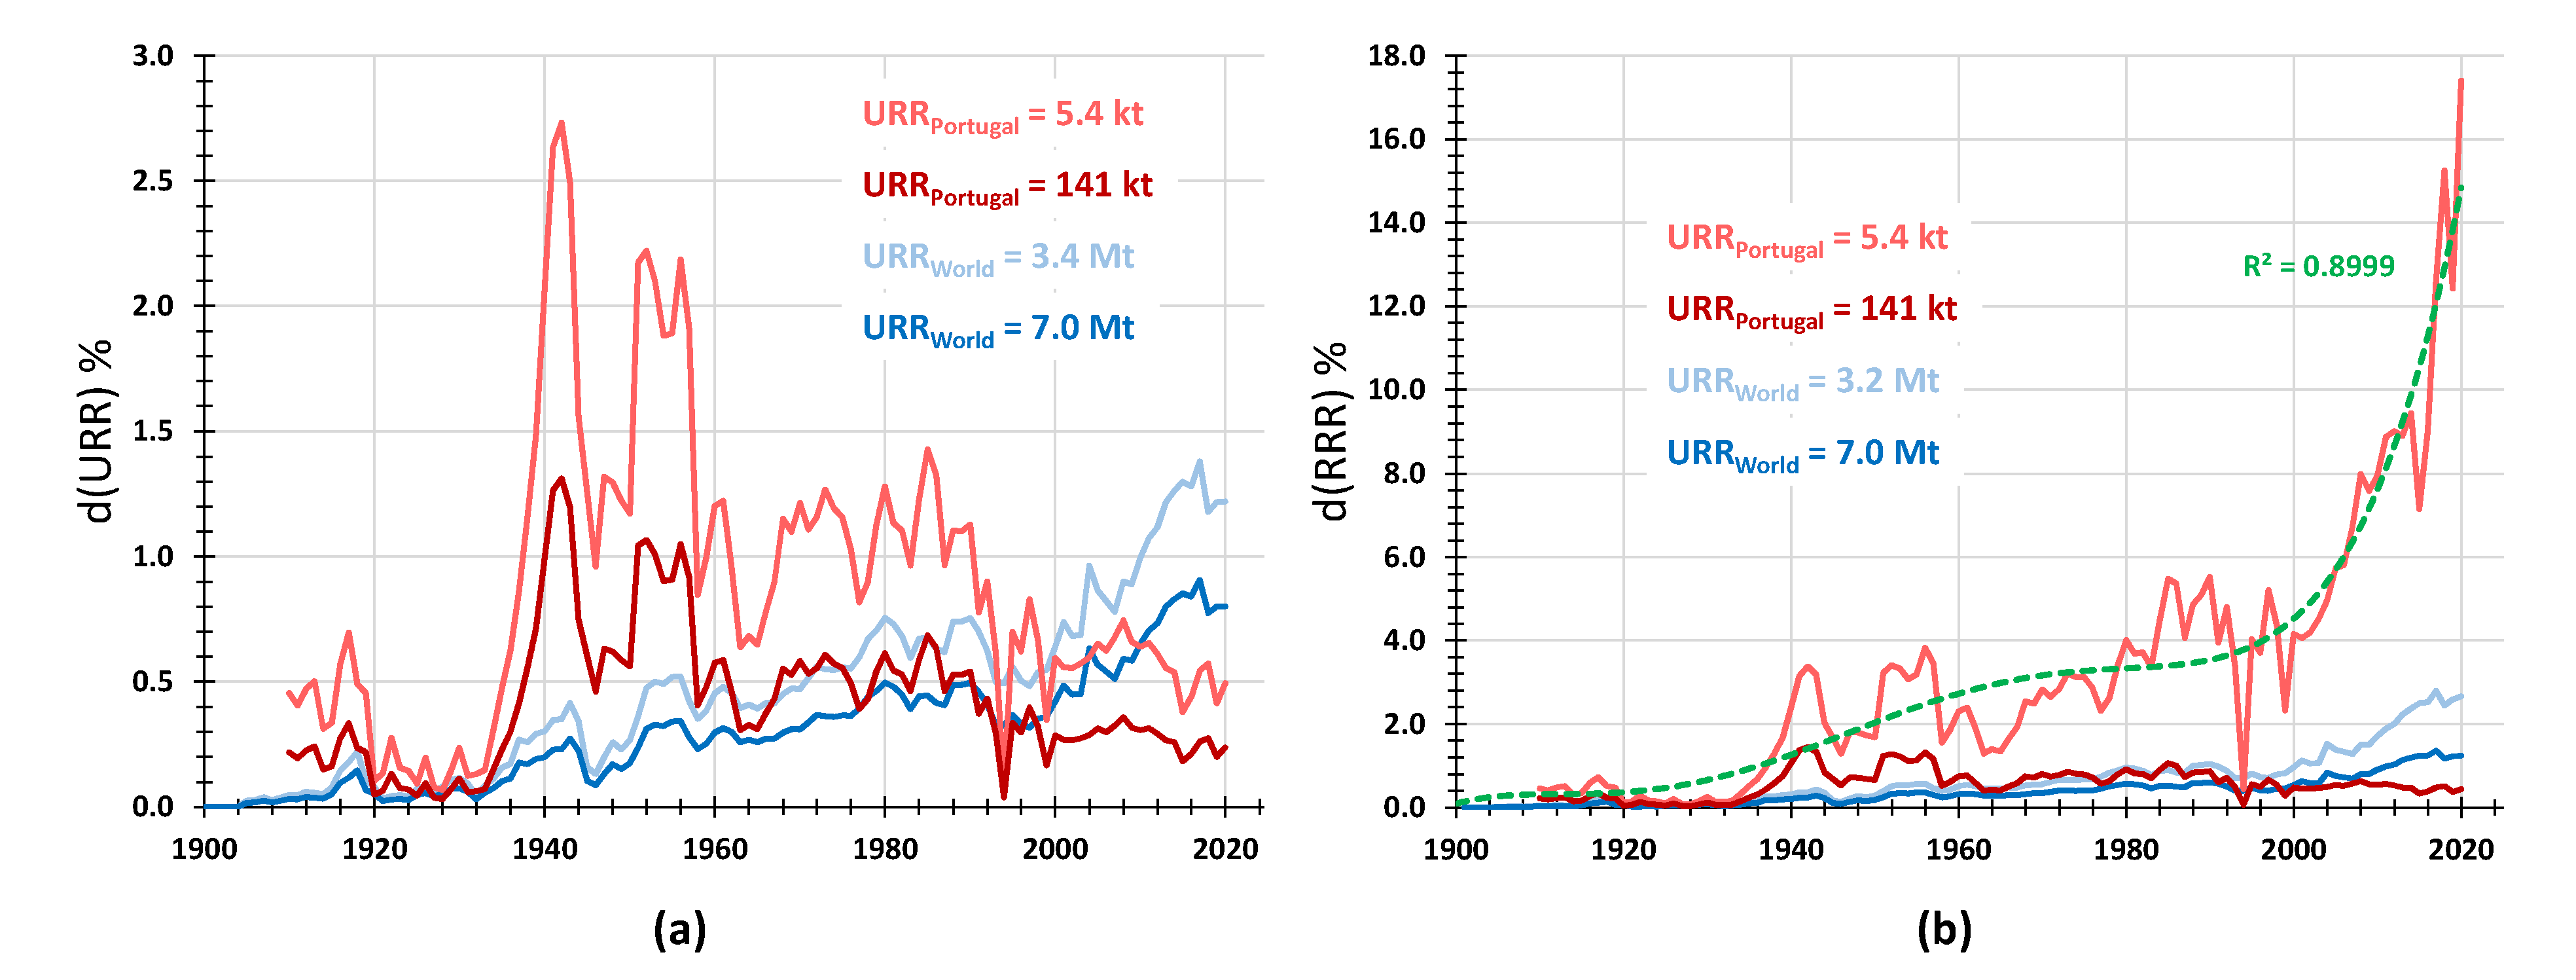
46], modelling results should be cautiously interpreted since a high goodness-of-fit in relation to historical data only means that the forecasted future tendency is plausible without offering any guarantee that the estimated outcomes will be achieved. For this study, we used the global tungsten reserves (3.4 Mt) and resources (7.0 Mt) indicated by USGS as best current U R R ( t ) estimates. The former figure is a reasonable reference to constrain the models of short- to medium-term world production, while the latter quantity is an acceptable boundary to confine models of long-term world production. However, in addition to the uncertainties related to the calculation of global reserves and resources, it should be noted that these estimates could vary significantly in narrow time-windows. In fact, improvements in geological knowledge provided by ongoing mineral exploration surveys may expand the reference value for global resources, but the access to resources could be restrained by political decisions, legal issues, environmental policies or even social disputes. Technological developments may increase total reserves, lessening the production costs of active operations or assisting the exploitation of new ore types. On the contrary, tonnage and ore-grades decreasing usually imply higher recovery costs, thus lowering reserves. Variations in international trading prices or in market demands also affect reserve estimates. For a general assessment to the issue applied to new tungsten mining projects, see [62].
Notwithstanding all the uncertainties affecting U R R ( t ) estimates, the performed modelling suggests that one-half of the world tungsten reserves have been already consumed and that depletion rates are accelerating from 2014–2017 onwards, reaching values above ≈3% after 2041–2043. The modelled maximum productions in 2014 and 2020 (considering the lower threshold of URR ( t ) ) are ca. 15 to 19 kt below the factual data recorded in those years (87 and 84 kt, respectively). These differences represent 22 and 18% of the tungsten produced in 2014 and 2020, respectively, and could reflect either circumstantial variations in primary production of mineral concentrates or contributions from existing mineral stockpiles. The general trend indicated by this forecast concurs with projections made for the Chinese reserves (representing ≈58% of the global amount), which could be exhausted within 30 years if the present demand continues [13].
The consumption of one-half of global tungsten resources is projected for 2036–2039 and depletion rates tend to remain low to moderate (<2%) over time. The modelled maximum productions in 2029 and 2036 (considering the upper U R R ( t ) threshold) are ca. 8 and 6 kt below and above, respectively, the mean value of global tungsten production during the 2011–2020 period (84.3 kt). Such differences in modelled and factual figures imply a gradual declining of primary production throughout the next two decades. If so, an increasingly higher consumption of existing tungsten mineral stockpiles and/or APT stocks should be expected, assuming that market demands will be subjected to a conservative growth and the share of tungsten provided by recycling will not exceed significantly the current global average value of 30%.
In short, the strong consistency of GVM and RM curve-fitting forecasts suggests that global tungsten primary production should be subjected to significant pressure in the forthcoming years, possibly determining changes in the supply chain until 2040–2050. This pressure can be relieved if mining and mineral processing procedures are technologically improved, increasing their efficiency and allowing the exploitation of lower-grade ores, and if exploration activities succeed with new discoveries, expanding the known tungsten resources.

5.1. Primary Tungsten Production Improvements in Portugal

The historical record of tungsten production in Portugal shows strong fluctuations in several time-windows. These fluctuations do not impede a general appraisal of the evolving trend over time but create additional difficulties when the best fitting to GVM and RM curves is searched. Accordingly, the goodness-of-fit decrease and, in some cases, different admissible solutions can be found. The most satisfactory curve-fitting results were reported in Section 4.2.3 and it should be noted that the highest inaccuracies were documented for the logistic approach (RM) when constrained by the maximum U R R ( t ) value.
Another source of uncertainty is related to the U R R ( t ) estimates used in modelling. Current review of the Portuguese tungsten reserves indicate 5.4 kt of contained tungsten in wolframite-dominant mineral concentrates. This figure is higher than the one indicated by the USGS database, which only considers the amount of reserves reported for the active Panasqueira Mine. Furthermore, the 5.4 kt could be viewed as a cautious estimate for tungsten reserves in Portugal, not comprising yet the data provided by the ongoing reassessments of the Borralha and Vale das Gatas deposits. The upper U R R ( t ) limit is also imprecise due to the lack of data regarding a large set of small tungsten deposits and was tentatively placed at 141 kt.
The curve-fitting models constrained by minimum U R R ( t ) suggest that one-half of the known tungsten reserves in Portugal were exploited until 1961–1962, being afterwards subjected to an increasingly higher rate of depletion. The maximum productions indicated by GVM and RM approaches for 1961 (1.7 kt) and 1965 (1.9 kt), respectively, are ≈30 to 40% above the mean value of historical data from 1961 to 1965, but this divergence is merely the result of a numerical time-integrated adjustment of tungsten production, which was atypically high during the 1951–1960 period (2.2 kt/year, on average). From the beginning of the nineties to the present, there is an evident decline of tungsten reserves in Portugal. However, this reflects mostly the suspension of mining activities in several deposits along with the lack of international market conditions to support continuous investments in mineral exploration.
According to results yielded by the GVM curve-fitting, the consumption of one-half of the Portuguese tungsten resources should have occurred in 1968, 10 years after production reached its maximum value (1.8 kt). The latter figure exceeds in ≈39% of the documented amount of tungsten produced in 1958 (≈1.1 kt), although it weighs reasonably the higher productions attained during 1951–1957 (≈2.6 kt, on average) and the subsequent recovery in 1959–1961 (≈1.4 kt, on average). Notwithstanding these indications, depletion rates of the remaining resources over time remain continuously below 1%, keeping open positive perspectives on future improvements of tungsten production in Portugal. A similar conclusion could be obtained from results of the RM curve-fitting, despite differences in the projected production peak year (1984) and the previewed timing for depletion of half of the tungsten resources (1980). In fact, results from GVM and RM curve-fittings constrained by maximum U R R ( t ) start to diverge from 1984 onwards, i.e., when the growing trend of tungsten production in Portugal was strongly disturbed by technological factors and, above all, by adverse international market conditions. Therefore, the evolution presented by the RM curve after the mid-late eighties can be interpreted as what could have been produced in Portugal if the gradual closure of many tungsten mines in the country did not happen. Nonetheless, it is clear that the forecast based on the RM curve-fitting is speculative, and so the projected tungsten production towards the future should be taken merely as a hypothetical upper limit.
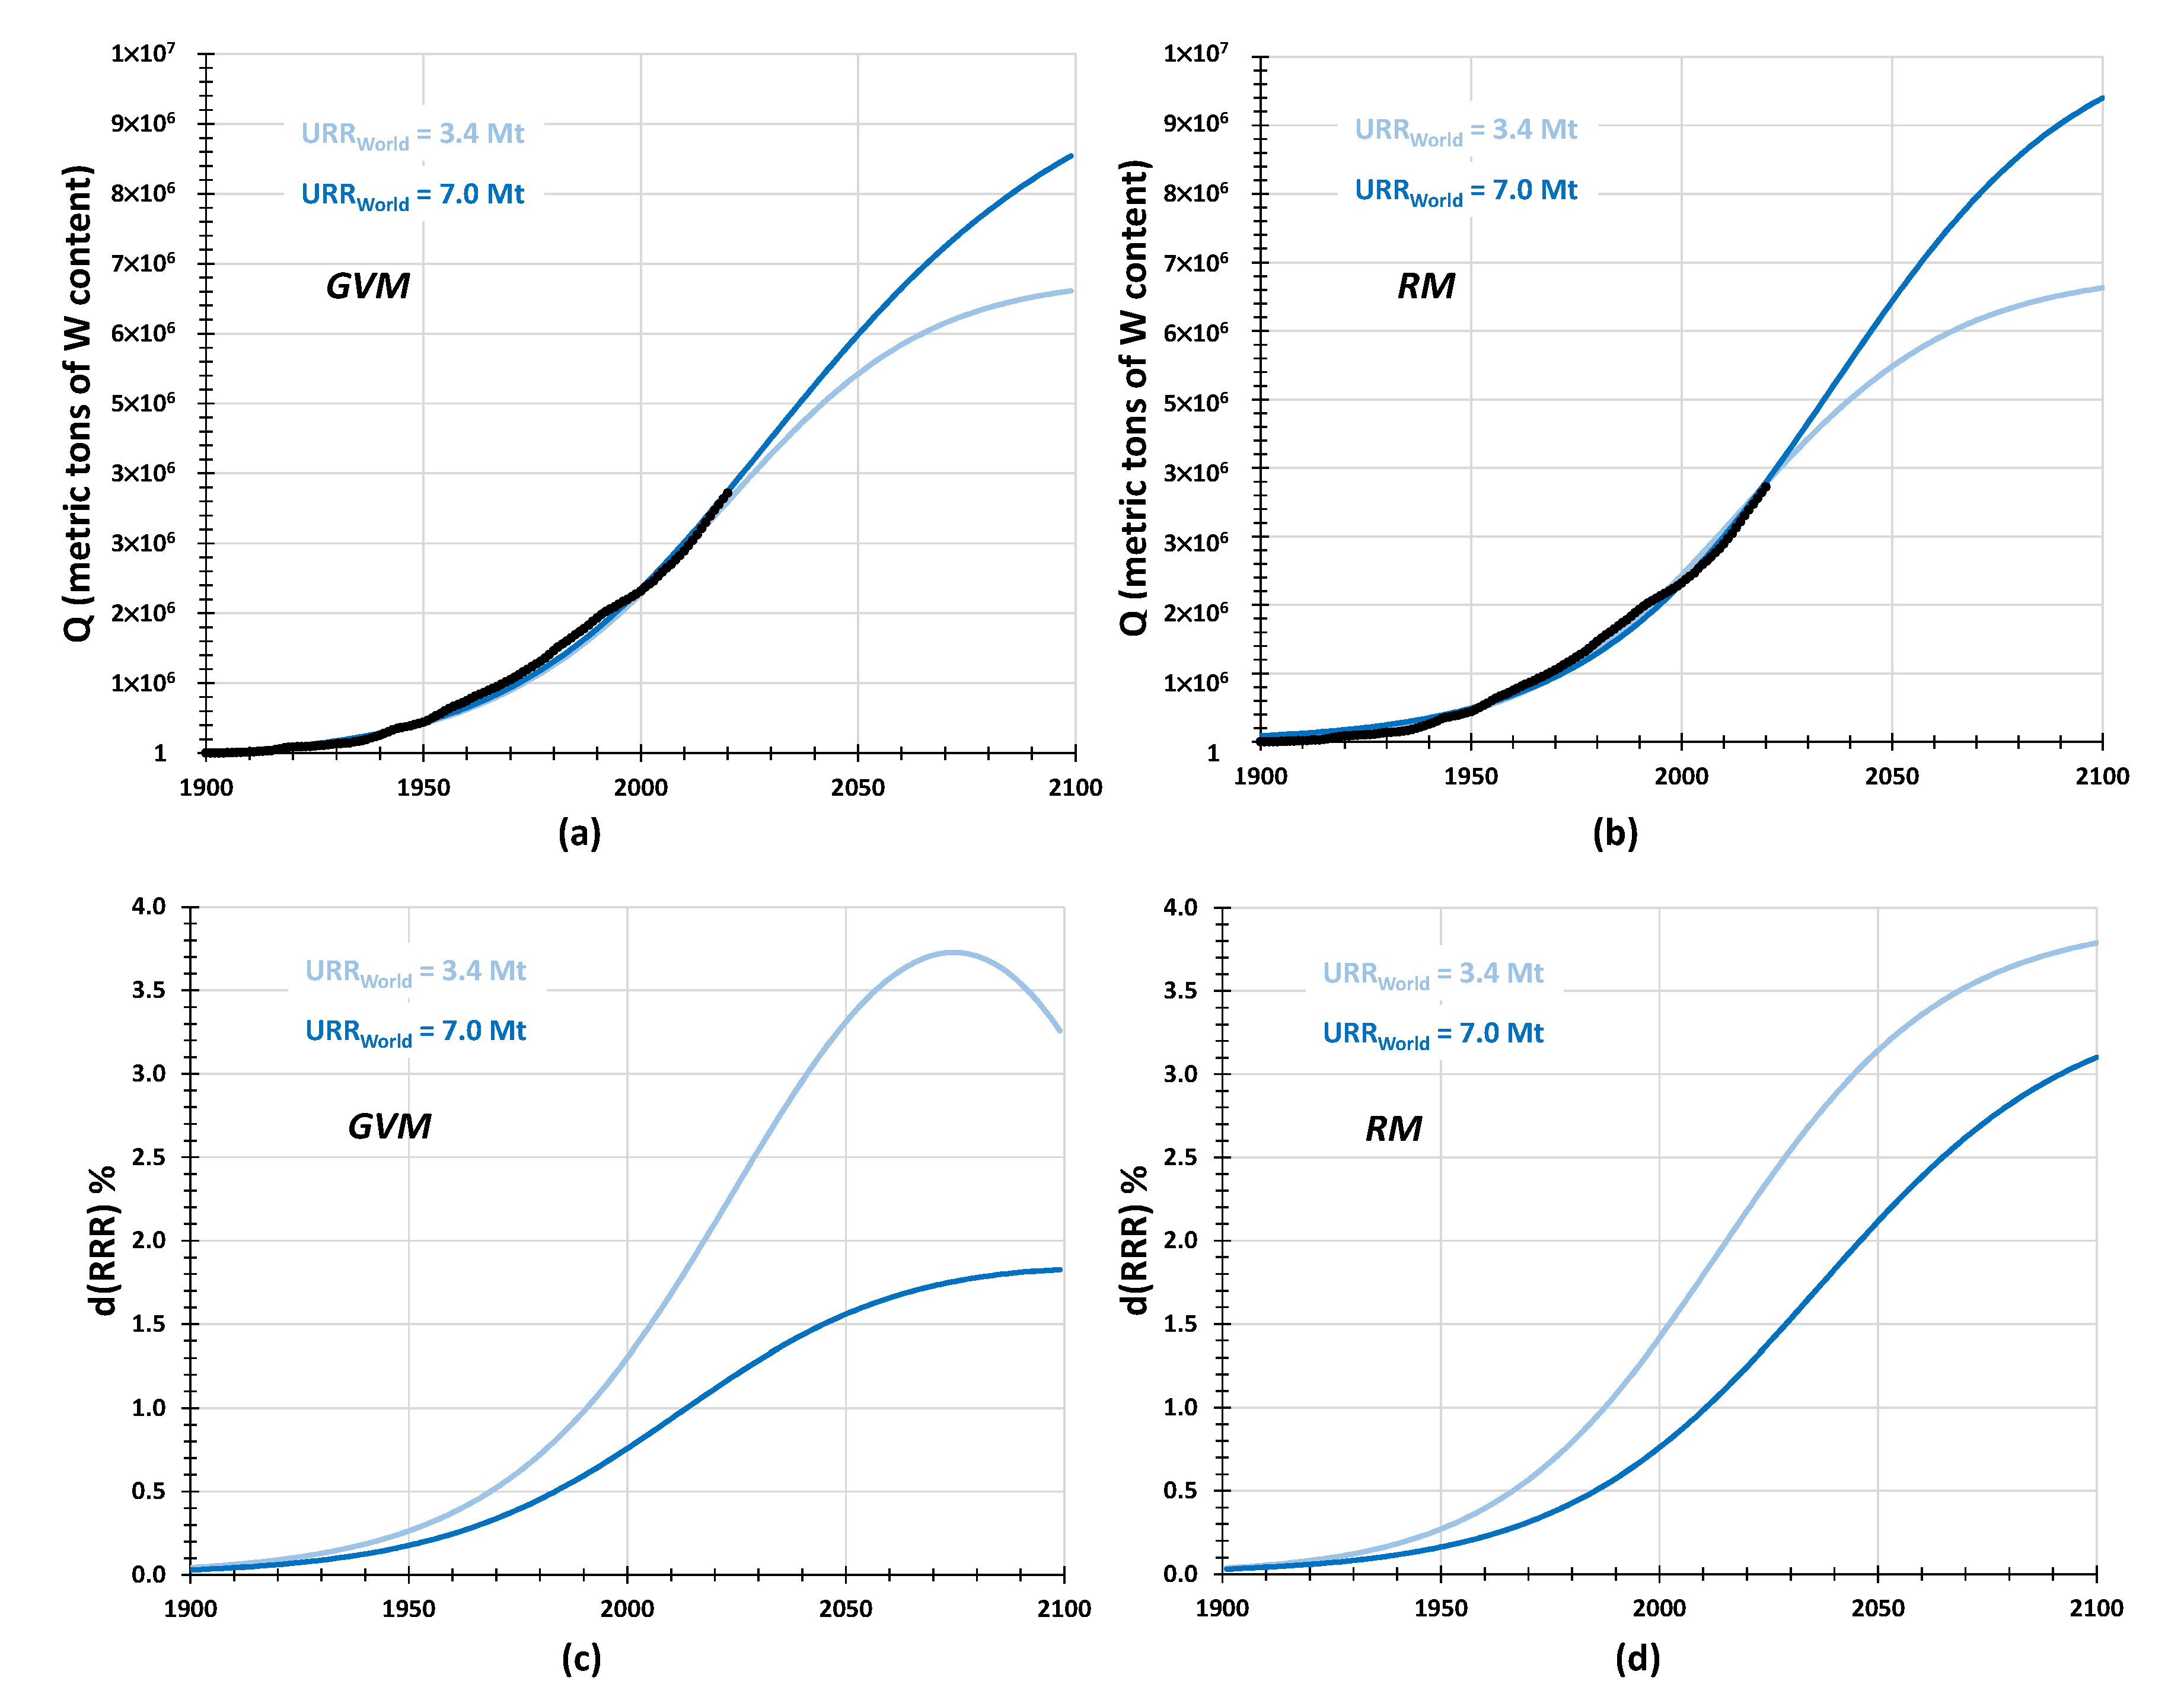
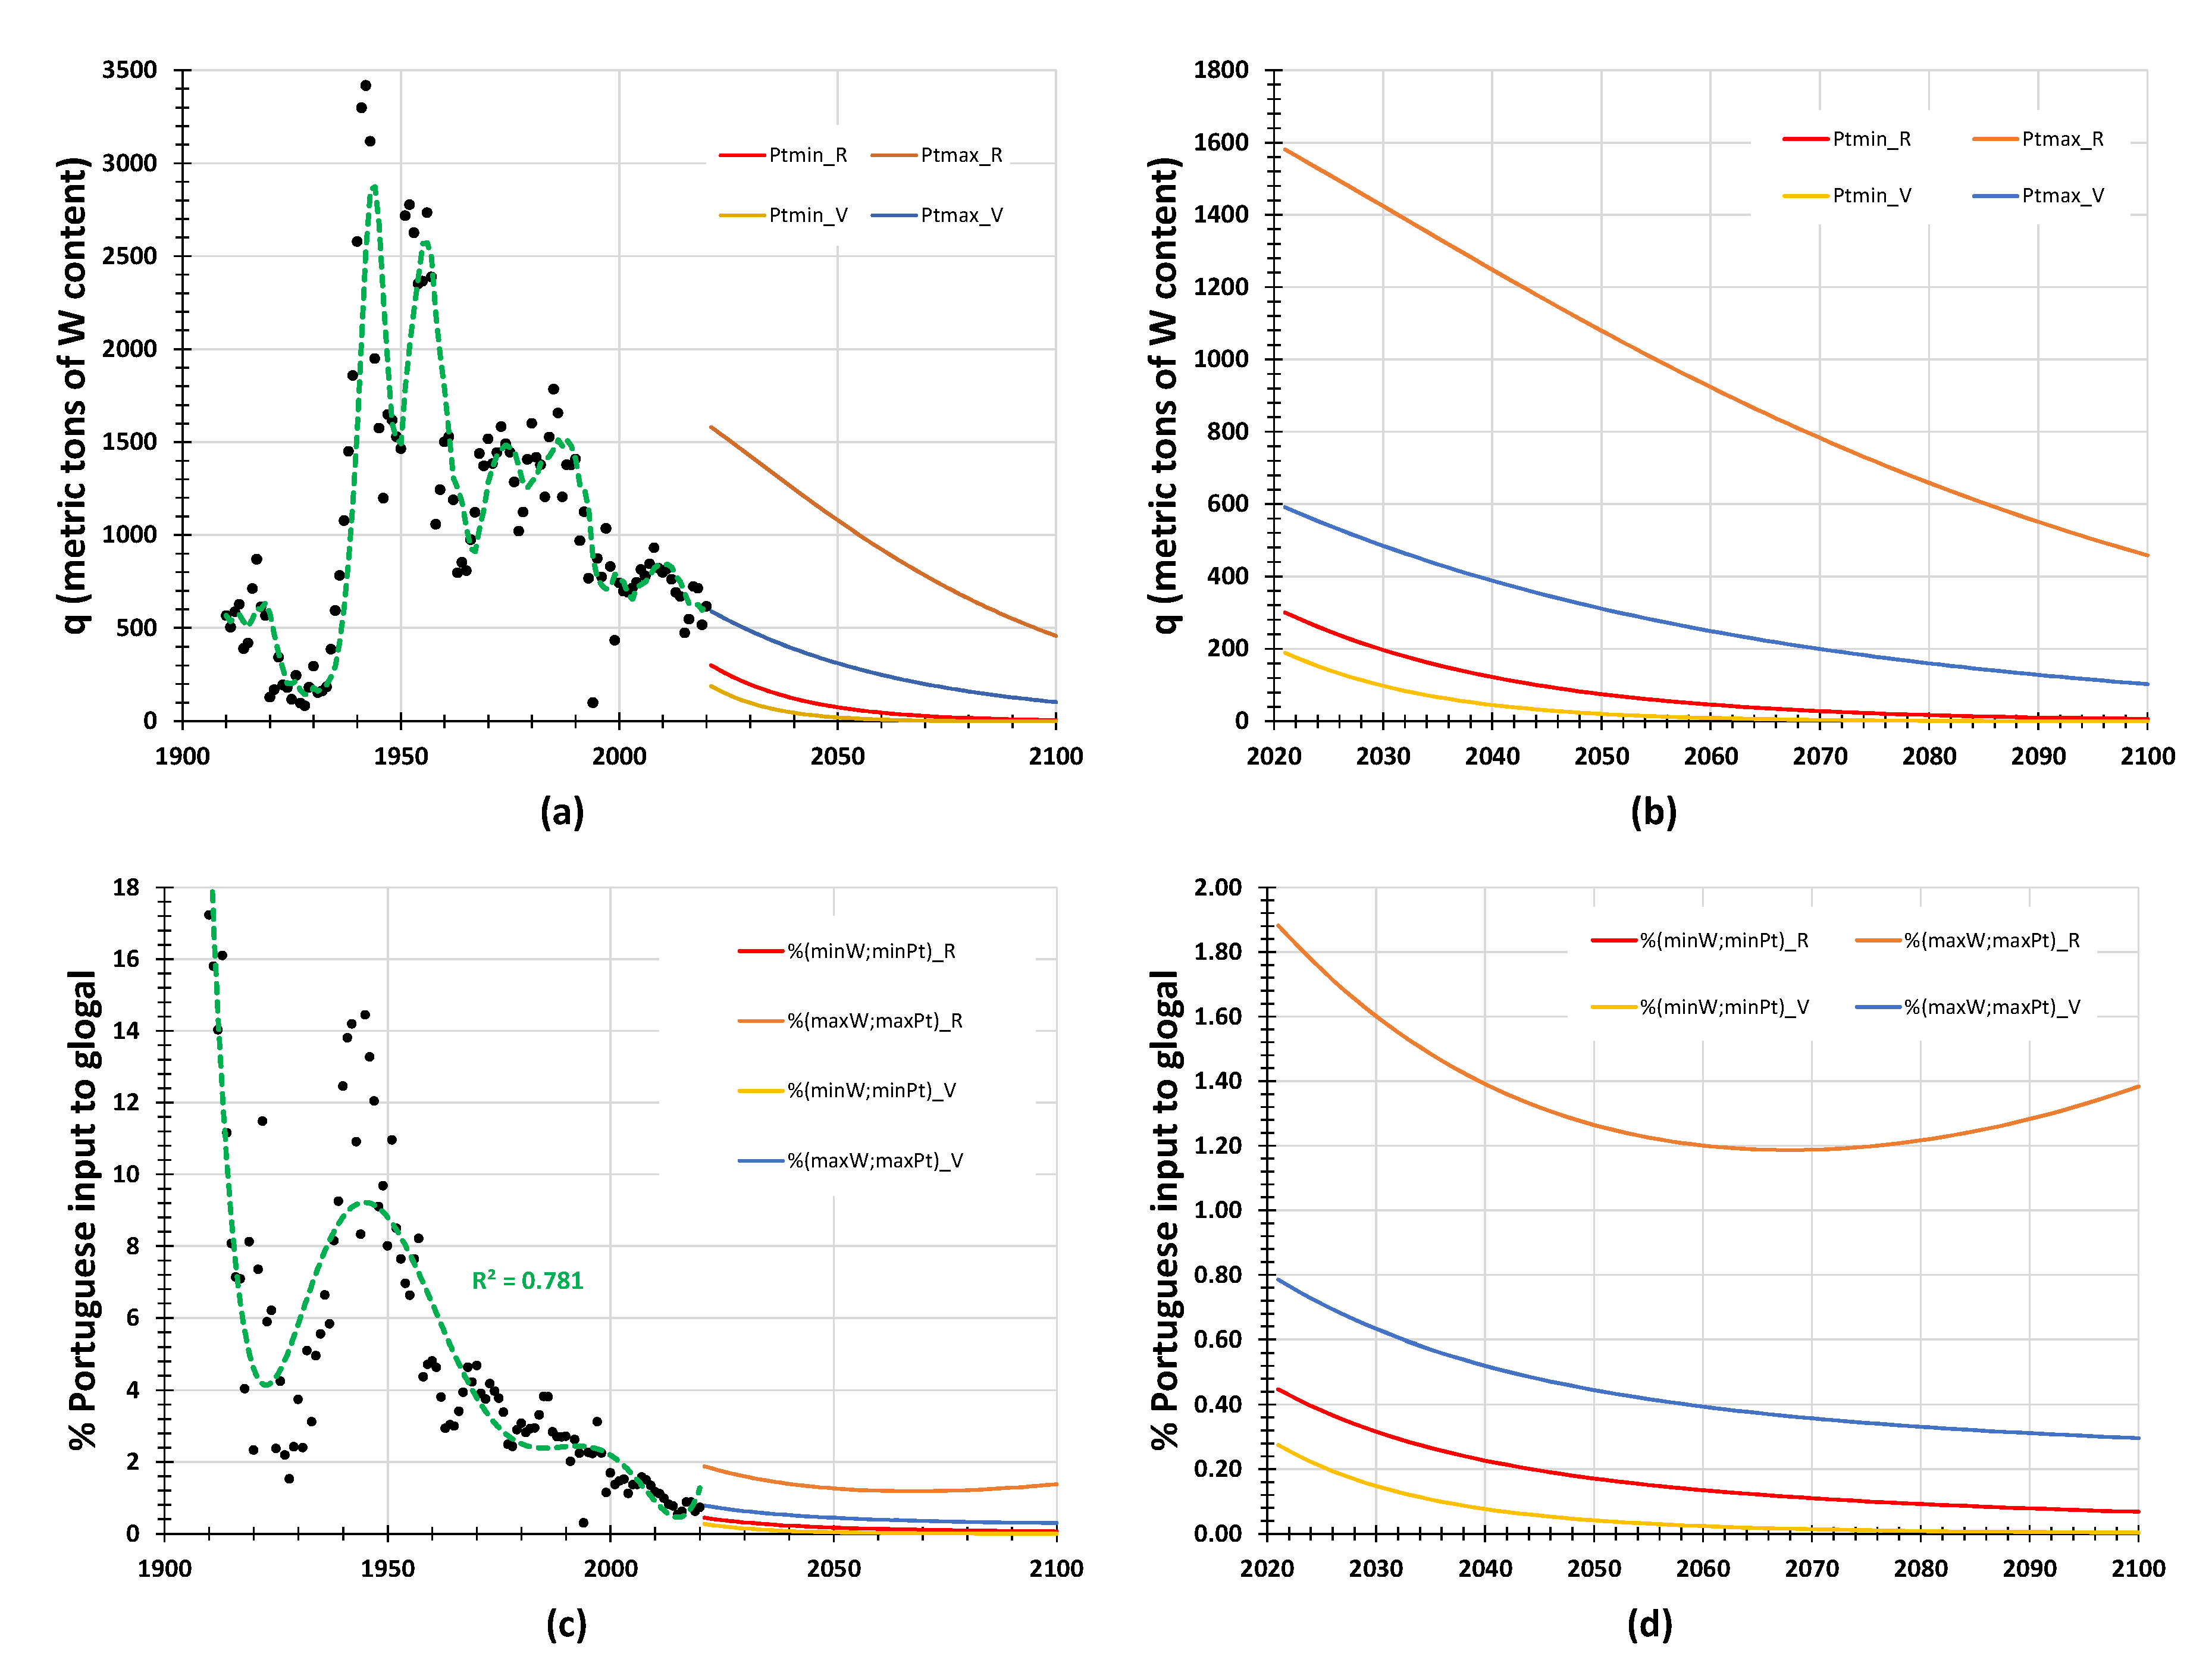
The cross-plots in Figure 9 document the progression of tungsten production in Portugal from 2021 to 2100, making use of the modelling results. When models are constrained by the known reserves (minimum U R R ( t ) ), the forecasted cumulative production for the period 2021–2100 will range between 2.5 kt (GVM) and 6.3 kt (RM), representing ≈0.1 and 0.2% of the projected world production for the same time-window, also limited by the lower U R R ( t ) threshold. Realistically, this means that the Portuguese input to the global primary tungsten supply chain will be irrelevant in 10 to 20 years. In other words, recoverable reserves will be exhausted soon, and no other mines will be active in Portugal besides Panasqueira, eventually supplemented by short-run exploitation at Borralha and Vale das Gatas. The time-span could be expanded for a few more years, if reserves in these three deposits increase in a near future. However, in this scenario, the relative weight of Portuguese production in the international market will always be limited. On the contrary, when models are constrained by the known resources (maximum U R R ( t ) ), the relevance of Portuguese input to the global tungsten supply chain will tend to last for some more decades. The relative weight of this contribution may follow a conservative trajectory (close to that predicted by GVM modelling) or a growing path (approaching that indicated by RM modelling). In such scenario, the estimated cumulative production in Portugal for the period 2021–2100 will range between 22.4 kt (GVM) and 76.3 kt (RM), accounting for ≈0.5 and ≈1.4% of the predictable world production for the same time range, also limited by the upper U R R ( t ) threshold.
Future trends of tungsten production in Portugal, as in other non-Chinese countries, will depend on the renewing of old mines and/or the opening of new mining centers. In addition, several technological improvements, e.g., [4,63] should be introduced to minimize “tungsten losses” in mining operations and ores beneficiation, typically ranging from 10 to 40%. The success of these future ventures implies also renewed investment commitments with mineral exploration, as well as technological upgrading in order to ensure the development of modern mining centers operating sustainably, e.g., [47] and references therein.

5.2. Safeguarding the Current and Future Access to Tungsten Resources in Portugal

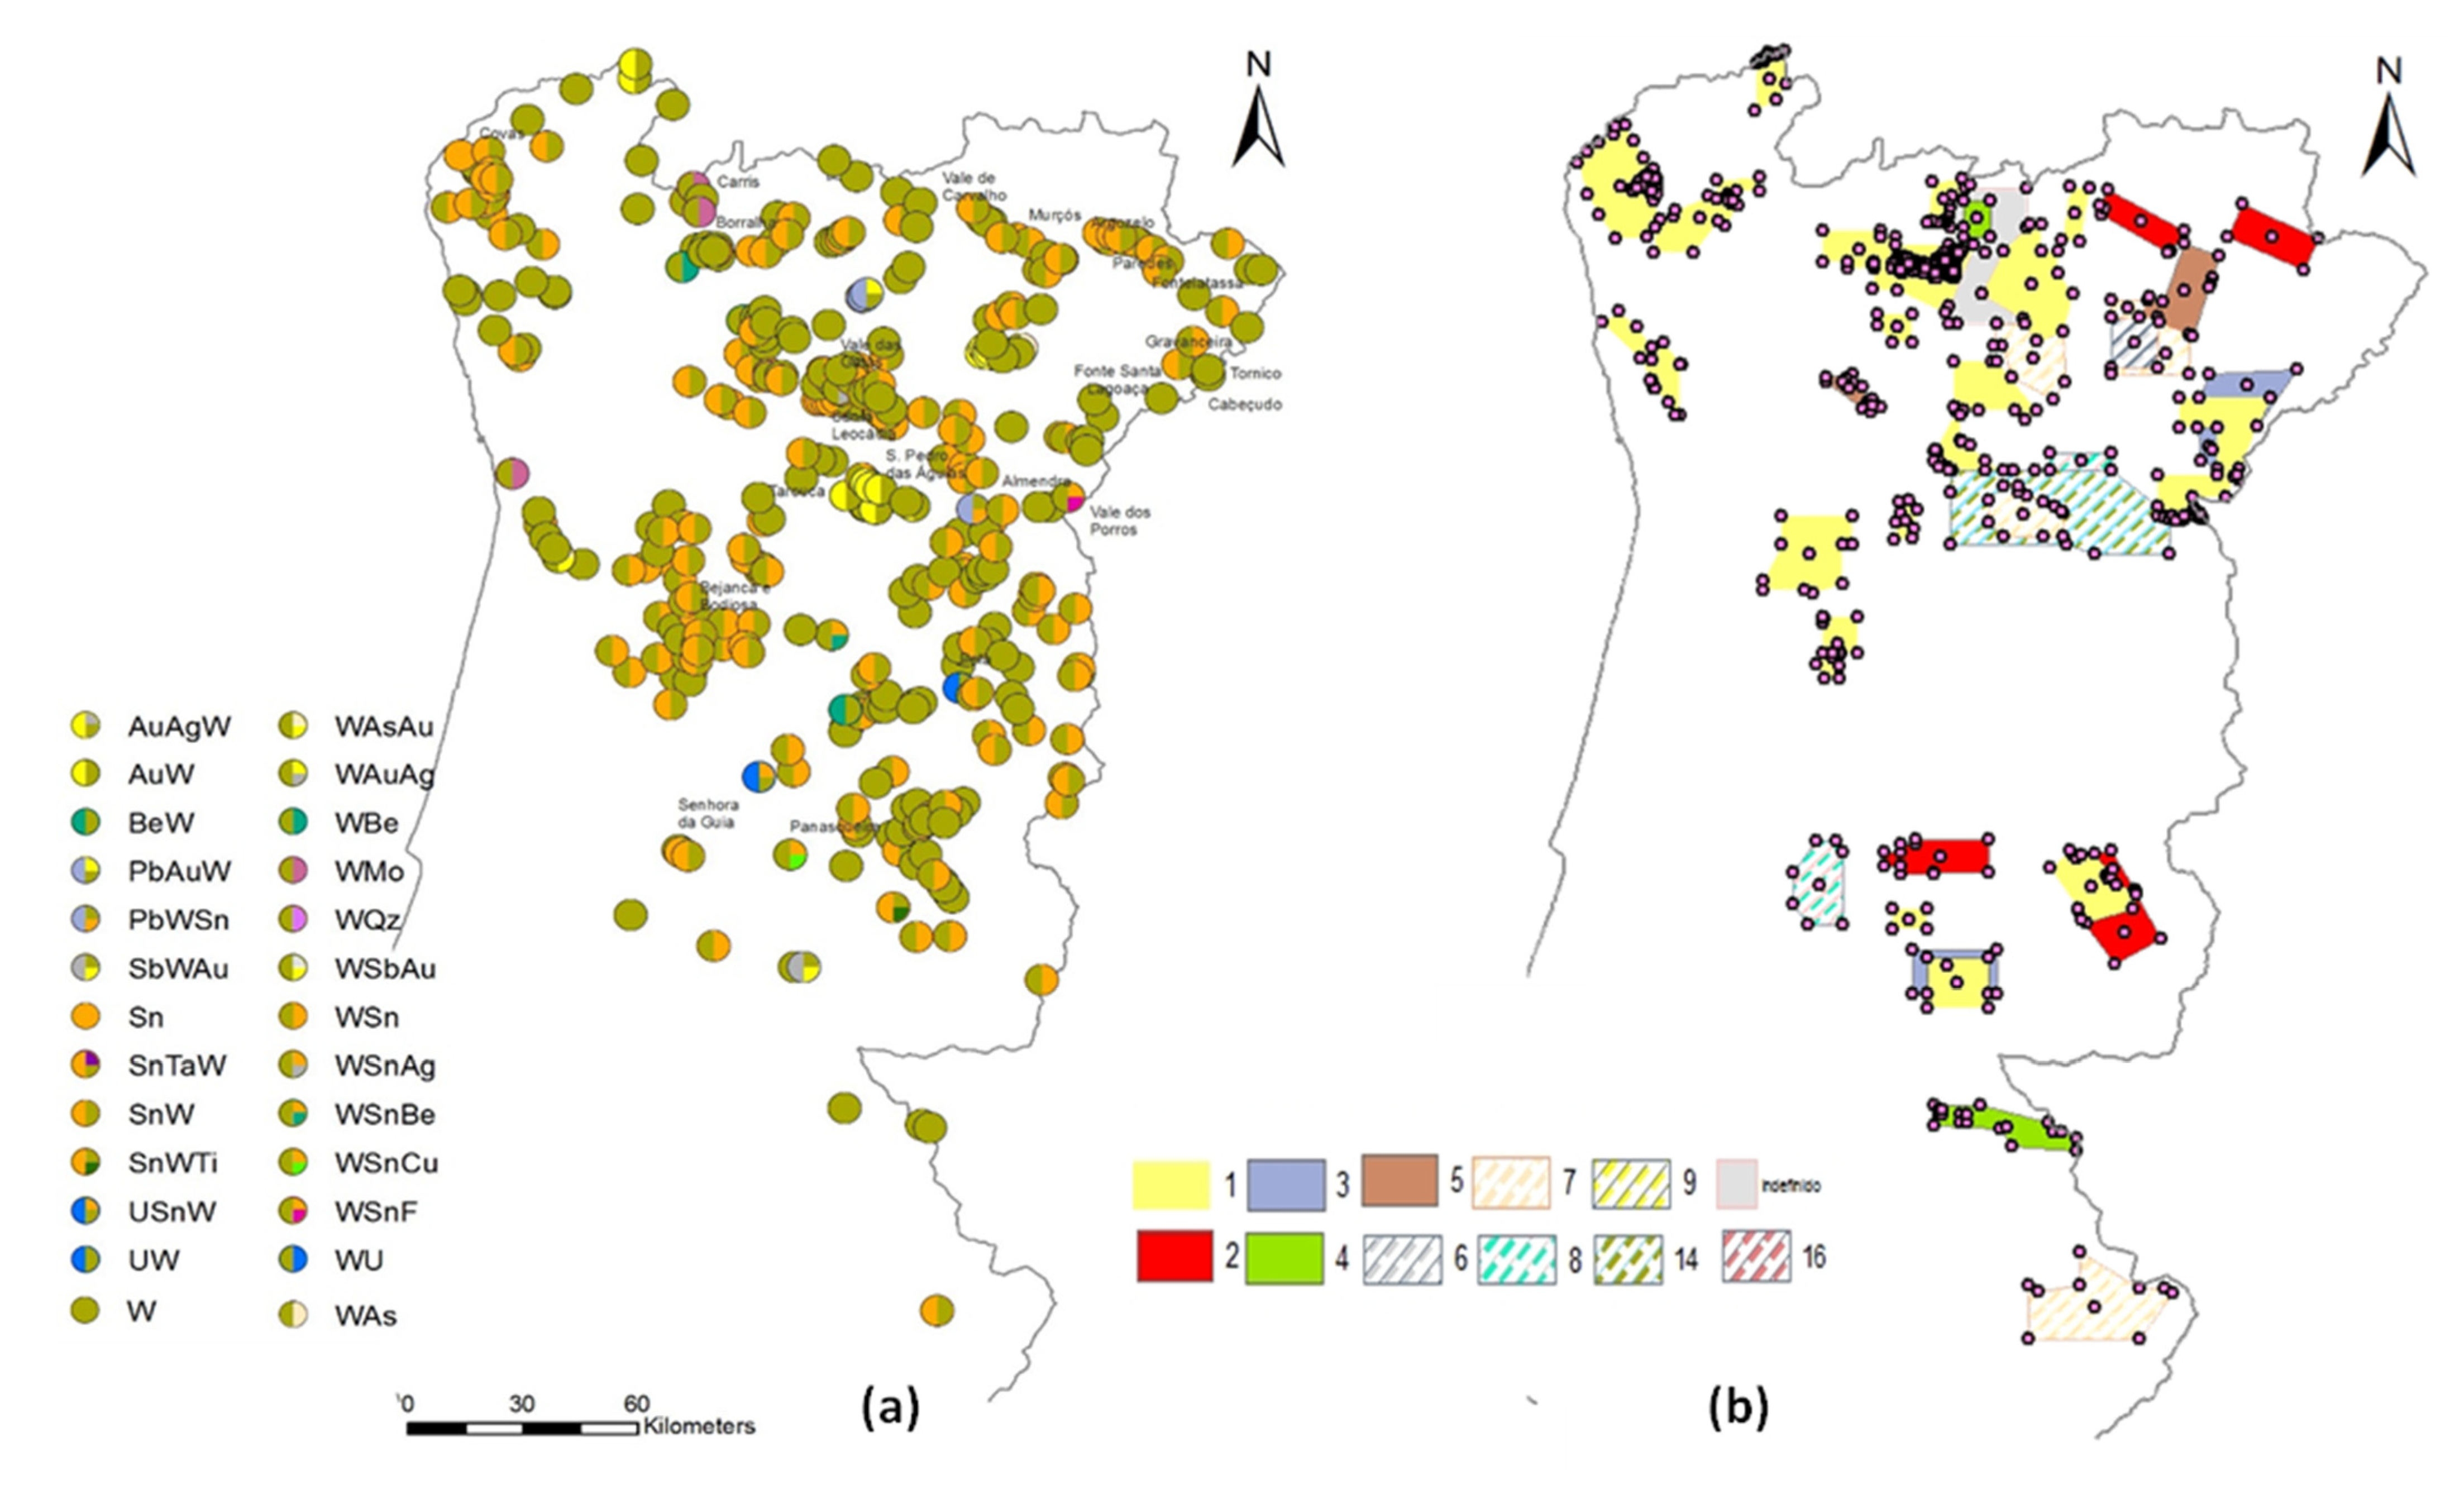
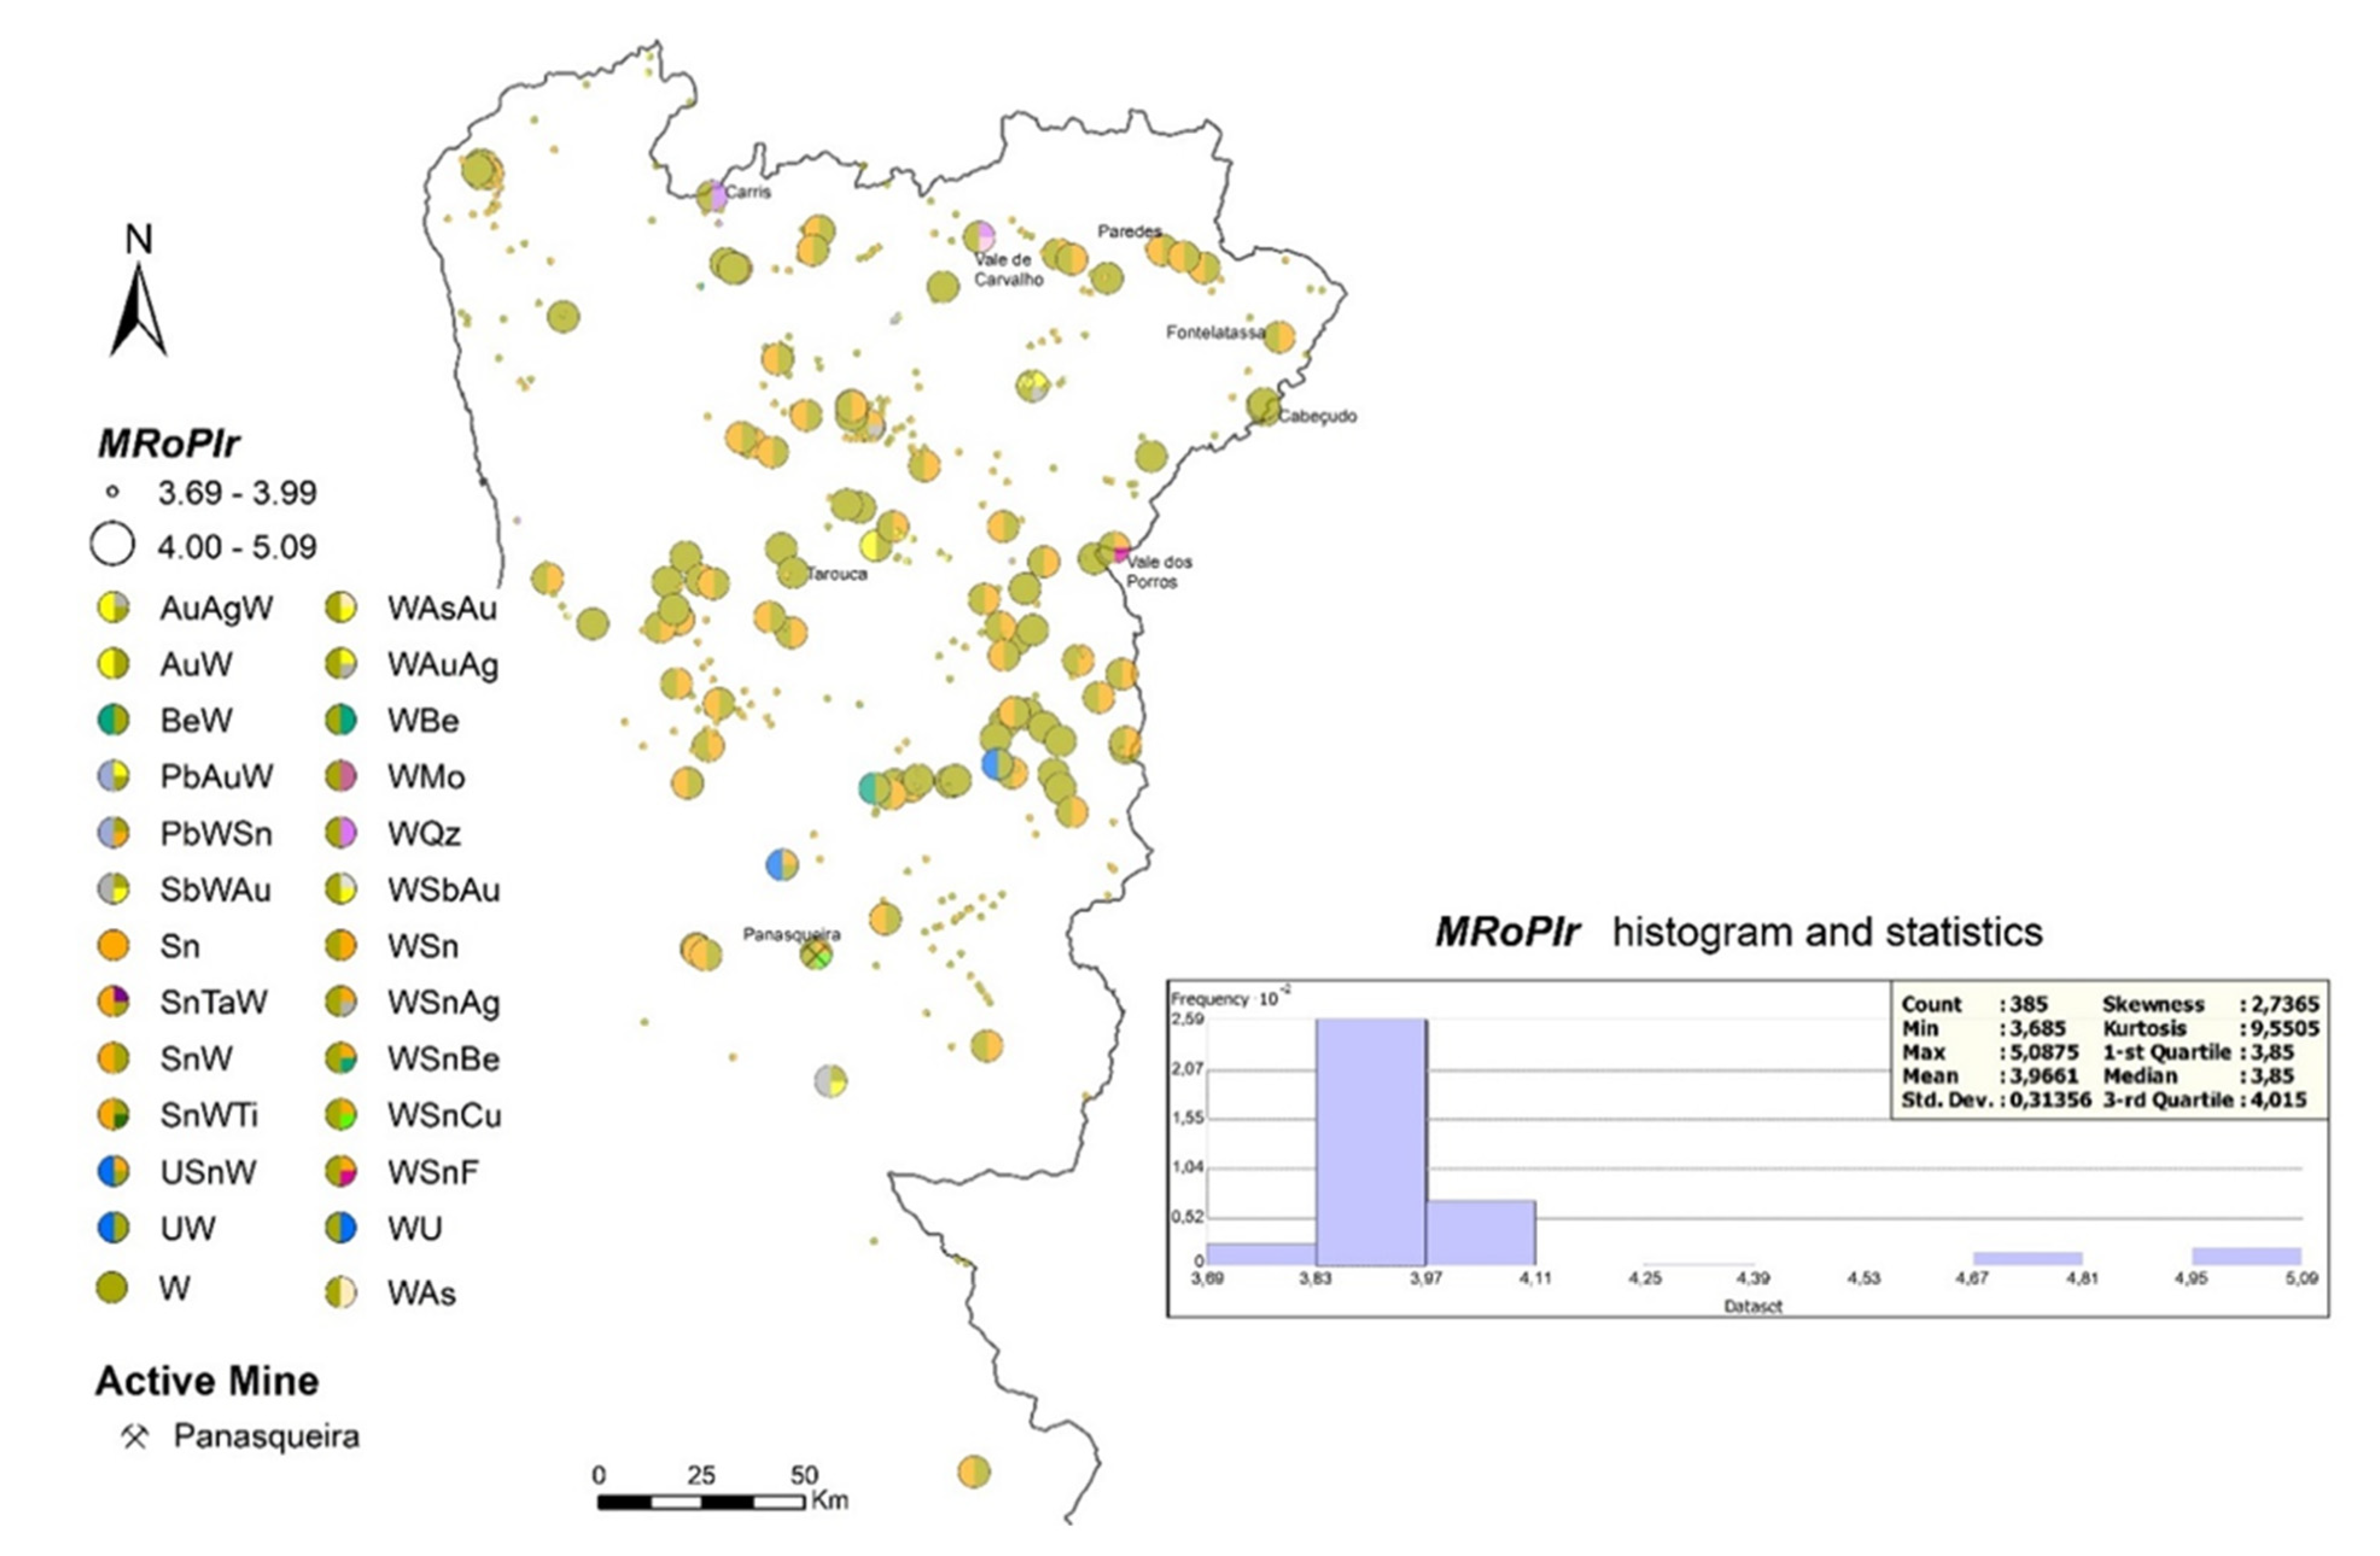
The 385 tungsten-bearing tracts identified in the official catalogue SIORMINP spread all over the north, northeast, and central regions of Portugal mainland. These regions are mostly rural albeit displaying various potential land-use conflicts due to other profitable economic activities, such as: (i) Forest and derived products, some with high commercial value; (ii) agriculture, including vineyards, olive-, almond-, cherry-, and other fruit-farms of local species highly appreciated in national and foreigner markets; and (iii) cattle raising of autochthonous species for meat production and various derivatives (ham, sausages, cheese, milk, etc.). Other real or latent land-use conflicts exist in some areas due to additional natural values (here including biodiversity and geological heritage, besides unique goods and eco-services) or cultural values (e.g., archaeological sites) already covered by safeguarding measures provided by the legal framework in force. However, the conciliation of all these activities and heritage protection with mining is not impossible if an adequate land-use planning exists.
As demonstrated in Section 4.3, only 27% of the 385 tungsten-bearing tracts identified in the country have known geological attributes that justify a “public importance” label, and their safeguarding implicates no more than ≈6% of the Portugal mainland territory. The obtained results also show that the M R o P I r score of these 104 tracts range mostly from 4.68 to 5.09, with the exception of Panasqueira that reaches 8.07 in 10.00. If mining works recommence at Borralha and Vale das Gatas, their M R o P I r scores should naturally rise in accordance to up-to-date assessments of E c , E v , and S D A dimensions. Therefore, excluding the confined locations where mining facilities are or could be implanted at Panasqueira, Borralha, and Vale das Gatas, the safeguarding decision on the current and future access to the areas indicated in Figure 8b are classified as third priority ( 4 M R o P I r < 6 ). This could be viewed as a feeble result, merely confirming what is obvious. Nonetheless, the decision scope is quite significant since it provides the political support needed to include in land-use planning tools the boundary conditions to favor the progression of exploration surveys whenever needed and avoid alternative land uses that may lead to resources sterilization.
Presently, at the level of the Municipal Land-use Planning (MLP) in Portugal, the access and use of mineral resources have been considered by the official committees when legally established easements exist. Representatives of DGEG are part of the MLP monitoring groups and the safeguarding of granted areas for mineral exploitation, as well as areas of demonstrated potential, are a matter of their permanent concern. This work has been made on the basis of mutual agreements between the interested (public and private) parts: (i) Preventing and managing the land-use related conflicts, according to the best procedures and to the law enforcement on the access to land; and (ii) securing land-use rights beyond property rights for all. Even so, growing symptoms of social distrust have contributed to an increase of negative perceptions regarding the resurgence of mining in many regions of the country. Regulation improvements by including the MRoPI concept and related methodology [48] could represent an important step-forward in restoring the necessary social confidence on (re)industrialization policies, without neglecting compliance with demanding environmental standards. If well-succeeded, these improvements will also represent a fundamental support for the design of a national plan for mining development under the legal instruments of land-use management, considering the medium to long-term general and specific goals of the intended Sustainable Development. In this regard, the safeguarding of tungsten resources can be strategically defined in two distinct but coexisting ways: (1) For future access, ensuring the supply of forthcoming generations and avoiding the sterilization of tracts rated with M R o P I r 4 ; and (2) for the short-medium term access, assigning specific areas to exploitation activities at stable extraction rates, therefore substantiating the consolidation and growth of responsible tungsten mining in Portugal.

5.3. Prospective Contributions of Tungsten-Based Scrap Assembled in Portugal

An increasingly stronger connection between the Mining Life Cycle and the Product Life Cycle is fundamental for a correct management of future demands in raw materials and of their flows within the economic/industrial system, e.g., [35]. By increasing the inputs from recycling and remanufacturing, along with wider obsolescence cycles and higher material efficiency, it will be possible to reduce the pressure on the exploitation of primary resources, e.g., [47]. Current recycling rates of tungsten-based scrap is significant, representing ≈30% of the total consumption, e.g., [3,24,25,26,27,28], but it could be improved in a near future. The relatively low price of tungsten in international markets has been one of the most limiting factors for recycling enhancements and secondary production incentives. However, the circumstances supporting the low price of tungsten are changing [3,13] and at some point it will be economically feasible (and strategically recommendable) to upgrade the efficiency of existent collecting systems for tungsten-based scrap and its subsequent transformation.
To our knowledge, there is no selective collection of tungsten-based scrap in Portugal. However, many tungsten-bearing materials are used extensively in the automotive and metal-casting sectors, both having a very significant weight in the national GDP. If we add to these consumptions the cutting and abrasive materials used yearly by the Portuguese extractive industry (three active world-class mines—Panasqueira, Neves Corvo, and Aljustrel—in addition to several dozens of large exploitations for industrial rocks/minerals and ornamental stones), the possibility of gathering considerable quantities of different tungsten-bearing materials is, at least conceptually, high. A careful inventory of all these sources will have to be carried out to ascertain the specific nature of the materials that can be collected and their amounts. If our inference proves to be correct, an economic feasibility study is also needed to evaluate the opportunity to create in Portugal an industrial row committed to the collection and subsequent recycling of tungsten-based scrap. This may represent an (important?) increase of the amount of tungsten produced annually in Portugal, also contributing to the reduction of the EU external dependence on the supply of this critical raw material.

6. Conclusions

The current supply of tungsten-bearing products depends largely (≈70%) on exploitation of primary resources and this reliance should not change considerably in the near future. Over the last 20 years, mining and subsequent transformation of tungsten ores in China have accounted for more than 80% of the world production, but this hegemony will hardly be maintained in the coming decades due to constraints imposed by the limited availability of high-quality ores. In addition, if the growing trend of Chinese consumption of tungsten remains at high rates, the likelihood of export restrictions of tungsten-bearing products from China should not be discarded. Therefore, the search for new inputs of primary tungsten production in the global supply chain is a pertinent issue, as well as the need of safeguarding the future access to known tungsten resources never mined or whose exploitation was interrupted in the past due to economic or technological adversities.
Over the last decade, the amount of tungsten consumed in the EU accounted for 14 to 19% of the global market, but its production of mineral concentrates did not exceed 3% of the quantity yearly generated worldwide. The contribution of Portugal to this share is significant and has potential to grow in the next decades.
Current estimates on the Portuguese reserves indicates 5.4 kt of contained tungsten in wolframite-dominant mineral concentrates, accounting for 0.16% of the world reserves (3.4 Mt). Circa 79% of the country reserves are confined to Panasqueira, but these figures could change in a near future as a result of ongoing exploration surveys at Borralha and Vale das Gatas deposits. The tungsten resources in Portugal were tentatively placed at 141 kt, representing 2% of the tungsten world resources (7 Mt).
The role of Portugal in the global primary tungsten supply chain will be irrelevant in 10 to 20 years if the existing reserves are not expanded. However, considering the known tungsten resources in the country, the relevance of the Portuguese input could continue for some more decades and achieve an estimated cumulative production ranging from 22.4 to 76.3 kt during the 2021–2100 period (i.e., from ≈0.5 to ≈1.4% of the forecasted world production for the same time range). In addition to this possible increase in primary production, contributions from the selected collection and transformation of tungsten-based scrap are plausible and should be investigated.
According to the available geological knowledge, 104 of the 385 tungsten-bearing tracts identified in Portugal fulfil the basic requirements to be classified as “mineral resources of public importance”. These 104 tracts cover ≈6% of the country territory and include three deposits with assessed reserves, 32 deposits with estimated resources, and 69 prospects with favorable mineral exploration results. The M R o P I r scores of the most relevant known deposits range between 4.68 and 5.09, excluding Panasqueira that reaches 8.07 in 10.00. With the exception of locations where mining facilities are or could be implanted (Panasqueira, Borralha, and Vale das Gatas), the access and safeguarding of all the remaining tracts are of third priority. This means that land-use planning in these areas should be managed carefully, favoring the progression of exploration surveys whenever needed and avoiding circumstantial or long-lasting alternative land uses that can jeopardize further endeavors that may guide viable mining operations.
By default, the Generalized Verhulst and Richards curve-fitting forecasts reported in this study are sensitive to estimates on the remaining ultimately recoverable mineral resources. However, the available data on tungsten resources and reserves are not used as fixed stocks but rather as current valid estimates that should change over time according to improvements in geoscientific knowledge and to variations in the modifying factors usually considered in reserves appraisal (reflecting economic, technological, and regulation changes). Therefore, the obtained results represent possible trends that should be closely monitored and recurrently updated. An incessant evaluation of mineral resources and reserves is also crucial to a correct periodic review of the areas that should be assigned to mineral exploration and mining, following the principles that support the multi-criteria methodology used to assess the “public importance” attribute. Despite the limitations inherent to both approaches, the results provided by them are useful and realistic, representing additional support to political decisions on the urgent need to reconcile mineral exploration surveys and mining with other land uses.

Supplementary Materials

The following are available online at https://www.mdpi.com/article/10.3390/resources10060064/s1. Table S1: Tungsten production in Portugal and worldwide from 1910 to 2020 (metric tons of metal content), according to the open data series provided by DGEG and USGS, respectively; Table S2: Variation of depletion rates over time considering the historical production of tungsten in Portugal and worldwide from 1910 to 2020 and the range of URR(t) values imposed by current estimates for the country and global reserves and resources; Table S3: Forecasting of tungsten production in Portugal and worldwide considering the GVM curve-fitting results constrained by the range of URR(t) values that correspond to current estimates for the country and global reserves and resources; Table S4: Forecasting of tungsten production in Portugal and worldwide considering the RM curve-fitting results constrained by the range of URR(t) values that correspond to current estimates for the country and global reserves and resources; Figure S1: Forecasting of annual tungsten production in Portugal and worldwide using the RM and GVM curve-fitting constrained by historical data and maximum and minimum U R R ( t ) values.

Author Contributions

Conceptualization, methodology, numerical handling of data, interpretation and validation of results, writing (original draft preparation, review and editing), and funding acquisition, A.M.; methodology, numerical handling of data, interpretation and validation of results, and writing (review and editing), C.L.; methodology, interpretation and validation of results, writing (review and editing), and funding acquisition, L.M.; methodology, interpretation and validation of results, and writing (review and editing), M.A.G. All authors have read and agreed to the published version of the manuscript.

Funding

The research on the “MRoPI methodology”, including its validation and the use of tungsten as a case study, was funded by the MINATURA2020 project (grant agreement no. 642139) running within the scope of the European Union’s Horizon 2020 Programme for Research & Innovation. The forecast analysis and related research were supported by the Portuguese funding agency for Science, Research, and Technology (FCT) through the UIDB/50019/2020 (IDL) grant.

Institutional Review Board Statement

Not applicable.

Informed Consent Statement

Not applicable.

Data Availability Statement

Data supporting this study are available in Supplementary Materials.

Acknowledgments

The authors are grateful to LNEG (Laboratório Nacional de Energia e Geologia) and DGEG (Direcção Geral de Energia e Geologia) for access permission to the Portuguese mineral resources official repositories. The authors acknowledge Augusto Filipe and Daniel P. S. de Oliveira, both from LNEG, for their significant support, fruitful discussions, and sharing knowledge on the SIORMINP national catalogue. The administrative support of Célia Lee is also warmly recognized. Comments raised by three anonymous reviewers are appreciated.

Conflicts of Interest

The authors declare no conflicts of competing financial interests or personal relationships that could have influenced the work reported in this paper.

References

  1. Christian, J.; Singh Gaur, R.P.; Wolfe, T.; Trasorras, J.R.L. Tungsten Chemicals and Their Applications; International Tungsten Industry Association: London, UK, 2011; Available online: https://www.itia.info/assets/files/newsletters/Newsletter_2011_06.pdf (accessed on 5 January 2021).
  2. Gunn, G. Critical Metals Handbook, 1st ed.; John Wiley & Sons, Ltd.: London, UK, 2014. [Google Scholar]
  3. Leal-Ayala, D.R.; Allwood, J.M.; Petavratzi, E.; Brown, T.J.; Gunn, G. Mapping the global flow of tungsten to identify key material efficiency and supply security opportunities. Resour. Conserv. Recycl. 2015, 103, 19–28. [Google Scholar] [CrossRef] [Green Version]
  4. Shen, L.; Li, X.; Lindberg, D.; Taskinen, P. Tungsten extractive metallurgy: A review of processes and their challenges for sustainability. Miner. Eng. 2019, 142, 105934. [Google Scholar] [CrossRef]
  5. Tilton, J.E. Our mental models of mineral depletion—And why they matter. Bol. Geol. Min. 2019, 130, 57–65. [Google Scholar] [CrossRef]
  6. Wellmer, F.-W.; Scholz, R.W. Peak minerals: What can we learn from the history of mineral economics and the cases of gold and phosphorus? Miner. Econ. 2017, 30, 73–93. [Google Scholar] [CrossRef]
  7. Tilton, J.E.; Crowson, P.C.F.; DeYoung, J.H., Jr.; Eggert, R.G.; Ericsson, M.; Guzmán, J.I.; Humphreys, D.; Lagos, G.; Maxwell, P.; Radetzki, M.; et al. Public policy and future mineral supplies. Resour. Policy 2018, 57, 55–60. [Google Scholar] [CrossRef]
  8. Yaksic, A.; Tilton, J.E. Using the cumulative availability curve to assess the threat of mineral depletion: The case of lithium. Resour. Policy 2009, 34, 185–194. [Google Scholar] [CrossRef]
  9. Mudd, G.M.; Weng, Z. Base metals. In Materials for a Sustainable Future; Letcher, T.M., Davidson, M.G., Scott, J.L., Eds.; Royal Society of Chemistry: Cambridge, UK, 2012; pp. 11–59. [Google Scholar]
  10. Yokoi, R.; Nansai, K.; Hatayama, H.; Motoshita, M. Significance of country-specific context in metal scarcity assessment from a perspective of short-term mining capacity. Resour. Conserv. Recycl. 2021, 166, 105305. [Google Scholar] [CrossRef]
  11. U.S. Geological Survey. Mineral Commodity Summaries 2021; U.S. Geological Survey: Reston, VA, USA, 2021. [Google Scholar] [CrossRef]
  12. Gao, B.; Li, Z. Early warning for tungsten resources industrial security in China. In Proceedings of the 3rd International Conference on Management, Education Technology and Sports Science (METSS 2016), Guilin, China, 24–25 September 2016. [Google Scholar]
  13. Tang, L.; Wang, P.; Graedel, T.E.; Pauliuk, S.; Xiang, K.; Ren, Y.; Chen, W.-Q. Refining the understanding of China’s tungsten dominance with dynamic material cycle analysis. Resour. Conserv. Recycl. 2020, 158, 104829. [Google Scholar] [CrossRef]
  14. Wellmer, F.-W.; Dalheimer, M. The feedback control cycle as regulator of past and future mineral supply. Miner. Depos. 2012, 47, 713–729. [Google Scholar] [CrossRef]
  15. Dvořáček, J.; Sousedíková, R.; Vrátnŷ, T.; Jureková, Z. Global tungsten demand and supply forecast. Arch. Min. Sci. 2017, 62, 3–12. [Google Scholar] [CrossRef] [Green Version]
  16. Sheng, J.; Liu, L.; Wang, D.; Chen, Z.; Ying, L.; Huang, F.; Wang, J.; Zeng, L. A preliminary review of metallogenic regularity of tungsten deposits in China. Acta Geol. Sin. 2015, 89, 1359–1374. [Google Scholar]
  17. Filipe, A.; de Oliveira, D.P.S. Tungsten: An historical perspective of this critical raw material in Portugal. Geonovas 2017, 30, 51–66. Available online: https://issuu.com/associacaoportuguesageologos/docs/revista_geonovas.compressed (accessed on 8 January 2021).
  18. Schubert, W.D.; Lassner, E.; Bohlke, W. Cemented Carbides—A Success Story; International Tungsten Industry Association: London, UK, 2010; Available online: https://www.itia.info/assets/files/Newsletter_2010_06.pdf (accessed on 5 January 2021).
  19. Jones, N.; Specialist, E.; Aerofoils, T. Tungsten in Superalloys; International Tungsten Industry Association: London, UK, 2017; Available online: https://www.itia.info/assets/files/newsletters/Newsletter_2017_03.pdf (accessed on 5 January 2021).
  20. Sato, A.; Yoshida, K.; Fukushi, D. Photocatalyst—A New Application for Tungsten; International Tungsten Industry Association: London, UK, 2015; Available online: https://www.itia.info/assets/files/newsletters/Newsletter_2015_12.pdf (accessed on 5 January 2021).
  21. Roskill Market Reports. Tungsten—Outlook to 2030. 15th Edition. Available online: https://roskill.com/market-report/tungsten/ (accessed on 15 March 2021).
  22. USGS, National Minerals Information Center. Tungsten Statistics and Information. Available online: https://www.usgs.gov/centers/nmic/tungsten-statistics-and-information (accessed on 3 January 2021).
  23. Wang, D.; Huang, F.; Wang, Y.; He, H.; Li, X.; Liu, X.; Sheng, J.; Liang, T. Regional metallogeny of Tungsten-tin-polymetallic deposits in Nanling region, South China. Ore Geol. Rev. 2020, 120, 103305. [Google Scholar] [CrossRef]
  24. Liu, H.; Liu, H.; Nie, C.; Zhang, J.; Steenari, B.-M.; Ekberg, C. Comprehensive treatments of tungsten slags in China: A critical review. J. Environ. Manag. 2020, 270, 110927. [Google Scholar] [CrossRef] [PubMed]
  25. Shemi, A.; Magumise, A.; Ndlovu, S.; Sacks, N. Recycling of tungsten carbide scrap metal: A review of recycling methds and future prospects. Miner. Eng. 2018, 122, 195–205. [Google Scholar] [CrossRef]
  26. Mishra, D.; Sinh, S.; Sahu, K.K.; Agrawali, A.; Kumar, R. Recycling of Secondary Tungsten Resources. Trans. Indian Inst. Met. 2017, 70, 479–485. [Google Scholar] [CrossRef]
  27. Harper, E.M. A product-level approach to historical material flow analysis: Tungsten as a case study. J. Ind. Ecol. 2008, 12, 768–784. [Google Scholar] [CrossRef]
  28. Zeiler, B. Recycling of Tungsten—Current Share, Economic Limitations and Future Potential; International Tungsten Industry Association: London, UK, 2018; Available online: https://www.itia.info/assets/files/newsletters/ITIA_Newsletter_2018_05.pdf (accessed on 6 January 2021).
  29. EU Commission. Report on Critical Raw Materials and the Circular Economy. 2018. Available online: https://ec.europa.eu/commission/publications/reportcritical-raw-materials-and-circular-economy_en (accessed on 4 January 2021).
  30. EU Commission. Study on the EU’s List of Critical Raw Materials—Final Report; Publications Office: Luxembourg, 2020; Available online: https://ec.europa.eu/docsroom/documents (accessed on 4 January 2021). [CrossRef]
  31. Mudd, G.M.; Werner, T.T.; Weng, Z.H.; Yellishetty, M.; Yuan, Y.; McAlpine, S.R.B.; Skirrow, R.; Czarnota, K. Critical Minerals in Australia: A Review of Opportunities and Research Needs. 2019. Available online: https://d28rz98at9flks.cloudfront.net/124161/Rec2018_051.pdf (accessed on 21 January 2021).
  32. Hatayama, H.; Tahara, K. Criticality assessment of metals for Japan’s Resource Strategy. Mater. Trans. 2014, 56, 229–235. [Google Scholar] [CrossRef] [Green Version]
  33. National Science and Technology Council (NSTC). Assessment of Critical Minerals: Updated Application of Screening Methodology. 2018. Available online: https://www.whitehouse.gov/wp-content/uploads/2018/02/Assessment-of-Critical-Minerals-Update-2018.pdf (accessed on 2 February 2021).
  34. Talens Peiro, L.; Nuss, P.; Mathieux, F.; Blengini, G. Towards Recycling Indicators Based on EU Flows and Raw Materials System Analysis Data; EUR 29435 EN; JRC112720; Publications Office of the European Union: Luxembourg, 2018; ISBN 978-92-79-97247-8 (online). [Google Scholar] [CrossRef]
  35. Mateus, A.; Martins, L. Building a mineral-based value chain in Europe: The balance between social acceptance and secure supply. Miner. Econ. 2021. [CrossRef]
  36. Filipe, A. Management of mineral resources (SIORMINP). VIII Congresso Nacional de Geologia. eTerra 2010, 20, 1–4. Available online: http://e-Terra.geopor.pt (accessed on 15 June 2018).
  37. Bardi, U. The mineral economy: A model for the shape of oil production curves. Energy Policy 2005, 33, 53–61. [Google Scholar] [CrossRef]
  38. Höök, M.; Li, J.; Oba, N.; Snowden, S. Descriptive and predictive growth curves in energy system analysis. Nat. Resour. Res. 2011, 20, 103–116. [Google Scholar] [CrossRef] [Green Version]
  39. Mohr, S.H.; Höök, M.; Mudd, G.M.; Evans, G. Projection of long-term paths for Australian coal production—Comparisons of four models. Int. J. Coal Geol. 2011, 86, 329–341. [Google Scholar] [CrossRef]
  40. May, D.; Prior, T.; Cordell, D.; Guirco, D. Peak minerals: Theoretical foundations and practical application. Nat. Resour. Res. 2012, 21, 43–60. [Google Scholar] [CrossRef]
  41. Vikström, H.; Davidsson, S.; Höök, M. Lithium availability and future production outlooks. App. Energy 2013, 110, 252–266. [Google Scholar] [CrossRef] [Green Version]
  42. Wang, J.; Feng, L. Curve-fitting models for fossil fuel production forecasting: Key influence factors. J. Nat. Gas Sci. Eng. 2016, 32, 138–149. [Google Scholar] [CrossRef]
  43. Meinert, L.D.; Robinson, G.R.; Nassar, N.T. Mineral resources: Reserves, peak production and the future. Resources 2016, 5, 14. [Google Scholar] [CrossRef]
  44. Wang, J.; Feng, L.; Zhao, S.; Snowden, X.; Wang, X. A comparison of two typical multicyclic models used to forecast the world’s conventional oil production. Energy Policy 2011, 39, 7616–7621. [Google Scholar] [CrossRef]
  45. Höök, M. Depletion rate analysis of fields and regions: A methodological foundation. Fuel 2014, 121, 95–108. [Google Scholar] [CrossRef] [Green Version]
  46. Höök, M.; Aleklett, K. Trends in U.S. recoverable coal supply estimates and future production outlooks. Nat. Resour. Res. 2010, 19, 189–208. [Google Scholar] [CrossRef] [Green Version]
  47. Mateus, A.; Martins, L. Challenges and opportunities for a successful mining industry in the future. Bol. Geol. Min. 2019, 130, 95–117. [Google Scholar] [CrossRef]
  48. Mateus, A.; Lopes, C.; Martins, L.; Carvalho, J. Towards a multidimensional methodology supporting a safeguarding decision on the future access to mineral resources. Miner. Econ. 2017, 30, 229–255. [Google Scholar] [CrossRef] [Green Version]
  49. Galos, K.; Tiess, G.; Kot-Niewiadomska, A.; Muruoia, D.; Wertichowa, B. Mineral deposits of public importance (MDoPI) in relation to the project of the national mineral policy of Poland. Min. Res. Manag. 2018, 34, 5–24. [Google Scholar] [CrossRef] [Green Version]
  50. Radwanek-Bak, B.; Sobcyk, W.; Sobcyk, E.J. Support for multiple criteria decisions for mineral deposits valorization and protection. Res. Pol. 2020, 68, 101795. [Google Scholar] [CrossRef]
  51. Ruggie, J.G. Reconstructing the global public domain—Issues, actors, and practices. Eur. J. Int. Rel. SAGE Pub. ECPR Eur. Consort. Pol. Res. 2004, 10, 499–531. [Google Scholar] [CrossRef]
  52. Rowe, G.; Frewer, L.J. Evaluating public-participation exercises: A research agenda. Sci. Technol. Hum. Values 2004, 29, 512–556. [Google Scholar] [CrossRef]
  53. Rowe, G.; Frewer, L.J. A typology of public engagement mechanisms. Sci. Technol. Hum. Values 2005, 30, 251–290. [Google Scholar] [CrossRef]
  54. Ho, L.S. Public Policy and the Public Interest, 1st ed.; Routledge International Studies in Health Economics; Taylor & Francis Group: New York, NY, USA, 2012. [Google Scholar]
  55. Lopes, C.; Lisboa, V.; Carvalho, J.; Mateus, A.; Martins, L. Challenges to access and safeguard mineral resources for society: A case study of kaolin in Portugal. Land Use Policy 2018, 79, 263–284. [Google Scholar] [CrossRef]
  56. Carvalho, J.M.F.; Lopes, C.; Mateus, A.; Martins, L.; Goulão, M. Planning the future exploitation of ornamental stones in Portugal using a weighed multi-dimensional approach. Resour. Policy 2018, 59, 298–317. [Google Scholar] [CrossRef] [Green Version]
  57. Filipe, A.; Inverno, C.M.; Oliveira, D.P.S.; Santana, H.; Matos, J.X.; Farinha Ramos, J.; Carvalho, J.; Batista, M.J.; Sardinha, R.; Salgueiro, R.; et al. Recursos Minerais: O Potencial de Portugal; LNEG: Amadora, Lisboa, 2010. [Google Scholar]
  58. Gonçalves, M.; Mateus, A.; Pinto, F.; Vieira, R. Using multifractal modelling, singularity mapping, and geochemical indexes for targeting buried mineralization: Application to the W-Sn Panasqueira ore-system, Portugal. J. Geochem. Explor. 2018, 189, 42–53. [Google Scholar] [CrossRef]
  59. Mateus, A.; Figueiras, J.; Martins, I.; Rodrigues, P.C.; Pinto, F. Relative Abundance and Compositional Variation of Silicates, Oxides and Phosphates in theW-Sn-Rich Lodes of the Panasqueira Mine (Portugal): Implications for the Ore-Forming Process. Minerals 2020, 10, 551. [Google Scholar] [CrossRef]
  60. Wheeler, A. Technical Report on the Mineral Resources and Reserves of the Panasqueira Mine, Portugal. Report NI 43-101. 2017. Available online: https://almonty.com/wp-content/uploads/2019/06/Panasqueira_43-101_Tech_Rep_Dec16_SEDAR.pdf (accessed on 3 October 2019).
  61. Valente, S.; Figueiredo, E. Entre os riscos e os benefícios—Análise da percepção social do risco em duas comunidades mineiras. In Proceedings of the VI Congresso Português de Sociologia—Mundos Sociais: Saberes e Práticas, Lisboa, Portugal, 25–29 June 2008; Available online: http://associacaoportuguesasociologia.pt/vicongresso/pdfs/706.pdf (accessed on 9 February 2021).
  62. Sánchez, A.S.; Krzemién, A.; Fernández, P.R.; Rodríguez, F.J.; Lasheras, F.S.; de Cos Juez, F.J. Investment in new tungsten mining projects. Res. Pol. 2015, 46, 177–190. [Google Scholar] [CrossRef] [Green Version]
  63. Yang, X. Beneficiation studies of tungsten ores—A review. Miner. Eng. 2018, 125, 111–119. [Google Scholar] [CrossRef]
Figure 1. (a) Cumulative tungsten production in Portugal and worldwide over the 1910–2020 period; (b) annual tungsten production in Portugal and worldwide from 1910 to 2020; the percentage of the Portuguese input to global production is indicated by the broken dashed-line in orange. Data in Table S1 of Supplementary Materials.
Resources 10 00064 g001
Figure 2. Spatial distribution of the known tungsten deposits in Portugal mainland, according to the Information System of the Portuguese Mineral Occurrences and Resources (SIORMINP, [19]) managed by the Portuguese Geological Survey (LNEG). The 11 deposits listed in Table 2 are numbered as in the official maps provided by LNEG.
Resources 10 00064 g002
Figure 3. (a) Variation of d U R R , t over the 1910–2020 time period, using the Portuguese and global tungsten reserves and resources as maximum and minimum U R R ( t ) values; (b) variation of d R R R , t over the 1910–2020 time period, considering the remaining Portuguese and global reserves and resources; the green dashed-line represents the 5th-order polynomial fitting the depletion rates of remaining tungsten reserves in Portugal. For calculation purposes, the reference U R R ( t ) values are obtained by adding the historical cumulative production to current estimates of U R R . Data in Table S2 of Supplementary Materials.
Resources 10 00064 g003
Figure 4. Forecasting of cumulative tungsten production in Portugal using curve-fitting models constrained by historical data (black dots) and maximum and minimum U R R ( t ) values (i.e., tungsten reserves and resources estimated for the country): (a) Generalized Verhulst Model (GVM); (b) Richards Model (RM). Variation of d R R R , t over time as predicted by results from GVM (c) and RM (d) approaches. For calculation purposes, the reference U R R ( t ) values are obtained by adding the historical cumulative production to current estimates of U R R . Data in Table S3 of Supplementary Materials.
Resources 10 00064 g004
Figure 5. Forecasting of cumulative tungsten production in the world using curve-fitting models constrained by historical data (black dots) and maximum and minimum U R R ( t ) values (i.e., global tungsten reserves and resources): (a) Generalized Verhulst Model (GVM); (b) Richards Model (RM). Variation of d R R R , t over time as predicted by results from GVM (c) and RM (d) approaches. For calculation purposes, the reference U R R ( t ) values are obtained by adding the historical cumulative production to current estimates of U R R . Data in Table S4 of Supplementary Materials.
Resources 10 00064 g005
Figure 6. (a) Spatial distribution of the 385 tungsten-bearing specific tracts in Portugal mainland, considering the geographical coordinates and the geochemical association listed in the Information System of the Portuguese Mineral Occurrences and Resources (SIORMINP, [19]). (b) Vertices and centroids of selected polygons based on the exploration/exploitation areas granted by DGEG from 2007 to 2016. Colors and patterns of polygons indicate the relative importance of tungsten in the contract; the most significant surveys are those oriented to tungsten (yellow), tungsten-tin (red), and tin-tungsten (blue).
Resources 10 00064 g006
Figure 7. Spatial distribution of the 104 tungsten-bearing specific tracts with M R o P I r 4 in Portugal mainland.
Resources 10 00064 g007
Figure 8. (a) Variograms and parameters used in simple kriging interpolation of “ M R o P I r (higher)” data modelled with anisotropy. (b) Delimitation of areas scoring M R o P I r 4 , therefore comprising tungsten resources of public importance.
Resources 10 00064 g008
Figure 9. (a) Annual tungsten production in Portugal from 1910 to 2020 (black dots) and projected outputs (colored lines), from 2021 onwards, according to GVM and RM curve-fitting results constrained by reserves (Ptmin_V and Ptmin_R, respectively) and resources (Ptmax_V and Ptmax_R, following the same order). The green dashed-line is the moving average trend (5-year period) for production data. The reference U R R ( t ) values used in production forecasts are obtained by adding the historical cumulative production to current estimates of U R R . (b) Zoom of the previous plot, illustrating the progression of projected annual productions. (c) Percentage variation of the Portuguese input to the global primary tungsten supply chain over time, considering the historical data (black dots) and modelling results (colored lines). The green dashed-line is the 6-order polynomial fitting the relative weight of the Portuguese contribution (in %) documented by historical data. (b) Zoom of the previous plot, showing the Portuguese contribution (in %) based on the projected annual productions. Data in Tables S3 and S4 of Supplementary Materials.
Resources 10 00064 g009
Table 1. Summary of the criteria used to assess M R o P I r based on the level of geological knowledge ( L G K ), economic ( E c ), environmental ( E v ), and social development and acceptance ( S D A ) dimensions.
CriteriaWeigh
L G K G 1 Background geological info and knowledge0.20
G 2 Regional exploration info and knowledge0.30
G 3 Past exploitation info and knowledge0.20
G 4 Comprehensive, up-to-date info and knowledge0.30
E c E c 1 Intrinsic value of a specific tract, given the natural attributes0.25
E c 2 Mining/quarrying lifetime within a specific tract0.20
E c 3 Contribution of an active operation to the added-value chain of mineral products0.20
E c 4 Relevance to domestic market, reducing the EU dependence in mineral imports0.20
E c 5 Significance of exports trade (outside the EU)0.15
E v E v 1 Compatibility of mining/quarrying operations in a specific tract with other natural values0.20
E v 2 Impact of past exploitation activities in a specific tract0.20
E v 3 Comparative impact with other land uses or economic activities (existent and projected)0.10
E v 4 Mining impact or foreseen disturbances in natural flows in a specific tract 0.15
E v 5 Ongoing or proposed mitigation and rehabilitation measures in a specific tract 0.10
E v 6 Land use for mining and processing in a specific tract0.15
E v 7 Mining wastes/residues production and buffering in a specific tract0.10
S D A S D A 1 Mining acceptance0.20
S D A 2 Compatibility with other land uses0.15
S D A 3 Impact in the settlement and growth of populations0.15
S D A 4 Impact in direct/indirect jobs creation and welfare rise0.25
S D A 5 Wealth improvement and complementarity with other economic sectors0.25
Table 2. Tungsten resources and reserves (metric tons of metal content in mineral concentrates) estimated for the most relevant known deposits in Portugal. Data revised in 2017 [17].
ResourcesReserves
MeasuredIndicatedInferredProvedProbable
Panasqueira 854491017442543
Borralha 456 32127
Vale das Gatas 956
Lagoaça-Fonte Santa26,269
Serra d’ArgaCovas6111
Cerdeirinha2296
Valdarcas932
Fervença994
Lapa Grande592
Telheira850
Sta Leocádia-Barcos1190
S. Pedro das Águias 64635710
Bejanca-Bodiosa1866
Vale de Porros—Riba d’Alva1461
Tarouca 951611,102
Murçós 41,141
42,46017,28962,86227412670
Table 3. Main curve-fitting solutions to historic tungsten production data in Portugal and worldwide, making use of the Generalized Verhulst Model (GVM) and Richards Model (RM).
WorldPortugal
U R R ( t ) 3.4 Mt7 Mt5.4 kt141 kt
GVMPeak year2020202919651958
Maximum production (kt)68.976.61.71.8
RMPeak year2014203619611984
Maximum production (kt)68.290.11.92.0
Table 4. Reference conditions used in G 4 scoring.
Categorisation of Tungsten Resources in
Portugal (SIORMINP)
ScoresBonus and Penalty Sub-CriteriaScores
Mineral
(exploration results, hypothetical resources)
0.25Production data referring exclusively to the period of World War II or showing decreasing values since that period or artisanal panning and digging exploitation.−0.10
Documented production data or
10 or more old exploitation contracts over or surrounding the specific tract.
+0.10
Inferred resources 0.50
Indicated resources0.75
Measured resources 1.00
Proved reserves 1.00
Table 5. Allocation of M R o P I r values to vertices and centroids in function of the nearest neighboring specific tract with M R o P I r 4 and of the higher and lower M R o P I r value of the “cloud” of closest points.
Data Info M R o P I r 4
M R o P I r ,   Nearest %Higher
(Max, Average, Nearest)
%Lower
(Min, Average, Nearest)
%
Centroids561526.83053.635.4
Vertices91916117.519120.814415.7
Specific Tracts38510427.010427.010427.0
Total136028020.632523.925118.5
Publisher’s Note: MDPI stays neutral with regard to jurisdictional claims in published maps and institutional affiliations.

