Article

Pretreatment of Lignocellulosic Biomass with 1-Ethyl-3-methylimidazolium Acetate for Its Eventual Valorization by Anaerobic Digestion

by
Jose D. Marin-Batista
,
Angel F. Mohedano
and
Angeles de la Rubia
*
Chemical Engineering Department, Campus de Cantoblanco, Universidad Autonoma de Madrid, 28049 Madrid, Spain
*
Author to whom correspondence should be addressed.
Resources 2021, 10(12), 118; https://doi.org/10.3390/resources10120118
Submission received: 13 October 2021 / Revised: 17 November 2021 / Accepted: 20 November 2021 / Published: 23 November 2021
(This article belongs to the Special Issue Resource Recovery from Wastewater)

Abstract

:
This study assessed the breakdown of lignocellulosic biomass (LB) with the ionic liquid (IL) 1-ethyl-3-methylimidazolium acetate ([Emim][Ac]) as a pretreatment to increase the methane yield. The pretreatment was conducted for wheat straw (WS), barley straw (BS), and grape stem (GS) at 120 °C for 120 min, using several LB to [Emim][Ac] ratios (1:1, 1:3, and 1:5 w/w). Pretreatment significantly disrupted the lignocellulose matrix of each biomass into soluble sugars. GS showed the highest sugar yield, which was followed by WS, while BS was slightly hydrolyzed (175.3 ± 2.3, 158.2 ± 5.2, and 51.1 ± 3.1 mg glucose g–1 biomass, respectively). Likewise, the pretreatment significantly reduced the cellulose crystallinity index (CrI) of the resulting solid fractions of GS and WS by 15% and 9%, respectively, but slightly affected the CrI of BS (5%). Thus, BMP tests were only carried out for raw and hydrothermally and [Emim][Ac] (1:5) pretreated GS and WS. The untreated GS and WS showed similar methane yields to those achieved for the solid fraction obtained after pretreatment with an LB to [Emim][Ac] ratio of 1:5 (219 ± 10 and 368 ± 1 mL CH4 g–1 VS, respectively). The methane production of the solid plus liquid fraction obtained after IL pretreatment increased by 1.61- and 1.34-fold compared to the raw GS and WS, respectively.

1. Introduction

The European Union (EU) is at the forefront of renewable energy transition and efforts to tackle climate change. By 2017, the EU greenhouse gas (GHG) emissions had fallen to 78.3% of the 1990 levels, exceeding the target of a 20% cut outlined by the Paris Agreement by 2020 [1]. Over the next ten years, the EU plans to reduce the heating bill to achieve at least a 40% cut in GHG, as space heating and hot water alone account for 79% of the current energy usage (192.5 Mtoe) in households and 70.6% of the energy consumption (193.6 Mtoe) of industry [2]. The biogas industry plays an imperative role in this new milestone for European countries. Biogas, a mixture of approximately 60% methane and 40% carbon dioxide, produced from the anaerobic digestion (AD) of biomass, has long been rolled out in Europe as a renewable fuel for combined heat and power systems, turbines, and boilers [3]. Likewise, biomethane (upgraded biogas: approximately 96% methane and 4% propane) is now fed into the gas grid to reduce the housing and industry carbon footprints from heating, or it is compressed to fuel natural gas vehicles [4].
Approximately 18,000 biogas plants and 610 biomethane plants were in operation across Europe in 2016, which is a figure dominated by 12,500 installations running on energy crops and agricultural residues [5]. Nevertheless, the European Commission recently adopted the Renewable Energy Directive (RED II), which limits the cultivation of energy crops for biogas production beyond 2020 [6], aiming to avoid unnecessary GHG emissions (feedstock transportations, cultivation land use, and energy and fertilizer consumption) [7]. A prompt shortening in energy crop cultivation is forcing installations to keep up with biogas production yields in a scenario of limited feedstock supply and competition for agricultural residues. Additionally, due to the recalcitrant nature of lignocellulosic biomass, only 20–30% of agricultural residues (primarily extractives and hemicellulose) are converted into biogas [8,9]. Thus, there is a critical need to enhance the digestibility of such feedstock, which consists of a skeleton of semi-crystalline cellulose (40–50%) surrounded by a matrix of hemicellulose (25–30%), and lignin (15–20%), which serves as a protective layer [10,11].
Conventional chemical, biological, and thermal pretreatments have been escalated to full-scale applications [12], but with several demerits such as an inability to recycle solvents and the need for downstream neutralization in the case of acid or alkaline pretreatments [11]. Likewise, enzymatic hydrolysis entails long retention times [13], and thermal hydrolysis turns out to be expensive and leads to the formation of inhibitors [14]. A new generation of more sustainable pretreatments is currently under development [10], employing advanced oxidation processes such as photocatalysis [11], ultrasound [15], and microwaves [16]. Ionic liquids (ILs) have also received attention and recognition as a greener and recyclable alternative to conventional solvent pretreatments [17,18]. ILs possess interesting properties, such as a negligible vapor pressure that makes them safer for large-scale application, as no toxic or explosive gases are released [19]. The low volatility and high thermal stability of IL enable a high recovery efficiency (54–95%) and reuse of recovered ILs, even when pretreatments have been carried out at temperatures in the range of 120–150 °C [20].
Many ILs turn out to dissolve wood and other lignocellulosic biomass under mild thermal conditions, and the separation of cellulose from lignin can readily be achieved by the addition of a variety of precipitating solvents [21]. Studies have been oriented fundamentally to describe the cellulose de-crystallization mechanism and optimization of operational conditions (biomass to IL mixing ratios, temperature, reaction time, and biomass delignification yields) [22,23]. ILs with imidazolium cations, particularly with chloride, phosphate, and acetate anions, show a high capacity for cellulose dissolution [24,25]. For instance, 1-butyl-3-methyl imidazolium chloride ([Bmim][Cl]) produces a significant increase (30% by weight) in the hydrolysis efficiency of the carbohydrates of wheat straw compared to hydrothermal pretreatments [26]. The 1-ethyl-3-methyl imidazolium acetate ([Emim][Ac]) has been used for pretreating maple and wood flour, achieving a cellulose hydrolysis efficiency of 90% and a lignin extraction efficiency of 40% [27]. [Emim][AC] and [Emim][Cl] cause a substantial decrease in the lignin and hemicellulose content of several lignocellulosic biomasses (cotton stalks, hemp stalks, and acacia pruning) [28].
In this work, we studied the energy recovery by mesophilic anaerobic digestion of pretreated samples of wheat straw, barley straw, and grape stem with [Emim][Ac] at different mixing ratios (1:1, 1:3, and 1:5 w/w biomass to [Emim][Ac]). Prior to the anaerobic process, the breakdown of the crystalline structure of the lignocellulosic biomass and the production of fermentable reducing sugar during pretreatment were analyzed and related to the methane production. To date, the downstream valorization of IL-pretreated biomass has been oriented mainly to bioethanol and biodiesel production [29,30,31]. Thousands of scientific papers have been published about this topic since 2001 [32,33], and a limited number of studies relate to biogas production [34,35]. The literature shows some reports on the influence of pretreatment conditions (e.g., the alkyl chain length of IL, temperature, and time and operation cycle on lignocellulosic composition) on the methane yield [36,37].

2. Materials and Methods

2.1. Biomass Samples

Wheat straw (WS; Triticum vulgare), barley straw (BS; Hordeum vulgare), and grape stem (GS; Vitis vinifera) were the selected feedstock for IL pretreatment, considering their importance for the Spanish bioenergy market. Wheat and barley straw was collected from a farm (Madrid, Spain). Grape stem was provided by Alvinesa (Daimiel, Ciudad Real, Spain), which is a company focused on closing the full cycle of the grape. Each biomass was oven-dried at 105 °C overnight to remove moisture. The dried biomass samples were reduced in size in a basic microfine grinder (IKA MF 10) and subsequently sieved to a particle size of <25 μm using a sieve drum (OA SS203).

2.2. Ionic Liquid Pretreatment

[Emim][Ac], purchased from Ionic Liquid Technologies with a purity above 95%, was used for the pretreatment. For the assay, [Emim][Ac] was dissolved to 5%, 15%, and 25% (w/v) in deionized water. Each solution (40 mL) was mixed with dried biomass (2 g), which accounted for biomass to IL ratios of 1:1, 1:3, and 1:5 (w/w) (labeled as IL1, IL3, and IL5, respectively). The mixtures were prepared in 200 mL glass tubes and heated in a thermoreactor at 120 °C for 120 min [36]. To discard any possible hydrolytic effect of the water on the biomass solubilization, a hydrothermal pretreatment (HT) was conducted using the same operational conditions, but with the addition of 40 mL of deionized water instead of diluted IL.
At room temperature, the remaining biomass (solid fraction) was separated from the supernatant solution formed upon the reaction (containing water, ionic liquid, and dissolved biomass). The separation was carried by centrifugation in a Sigma 3-16L centrifuge ((Sigma; Osterode am Harz, Germany) at 6000 rpm for 10 min, which was followed by filtration (0.45 μm). The solid fraction was washed three times with deionized water (500 mL each) and then vacuum-filtered to remove any trace of IL on the solid surface. Afterward, the solid fraction was oven-dried (60 °C) overnight and stored at room temperature for further analysis. IL was recovered from the amber supernatant solution obtained after the separation of solids. Aliquots of the supernatant solution (10 mL) and anti-solvent (isopropanol, 10 mL) were mixed in flash beakers (200 rpm) at room temperature for 30 min, and then, the mixture was centrifuged at 4000 rpm for 5 min, obtaining an amber viscous precipitate and a translucent liquid phase. The isopropanol was removed from the translucent liquid phase using a rotatory evaporator at 55 °C. Finally, the water was removed by an oven at 60 °C overnight. More than 70% of the IL was recovered for each assay regardless of the initial biomass to IL ratio used.

2.3. Anaerobic Digestion Test

A biochemical methane potential (BMP) test was conducted for raw, HT-treated, and 1:5 [Emim][Ac]-treated wheat straw (labeled as WS Raw, WS HT, and WS IL5, respectively) and grape stem (labeled as GS Raw, GS HT, and GS IL5, respectively). The inoculum used was a granular anaerobic sludge from an industrial digester processing brewery wastewater under mesophilic conditions (35 °C). The inoculum characteristics were as follows: pH 7.3 ± 0.2, total solids (TS) 81.3 ± 2.5 g L–1, volatile solids (VS) 71.1 ± 2.1 g L–1, and total chemical oxygen demand (TCOD) 70.7 ± 1.7 g O2 L–1.
The experiment was carried out in triplicate in vials of 120 mL. Moreover, one more vial was prepared for each experiment to determine the relevant variables at the start of the process. The initial inoculum concentration was set to 15 g VS L–1 and the inoculum-to-substrate ratio (ISR) to 2:1 on a VS basis. Then, 7 mL of a basal medium containing macro- and micronutrients, prepared as described elsewhere [38], was added to discard the effect of nutrient availability on the inoculum performance and, therefore, the methane yields. Finally, distilled water was added to adjust to a working volume of 60 mL for each vial.
All batch reactors were sealed with rubber stoppers and metallic crimps, flushed for 3 min with N2, and incubated at 35 °C for 50 days in a thermostatic water bath shaker (80 rpm). Likewise, triplicate blank samples with no substrate were run to determine the background biogas from the inoculum, as well as triplicate starch (Panreac)-positive controls to confirm the inoculum activity. The specific methane production (SMP) was calculated by subtracting the amount of methane produced in the blank controls, from the methane production of each batch reactor, over the initial grams of VS added to each substrate.
Moreover, the theoretical methane yield from the sugar contained in the supernatant solution was derived from the theoretical chemical oxygen demand (ThCOD) of glucose (1.067 g O2 g–1). Taking into account that a gram of COD removed translates to a methane production of approximately 350 mL, the theoretical methane production of the supernatant solution was calculated with Equation (1):
CH 4   production th   mL   CH 4   g 1   biomass   = 373.45   ·   S   ·   V m
where the factor 373.45 results from the transformation of ThCOD of glucose into methane (mL CH4 g–1 glucose), S corresponds to the sugar content in the supernatant solution (g glucose mL–1), V is the volume of supernatant solution (mL), and m is the amount of pretreated raw biomass (g biomass).

2.4. Analytical Methods

The elemental composition (C, H, N, and S) of the raw biomass was determined by a CHNS analyzer (LECO CHNS-932; Geleen, The Netherlands), following the manufacturer’s standard procedures. The supernatant solution obtained after the centrifugation and filtration of solids was analyzed by the dinitrosalicylic acid technique for the quantification of reducing sugar [39]. The inoculum pH was measured using a Crison 20 Basic model pH meter. Meanwhile, the inoculum, raw, and pretreated biomasses were characterized by measuring TS and VS according to the standard 2540B and 2540E methods, respectively [40]. TCOD was determined according to the method proposed by Raposo et al. [41]. Sacrificed samples from AD runs, centrifuged and filtered through 0.45 µm, were analyzed for determining the pH; the partial and total alkalinity (PA and TA; by pH titration to 5.75 and 4.3, respectively); the intermediate alkalinity (IA; defined as the difference between TA and PA); the soluble COD (SCOD) by the standard method (5220D) [40]; and the total ammonia nitrogen (TAN) by distillation and titration according to the standard 4500E method [40]. Biogas production was quantified by the manometric method [42], measuring the pressure increase in each vial by an electronic pressure monitor (ifm, PN7097). The over reading in the biogas volume owing to the gas moisture was eliminated using Equation (2) [43]:
V 0 t r = V · P P w   ·   T 0 P 0 · T  
where V 0 t r is the volume of dry biogas under standard conditions (mL), V corresponds to the volume of biogas produced (mL), P is the pressure of the biogas phase at the time of reading (mbar), Pw is the vapor pressure as a function of environmental temperature (mbar), while P0 and T0 correspond to the standard pressure (1013 mbar) and temperature (273 K), respectively, and T corresponds to the environmental temperature at the time of reading. The gas composition (H2, H2S, CO2, and CH4) was determined by gas chromatography (Thermo Scientific Trace 1310; Waltham, MA, USA) with an 8 ft 1/8 inch stainless steel column packed with HayeSep Q 80/100 mesh and a thermal conductivity detector (TCD). The injection volume was 1 mL. The injector and detector temperatures were maintained at 110 and 150 °C, respectively. Helium was used as a carrier at a flow rate of 30 mL min–1. A standard gas (Praxair, S.A; composition: 7.35% H2, 3.01% H2S, 59.84% CH4, and 29.8% CO2) was used for system calibration [44].
Raw and pretreated samples were analyzed with an X-ray diffractometer (Panalytical X’pert PRO Theta/2Theta Diffractometer; Malvern, UK) equipped with a primary germanium monochromator to obtain a K alfa1 radiation from copper and an X’Celerator rapid detector operated at 45 kV/40 mA. The scans were collected from 2 θ = 8 to 40° with a step size of 0.02° at 1 s. The following empirical equation was adopted to estimate the cellulose crystallinity index (CrI) in the raw and pretreated samples [20]:
CrI   %   = ( I 002 I a m ) I o o 2 · 100
where I002 is the maximum intensity above baseline at 2 θ = 22 ° and Iam is the minimum in intensity above baseline 2 θ = 18 ° [28].
Thermogravimetric analysis (TGA) and derivative thermogravimetry (DTG) were performed using a thermogravimetric analyzer (TG 209, F3 Netzsch; Selb, Germany) to determine the moisture, ash, and volatile matter (VM) content, based on the ASTM (American Society for Testing and Materials) standard D7582 method [45]. Ten milligrams of the dry sample were placed in an Al2O3 crucible, which was heated from 50 to 900 °C at a heating rate of 10 °C min–1. The carrier gas used was high-purity N2 with a flow rate of 120 mL min–1. The mass loss percentage (%) was determined from TGA curves, where the onset temperature (T onset) was defined as the temperature at which the weight loss begins, and the end weight (%) was determined at 700 °C.

3. Results

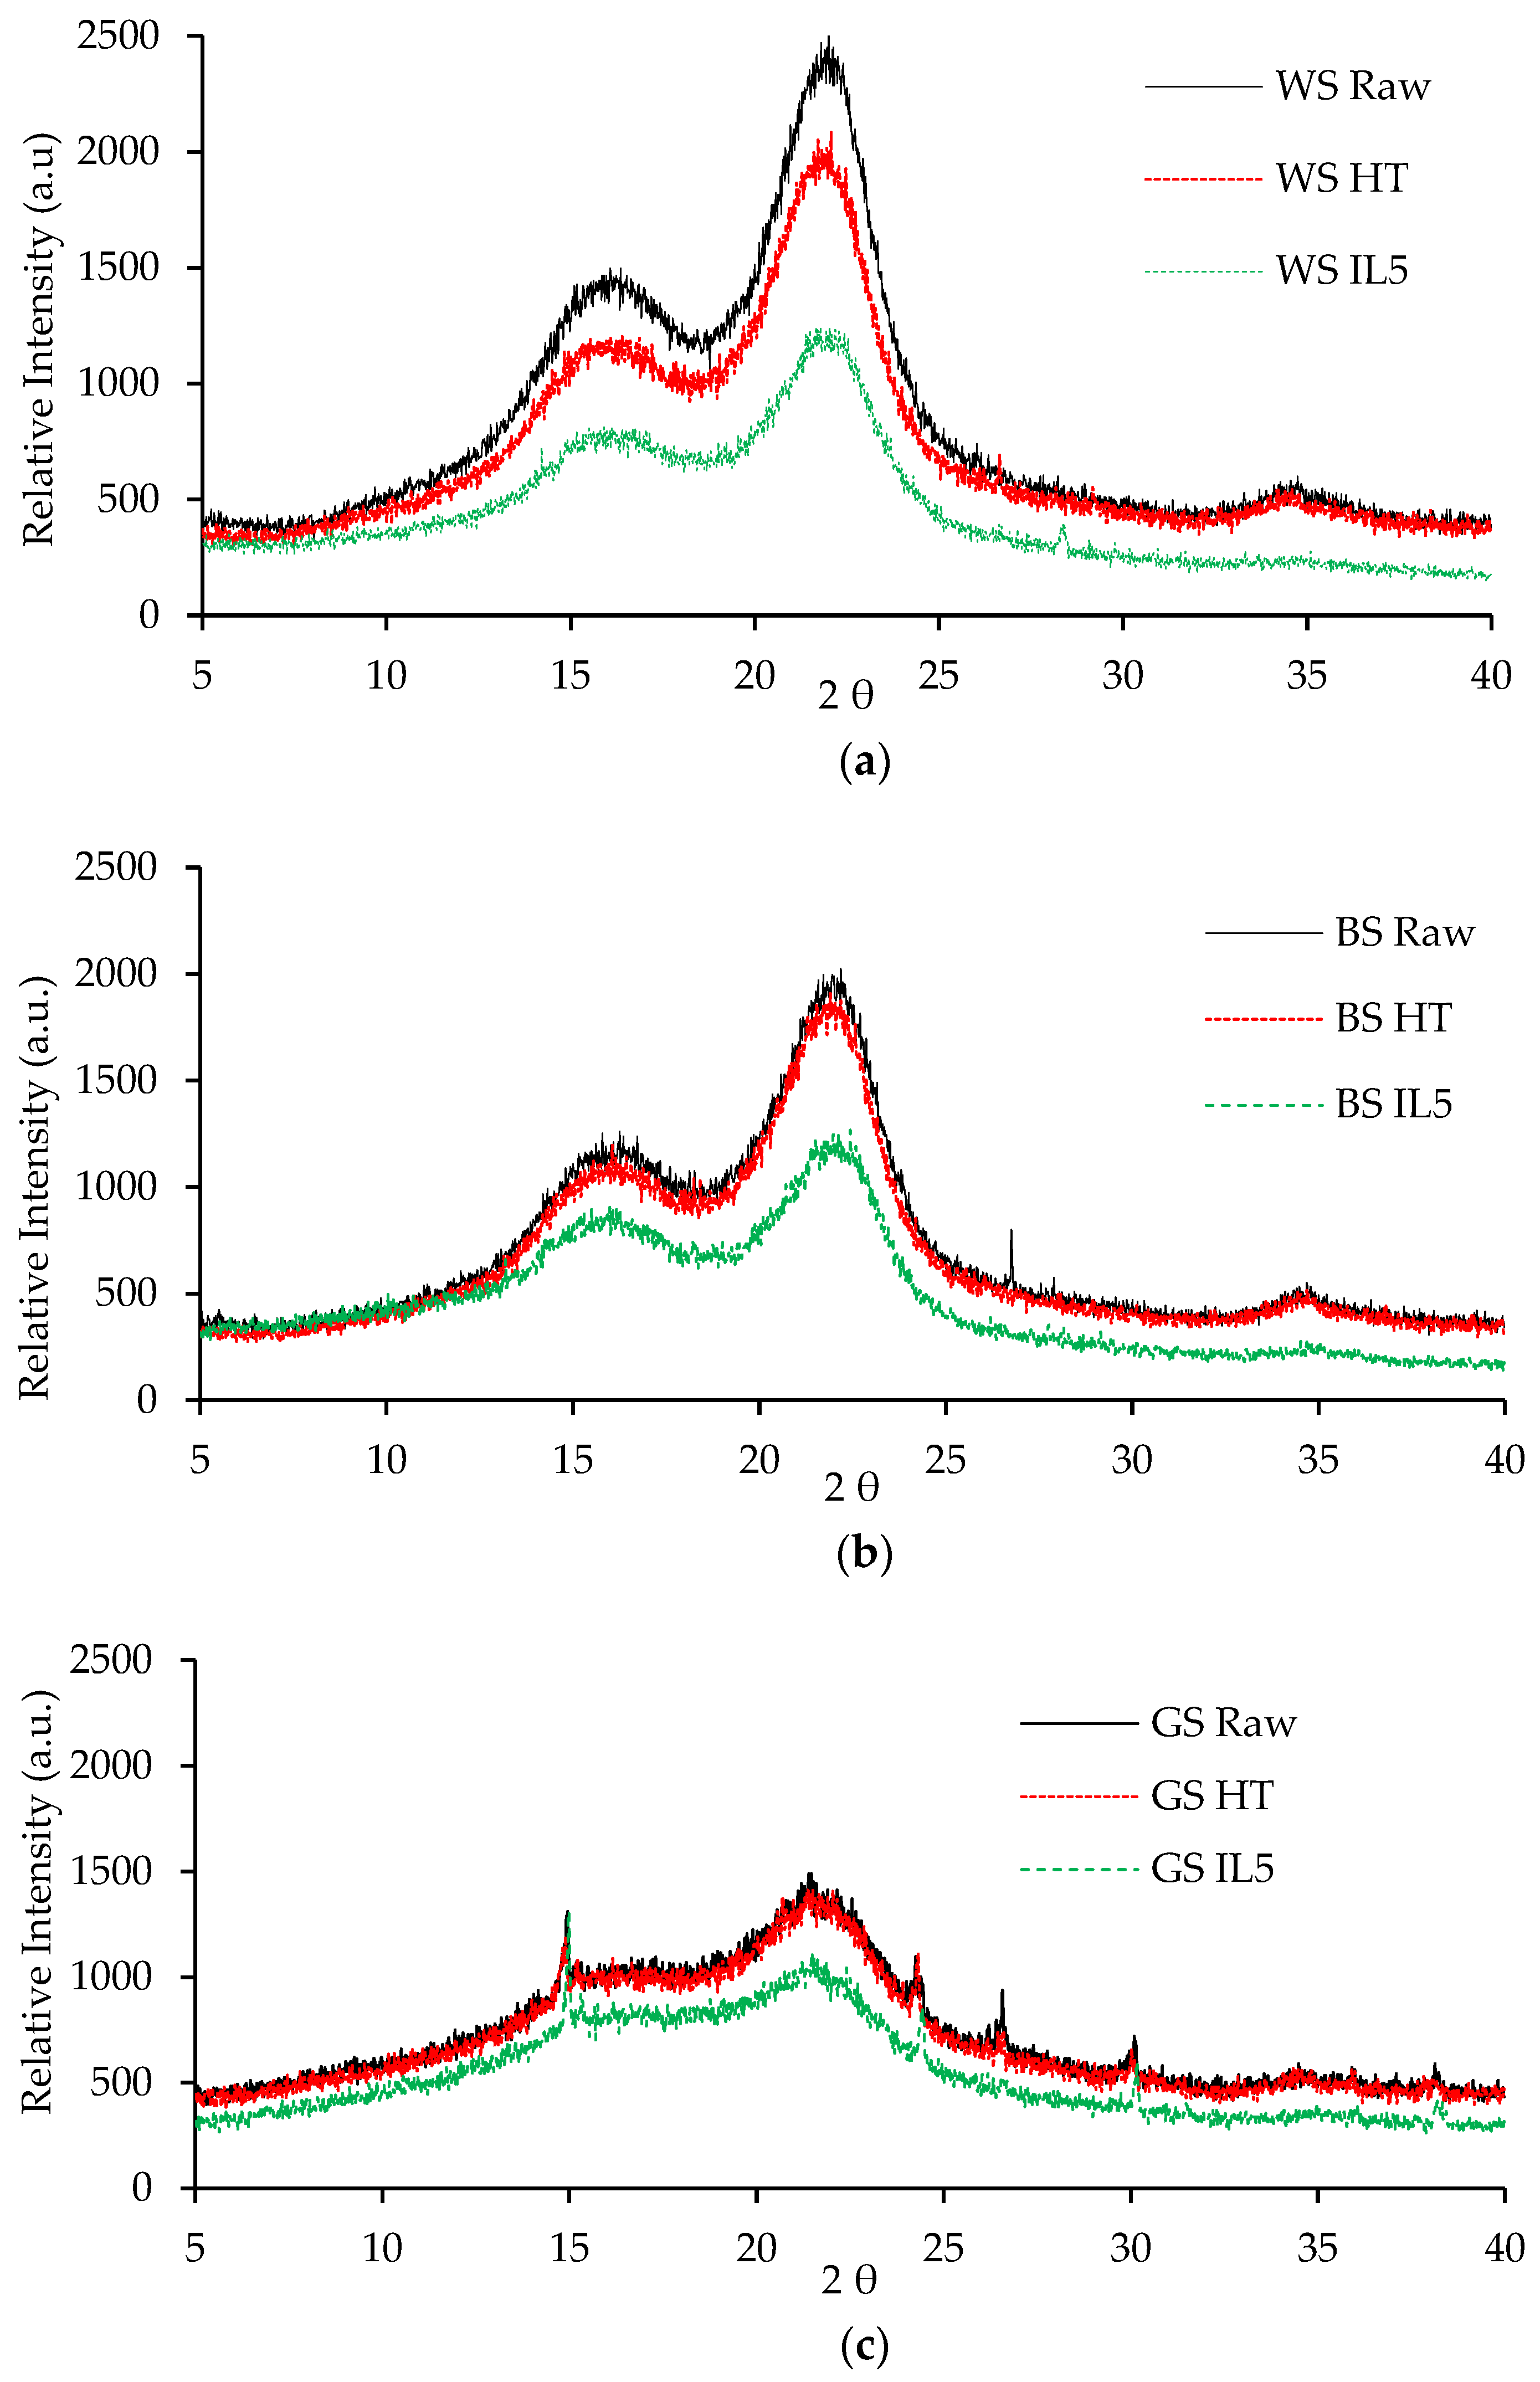
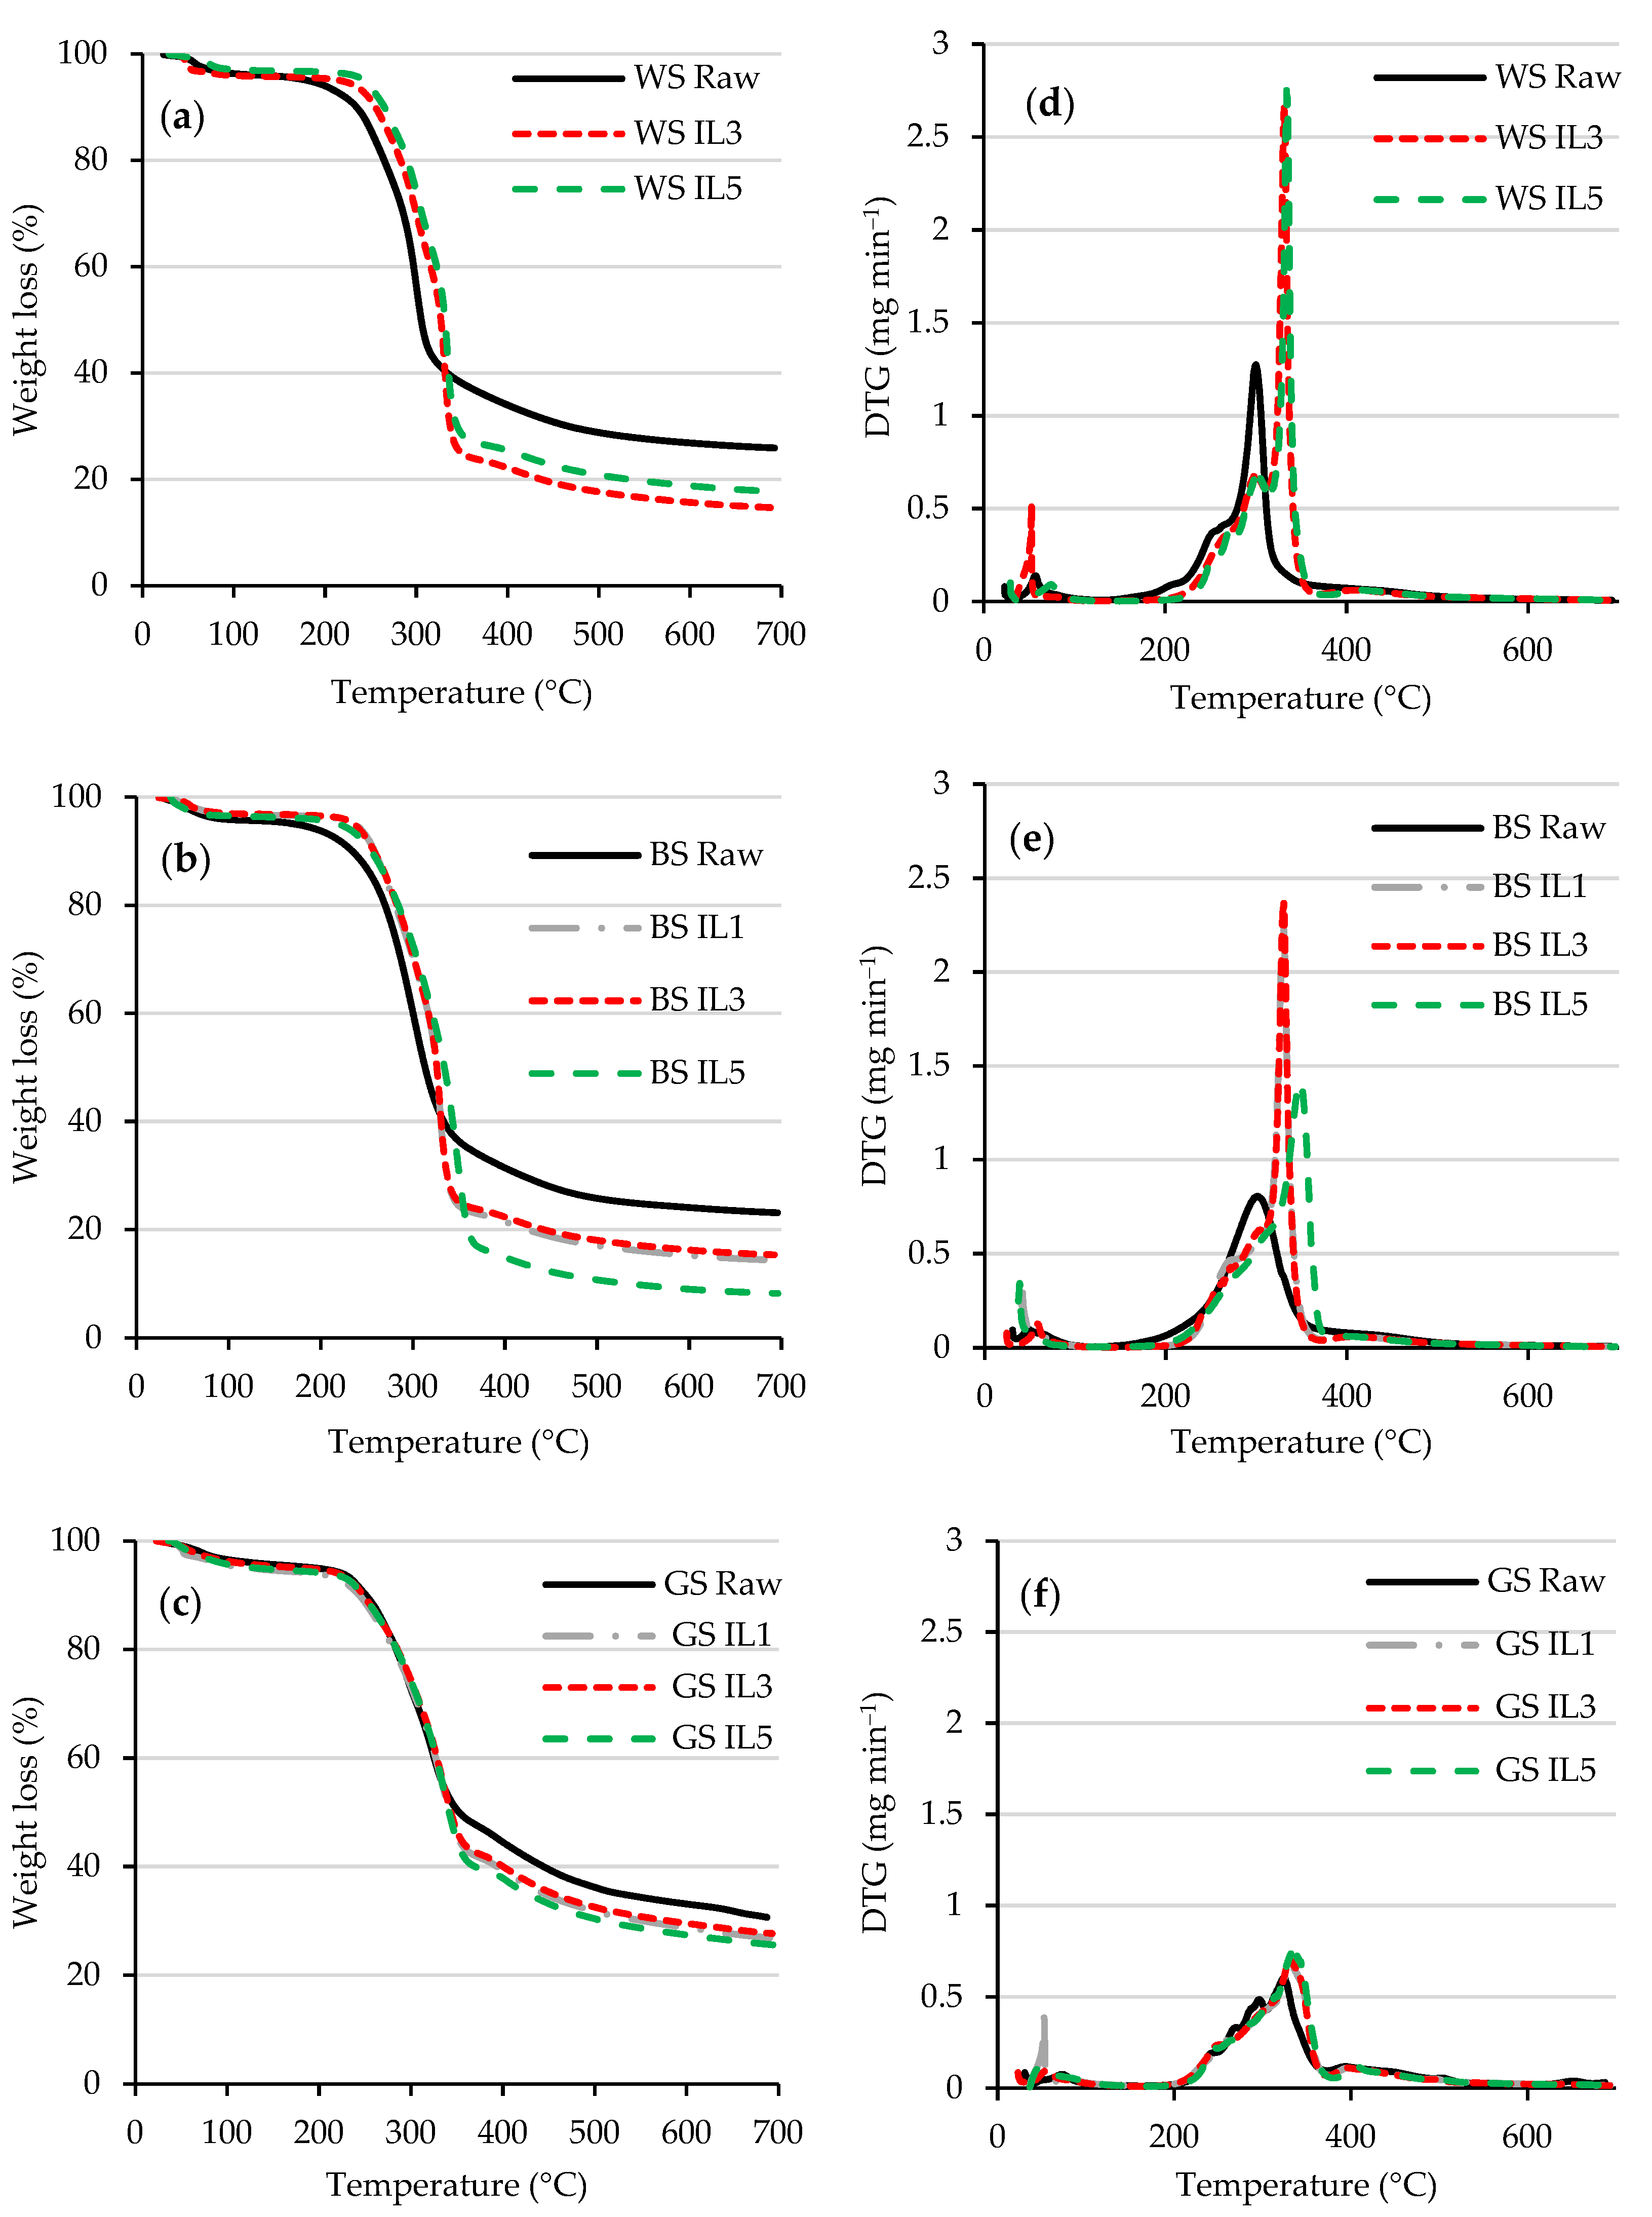
3.1. Characterization of Raw and Pretreated Biomass

Table 1 shows the characteristics of the wheat straw, barley straw, and grape stem, providing insight into these three lignocellulosic materials. Both straws showed roughly similar TS, VS, and TCOD. Similarly, both straws showed similar C contents, but the grape stem exhibited higher nitrogen, carbon, and lower volatile matter contents. After heating up to 700 °C, the remaining ash residue (shown as ash in Table 1) was around 9.7% for the wheat straw and 24% for the grape stem. The number of fiber residues left after 550 °C (shown as VM in Table 1) was different for each lignocellulosic material, presumably due to variations in the content of hemicellulose, cellulose, and lignin [19].
Figure 1 shows the XRD profiles of the raw and pretreated lignocellulosic biomass after the HT and IL5 treatments. The XRD diffractograms show a weak peak around the 2 θ range 15–18°, representing amorphous material (Iam), and a second sharp peak around 22° assigned to I002, representing the crystalline material of cellulosic fibers, which are characteristic of the typical forms of native cellulose I found in most natural fibers [46,47].
Table 2 shows the crystallinity index calculated after the deconvolution of amorphous and crystalline peaks in each XRD diffractogram. Both raw straws displayed a prominent peak at 22.2°, which was related to a high CrI, with values of 54.8% and 53.8% for WS and BS, respectively. On the contrary, GS displayed a lower peak at 22.2° and, therefore, a CrI of 32.5%, which was akin to the poorer structural order in the cellulose I chain of GS [48]. After HT pretreatment, almost no changes were observed in the diffractogram patterns, which means that the crystalline structure of cellulose I was not affected. The CrI reduction was around 0.4% and 1.2% for BS and GS, respectively, while the CrI of WS remained almost constant. Consequently, a hydrolytic effect of the water on the biomass solubilization was discarded. IL pretreatment substantially decreased the intensity of the peak at 22° in all of the samples (Figure 1), which reduced the Crl in the pretreated samples. Likewise, an increase in the concentration of [Emim][Ac] resulted in a higher percentage of Crl reduction (Table 2). The highest biomass to [Emim][Ac] ratio (1:5 w/w) led to the highest percentage of Crl reduction in WS (8.8%), BS (5.4%), and GS (15.4%). The reduction in Crl likely occurs because of [Emim][Ac] hydrolyzing cellulose into ionized monosaccharides (e.g., such as beta-glucose or shorter polysaccharides and oligosaccharides), which re-crystallize into cellulose II [28].
The thermal decomposition of ionic liquids during pretreatment is a critical issue, as decomposed ionic liquids can alter the efficiency of lignocellulose pretreatment [49]. To confirm the thermal stability of [Emim][Ac], a TG analysis was performed. [Emim][Ac] showed a net weight loss of 0.4% in a wide temperature range (25–700 °C) and time (2 h). This weight loss corresponded to moisture, as it occurred below 120 °C (data not shown). Therefore, this analysis suggests that the thermal decomposition of ionic liquids can be dismissed.
Figure 2 shows the weight loss (a, b, and c) or TG curves and the derivative thermogravimetric (DTG) curves (d–f) for the raw and [Emim][Ac] pretreated WS, BS, and GS. The weight loss curves exhibited onset temperatures in the range of 225–235 °C for the three raw materials (Figure 2a–c), whereas a slight increase up to 240–250 °C was observed for both of the pretreated straws (WS and BS). This increase can be explained in terms of the removal of minerals and volatile components, which decompose earlier than the lignocellulosic matrix [19]. Moreover, the increment in the Tmax values could also be affected by the increment in the cellulose content after the pretreatment [22]. However, no significant differences among the onset temperatures of the raw and pretreated GS were observed. The second weight loss, which occurred from 225 to 330 °C, might be due to cellulosic degradation owing to several processes, such as the depolymerization or decomposition of glycosylic units, confirming the presence of cellulosic material [50]. The analysis of combustion behavior also suggests changes in the chemical composition of the lignocellulosic matrix of the samples upon [Emim][Ac] pretreatment. Generally, the thermal decomposition of lignocellulosic biomass is characterized by three major distinctive zones. The first one (temperature range of ≈50–150 °C) is attributed to the removal of moisture and light volatile compounds clamped by surface tension [51]. The second zone covers a temperature range of 150–450 °C and represents the devolatilization of hemicellulose (DTG peak observed between 200 and 350 °C) and cellulose (DTG peak observed between 330 and 370 °C) in biomass [52]. The third zone (450–600 °C) is mainly deemed the thermal decomposition of lignin, which occurs over a wide temperature span of 280–600 °C overlapping partially with hemicellulose [19].
According to the DTG curves (Figure 2d–f), weight loss due to evaporation accounted for 4.5–6% of the mass of each biomass. Region II (200–400 °C) exhibited sharp decreases in mass with losses of approximately 60.0%, 62.4%, and 50.4% for the raw materials (WS, BS, and GS, respectively). For [Emim][Ac]-treated WS, the peaks corresponding to cellulose degradation occurred at 331–339 °C (for IL3 and IL5, respectively), which was significantly higher than that of the untreated WS (300 °C) (Figure 2d) and corresponded to higher mass loss in region II of up to ≈72%. The same behavior was observed for BS (Figure 2e), with an increase in the cellulose peak degradation from 301 °C for the raw material to 329, 330, and 348 °C for the IL1, IL3, and IL5 pretreated biomass, respectively, and a mass loss of 75% in region II was also observed. GS showed a slight increase from 324 to 335 °C for GS IL3 pretreated biomass compared with untreated biomass (Figure 2f), as well as mass losses of 55%. This increase in temperature from untreated to pretreated biomass represents a partial cellulose removal because of [Emim][Ac] pretreatment, which was supported by an increase in mass loss.
The above-mentioned mass loss also includes hemicellulose removal. ILs also have the ability to dissolve hemicellulose, which is corroborated by the TG data of the pretreated biomasses, where the inflexion representing hemicellulose decomposition (temperature range of 250–280 °C) moved to a higher temperature value, as compared to the untreated lignocellulose biomass. This is especially clear for WS, where an increase in the hemicellulose decomposition peak from 250 to 273 °C was noticed. The temperature increase for GS was exceedingly small, only 9 °C: from 240 to 249 °C. For BS, a peak for hemicellulose could not be detected, although it could be identified for pretreated biomass between 270 (IL1 and IL3) and 285 °C (IL5).

3.2. Fermentable Reducing Sugar in the Supernatant Solution

Table 3 summarizes the sugar yield of each biomass after HT and [Emim][Ac] pretreatments. For pretreated LB, a high migration to the liquid fraction (LF) of easily and degradable molecules such as hemicellulose was observed, with a corresponding increase in the sugar yield. In the case of WS, a high conversion of sugars was achieved not only for IL5 but also after HT pretreatment (158 ± 5 and 123 ± 1 mg glucose g–1 biomass, respectively). However, GS showed a remarkable response to the [Emim][Ac] pretreatment, increasing the sugar yield of the HT pretreatment up to 4.13-fold, which showed the effectiveness of [Emim][Ac] to weaken the lignocellulosic structure of GS. Finally, although the sugar yield for BS was in the same range of GS for HT pretreatment (40–50 mg glucose g–1 biomass), only a slight increase (14%) was observed after IL5 pretreatment.
Under the studied conditions, BS showed a low response to the [Emim][Ac] pretreatment, indicating that the cellulose of BS would be only 5% more available to be digested than in the raw material, and a low sugar yield was reached. More severe conditions, as used by Padrino et al. [46] (ratio 1:19, BS/IL w/w, at 105 °C for 7.5 h), can reach the complete dissolution of BS. A soft pretreatment, as used in our study, was not enough to hydrolyze the main biomass components; therefore, only GS and WS were selected for the methane potential experiments of solid fractions.

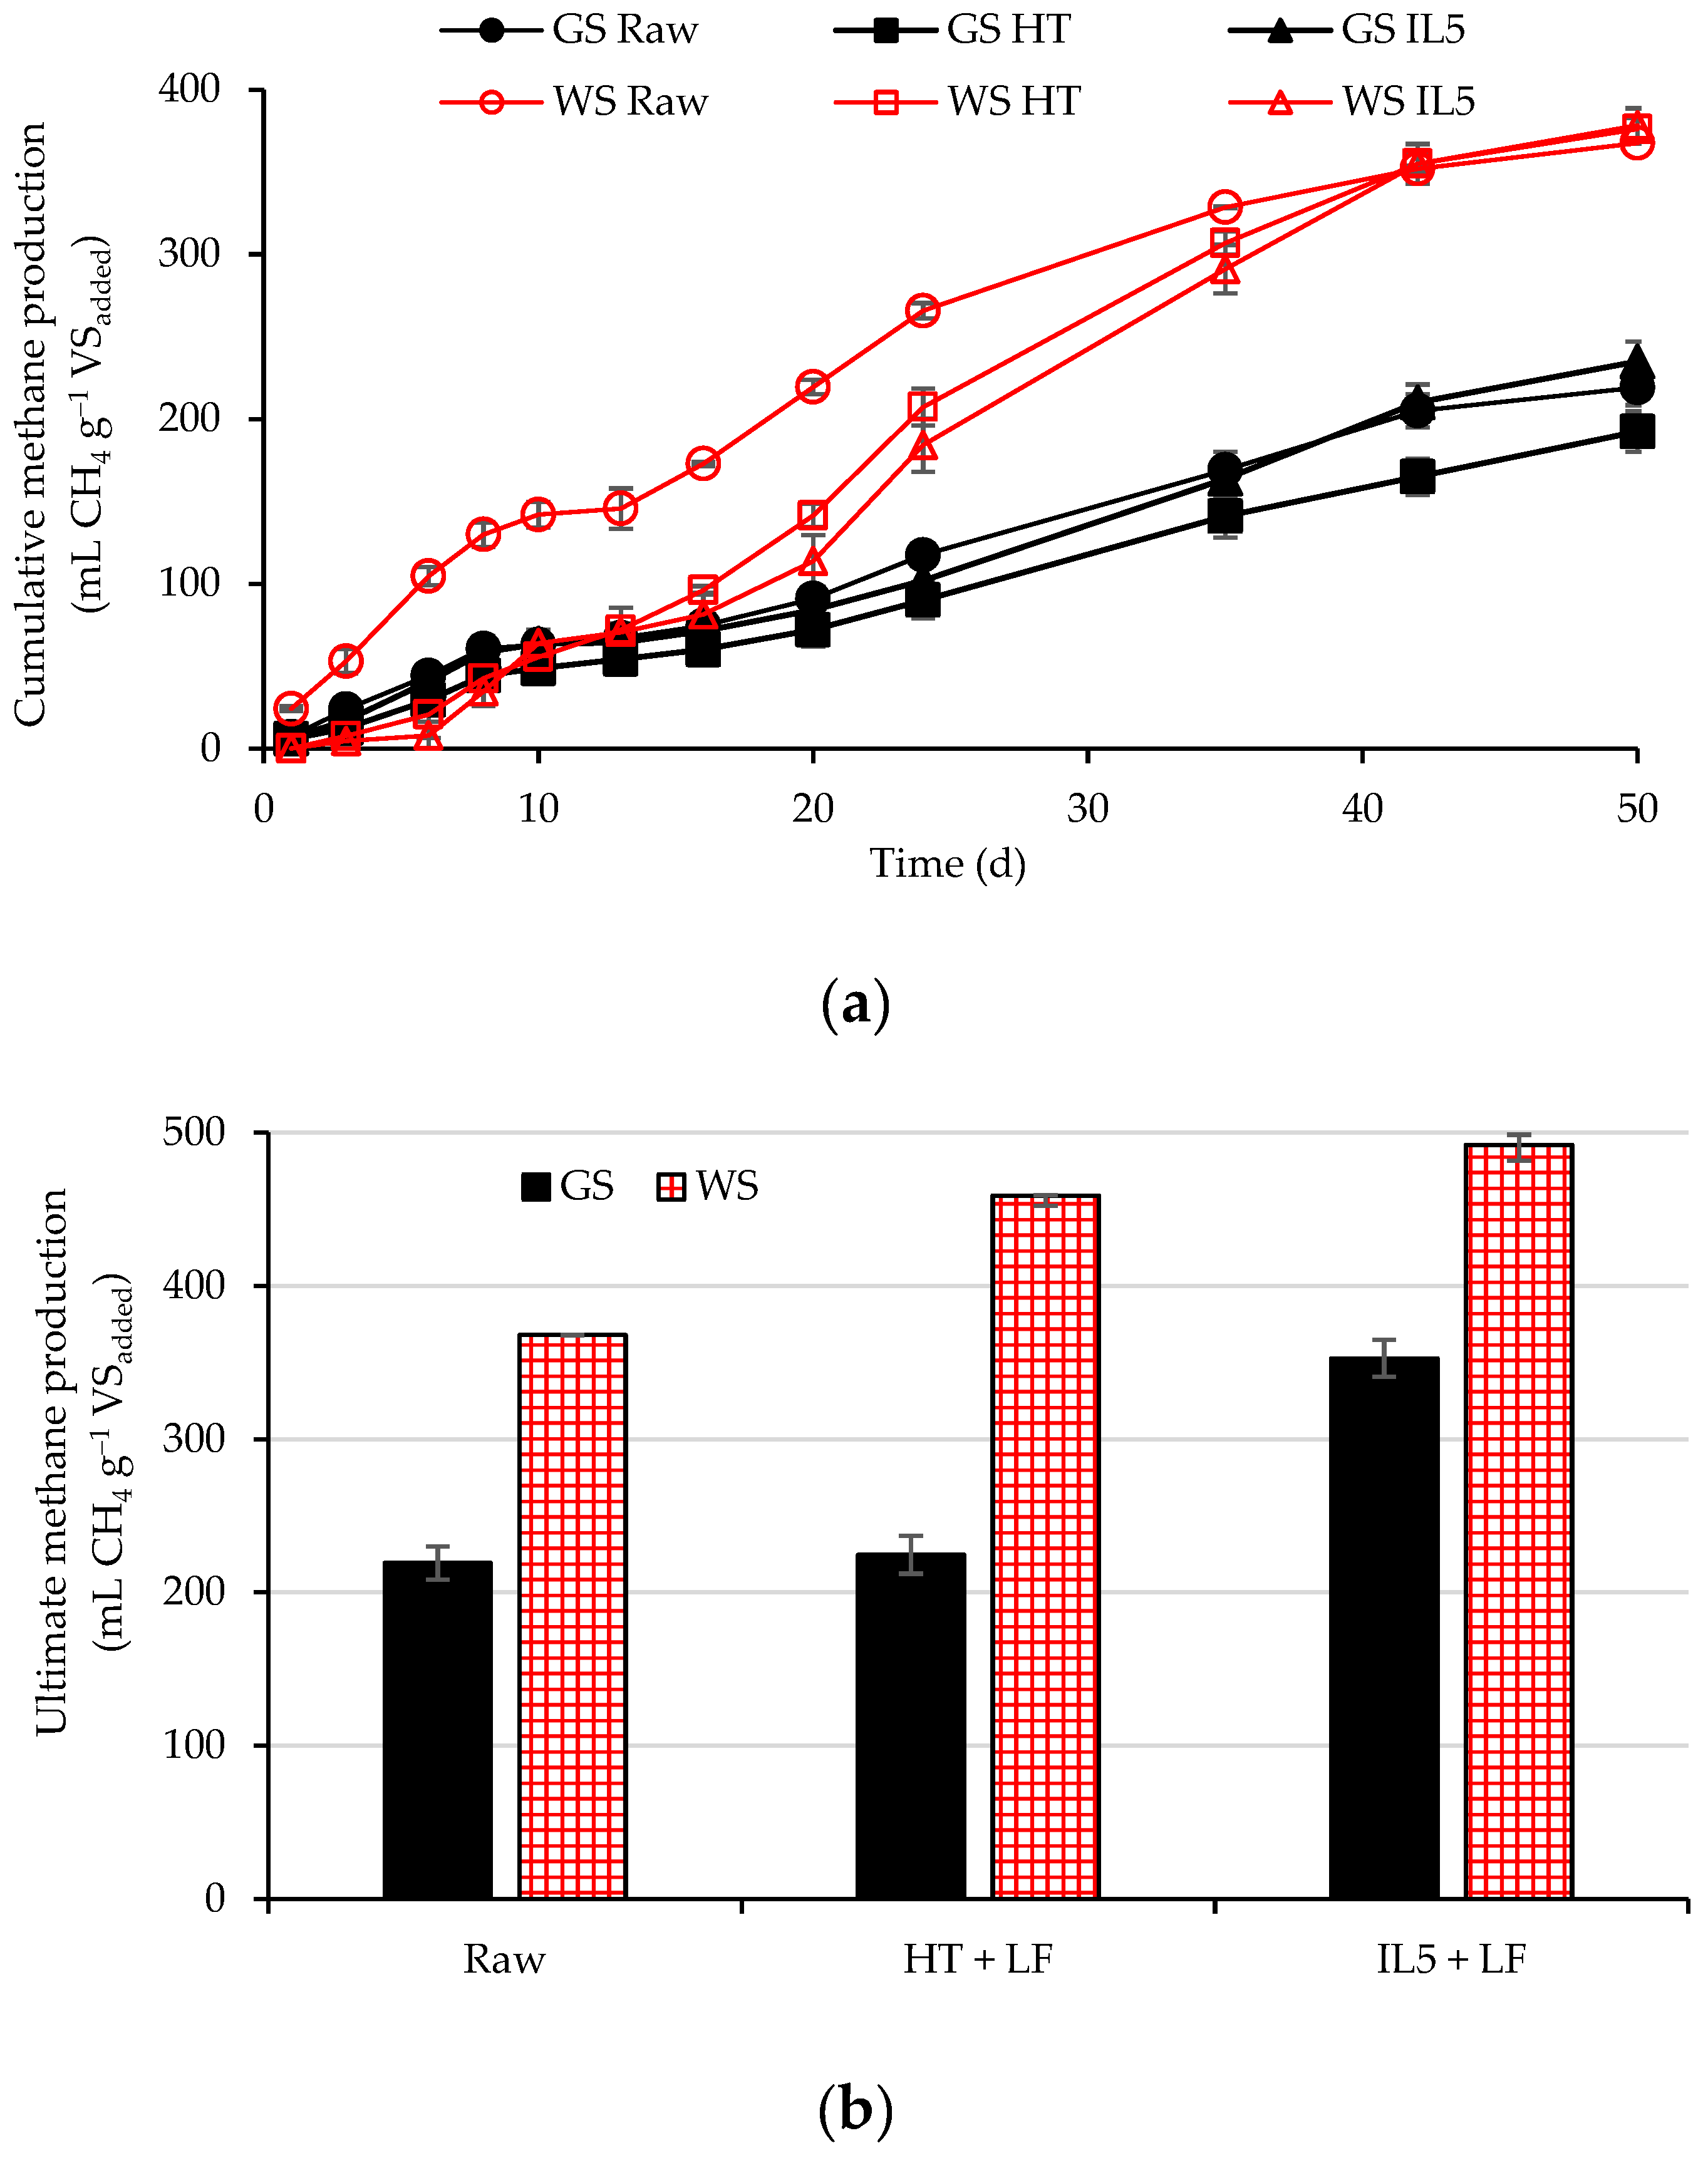
3.3. Anaerobic Digestion Assays

The intermediate total alkalinity, IA/TA ratio, and ammoniacal nitrogen from the AD experiments are presented in Table 4. For all runs, the pH varied slightly within the range of 7.0–7.8, which is an adequate level for the growth of methanogens [38]. For all of the cases, the values of TA were initially lower than 700 mg CaCO3 L–1 and increased to around three times the initial values at the end of the runs. The concentration of TAN increased along with TA, suggesting a growing trend for the hydrolysis of total Kjeldahl nitrogen (TKN) in all cases, with larger TKN degradation rates for [Emim][Ac]-pretreated samples. The final TA values were around 2.5 g CaCO3 L–1, which provided enough buffering capacity to counteract changes in the pH due to an increase in the VFA concentration. Therefore, the anaerobic process performed stably and was well buffered, which was confirmed by the intermediate to total alkalinity ratio (IA/TA) being below 0.3, which is recommended for the good stability of the process [38]. At the end of the experiment, all of the samples showed an IA/TA ratio below 0.15, even though the raw WS sample started above the limit value.
The cumulative methane production of the raw materials and solid fractions of WS and GS after the HT and IL5 pretreatments are shown in Figure 3a. The raw and HT and IL5 pretreated WS showed similar amounts of methane production. An 8.8% CrI reduction did not enhance the digestibility and, therefore, did not improve the methane production. In the case of GS, hydrothermal pretreatment decreased the methane production by 12% compared to raw GS, which was most likely due to the migration of easily and degradable molecules to the liquid fractions, as reported by Papa et al. [36] after corn stover and switchgrass HT pretreatment. On the contrary, the methane production of GS slightly increased by 7% after IL5 pretreatment, which was ascribed to a 15% reduction in Crl. The final production was much higher for WS than those for GS (378 ± 10 and 235 ± 11 mL CH4 g–1 VS, respectively). This is related to the higher, two-fold, initial cellulose content of WS. In any case, the methane production obtained in this study was higher than those obtained after [Emim][Cl] pretreatment (2 h, 120 °C) of water hyacinth and spruce (112, and 141 mL CH4 g–1 VS, respectively) [20] and closer to those obtained after [Emim][Ac] pretreatment (3 h, 100 °C) of corn stover and switchgrass (289 ± 6 and 242 ± 6 mL CH4 g–1 VS, respectively) [36]. This could be due to the low particle size (<25 μm) used in this study, which allows significant methane yields without the need for a chemical pretreatment [53]. Conversely, the pretreatment of tomato pomace with [Emim][AC] did not lead to an improvement in methane yield, because pretreated samples lacked hemicellulose and consisted of a lignin skeleton that is hard to process via AD [23].
Based on the above results, IL pretreatment does not appear to be a viable option for improving the methane production of the solid fraction of WS and GS. Thus, a theoretical biodegradability analysis for the sugars contained in the supernatant solution was conducted to determine its suitability as a substrate for supplementing the AD of solid fractions.
Figure 3b compares the methane production of the raw samples to the final methane production (experimental methane production of the solid fractions plus theoretical methane production of liquid fractions, calculated by Equation (2)) from the HT and [Emim][Ac] pretreatments. Consequently, the experimental methane production obtained after the HT and IL5 pretreatments increased 1.61- and 1.34-fold for GS and WS, respectively. These results suggest that HT and [Emim][Ac] pretreatments generate liquid streams rich in organic molecules that can produce biogas.

4. Conclusions

In this study, [Emim][Ac] was assessed as a pretreatment for the anaerobic digestion of lignocellulosic biomass. [Emim][Ac] did not lead to significant changes in the crystallinity index of cellulose or the degradation temperature (thermogravimetric analysis) of the treated samples. A lignocellulosic biomass to [Emim][Ac] ratio of 1:5 w/w reduced the crystallinity of wheat straw and grape stem by only 5%. Consequently, no increase in methane production of the solid fractions from [Emim][Ac] pretreatment was observed with respect to the feedstocks. However, the pretreatment also produced a liquid fraction with a sugar content of 158–188 mg glucose g–1 biomass. If the methane production of samples pretreated with [Emim][Ac] and the potential methane production of the liquid fractions were added together, the total energy that could be recovered per kilogram of volatile solids could be higher (34% and 61% for wheat straw and grape stem, respectively) than the energy recovered from the AD of the raw lignocellulosic biomass. This procedure supports the technical feasibility of ILs as a pretreatment to enhance the anaerobic digestion of lignocellulosic biomass. Future studies involving fundamental mass and energy balances are required to understand the sustainability and economic feasibility of [Emim][Ac] pretreatment.

Author Contributions

Conceptualization, J.D.M.-B. and A.d.l.R.; methodology, J.D.M.-B. and A.d.l.R.; validation, J.D.M.-B., A.F.M. and A.d.l.R., formal analysis, J.D.M.-B. and A.d.l.R.; investigation, J.D.M.-B.; resources, J.D.M.-B., A.F.M. and A.d.l.R.; data curation, J.D.M.-B., A.F.M. and A.d.l.R.; writing—original draft preparation, A.d.l.R.; writing—review and editing, J.D.M.-B., A.F.M. and A.d.l.R.; visualization, J.D.M.-B., A.F.M. and A.d.l.R.; supervision, A.F.M. and A.d.l.R.; project administration, A.F.M. and A.d.l.R.; funding acquisition, J.D.M.-B., A.F.M. and A.d.l.R. All authors have read and agreed to the published version of the manuscript.

Funding

This research was funded by MICINN (PID2019-108445RB-I00) and the Madrid Regional Government (Project S2018/EMT-4344). Instituto Colombiano de Crédito Educativo y Estudios Técnicos en el Exterior (ICETEX, Colombia) awarded a grant to José D. Marin-Batista.

Institutional Review Board Statement

Not applicable.

Informed Consent Statement

Not applicable.

Data Availability Statement

The study did not report any data.

Acknowledgments

The authors thank U. Cadaval and R.P Ipiales for their valuable help.

Conflicts of Interest

The authors declare no conflict of interest.

References

  1. Eurostat. Smarter, Greener, More Inclusive? Indicators to Support the Europe 2020 Strategy; Publications Office of the European Union: Luxembourg, 2019; pp. 2–112. [Google Scholar] [CrossRef]
  2. European Commission. Mapping and Analyses of the Current and Future (2020–2030) of Heating/Cooling Fuel Deployment (Fossil/Renewables); European Commission: Brussel, Belgium, 2018. [Google Scholar]
  3. Hoo, P.Y.; Hashim, H.; Ho, W.S. Opportunities and challenges: Landfill gas to biomethane injection into natural gas distribution grid through pipeline. J. Clean. Prod. 2018, 175, 409–419. [Google Scholar] [CrossRef]
  4. Horschig, T.; Adams, P.W.R.; Gawel, E.; Thrän, D. How to decarbonize the natural gas sector: A dynamic simulation approach for the market development estimation of renewable gas in Germany. Appl. Energy 2018, 213, 555–572. [Google Scholar] [CrossRef]
  5. Peters, D.; Van der Leun, K.; Terlouw, W.; van Tilburg, J.; Berg, T.; Schimmel, M.; Van der Hoorn, I.; Buseman, M.; Staats, M.; Schenkel, M.; et al. Gas Decarbonisation Pathways 2020–2050: Gas for Climate; Guidehouse Stadsplateau 15: Utrecht, The Netherlands, 2020. [Google Scholar]
  6. European Parliament. Directive. (EU) 2018/2001 of the European Parliament and of the Council of 11 December 2018 on the promotion of the use of energy from renewable sources. Off. J. Eur. Union 2018, L328, 82–209. [Google Scholar]
  7. Bedoić, R.; Jurić, F.; Ćosić, B.; Pukšec, T.; Čuček, L.; Duić, N. Beyond energy crops and subsidised electricity—A study on sustainable biogas production and utilisation in advanced energy markets. Energy 2020, 201, 117651. [Google Scholar] [CrossRef]
  8. Phuttaro, C.; Sawatdeenarunat, C.; Surendra, K.C.; Boonsawang, P.; Chaiprapat, S.; Khanal, S.K. Anaerobic digestion of hydrothermally-pretreated lignocellulosic biomass: Influence of pretreatment temperatures, inhibitors and soluble organics on methane yield. Bioresour. Technol. 2019, 284, 128–138. [Google Scholar] [CrossRef] [PubMed]
  9. Lee, S.H.; Doherty, T.V.; Linhardt, R.J.; Dordick, J.S. Impact of hydrothermal pretreatment on anaerobic digestion efficiency for lignocellulosic biomass: Influence of pretreatment temperature on the formation of biomass-degrading byproducts. Chemosphere 2020, 256, 127116. [Google Scholar] [CrossRef] [PubMed]
  10. Abraham, A.; Mathew, A.K.; Park, H.; Choi, O.; Sindhu, R.; Parameswaran, B.; Pandey, A.; Park, J.H.; Sang, B.I. Pretreatment strategies for enhanced biogas production from lignocellulosic biomass. Bioresour. Technol. 2020, 301, 122725. [Google Scholar] [CrossRef] [PubMed]
  11. Sabeeh, M.; Zeshan; Liaquat, R.; Maryam, A. Effect of alkaline and alkaline-photocatalytic pretreatment on characteristics and biogas production of rice straw. Bioresour. Technol. 2020, 309, 123449. [Google Scholar] [CrossRef]
  12. Fjørtoft, K.; Morken, J.; Hanssen, J.F.; Briseid, T. Pre-treatment methods for straw for farm-scale biogas plants. Biomass Bioenerg. 2019, 124, 88–94. [Google Scholar] [CrossRef]
  13. Govumoni, S.P.; Koti, S.; Kothagouni, S.Y.; Venkateshwar, S.; Linga, V.R. Evaluation of pretreatment methods for enzymatic saccharification of wheat straw for bioethanol production. Carbohydr. Polym. 2013, 91, 646–650. [Google Scholar] [CrossRef]
  14. Rajput, A.A.; Zeshan; Hassan, M. Enhancing biogas production through co-digestion and thermal pretreatment of wheat straw and sunflower meal. Renew. Energy 2021, 168, 1–10. [Google Scholar] [CrossRef]
  15. Gunes, B.; Stokes, J.; Davis, P.; Connolly, C.; Lawler, J. Modelling and optimisation of the biogas yield after hybrid alkaline-ultrasonic pre-treatment in the early stages of anaerobic digestion of pot ale to shorten the processing time. Process. Saf. Environ. Prot. 2021, 146, 43–53. [Google Scholar] [CrossRef]
  16. Zieliński, M.; Kisielewska, M.; Dudek, M.; Rusanowska, P.; Nowicka, A.; Krzemieniewski, M.; Kazimierowicz, J.; Dębowski, M. Comparison of microwave thermohydrolysis and liquid hot water pretreatment of energy crop Sida hermaphrodita for enhanced methane production. Biomass Bioenerg. 2019, 128, 105324. [Google Scholar] [CrossRef]
  17. Usmani, Z.; Sharma, M.; Gupta, P.; Karpichev, Y.; Gathergood, N.; Bhat, R.; Gupta, V.K. Ionic liquid based pretreatment of lignocellulosic biomass for enhanced bioconversion. Bioresour. Technol. 2020, 304, 123003. [Google Scholar] [CrossRef] [PubMed]
  18. Millati, R.; Wikandari, R.; Ariyanto, T.; Putri, R.U.; Taherzadeh, M.J. Pretreatment technologies for anaerobic digestion of lignocelluloses and toxic feedstocks. Bioresour. Technol. 2020, 304, 122998. [Google Scholar] [CrossRef]
  19. Mahmood, H.; Moniruzzaman, M.; Yusup, S.; Akil, H.M. Pretreatment of oil palm biomass with ionic liquids: A new approach for fabrication of green composite board. J. Clean. Prod. 2016, 126, 677–685. [Google Scholar] [CrossRef]
  20. Gao, J.; Chen, L.; Yuan, K.; Huang, H.; Yan, Z. Ionic liquid pretreatment to enhance the anaerobic digestion of lignocellulosic biomass. Bioresour. Technol. 2013, 150, 352–358. [Google Scholar] [CrossRef]
  21. Weerachanchai, P.; Lee, J.M. Recovery of lignin and ionic liquid by using organic solvents. J. Ind. Eng. Chem. 2017, 49, 122–132. [Google Scholar] [CrossRef]
  22. Financie, R.; Moniruzzaman, M.; Uemura, Y. Enhanced enzymatic delignification of oil palm biomass with ionic liquid pretreatment. Biochem. Eng. J. 2016, 110, 1–7. [Google Scholar] [CrossRef]
  23. Allison, B.J.; Cádiz, J.C.; Karuna, N.; Jeoh, T.; Simmons, C.W. The effect of ionic liquid pretreatment on the bioconversion of tomato processing waste to fermentable sugars and biogas. Appl. Biochem. Biotechnol. 2016, 179, 1227–1247. [Google Scholar] [CrossRef]
  24. Vitz, J.; Erdmenger, T.; Haensch, C.; Schubert, U.S. Extended dissolution studies of cellulose in imidazolium based ionic liquids. Green Chem. 2009, 11, 417–424. [Google Scholar] [CrossRef]
  25. Brandt, A.; Gräsvik, J.; Hallett, J.P.; Welton, T. Deconstruction of lignocellulosic biomass with ionic liquids. Green Chem. 2013, 15, 550–583. [Google Scholar] [CrossRef] [Green Version]
  26. Liu, L.; Chen, H. Enzymatic hydrolysis of cellulose materials treated with ionic liquid [BMIM] Cl. Chin. Sci. Bull. 2006, 51, 2432–2436. [Google Scholar] [CrossRef]
  27. Lee, S.H.; Doherty, T.V.; Linhardt, R.J.; Dordick, J.S. Ionic liquid-mediated selective extraction of lignin from wood leading to enhanced enzymatic cellulose hydrolysis. Biotechnol. Bioeng. 2009, 102, 1368–1376. [Google Scholar] [CrossRef]
  28. Kim, H.; Ahn, Y.; Kwak, S.Y. Comparing the influence of acetate and chloride anions on the structure of ionic liquid pretreated lignocellulosic biomass. Biomass Bioenerg. 2016, 93, 243–253. [Google Scholar] [CrossRef]
  29. Poornejad, N.; Karimi, K.; Behzad, T. Improvement of saccharification and ethanol production from rice straw by NMMO and [BMIM][OAc] pretreatments. Ind. Crops Prod. 2013, 41, 408–413. [Google Scholar] [CrossRef]
  30. Mahjoub, N.; Sahebi, H.; Mazdeh, M.; Teymouri, A. Optimal design of the second and third generation biofuel supply network by a multi-objective model. J. Clean. Prod. 2020, 256, 120355. [Google Scholar] [CrossRef]
  31. Liu, C.Z.; Wang, F.; Stiles, A.R.; Guo, C. Ionic liquids for biofuel production: Opportunities and challenges. Appl. Energy 2012, 92, 406–414. [Google Scholar] [CrossRef]
  32. Paudel, S.R.; Banjara, S.P.; Choi, O.K.; Park, K.Y.; Kim, Y.M. Pretreatment of agricultural biomass for anaerobic digestion: Current state and challenges. Bioresour. Technol. 2017, 245, 1194–1205. [Google Scholar] [CrossRef]
  33. Maurya, D.P.; Singla, A.; Negi, S. An overview of key pretreatment processes for biological conversion of lignocellulosic biomass to bioethanol. 3 Biotech. 2015, 5, 597–609. [Google Scholar] [CrossRef] [Green Version]
  34. Ge, Y.; Qiu, L.; Luo, S.; Li, S.; Yu, X.; Guo, X. Effect of ionic liquids pretreatment on anaerobic digestion of potato stem leaves. Nongye Jixie Xuebao/Trans. Chin. Soc. Agric. Mac. 2017, 48, 266–271. [Google Scholar]
  35. Mancini, G.; Papirio, S.; Lens, P.N.L.; Esposito, G. Solvent pretreatments of lignocellulosic materials to enhance biogas production: A review. Energy Fuels 2016, 30, 1892–1903. [Google Scholar] [CrossRef]
  36. Papa, G.; Rodriguez, S.; George, A.; Schievano, A.; Orzi, V.; Sale, K.L.; Singh, S.; Adani, F.; Simmons, B.A. Comparison of different pretreatments for the production of bioethanol and biomethane from corn stover and switchgrass. Bioresour. Technol. 2015, 183, 101–110. [Google Scholar] [CrossRef]
  37. Allison, B.J.; Simmons, C.W. Valorization of tomato pomace by sequential lycopene extraction and anaerobic digestion. Biomass Bioenerg. 2017, 105, 331–341. [Google Scholar] [CrossRef]
  38. Villamil, J.A.; Mohedano, A.F.; Rodriguez, J.J.; de la Rubia, M.A. Valorisation of the liquid fraction from hydrothermal carbonisation of sewage sludge by anaerobic digestion. J. Chem. Technol. Biotechnol. 2018, 93, 450–456. [Google Scholar] [CrossRef]
  39. Miller, G.L. Use of dinitrosalicylic acid reagent for determination of reducing sugar. Anal. Chem. 1959, 31, 426–428. [Google Scholar] [CrossRef]
  40. APHA. Standard Methods for the Examination of Water and Wastewater; Part 1000–3000; APHA: Washington, DC, USA, 2005. [Google Scholar]
  41. Raposo, F.; de la Rubia, M.A.; Borja, R.; Alaiz, M. Assessment of a modified and optimised method for determining chemical oxygen demand of solid substrates and solutions with high suspended solid content. Talanta 2008, 76, 448–453. [Google Scholar] [CrossRef]
  42. Rozzi, A.; Remigi, E. Methods of assessing microbial activity and inhibition under anaerobic conditions: A literature review. Rev. Environ. Sci. Biotechnol. 2004, 3, 93–115. [Google Scholar] [CrossRef]
  43. Dinuccio, E.; Balsari, P.; Gioelli, F.; Menardo, S. Evaluation of the biogas productivity potential of some Italian agro-industrial biomasses. Bioresour. Technol. 2010, 101, 3780–3783. [Google Scholar] [CrossRef] [PubMed]
  44. De la Rubia, M.A.; Villamil, J.A.; Rodriguez, J.J.; Borja, R.; Mohedano, A.F. Mesophilic anaerobic co-digestion of the organic fraction of municipal solid waste with the liquid fraction from hydrothermal carbonization of sewage sludge. Waste Manag. 2018, 76, 315–322. [Google Scholar] [CrossRef]
  45. ASTM International. ASTM International. ASTM D7582-15. In Standard Test Methods for Proximate Analysis of Coal and Coke by Macro Thermogravimetric Analysis; ASTM International: West Conshohocken, PA, USA, 2015. [Google Scholar]
  46. Padrino, B.; Lara-Serrano, M.; Morales-de la Rosa, S.; Campos-Martín, J.M.; García Fierro, J.L.; Martínez, F.; Melero, J.A.; Puyol, D. Resource recovery potential from lignocellulosic feedstock upon lysis with ionic liquids. Front. Bioeng. Biotechnol. 2018, 6, 119. [Google Scholar] [CrossRef] [PubMed]
  47. Watkins, D.; Nuruddin, M.; Hosur, M.; Tcherbi-Narteh, A.; Jeelani, S. Extraction and characterization of lignin from different biomass resources. J. Mater. Res. Technol. 2015, 4, 26–32. [Google Scholar] [CrossRef] [Green Version]
  48. De Diego-Díaz, B.; Duran, A.; Álvarez-García, M.R.; Fernández-Rodríguez, J. New trends in physicochemical characterization of solid lignocellulosic waste in anaerobic digestion. Fuel 2019, 245, 240–246. [Google Scholar] [CrossRef]
  49. Clough, M.T.; Geyer, K.; Hunt, P.A.; Mertes, J.; Welton, T. Thermal decomposition of carboxylate ionic liquids: Trends and mechanisms. Phys. Chem. Chem. Phys. 2013, 15, 20480–20495. [Google Scholar] [CrossRef] [PubMed] [Green Version]
  50. Khan, M.N.; Khan, M.N.; Rehman, N.; Sharif, A.; Ahmed, E.; Farooqi, Z.H.; Din, M.I. Environmentally benign extraction of cellulose from dunchi fiber for nanocellulose fabrication. Int. J. Biol. Macromol. 2020, 153, 72–78. [Google Scholar] [CrossRef] [PubMed]
  51. Mahmood, H.; Moniruzzaman, M.; Iqbal, T.; Yusup, S.; Rashid, M.; Raza, A. Comparative effect of ionic liquids pretreatment on thermogravimetric kinetics of crude oil palm biomass for possible sustainable exploitation. J. Mol. Liq. 2019, 282, 88–96. [Google Scholar] [CrossRef]
  52. Sidi-Yacoub, B.; Oudghiri, F.; Belkadi, M.; Rodríguez-Barroso, R. Characterization of lignocellulosic components in exhausted sugar beet pulp waste by TG/FTIR analysis. J. Therm. Anal. Calorim. 2019, 138, 1801–1809. [Google Scholar] [CrossRef]
  53. De la Rubia, M.A.; Fernández-Cegrí, V.; Raposo, F.; Borja, R. Influence of particle size and chemical composition on the performance and kinetics of anaerobic digestion process of sunflower oil cake in batch mode. Biochem. Eng. J. 2011, 58, 162–167. [Google Scholar] [CrossRef]
Figure 1. X-ray diffraction for raw and pretreated (hydrothermally and with ionic liquid at 1:5) wheat straw (a), barley straw (b), and grape stem (c).
Resources 10 00118 g001
Figure 2. TG (ac) and DTG (df) curves for raw and IL pre-treated biomass.
Resources 10 00118 g002
Figure 3. (a) Cumulative methane production following anaerobic digestion of raw GS and WS and solid fractions from HT and IL5 pretreatment. (b) Ultimate methane production of raw GS and WS and the mixture (solid and liquid fractions) from the HT and IL5 pretreatments.
Resources 10 00118 g003
Table 1. Characteristics of the wheat straw, barley straw, and grape stem.
Wheat StrawBarley StrawGrape Stem
TS (g kg–1)963 ± 0.65963 ± 0.65963 ± 0.65
VS (g kg–1)897 ± 1.25896 ± 1.25897 ± 0.50
TCOD (g kg–1)334 ± 1.40297 ± 1.25344 ± 1.80
C (%)43.32 ± 0.0243.89 ± 0.0347.25 ± 0.09
H (%)5.62 ± 0.035.75 ± 0.055.60 ± 0.07
N (%)0.63 ± 0.010.56 ± 0.011.48 ± 0.01
S (%)0.17 ± 0.010.11 ± 0.020.10 ± 0.01
O * (%)40.58 ± 0.0242.39 ± 0.0111.35 ± 0.02
VM (%)80.30 ± 0.0382.70 ± 0.0265.80 ± 0.01
Ash (%)9.7 ± 0.037.3 ± 0.0224.2 ± 0.01
* By difference: O = 100 − (C + H + N + ash).
Table 2. Cellulose crystallinity index (CrI %) of the untreated and HT and IL pretreated biomass.
BiomassRawHTIL1IL3IL5
Wheat straw54.855.753.951.450
Barley straw53.853.652.451.250.9
Grape stem32.532.128.227.827.5
Table 3. Sugar yield of WS, BS, and GS after the HT and IL pretreatments.
PretreatmentSugar Yield (mg Glucose g−1 Biomass)
WSBSGS
HT123.4 ± 1.141.2 ± 1.347.8 ± 0.6
IL1127.6 ± 3.242.4 ± 0.850.0 ± 0.1
IL3143.0 ± 4.845.5 ± 0.994.5 ± 0.7
IL5158.2 ± 5.147.9 ± 1.6188.1 ± 6.8
Table 4. Values of total alkalinity, intermediate to total alkalinity ratio, and ammoniacal nitrogen from the anaerobic digestion experiments.
AssayTotal Alkalinity
(mg CaCO3 L–1)
IA/TATAN
(mg L–1)
InitialFinalInitialFinalInitialFinal
WS Raw592 ± 42778 ± 10.350.1456 ± 1826 ± 20
WS HT524 ± 162473 ± 110.260.1170 ± 7868 ± 30
WS IL5530 ± 122495 ± 10.270.12140 ± 31036 ± 40
GS Raw484 ± 52926 ± 20.240.1128 ± 1518 ± 20
GS HT409 ± 222502 ± 10.290.0570 ± 5658 ± 59
GS IL5680 ± 152761 ± 30.230.1470 ± 8672 ± 49
Data represents mean ± standard deviation, n = 3.
Publisher’s Note: MDPI stays neutral with regard to jurisdictional claims in published maps and institutional affiliations.

