
Feedback-Based Eco-Design for Integrating the Recency, Frequency, and Monetary Value of Eco-Efficiency into Sustainability Management

Abstract
:1. Introduction
2. Material and Methods
2.1. RFM
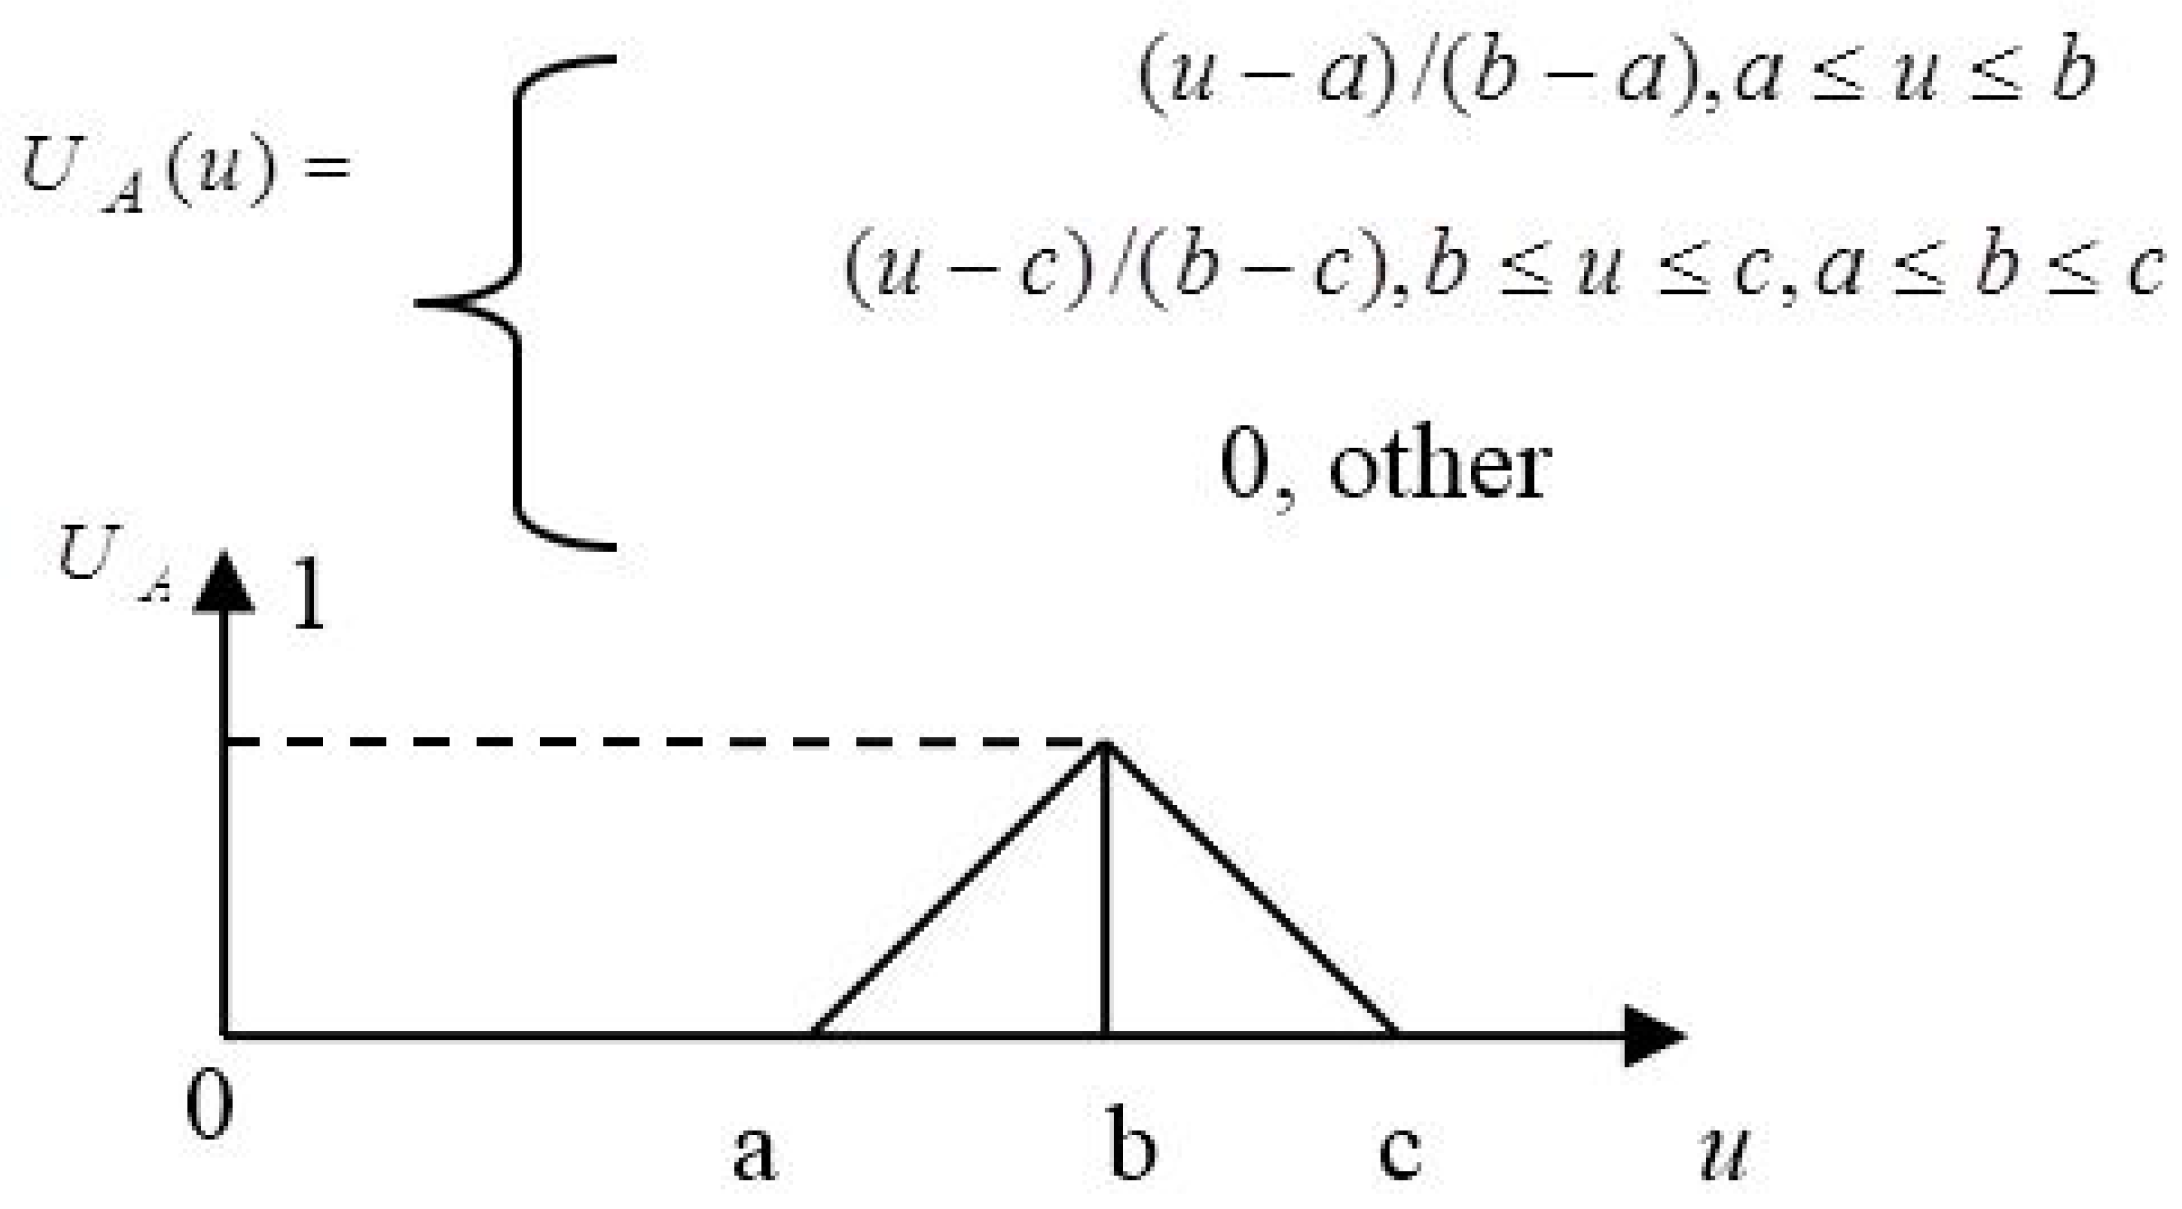
2.2. Fuzzy Membership Function
2.3. Eco-Efficiency
- Material reduction (Reduce the material intensity of goods and service, units of material per unit of economic value).
- Energy reduction (Reduce the energy intensity of goods and services, units of energy per unit of economic value).
- Toxicity reduction (Reduce toxic dispersion, units of toxicity per unit of goods).
- Material recyclables (Enhance material recyclability, units of re-usage per unit of material).
- Resource sustainable (Maximize sustainable use of renewable resources, units of re-usage per unit of renewable material).
- Product durability (Extend product durability, usage lifetime per unit of product and services).
- Product service (Increase the service intensity of goods and services, units of service function per unit of product and services).
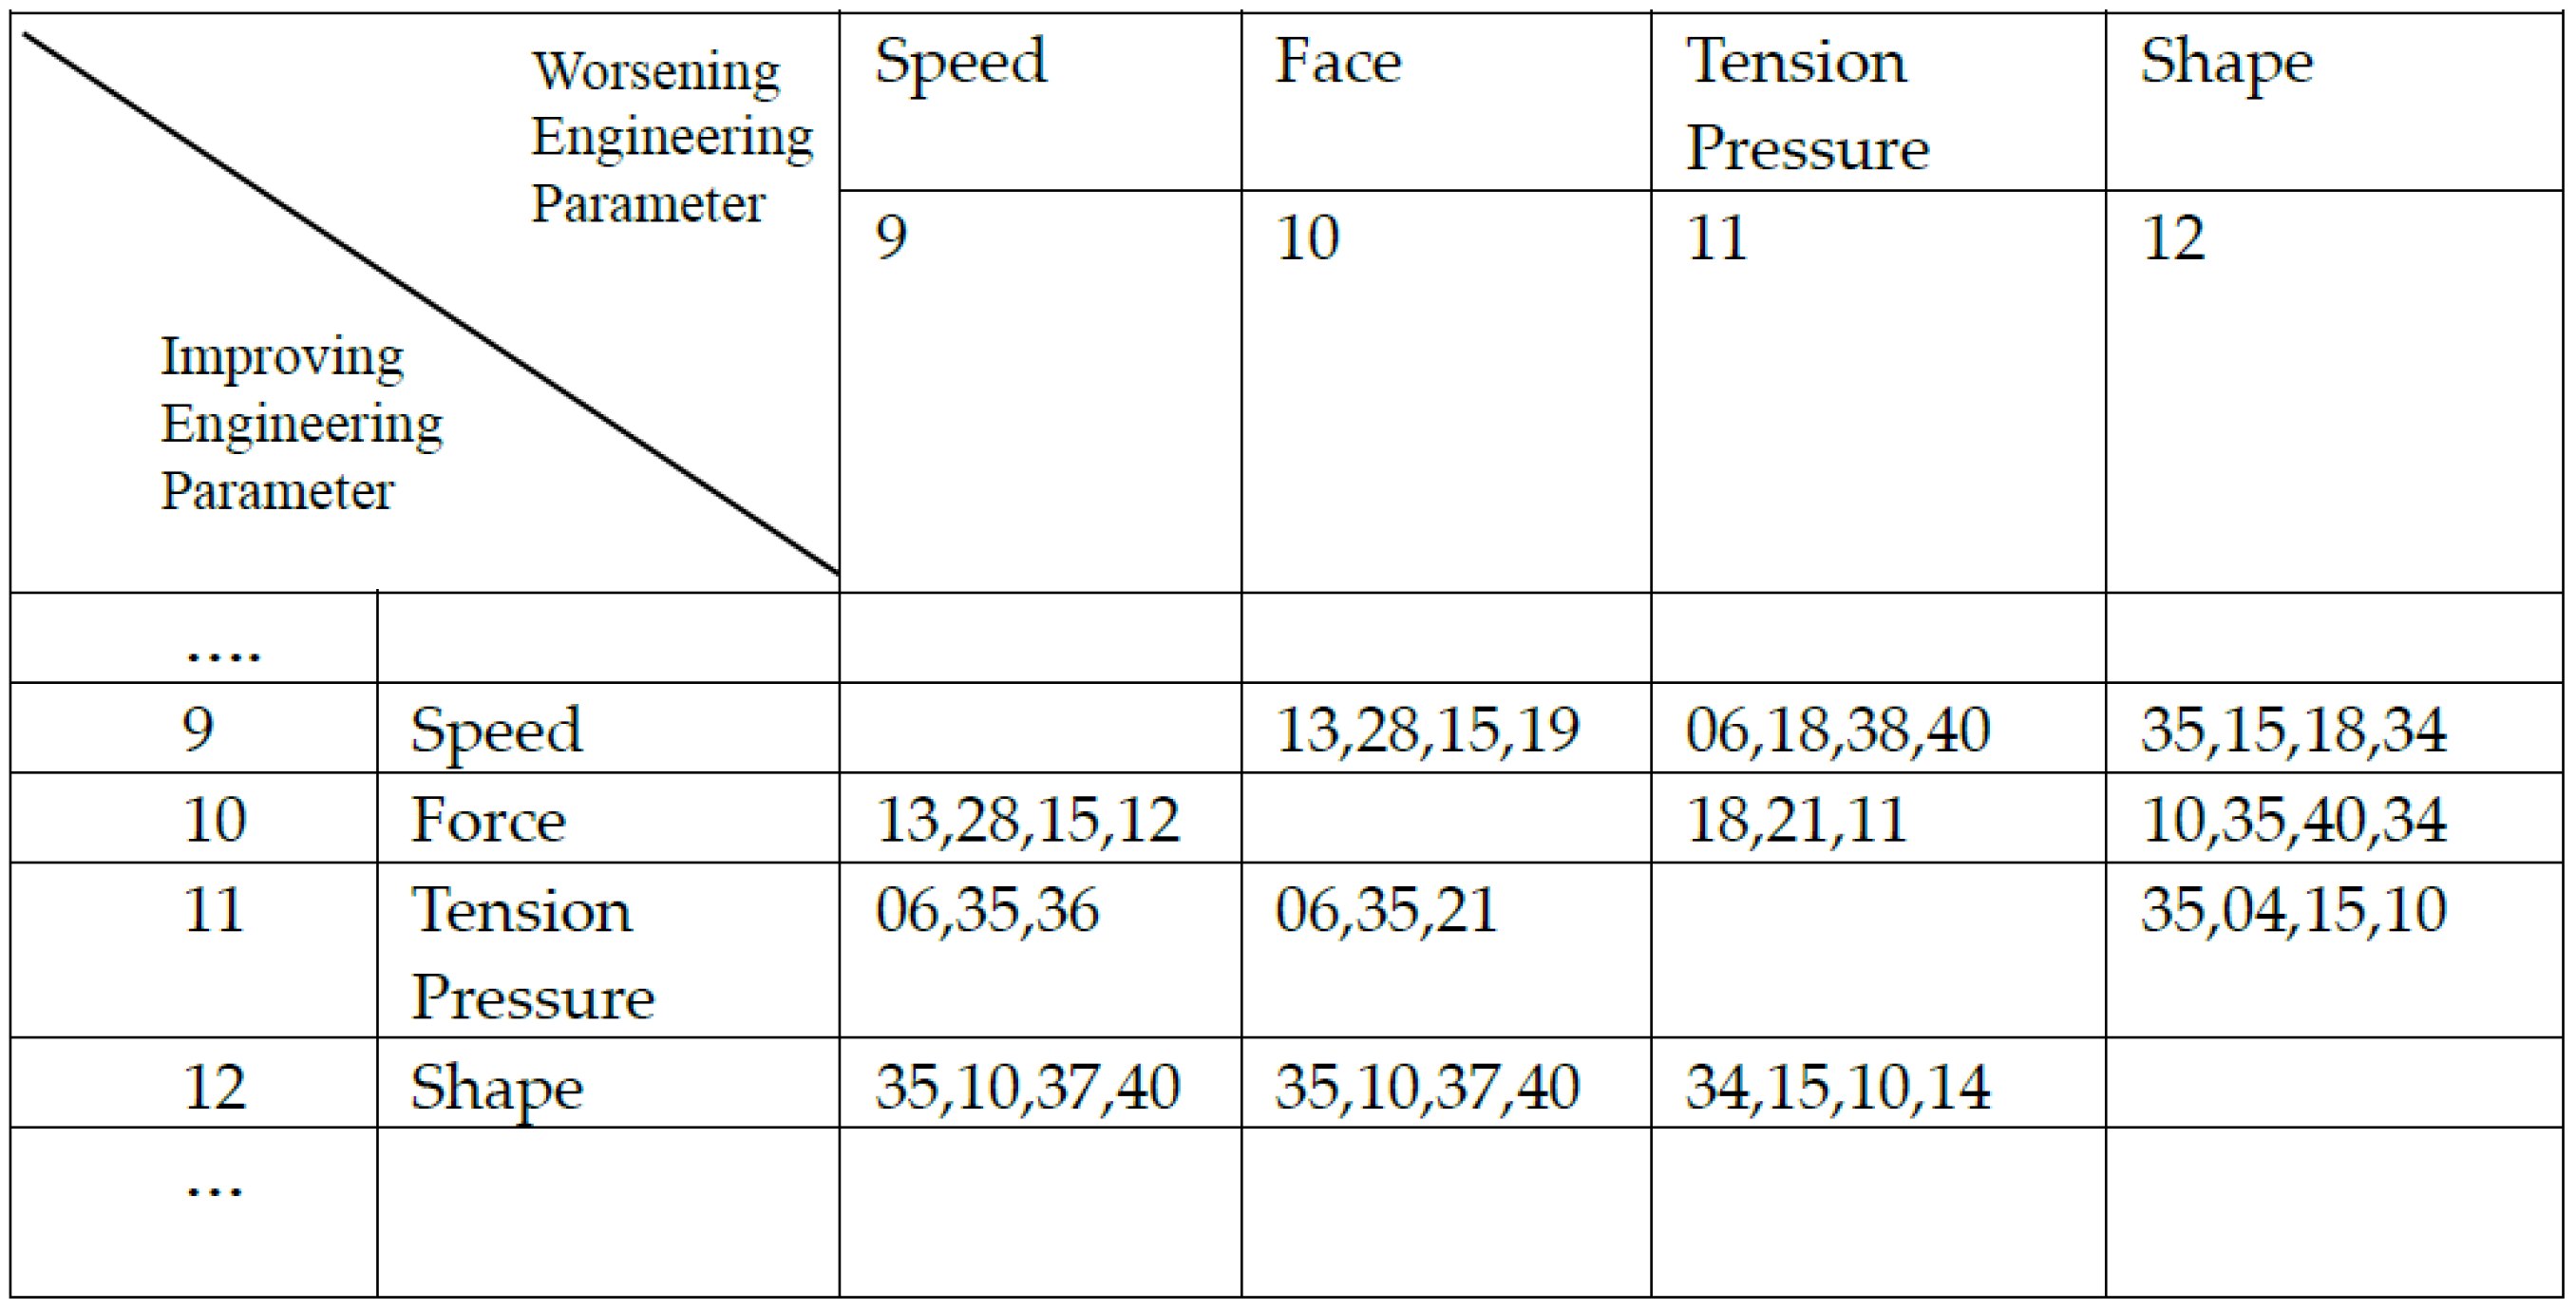
2.4. TRIZ
2.5. AHP
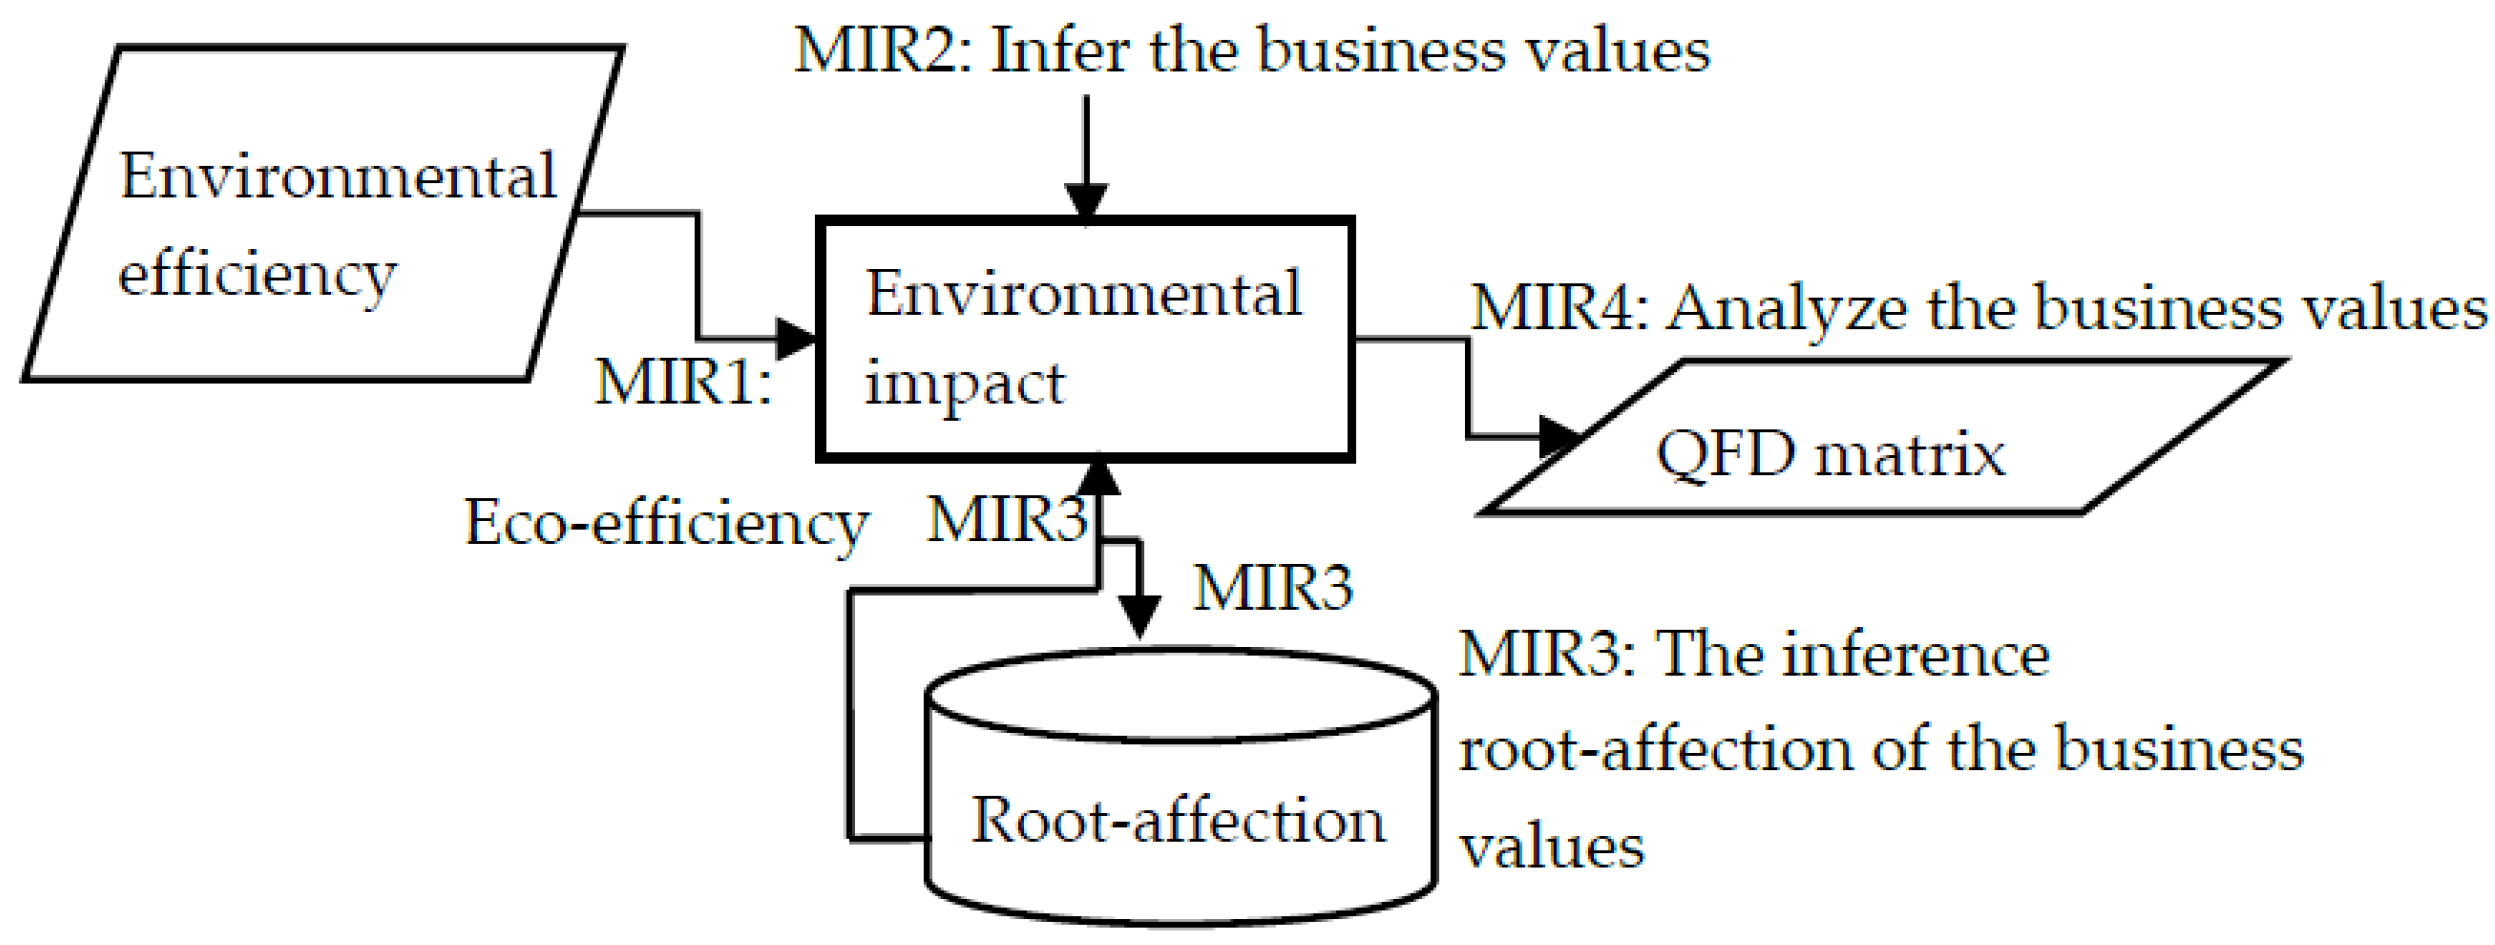
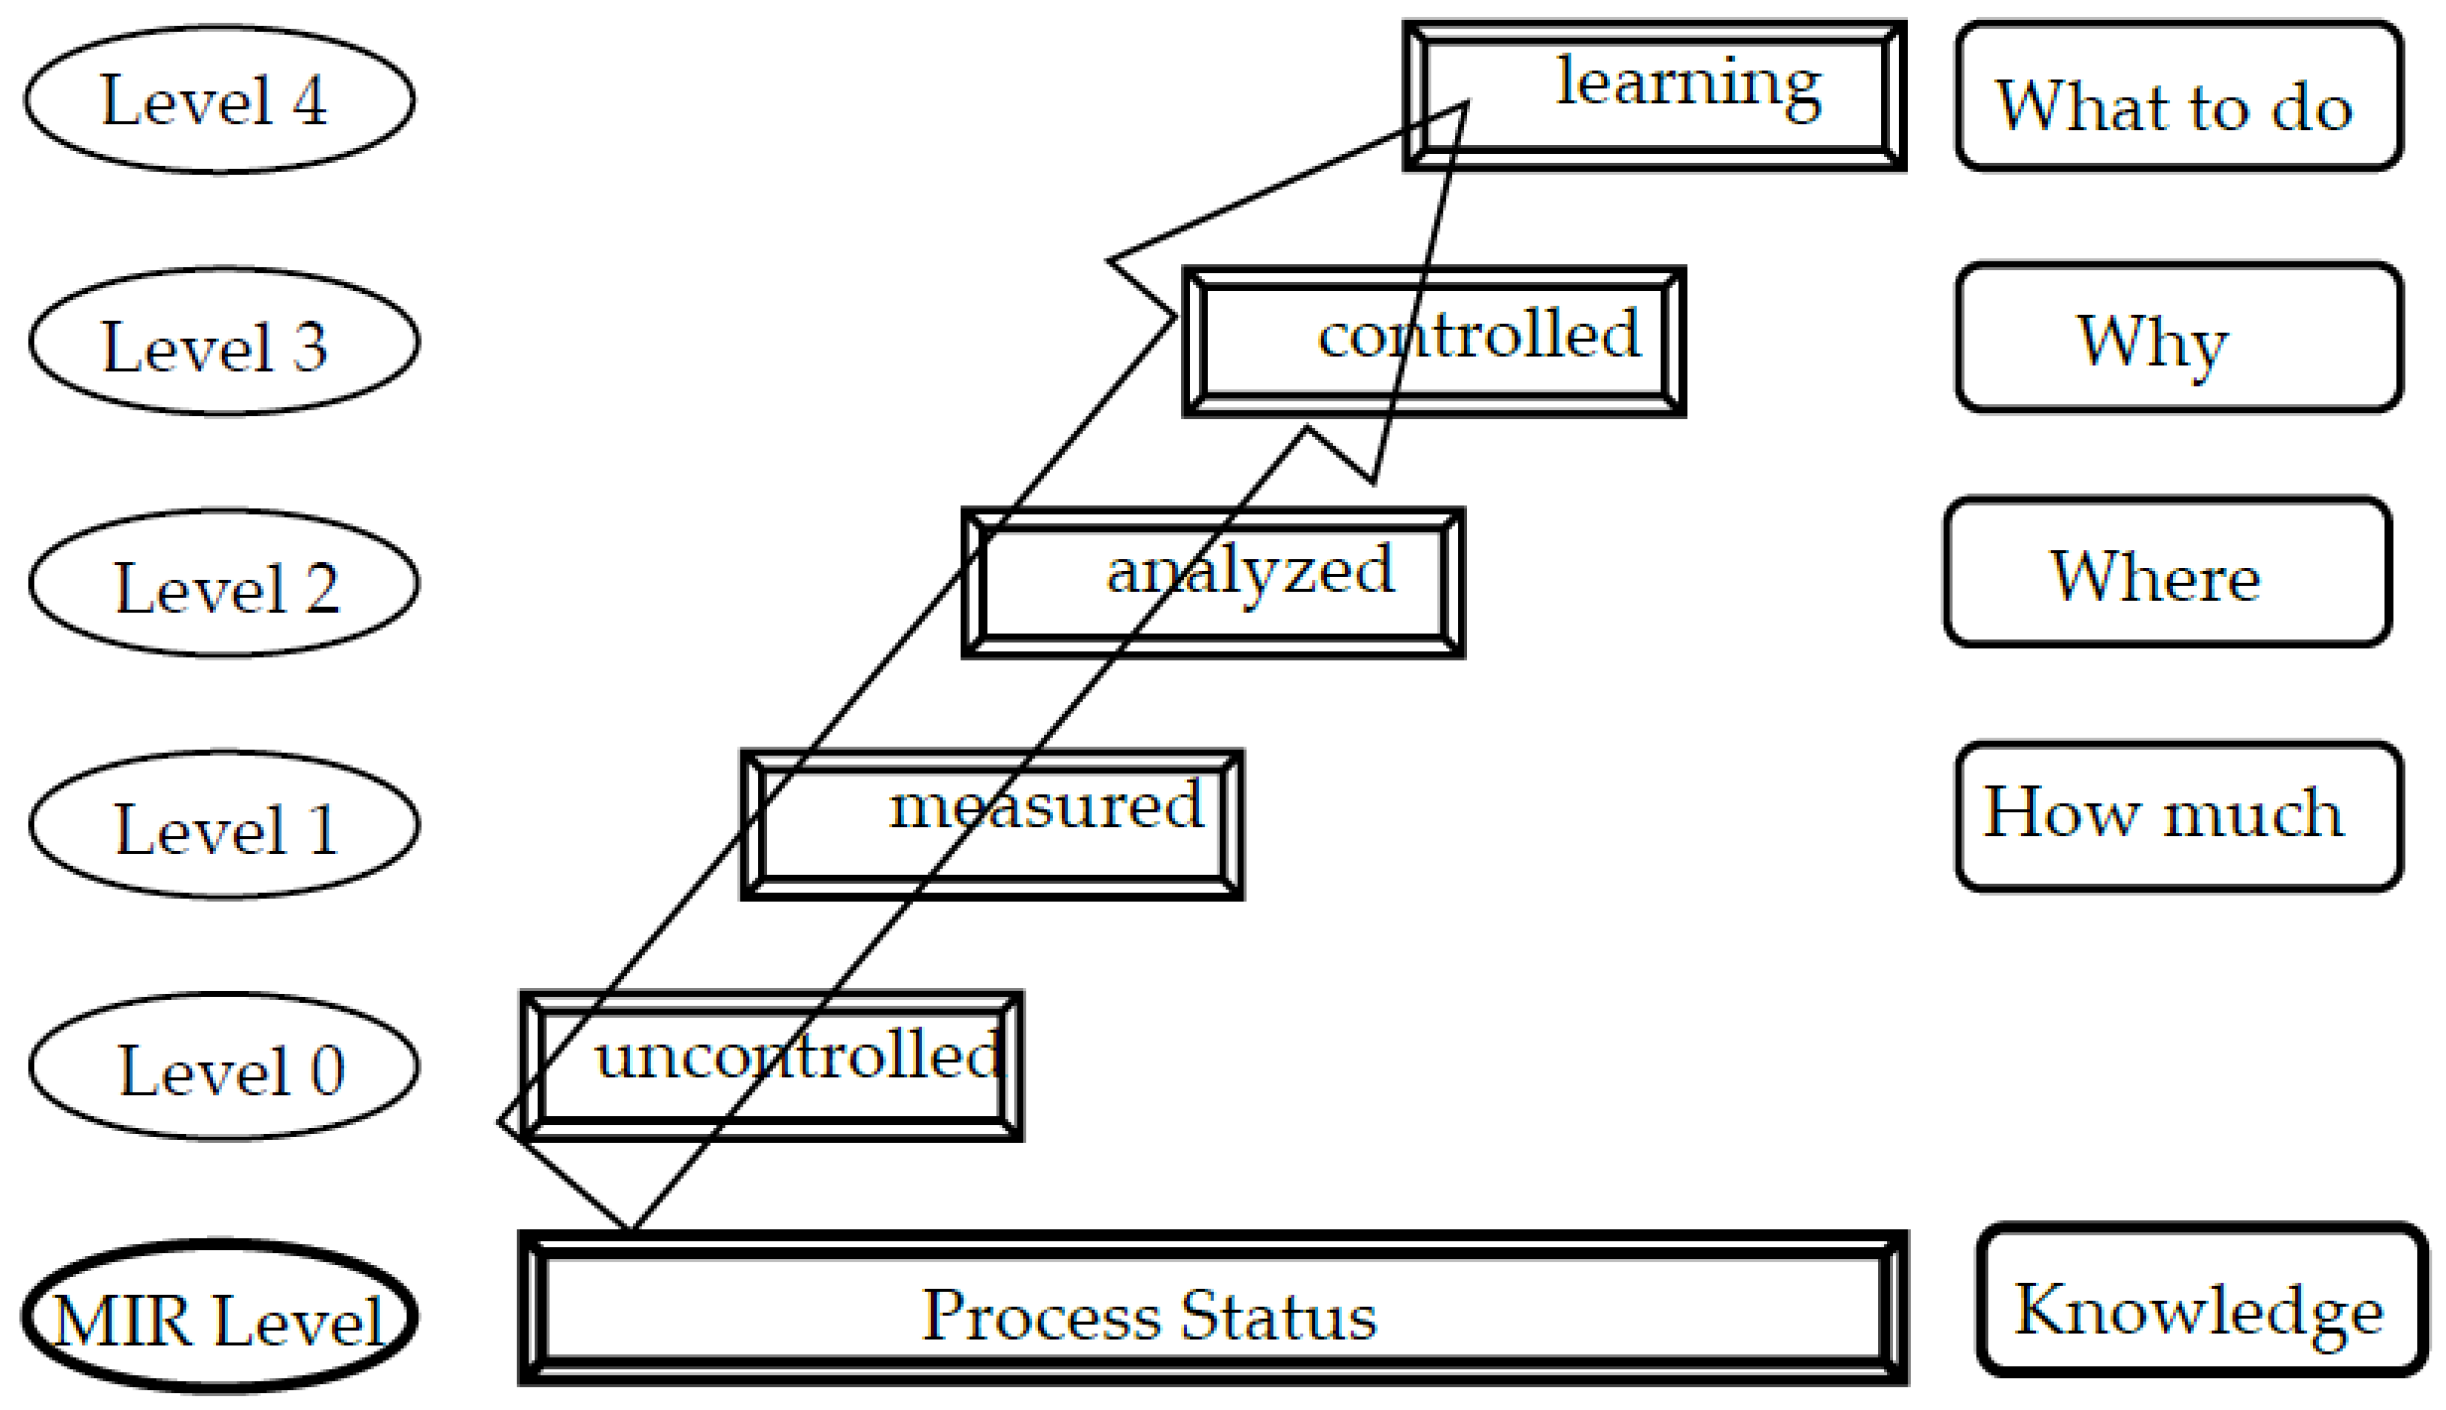
2.6. MIR
3. Eco-Innovation Design Procedure
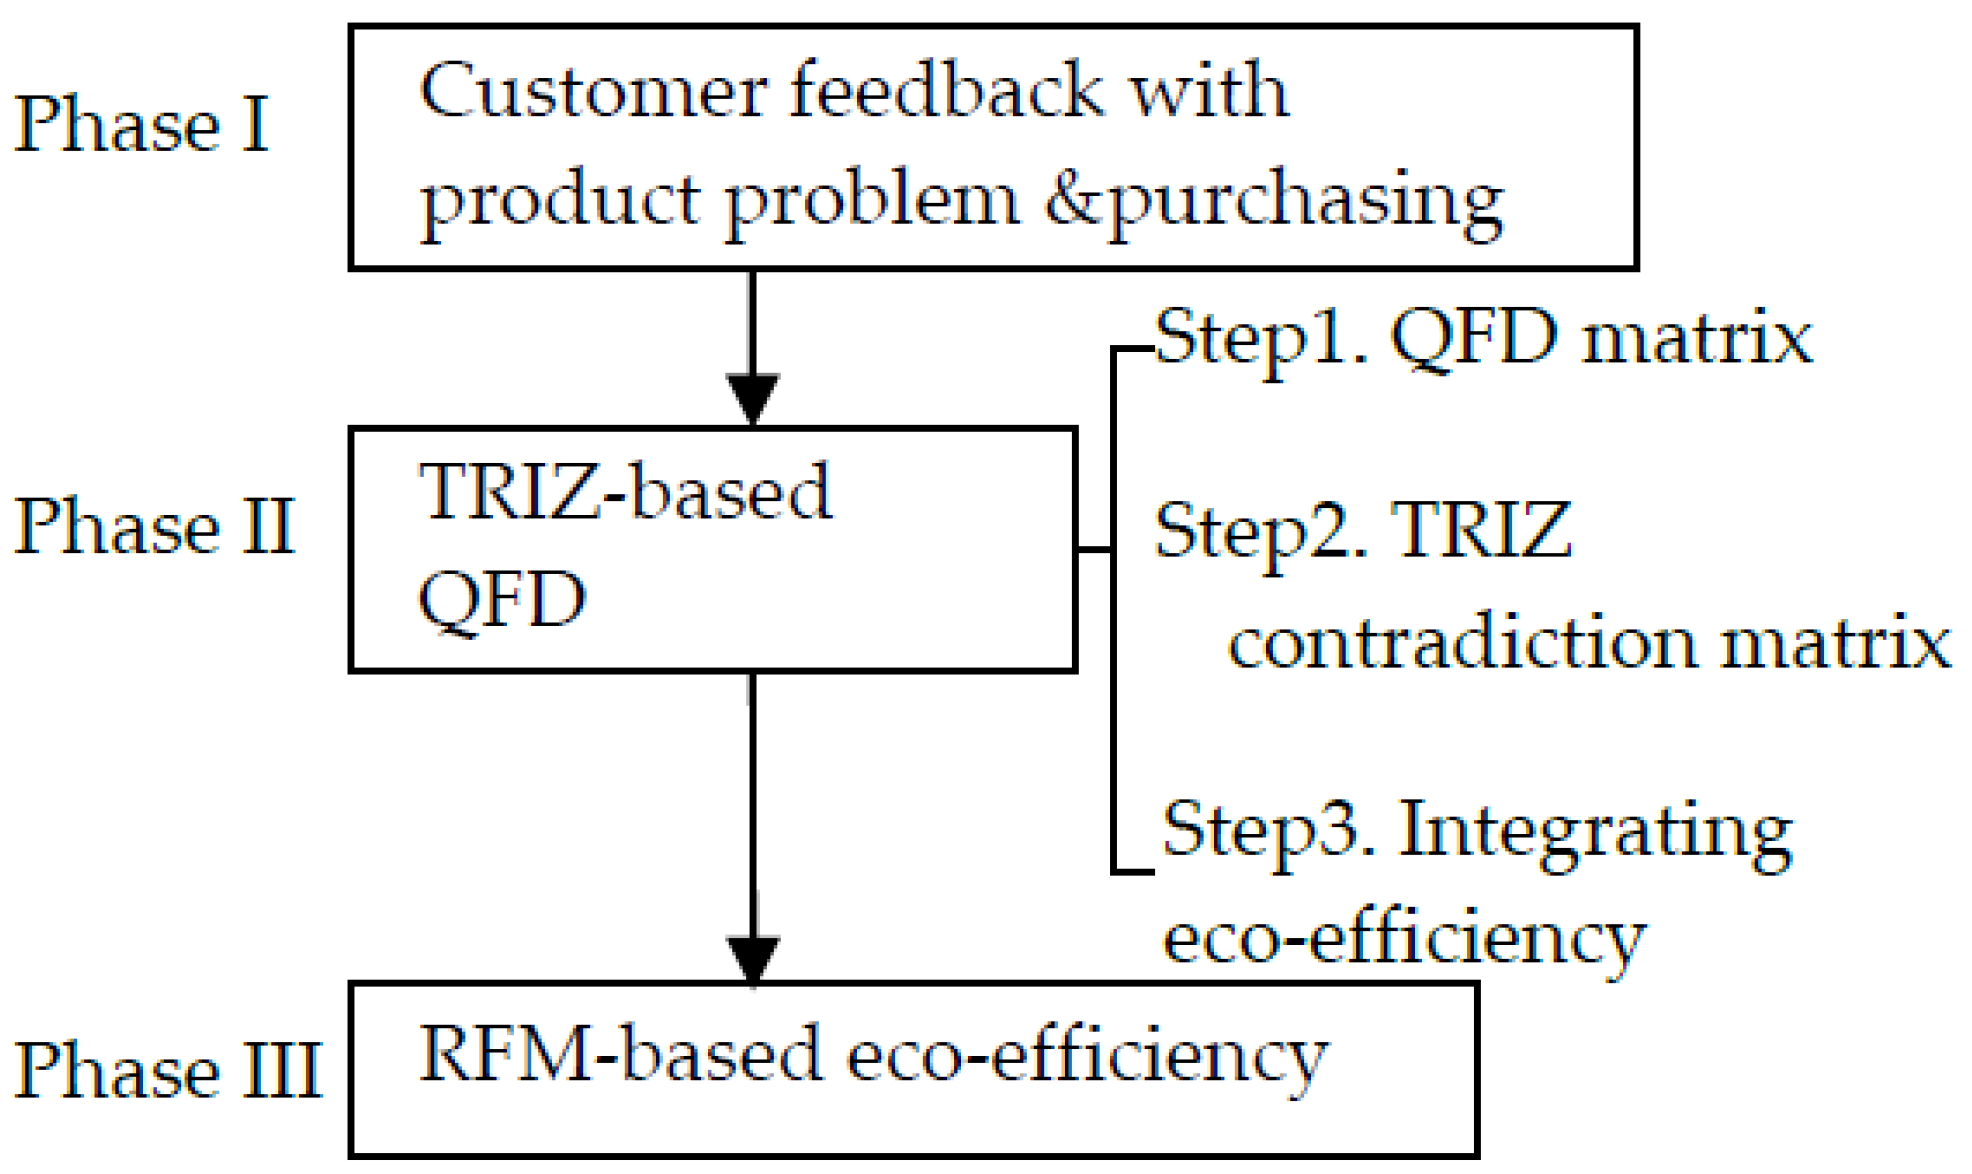
3.1. Phase I
- MIR level 1: How well has eco-efficiency been integrated into the business plan?
- MIR level 2: The relevant eco-efficiency, with the ability to infer the business value, can be identified.
- MIR level 3: The inference root effect of the business values can be determined by the eco-efficiency.
- MIR level 4: Adequate measures to analyze the business value can be identified.
3.2. Phase II
3.3. Phase III
4. Case Study
4.1. Phase I: Customer Feedback Product Problem & Purchasing phase
Step 1: Customer feedback
Step 2: Customer feedback product purchasing
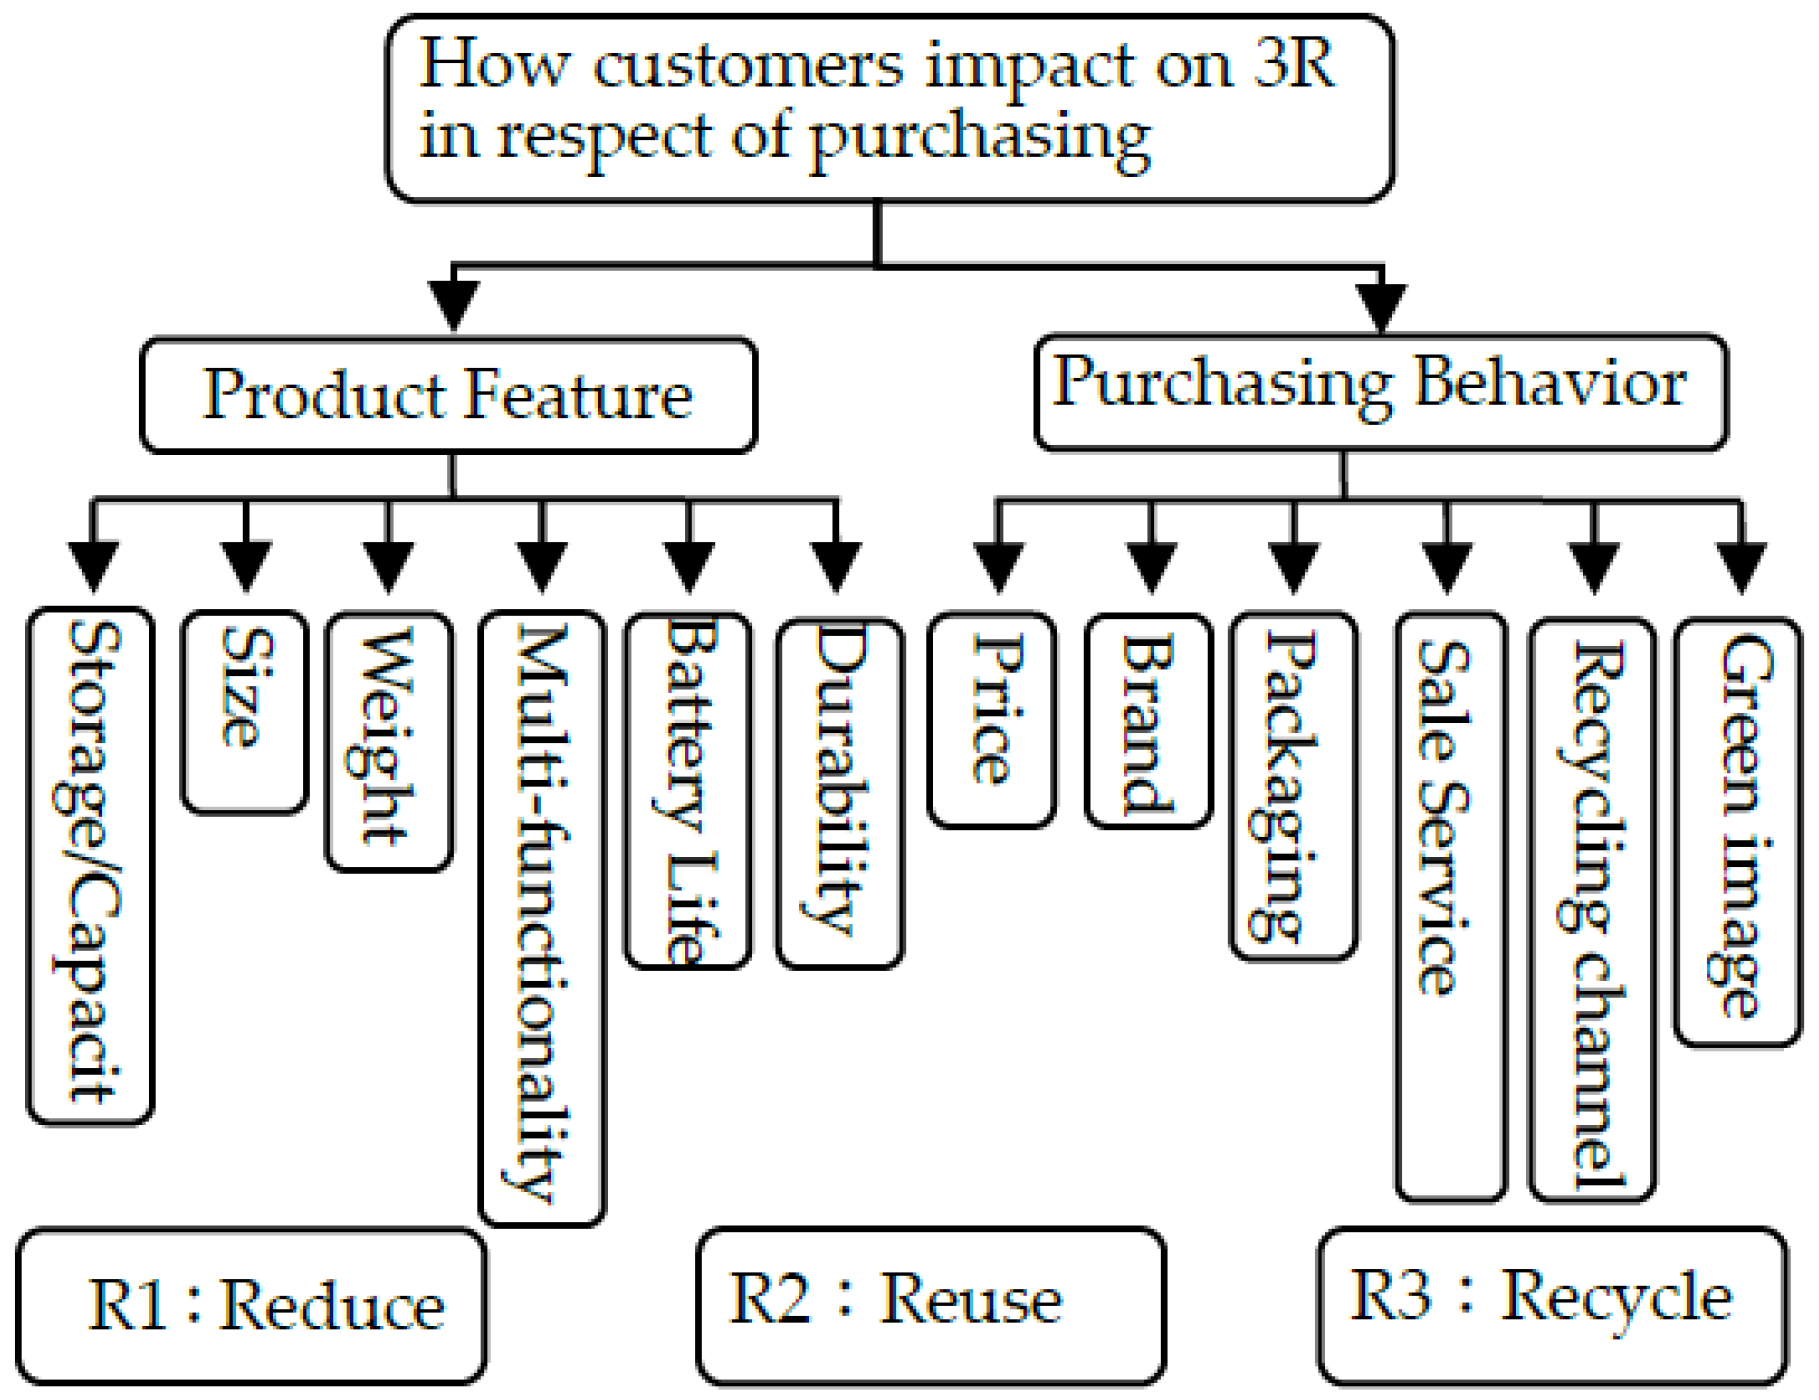
- Layer 1: The main target is to identify how customers impact on the 3Rs with respect to purchasing a notebook computer.
- Layer 2: Group factors that customers would consider in determining which notebook computer to buy fall into two categories, “product features” and “purchasing behavior”. Notably, other considerations are those not related to the specifications of a notebook computer.
- Layer 3: Evaluate “product features” and “purchasing behavior”. “Product features” include items such as the “storage/capacity”, “size”, ” weight”, “multi-functionality”, “battery life”, and “durability” of notebook computers. Meanwhile, “price”, “brand”, “packaging”, “sales service”, “recycling channel”, and “green image” are elements to be assessed under the category of other considerations.
- Layer 4: Examine the relevance of factors identified in Layer 3 against the 3Rs.
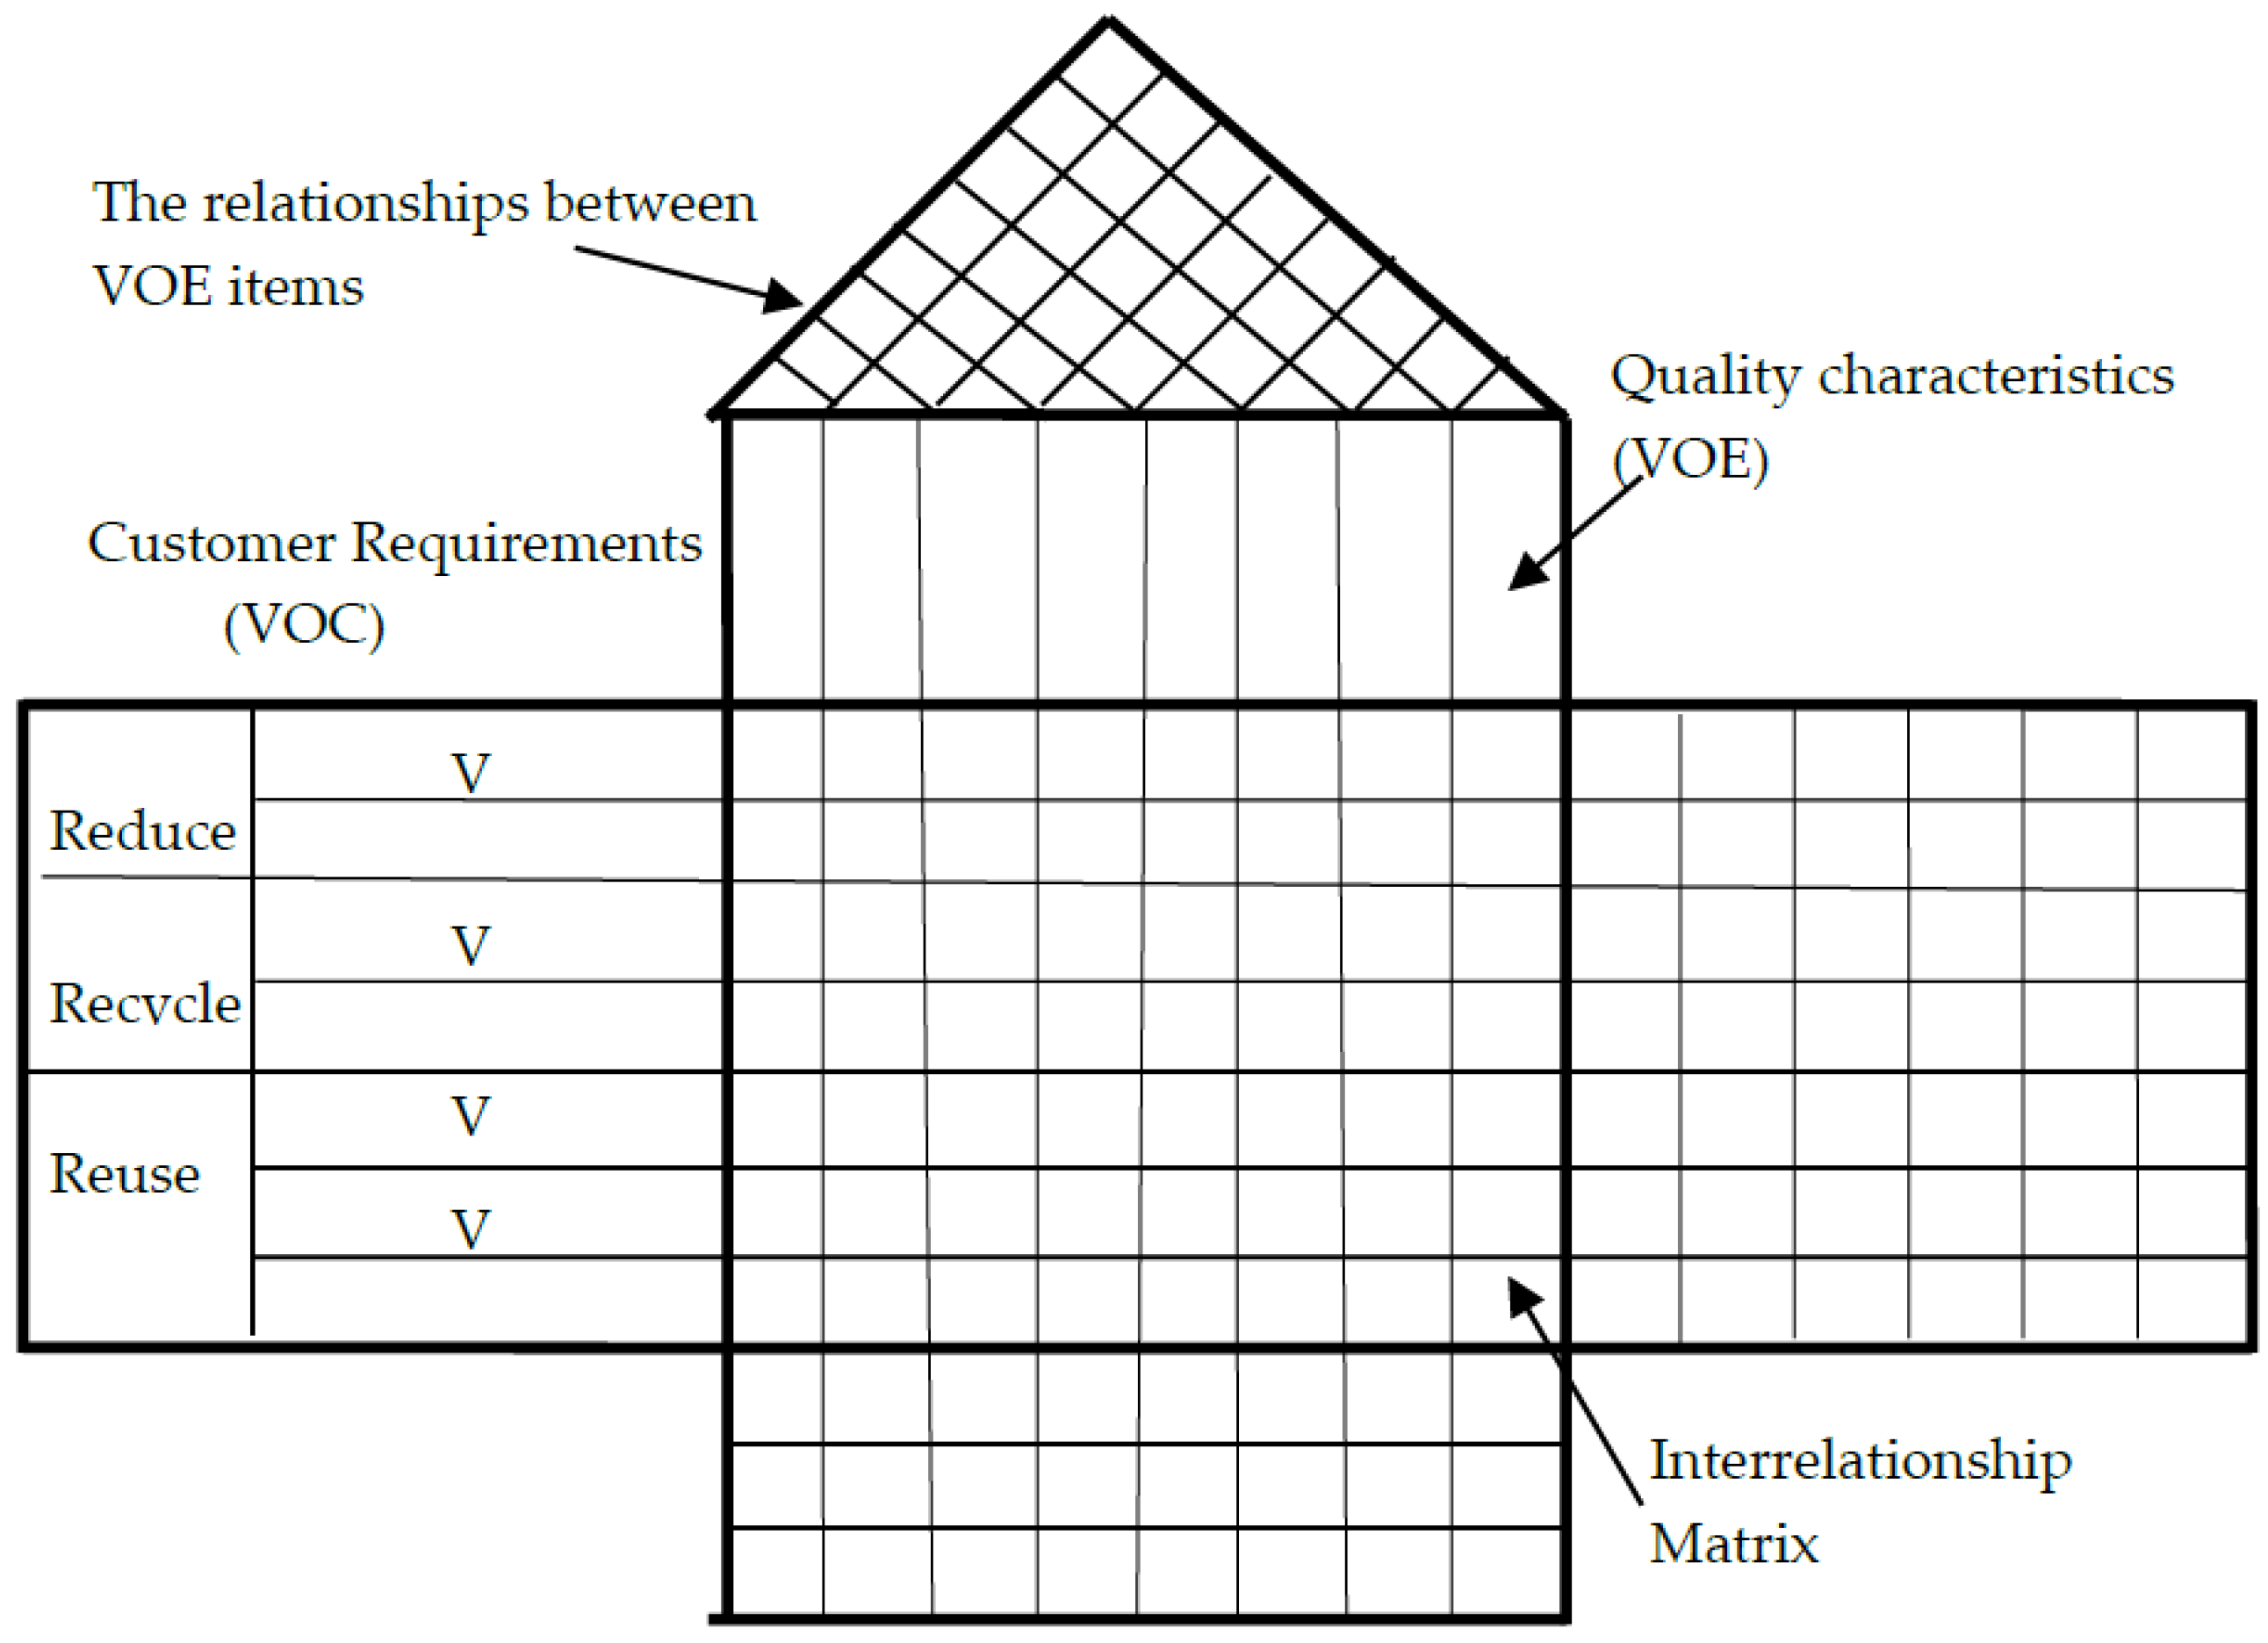
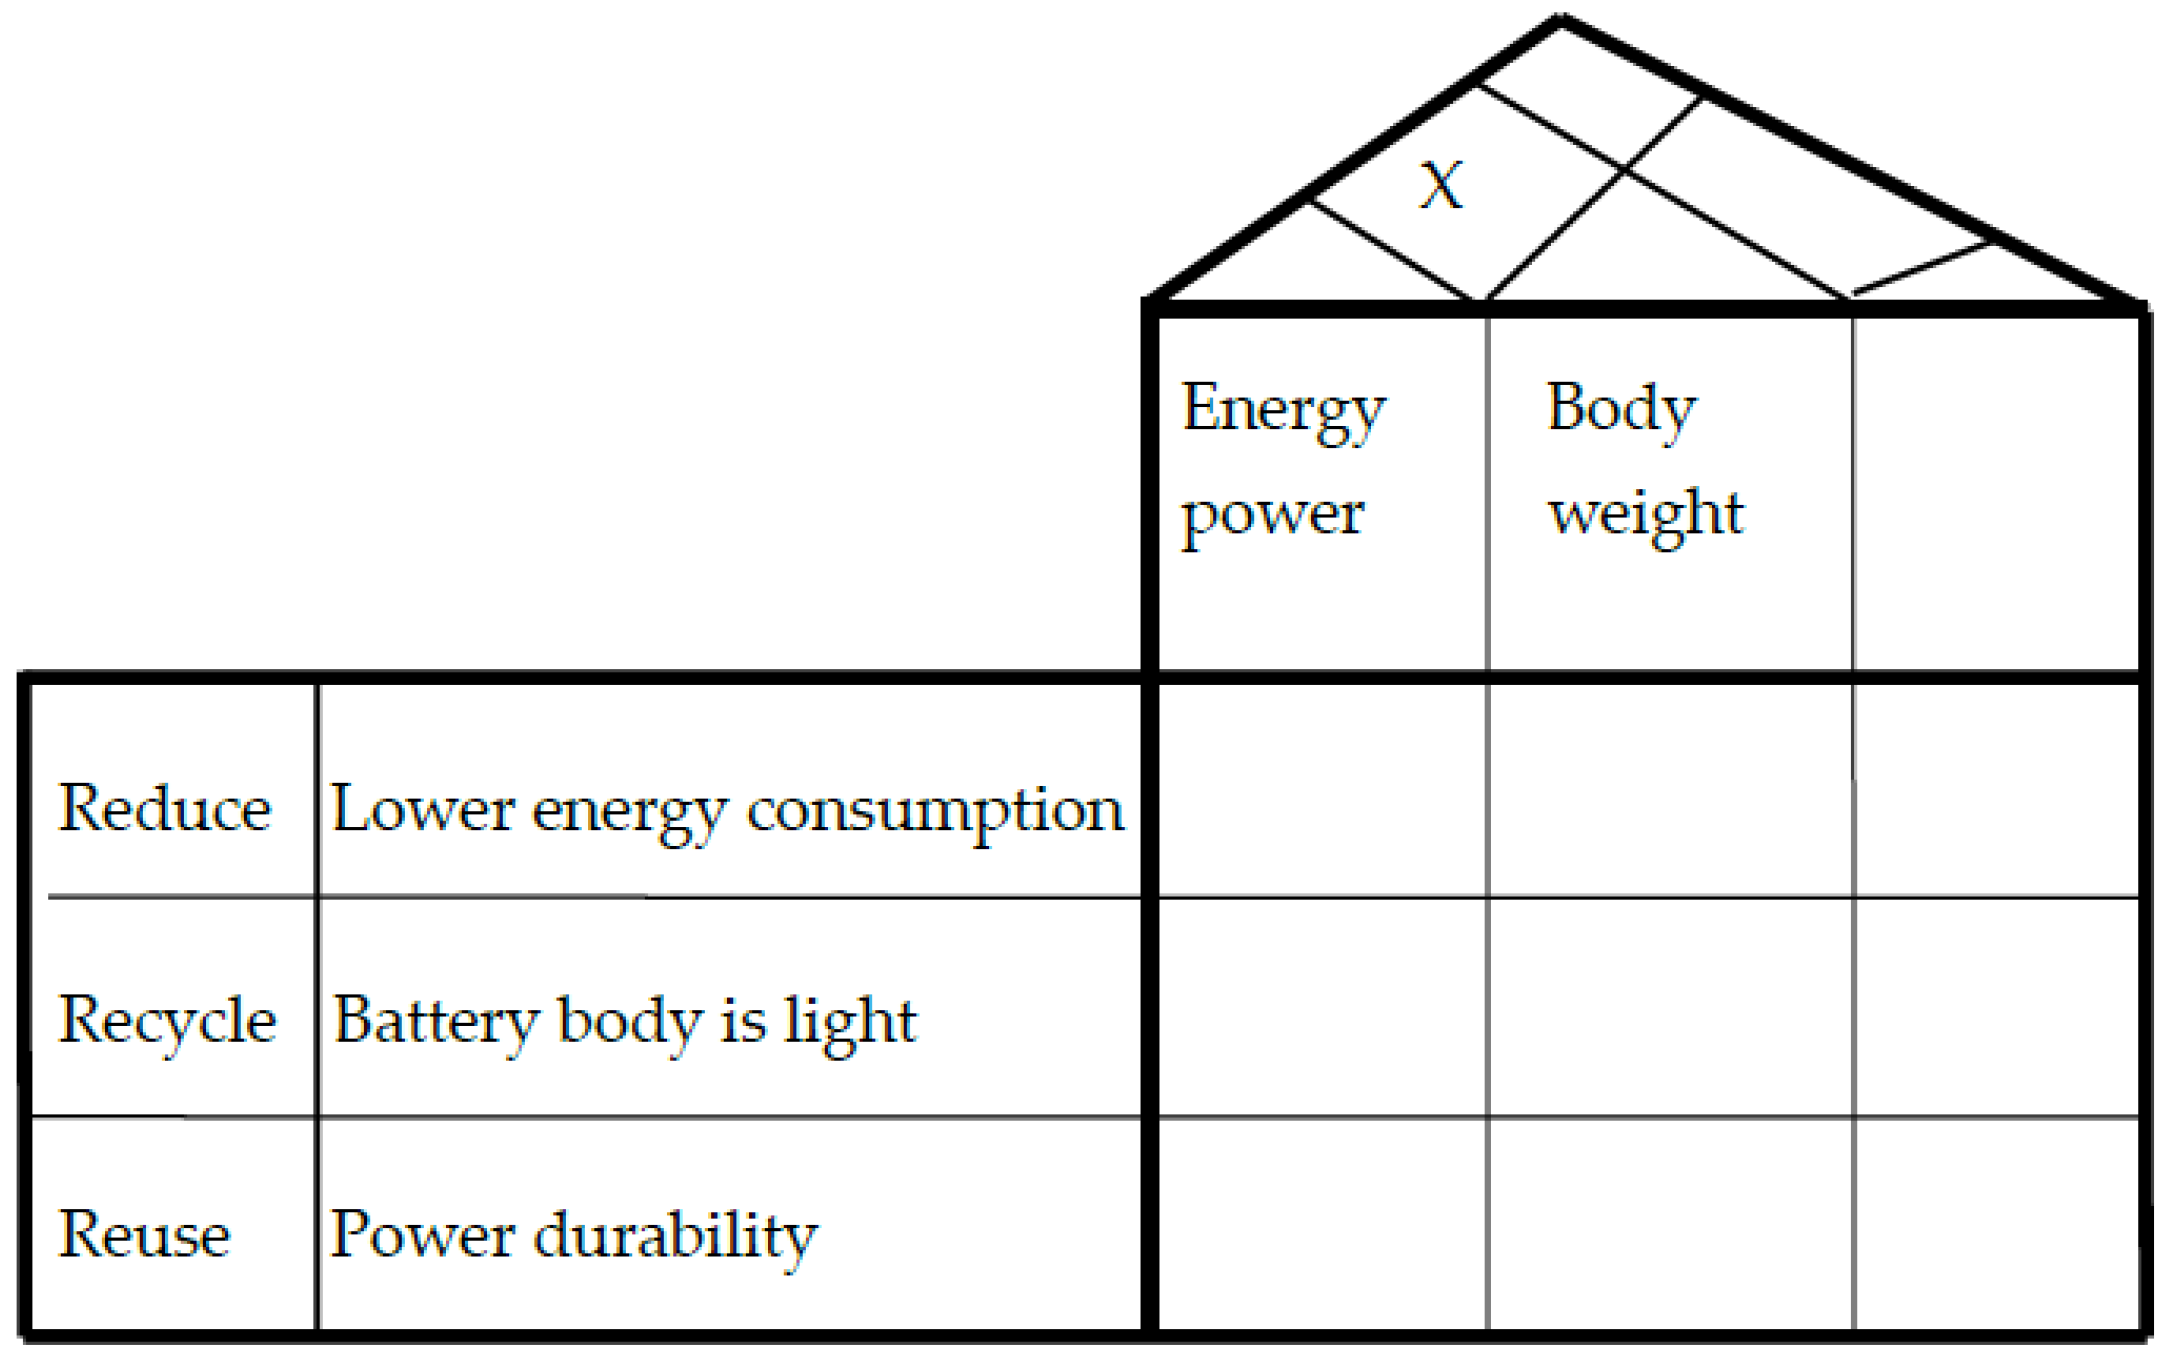
4.2. Phase II: TRIZ-Based QFD Phase
- (i)
- Replacement of the body substance with an aluminum–magnesium (Al–Mg) alloy;
- (ii)
- Replacement of the electrical system with an energy-saving system.
4.3. Phase III: RFM-Based QFD Phase
5. Conclusions
Acknowledgments
Conflicts of Interest
References
- Galvez-Martosa, J.L.; Harald, S. An analysis of the use of life cycle assessment for waste co-incineration in cement kilns. Resour. Conserv. Recycl. 2014, 86, 118–131. [Google Scholar] [CrossRef]
- Tagliaferri, C.; Evangelisti, S.; Clift, R.; Lettieri, P.; Chapman, C.; Taylor, R. Life cycle assessment of conventional and advanced two-stage energy-from-waste technologies for methane production. J. Clean. Prod. 2016, 129, 144–158. [Google Scholar] [CrossRef]
- Huang, C.C.; Liang, W.Y.; Chuang, H.F.; Chang, Z.Y. A novel approach to product modularity and product disassembly with the consideration of 3R-abilities. Comput. Ind. Eng. 2012, 62, 96–107. [Google Scholar] [CrossRef]
- Castagna, A.; Casagrande, M.; Zeni, A.; Girelli, E.; Rada, E.C.; Ragazzi, M.; Apostol, T. 3R’ from citizen point of view and their proposal: A case-study. UPB Sci. Bull. 2013, 75, 253–264. [Google Scholar]
- Tseng, M.L.; Louie, D.; Rochelle, D. Evaluating firm’s sustainable production indicators in uncertainty. Comput. Ind. Eng. 2009, 57, 1393–1403. [Google Scholar] [CrossRef]
- Alessandro, S.; Luciano, M.; Fabrizio, P.; Ivano, V.; Salvatore, D.C.; Francesco, B. End-of-Life Vehicles management: Italian material and energy recovery efficiency. Waste Manag. 2011, 31, 489–494. [Google Scholar]
- Bovea, M.D.; Belis, V.P. A taxonomy of ecodesign tools for integrating environmental requirements into the product design process. J. Clean. Prod. 2012, 20, 61–71. [Google Scholar] [CrossRef]
- Julie, C.; Dominique, G.; Thomas, H.C. Quantifying uncertainty in LCA-modelling of waste management systems. Waste Manag. 2012, 32, 2482–2495. [Google Scholar]
- Gian, A.B.; Mirko, B.; Moris, F.; Debora, F. Eco-efficient waste glass recycling: Integrated waste management and green product development through LCA. Waste Manag. 2012, 32, 1000–1008. [Google Scholar]
- Victor, P.; Chayer, J.A.; Manuele, M.; Robert, P.; Réjean, S. A process-based approach to operationalize life cycle assessment through the development of an eco-design decision-support system. J. Clean. Prod. 2012, 33, 192–201. [Google Scholar]
- Sebastiao, R.S.; Alexandra, R.F.; Vamilson, P.S.; Rodrigo, A.F. Applications of life cycle assessment and cost analysis in health care waste management. Waste Manag. 2013, 33, 175–183. [Google Scholar]
- Deirdre, H.; Stephen, B.; David, C. A multi-criteria decision analysis assessment of waste paper management options. Waste Manag. 2013, 33, 566–573. [Google Scholar]
- Winn, S.F.; Roome, N. R&D management responses to the environment: Current theory and implications to practice and research. R&D Manag. 1993, 23, 147–161. [Google Scholar]
- Roome, N. Business strategy, R&D management and environmental impetration. R&D Manag. 1994, 24, 65–82. [Google Scholar]
- Yang, C.J.; Chen, J.L. Accelerating preliminary eco-innovation design for products that integrates case-based reasoning and TRIZ method. J. Clean. Prod. 2011, 19, 998–1006. [Google Scholar] [CrossRef]
- Competitiveness and Innovation Framework Programme. Available online: http://ec.europa.eu/cip/ (accessed on 12 September 2016).
- Kim, K.J.; Park, T. Determination of an optimal set design requirements using house of quality. J. Oper. Manag. 1998, 16, 569–581. [Google Scholar]
- Trappey, C.V.; Trappey, A.J.C.; Hwang, S.J. A computerized quality function deployment approach for retail services. Comput. Ind. Eng. 1996, 30, 611–622. [Google Scholar] [CrossRef]
- Kim, K.J.; Moskowitz, H.; Dhingra, A.; Evans, G. Fuzzy multicriteria models for quality function deployment. Eur. J. Oper. Res. 2000, 121, 504–518. [Google Scholar] [CrossRef]
- Krikke, H.R.; Harten, A.V.; Schuur, P.C. Business case rotes: Recovery strategies for monitors. Comput. Ind. Eng. 1999, 36, 739–757. [Google Scholar] [CrossRef]
- Linton, J. Electronic products at their end-of-life: Options and obstacles. J. Electron. Manuf. 1999, 9, 29–40. [Google Scholar] [CrossRef]
- Wu, J.N. EOL Product Strategy Analysis and DFE via Neural Networks. Master’s Thesis, Department of Mechanical Engineering, Cheng Kung University, Tainan City, Taiwan, June 2002. [Google Scholar]
- Sousa, I.; Wallace, D. Product classification to support approximate life-cycle assessment of design concepts. Technol. Forecast. Soc. Chang. 2006, 73, 228–249. [Google Scholar] [CrossRef]
- Jack, C.P.; Sua, L.W.; Johnny, C.H. The impacts of technology evolution on market structure for green products. Math. Comput. Model. 2012, 55, 1381–1400. [Google Scholar]
- Xue, W.; Gabrielle, G. Prioritizing material recovery for end-of-life printed circuit boards. Waste Manag. 2012, 32, 1903–1913. [Google Scholar]
- Hongping, Y. A model for evaluating the social performance of construction waste management. Waste Manag. 2012, 32, 1218–1228. [Google Scholar]
- Alltshuller, G. Suddenly the Inventor Appeared: TRIZ, the Theory of Inventive Problem Solving; Technical Innovation Center: Worcester, MA, USA, 1996. [Google Scholar]
- Silveira, G.D.; Slack, N. Exploring the trade-off concept. Int. J. Oper. Prod. Manag. 2001, 21, 949–964. [Google Scholar] [CrossRef]
- Fresner, J.; Jantschgi, J.; Birkel, S.; Bärnthaler, J.; Krenn, C. The theory of inventive problem solving (TRIZ) as option generation tool within cleaner production projects. J. Clean. Prod. 2010, 18, 128–136. [Google Scholar] [CrossRef]
- Zadeh, L.A. Fuzzy sets. Inf. Control 1965, 8, 338–356. [Google Scholar] [CrossRef]
- Gomathi, N.; Rupesh, P.L.; Sridevi, L. Study of E-waste-hazards & recycling techniques—A review. Int. J. ChemTech. Res. 2015, 8, 300–307. [Google Scholar]
- Torretta, V.; Rada, E.C.; Ragazzi, M.; Trulli, E.; Istrate, I.A.; Cioca, L.J. Treatment and disposal of tyres: Two EU Scenarios. Waste Manag. 2015, 45, 152–160. [Google Scholar] [CrossRef] [PubMed]
- Xu, X.; Zeng, X.; Boezen, H.M.; Huo, X. E-waste environmental contamination and harm to public health in China. Front. Med. 2015, 9, 220–228. [Google Scholar] [CrossRef] [PubMed]
- Peeranart, K.; Ravi, N.; Ming, H.W. Electronic waste management approaches: An overview. Waste Manag. 2013, 33, 1237–1250. [Google Scholar]
- Belboom, S.; Renzoni, R.; Deleu, X.; Digneffe, J.M.; Leonard, A. Electrical waste management effects on environment using life cycle assessment methodology: The fridge case study. In Proceedings of the SETAC EUROPE 17th LCA Case Study Symposium Sustainable Lifestyles, Budapest, Hungary, 28 February–1 March 2011; p. 2.
- Duan, H.; Eugster, M.; Hischier, R.; Streicher, P.M.; Li, J. Life cycle assessment study of a Chinese desktop personal computer. Sci. Total Environ. 2009, 407, 1755–1764. [Google Scholar] [CrossRef] [PubMed]
- Hughes, A.M. Strategic Database Marketing; Probus Publishing: Chicago, IL, USA, 1994. [Google Scholar]
- Stone, B. Successful Direct Marketing Methods; NTC Business Books: Lincolnwood, IL, USA, 1995. [Google Scholar]
- Bult, J.R.; Wansbeek, T.J. Optimal selection for direct mail. Mark. Sci. 1995, 14, 378–394. [Google Scholar] [CrossRef]
- Chang, H.C.; Tsai, H.P. Group RFM analysis as a novel framework to discover better customer consumption behavior. Expert Syst. Appl. 2011, 38, 14499–14513. [Google Scholar] [CrossRef]
- David, L.; Olson, B.C. Direct marketing decision support through predictive customer response modeling. Decis. Support Syst. 2012, 54, 443–451. [Google Scholar]
- Cheng, L.C.; Sun, L.M. Exploring consumer adoption of new services by analyzing the behavior of 3G subscribers: An empirical case study. Electron. Commer. Res. Appl. 2012, 11, 89–100. [Google Scholar] [CrossRef]
- Chiang, W. To mine association rules of customer values via a datamining procedure with improved model: An empirical case study. Expert Syst. Appl. 2011, 38, 1716–1722. [Google Scholar] [CrossRef]
- Hu, Y.H.; Huang, T.C.K.; Kao, Y.H. Knowledge discovery of weighted RFM sequential patterns from customer sequence databases. J. Syst. Softw. 2013, 86, 779–788. [Google Scholar] [CrossRef]
- World Business Council for Sustainable Development. Eco-Efficiencyv Creating More Value with Less Impact; World Business Council for Sustainable Development: Geneva, Switzerland, 2000. [Google Scholar]
- Tajima, T. Greening Supply Chain: Enhancing Competitiveness though Green Productivity; Report of the top forum on enhancing competitiveness through green productivity; Asian Productivity Organization: Taipei, Taiwan, 2001; pp. 66–78. [Google Scholar]
- Liu, C.C.; Chen, J.L. An eco-innovative design approach incorporating the TRIZ method without contradiction analysis. J. Sustain. Prod. Des. 2003, 1, 262–272. [Google Scholar]
- Orloff, M. Inventive Thinking through TRIZ; Springer: Berlin, Germany, 2003. [Google Scholar]
- Moehrle, M.G. How combinations of TRIZ tools are used in companies results of a cluster analysis. R&D Manage. 2005, 35, 285–296. [Google Scholar]
- Petrov, V. The laws of system evolution. TRIZ J. 2002, 3, 9–17. [Google Scholar]
- Kaplan, S. An Introduction to TRIZ; Ideation International Inc.: Southfield, MI, USA, 1996. [Google Scholar]
- Contradiction Matrix. Available online: https://triz-journal.com/contradiction-matrix/ (accessed on 12 September 2016).
- Saaty, T.L. The Analytic Hierarchy Process; McGraw-Hill: New York, NY, USA, 1980. [Google Scholar]
- Saaty, T.L. A Scaling Method for Priorities in Hierarchy Structures. J. Math. Psychol. 1979, 3, 243–281. [Google Scholar]
- Kahraman, C.; Cebeci, U.; Ruan, D. Multi-attribute comparison of catering service companies using fuzzy AHP: The case of Turkey. Int. J. Prod. Econ. 2004, 87, 171–184. [Google Scholar] [CrossRef]
- Cheng, A.C.; Chen, C.J.; Chen, C.Y. A fuzzy multiple criteria comparison of technology forecasting methods for predicting the new materials development. Technol. Forecast. Soc. Chang. 2008, 75, 131–141. [Google Scholar] [CrossRef]
- Sander, P.C.; Brombacher, A.C. MIR: The use of Reliability Information Flows as a maturity index for quality management. Qual. Reliab. Eng. Int. 1999, 15, 439–447. [Google Scholar] [CrossRef]


| TRIZ Engineering Parameters | Eco-Efficiency Elements | ||||||
|---|---|---|---|---|---|---|---|
| A | B | C | D | E | F | G | |
| #1–39 | |||||||
| TRIZ Parameters | Eco-Efficiency Elements | ||||||
|---|---|---|---|---|---|---|---|
| A | B | C | D | E | F | G | |
| #1 weight of moving object | H | H | - | - | - | - | - |
| Cluster | No of Green Product Usage | Recency (Days) | Frequency (Times) | Monetary (Hundred US) |
|---|---|---|---|---|
| 1 | 20 | 29 | 7 | 148 |
| 2 | 21 | 33 | 8 | 347 |
| 3 | 9 | 38 | 11 | 487 |
| 4 | 16 | 39 | 13 | 518 |
| 5 | 15 | 40 | 15 | 519 |
| 6 | 19 | 43 | 19 | 529 |
| - | Overall Average | 37 | 12 | 425 |
| Cluster | Reduction | Recycling | Reuse | |||||
|---|---|---|---|---|---|---|---|---|
| 1 | 0.32 | 0.22 | 0.06 | 66 | 15 | 10 | 0.27 | 0.26 |
| 2 | 0.40 | 0.28 | 0.55 | 75 | 21 | 11 | 0.37 | 0.39 |
| 3 | 0.49 | 0.44 | 0.89 | 55 | 23 | 15 | 0.51 | 0.54 |
| 4 | 0.51 | 0.56 | 0.97 | 50 | 25 | 17 | 0.56 | 0.59 |
| 5 | 0.53 | 0.67 | 0.97 | 47 | 27 | 18 | 0.61 | 0.63 |
| 6 | 0.58 | 0.89 | 1.00 | 43 | 29 | 21 | 0.71 | 0.72 |
© 2016 by the author; licensee MDPI, Basel, Switzerland. This article is an open access article distributed under the terms and conditions of the Creative Commons Attribution (CC-BY) license (http://creativecommons.org/licenses/by/4.0/).
Share and Cite
Chen, R.Y. Feedback-Based Eco-Design for Integrating the Recency, Frequency, and Monetary Value of Eco-Efficiency into Sustainability Management. Systems 2016, 4, 30. https://doi.org/10.3390/systems4030030
Chen RY. Feedback-Based Eco-Design for Integrating the Recency, Frequency, and Monetary Value of Eco-Efficiency into Sustainability Management. Systems. 2016; 4(3):30. https://doi.org/10.3390/systems4030030
Chicago/Turabian StyleChen, Rui Yang. 2016. "Feedback-Based Eco-Design for Integrating the Recency, Frequency, and Monetary Value of Eco-Efficiency into Sustainability Management" Systems 4, no. 3: 30. https://doi.org/10.3390/systems4030030
APA StyleChen, R. Y. (2016). Feedback-Based Eco-Design for Integrating the Recency, Frequency, and Monetary Value of Eco-Efficiency into Sustainability Management. Systems, 4(3), 30. https://doi.org/10.3390/systems4030030