Abstract
Complex systems are composed of a large number of individual components. Many of these systems are separable, i.e., they can be split into two coupled subsystems: one with foreground components and another with background components. The former leads to narrow peaks in the frequency spectrum of the system and the latter gives the broad-band part. There is coupling between the two subsystems, but they can be studied separately for purposes of modeling and for analysis of experimental data. Examples from the literature are given from the area of mechanical vibrations, but the approach is quite general and can be adapted to other kinds of problems.
1. Introduction
Complex systems are composed of a large number of individual components or elements. If any measurements are made, the measuring instruments are also part of it and contribute to the complexity of the system. Individually, the components of the dynamic system may be easy to model, but taken together they give rise to a large number of coupled equations that become virtually intractable. This is the main reason why the dynamic behavior of a complex system is often obtained experimentally. An example of a complex mechanical system is an automobile. Vibrations at one or more points on the vehicle can be measured using accelerometers while it is being driven along the road. The output of the system are the vibrations of the automobile, while the roughness of the road surface, combined with the vehicle’s motion is the input.
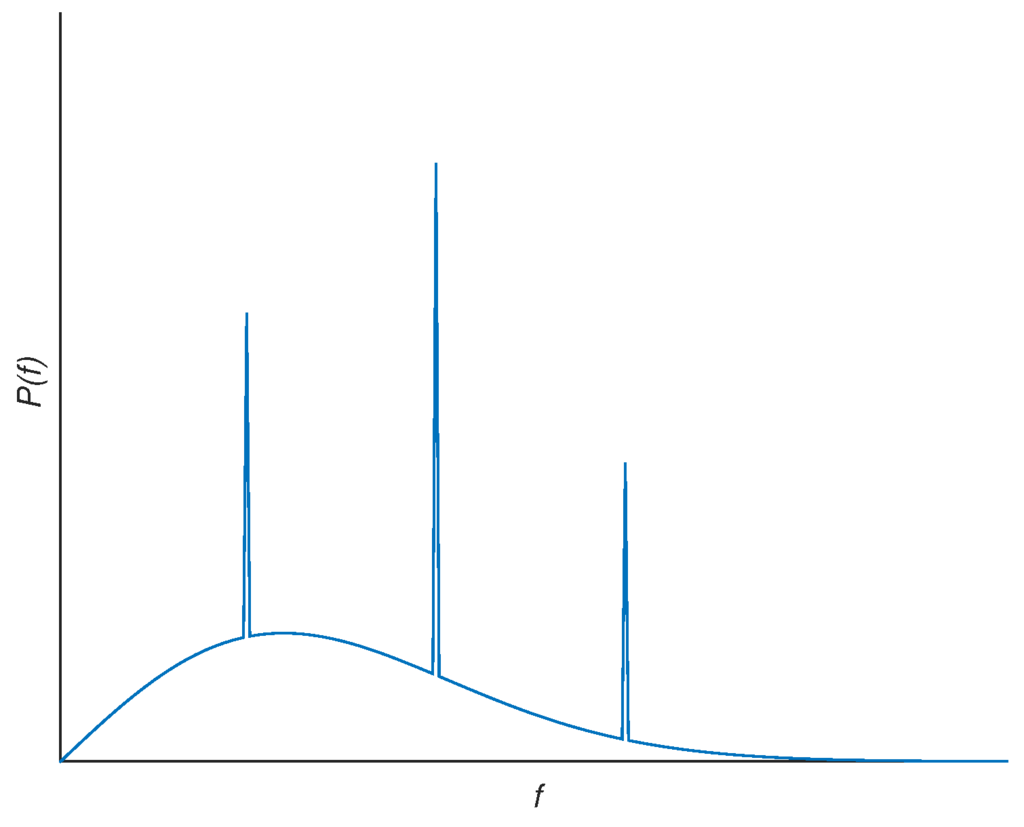
Generally, in the dynamics of physical input-output systems it is common for time responses to be measured, from which the frequency spectrum is then calculated. We will consider complex systems, that we will denote as separable, for which the spectrum has narrow- and broad-band parts as shown schematically in Figure 1. Separated spectra can be observed in published data in many mechanical vibration experiments. As examples, one can cite vibrations in the body [], seat [], gearbox [] and external mirrors [] of automobiles, cavitation in pumps [], in ship-borne antennas [], in operating wind turbines [], in heat exchanger tube banks [] and in vortex-induced vibrations in tensioned steel risers []. There are of course many other examples. The difference between the narrow- and broad-band parts of an experimentally-measured spectrum can be clearly seen in some situations such as vortex shedding due to flow. The narrow-band spikes are due to the vortex shedding itself and the broad-band due to background turbulence; wall pressure measurements clearly show the difference between the two [].

Figure 1.
Typical frequency spectrum of separable system; power spectral density, frequency.
There are even some low-dimensional mathematical models that show both types of spectra. For instance, the Rssler equations, , , , have been analyzed in [], and for one can see that the spectrum has both narrow- as well as broad-band characteristics. In fact the authors observe that “A remarkable feature ... is the presence of sharp frequency components in a chaotic attractor [and] ... the spectrum retains a peak which appears to be instrumentally sharp. We believe this to be a feature of some attractors whose branched manifolds are simply connected ...”.
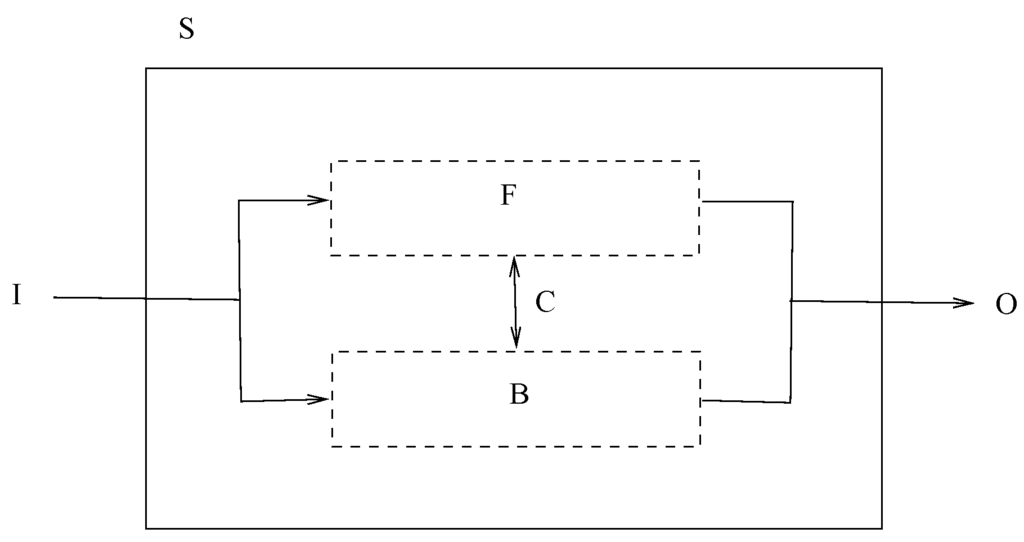
It is proposed here that, in a separable complex system, the system can be divided into at least two coupled subsystems: one has components that are in the foreground and the other are those in the background. The foreground components provide a frequency response that has a small number of sharp, narrow peaks, while the background has a broad-band spectrum. The system can then be schematically separated into subsystems as illustrated in Figure 2. The dashed lines are the two subsystems with a coupling between them. It must be remembered that the separation is merely conceptual for modeling and data-analysis purposes, and may not be truly physical. The conceptual advantage of the separation is that the foreground and background components and subsystems can be studied and understood separately. They may have completely different physical and thus mathematical representations.

Figure 2.
Separation of complex systems. S = system, I = input to system, O = output of system, F = foreground subsystem, B = background subsystem, C = coupling between subsystems.
2. System Separation
2.1. Foreground Subsystem
The components in these subsystems are few and easily identifiable. One of the main characteristics of these components are their natural frequencies, and hence the possibility of resonances with external forcing. Another feature is in-phase or out-of-phase synchronization between the components [,,]. The foreground can be studied by a single- or multiple-degree of freedom oscillatory analysis such as . Resonant frequencies and time responses to external forcing can be determined.
One can also use the principle of separation to analyze experimental data obtained from the dynamic response of a complex system. In fact, this is implicitly the way that complex systems are commonly studied. For instance, if one is interested in the foreground components, the broad-band part of the spectrum is usually filtered out as noise. It must be remembered, however, that the response of the foreground components is appropriately affected by energy transfer within the background components.
2.2. Background Subsystem
The response of the background components is sometimes dismissed as noise, especially if one is interested in the foreground components. Referring to the generic sketch in Figure 1, it can be seen that the background amplitudes that are responsible for energy transfer can be quite low and hence easily confused with noise. However, even in this context, the background components may transfer energy between the foreground modes and thus feed their growth. The transfer of energy between frequencies in the background subsystem is, in principle, nonlinear. The background model can be either equations with self-generated nonlinear chaos [] or linear equations with stochastic inputs [].
With experimental data, if one is interested in the background components, then the response of the foreground components can be filtered out. Again, the foreground components serve as a sink for background energy and in this fashion participate in the process of mechanical vibrations of the entire system.
2.3. Coupling
A linear or nonlinear coupling between the foreground and background subsystems is essential for the transfer of energy between them; otherwise the two subsystems would be decoupled and independent.
In the modeling process the coupling may be zeroed out until the behavior of the two subsystems is properly understood. In the Rssler equations, for example, the term in the first equation is the coupling. Removing it we get , for the first two equations which is a linear, decoupled, foreground model. This can be simplified to , which is responsible for negatively damped, growing, foreground oscillations. The background is the third nonlinear equation which—if there is coupling—saturates the foreground oscillations by draining energy from it.
In experiments, on the other hand, it may be hard to identify the coupling, but it is usually present and unchangeable. In custom-designed experiments, however, it is possible to introduce variable coupling.
3. Data Analysis
Given a complex system and data from that system, the first step is to see whether the system is separable. The response to varying input frequencies is useful in this regard. The hypothesis of separation is easiest to apply in a complex mechanical system such as the vibration of a multi-degree of freedom machine.
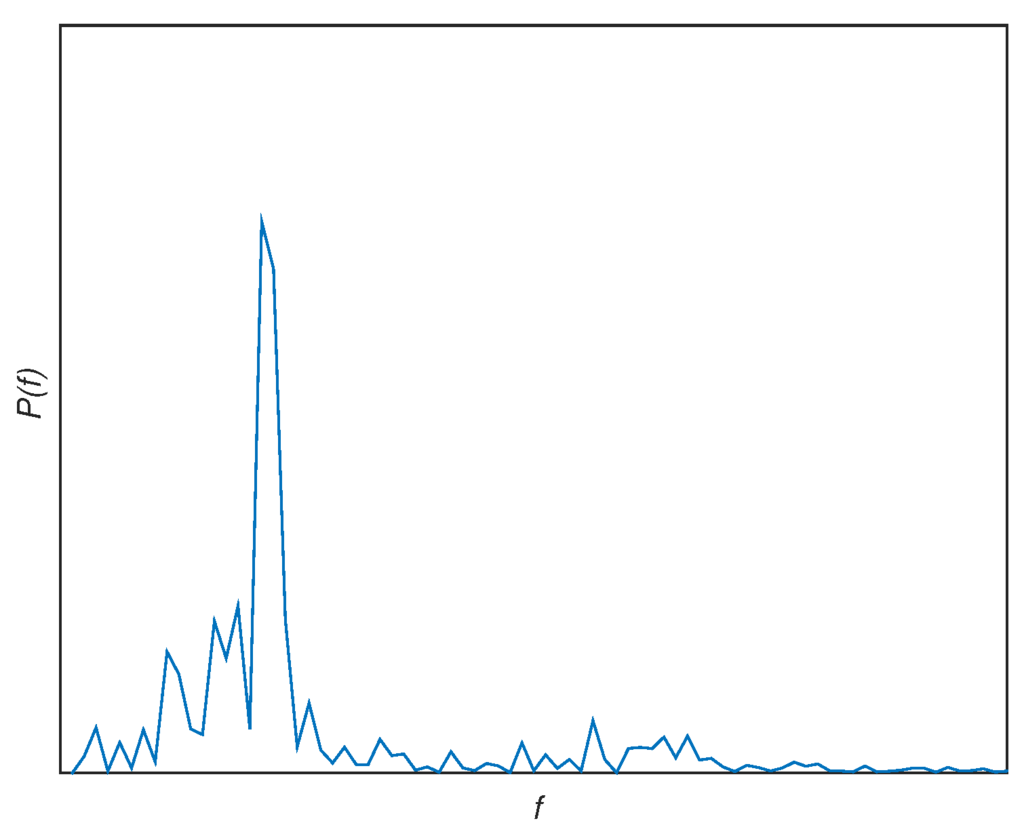
The following is an example of data analysis from actual vibrations in an automobile that illustrates the physical understanding that separation provides. Measurements were made by González-Cruz et al. [] by placing accelerometers at specific locations in an automobile going down the road at a constant speed (details are in that paper). The automobile responds to the roughness of the road surface. This is the background subsystem that gives a broad-band spectrum. In addition, however, every component in the automobile has its own natural frequency or frequencies of vibration that will be picked out by a sensor placed there. For an accelerometer located on the inside of a door, for example, the door itself is a foreground subsystem that contributes peaks that correspond to its natural frequencies. Figure 3 shows a log-log plot of the power spectral density from one such test run obtained from the raw unfiltered data with the mean subtracted out (compare with the ideal spectrum of Figure 1). A major peak can be clearly seen; this is due to the foreground subsystem that is the component where the accelerometer was located. Aside from this, the broad-band part of the spectrum is due to the background subsystem. On discarding the background, for instance, the foreground can be modeled by a low-dimensional set of differential equations. Separation enables the mechanics of the foreground and the background to be independently analyzed and physically understood.

Figure 3.
Power spectral density of an accelerometer placed on an automobile, where f is the frequency. The axes are in arbitrary units.
It is easy in this instance to visually judge whether the spectrum consists of peaks plus a broad-band part. Sometimes it may not be so simple. In such cases a numerical criterion, like the ratio of the maximum value to the average value , i.e., , can be used to find the peaks.
4. Conclusions
The dynamics of some complex systems can be conveniently analyzed by separating them into two subsystems, one consisting of foreground and the other of background components. The two subsystems are coupled but can be modeled and analyzed separately. This separation enables each subsystem to be studied in isolation. The physics in each subsystem and the mechanisms for energy transport may be quite different.
Although the examples cited here are of mechanical systems and their vibrations, the approach is very general and may be applicable to other types of complex systems. Of course there are many non-mechanical examples of complex systems in the physical [], biological [], and social sciences [,], and there is no obvious reason that the principle of separation will be universally applicable, though it is certainly possible. This type of analysis should thus be viewed only as a possible hypothesis for future work on other kinds of systems which have to be considered on a case by case basis.
Conflicts of Interest
The authors declare no conflicts of interest.
References
- Jáuregui-Correa, J.; López-Cajún, C.; Sen, M. Analysis of experimental data from complex multibody system. In Multibody Mechatronic Systems; Ceccarelli, M., Hernandez, E., Eds.; Springer: Cham, Switzerland, 2015; pp. 211–218. [Google Scholar]
- Rakheja, S.; Stiharu, I.; Zhang, H.; Boileau, P.E. Seated occupant interactions with seat backrest and pan, and biodynamic responses under vertical vibration. J. Sound Vib. 2006, 298, 651–671. [Google Scholar] [CrossRef]
- Liu, B.; Riemenschneider, S.; Xu, Y. Gearbox fault diagnosis using empirical mode decomposition and Hilbert spectrum. Mech. Syst. Signal Process. 2006, 20, 718–734. [Google Scholar] [CrossRef]
- Watkins, S.; Oswald, G. The flow field of automobile add-ons–with particular reference to the vibration of external mirrors. J. Wind Eng. Ind. Aerodyn. 1999, 83, 541–554. [Google Scholar] [CrossRef]
- Čudina, M.; Prezelj, J. Detection of cavitation in situ operation of kinetic pumps: Effect of cavitation on the characteristic discrete frequency component. Appl. Acoust. 2009, 70, 1175–1182. [Google Scholar] [CrossRef]
- He, S.; Zi, Y.; Chen, J.; Zhao, C.; Chen, B.; Yuan, J.; He, Z. Incipient-signature identification of mechanical anomalies in a ship-borne satellite antenna system using an ensemble multiwavelet. Meas. Sci. Technol. 2014, 25. [Google Scholar] [CrossRef]
- Avendaño-Valencia, L.D.; Fassois, S.D. Stationary and non-stationary random vibration modelling and analysis for an operating wind turbine. Mech. Syst. Signal Process. 2014, 47, 263–285. [Google Scholar] [CrossRef]
- Hamakawa, H.; Fukano, T.; Nishida, E.; Satou, Y. Flow induced acoustic resonance in in-line tube banks. J. Therm. Sci. 2006, 15, 226–232. [Google Scholar] [CrossRef]
- Lie, H.; Kaasen, K. Modal analysis of measurements from a large-scale VIV model test of a riser in linearly sheared flow. J. Fluids Struct. 2006, 22, 557–575. [Google Scholar] [CrossRef]
- Snarski, S. Flow over yawed circular cylinders: Wall pressure spectra and flow regimes. Phys. Fluids 2004, 16, 344–359. [Google Scholar] [CrossRef]
- Crutchfield, J.; Farmer, D.; Packard, N.; Shaw, R.; Jones, G.; Donnelly, R. Power spectral-analysis of a dynamical system. Phys. Lett. A 1980, 76, 1–4. [Google Scholar] [CrossRef]
- Cai, W.; Sen, M.; Yang, K.; McClain, R. Synchronization of self-sustained thermostatic oscillations in a thermal-hydraulic network. Int. J. Heat Mass Transf. 2006, 49, 4444–4453. [Google Scholar] [CrossRef]
- Jáuregui, J.C.; Sen, M.; López-Cajún, C.S. Experimental characterization of blade vibration synchronization. In Proceedings of the ASME Turbo Expo: Turbine Technical Conference and Exposition, Vancouver, BC, Canada, 6–10 June 2011.
- González-Cruz, C.; Jáuregui-Correa, J.; López-Cajún, C.; Domínguez-González, A.; Sen, M. Experimental analysis of synchronization and dynamics in an automobile as a complex system. Mech. Syst. Signal Proces. 2015, 60–61, 472–484. [Google Scholar] [CrossRef]
- Sekar, P.; Narayanan, S. Chaos in mechanical systems—A review. Sadhana 1995, 20, 529–582. [Google Scholar] [CrossRef]
- Feng, Q.; Pfeiffer, F. Stochastic model on a rattling system. J. Sound Vib. 1998, 215, 439–453. [Google Scholar] [CrossRef]
- West, B.; Bologna, M.; Grigolini, P. Physics of Fractal Operators; Springer: Berlin, Germany, 2003. [Google Scholar]
- Zinovyev, A. Overcoming Complexity of Biological Systems: From Data Analysis to Mathematical Modeling. Math. Model. Nat. Phenom. 2015, 10, 186–206. [Google Scholar] [CrossRef]
- Shang, Y. Finite-time consensus for multi-agent systems with fixed topologies. Int. J. Syst. Sci. 2012, 43, 499–506. [Google Scholar] [CrossRef]
- Shang, Y. Deffuant model of opinion formation in one-dimensional multiplex networks. J. Physi. A Math. Theor. 2015, 48. [Google Scholar] [CrossRef]
© 2016 by the authors; licensee MDPI, Basel, Switzerland. This article is an open access article distributed under the terms and conditions of the Creative Commons Attribution (CC-BY) license (http://creativecommons.org/licenses/by/4.0/).