Designing Service Coverage and Measuring Accessibility and Serviceability of Rural and Small Urban Ambulance Systems

Abstract
:
1. Introduction
2. Literature Review
3. Model Development
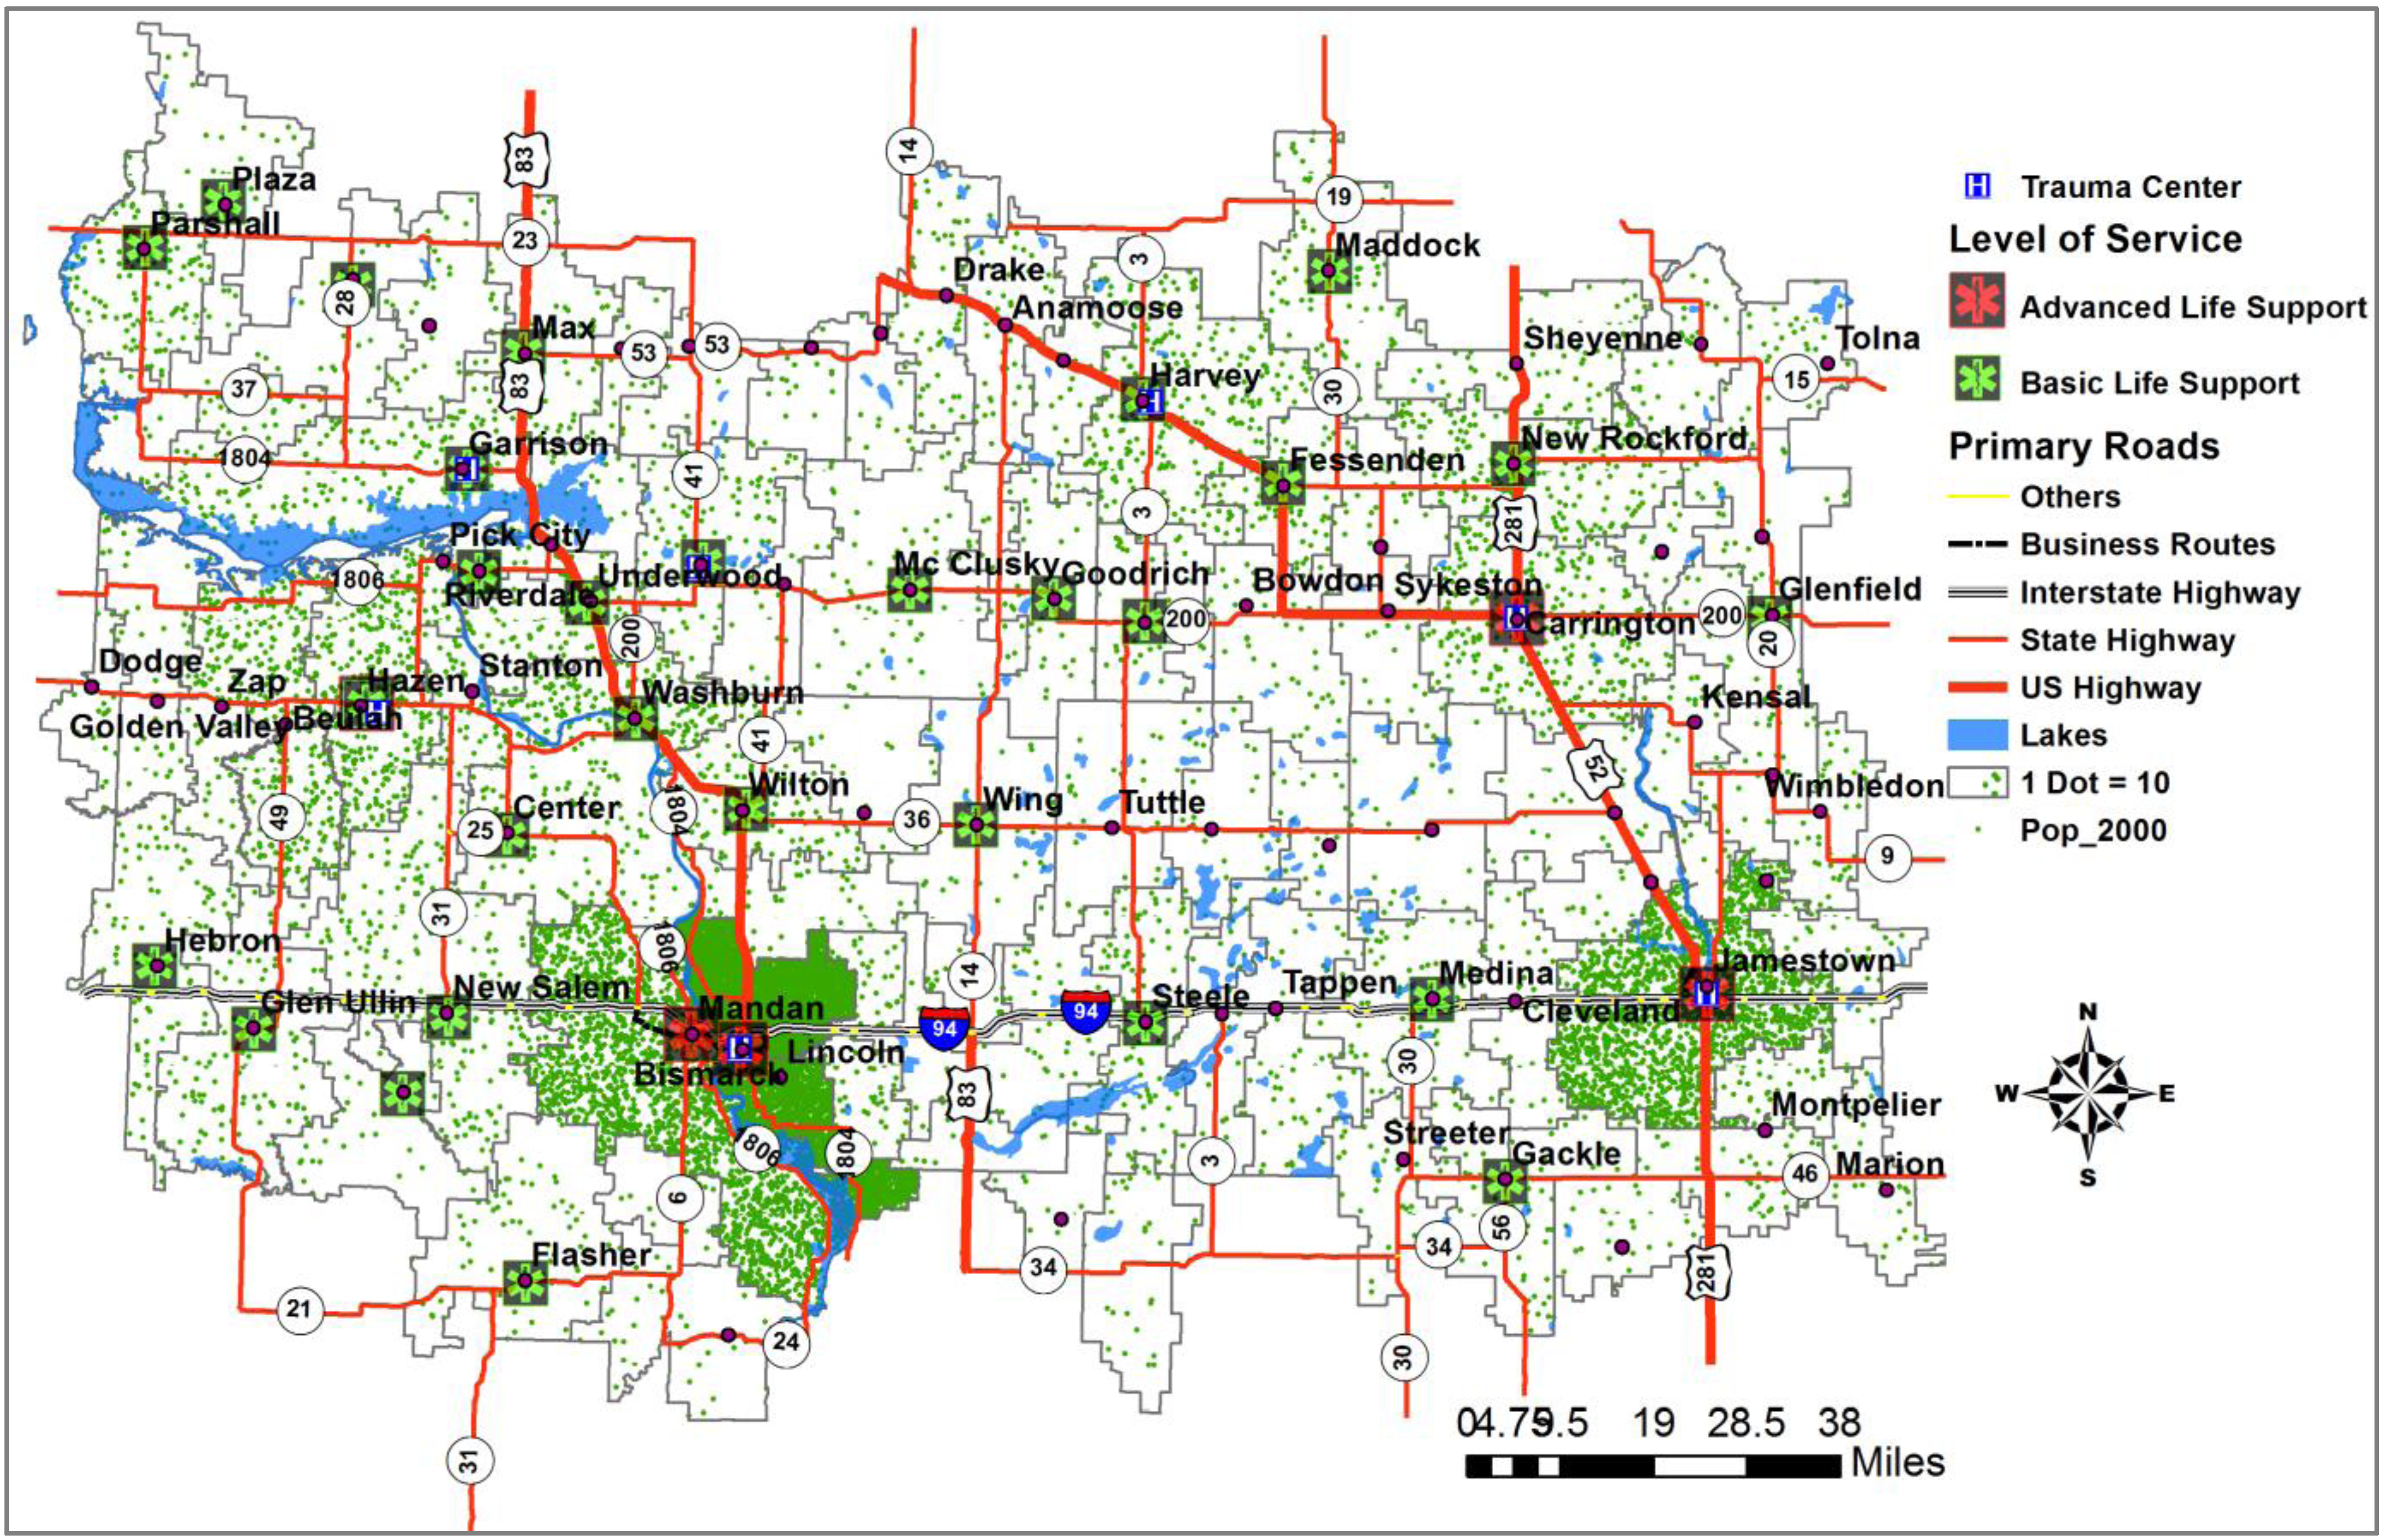
3.1. Data Sources
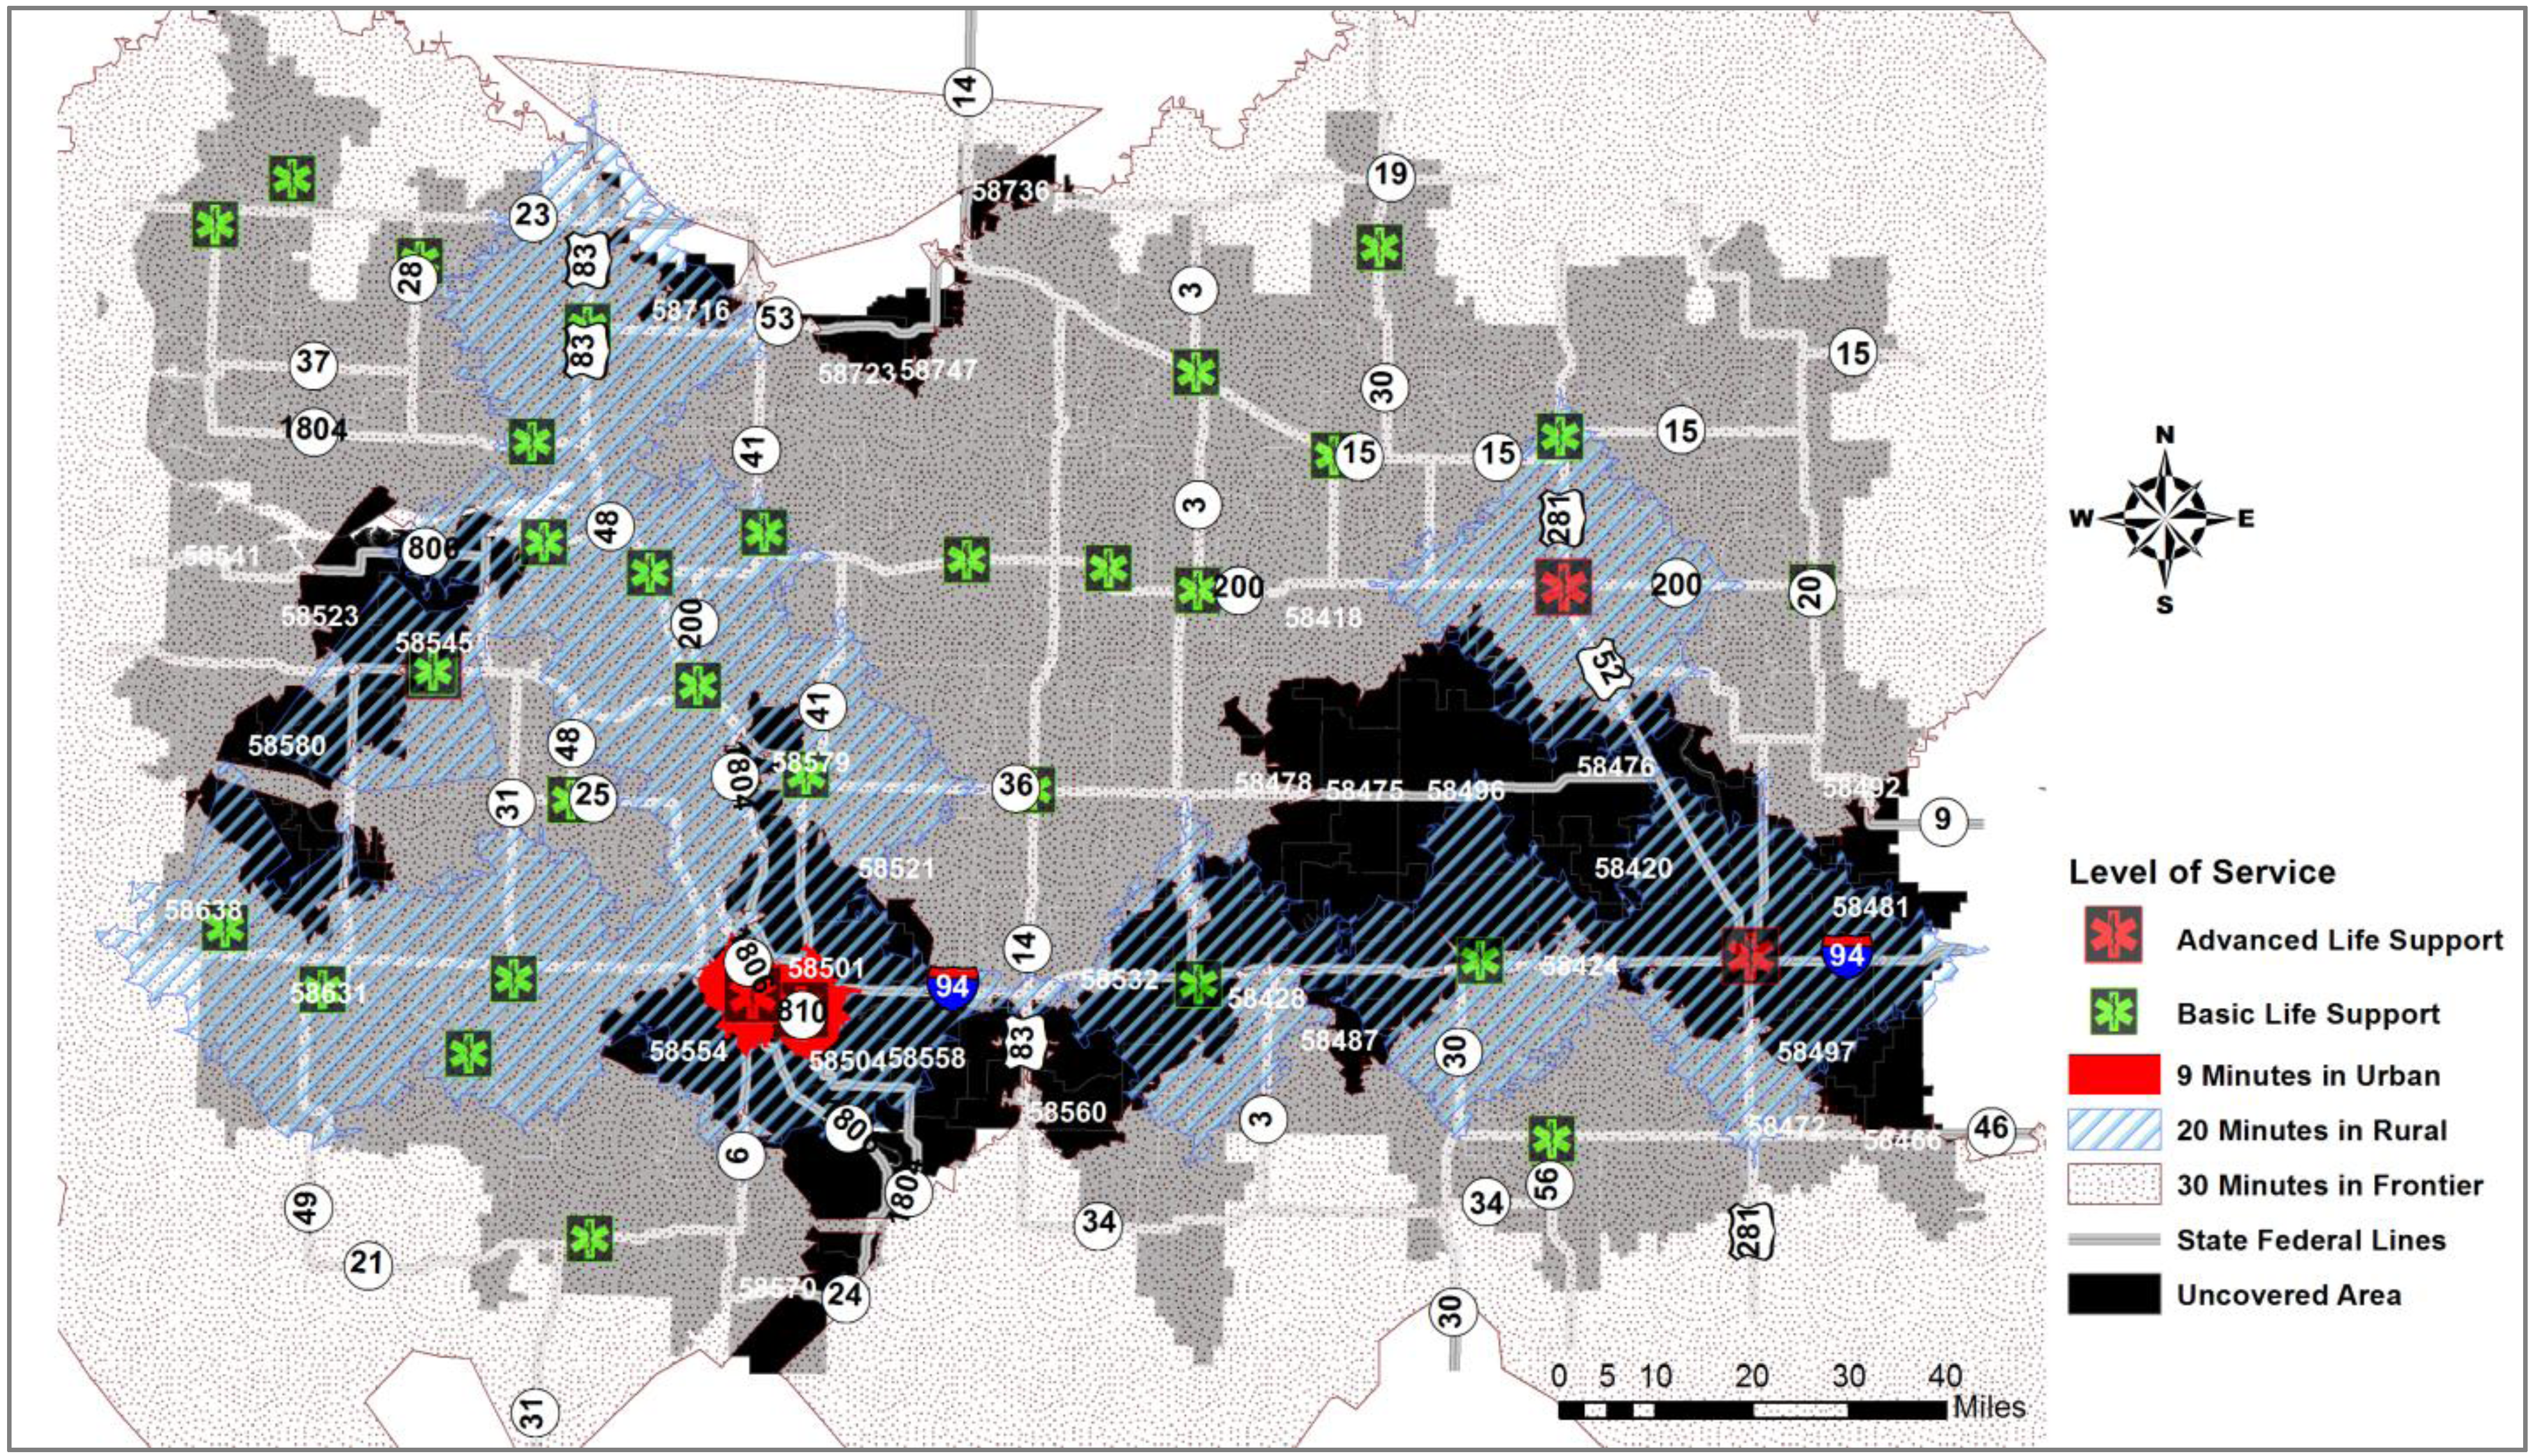
3.2. Service Locations
4. Geospatial Simulation for a Holistic Approach
Proposing Accessibility and Serviceability Using Random Incidents
- M = A set of demand locations (incidents) in a study region
- W = A set of ambulance locations in a study region
- t ji = The quickest travel time from an ambulance location j to an incident i for ∀i ∈ M, j ∈ W
- y ji = 1 if an incident i is connected to an ambulance location j, 0 otherwise for ∀i ∈ M, j ∈ W
- M j = {i ∈ M | y ji = 1}: A set of demand location i served by an ambulance location j for ∀j ∈ W
- W i = {j ∈ W | y ji = 1}: A set of ambulance location j serving a demand location i for ∀i ∈ M
Potential Accessibility
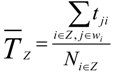
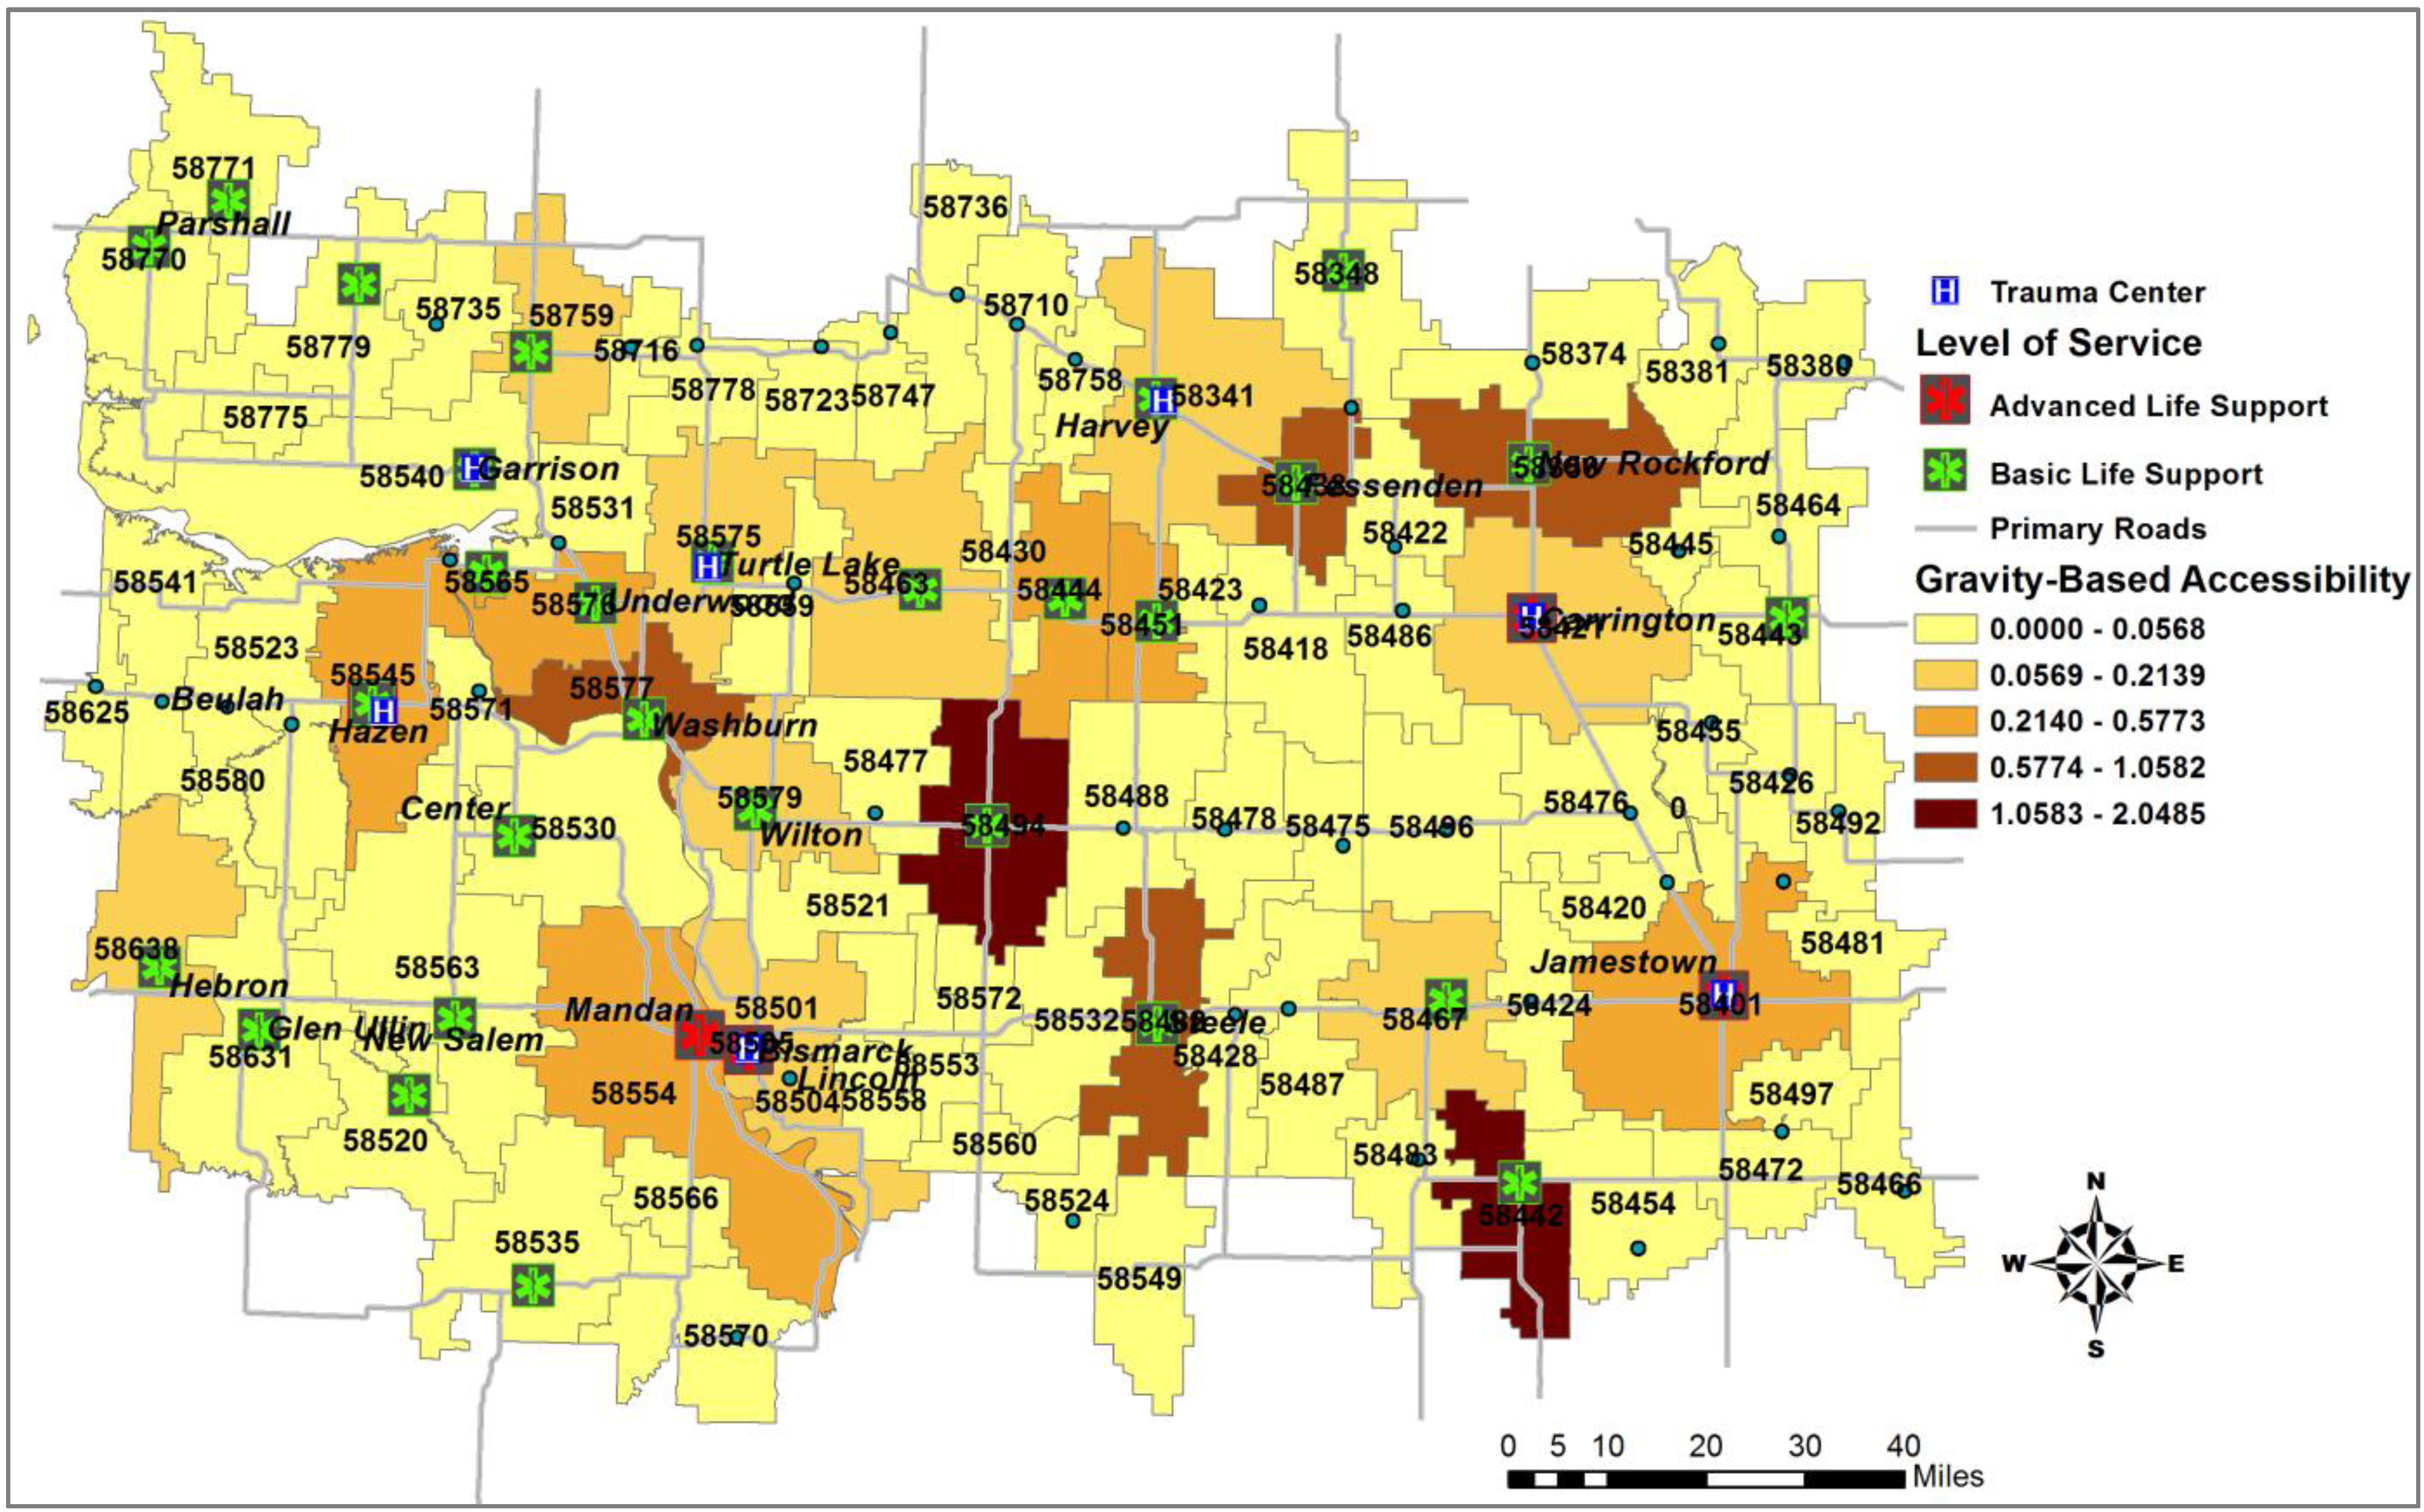
 , depending on whether the ZIP code zone Z belongs to an urban, rural, or frontier area. Each incident is constrained to the closest ambulance only, so one ZIP code zone can be served by one or more ambulance locations. ) required by EMS rules to the average response time in Equation (2). Thus, the balanced index for the accessibility of the ZIP code is one. In other words, if the response time index is greater than one, the residents in the ZIP code enjoy faster service than the recommended service response time, while a poor index (less than one) indicates slower average response time than the recommend response time. Thus, the potential accessibility index (AZ) is a ratio of the recommend travel time ( ) for a zone Z to the average response time of the zone Z in Equation (2).
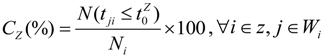
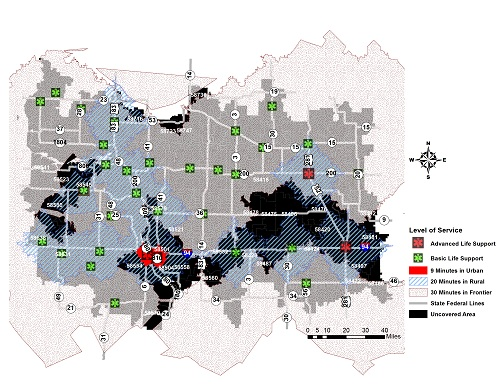
 ) based on area categories. Thus demand-covered-ratio (CZ) is proposed in this study in Equation (3). The demand-covered-ratio, CZ(%) is the ratio of the population in a ZIP code zone within in a recommended response time (N(t ji ≤ )) to the total population in the ZIP code zone, which is represented between 0% and 100%.
Potential Serviceability
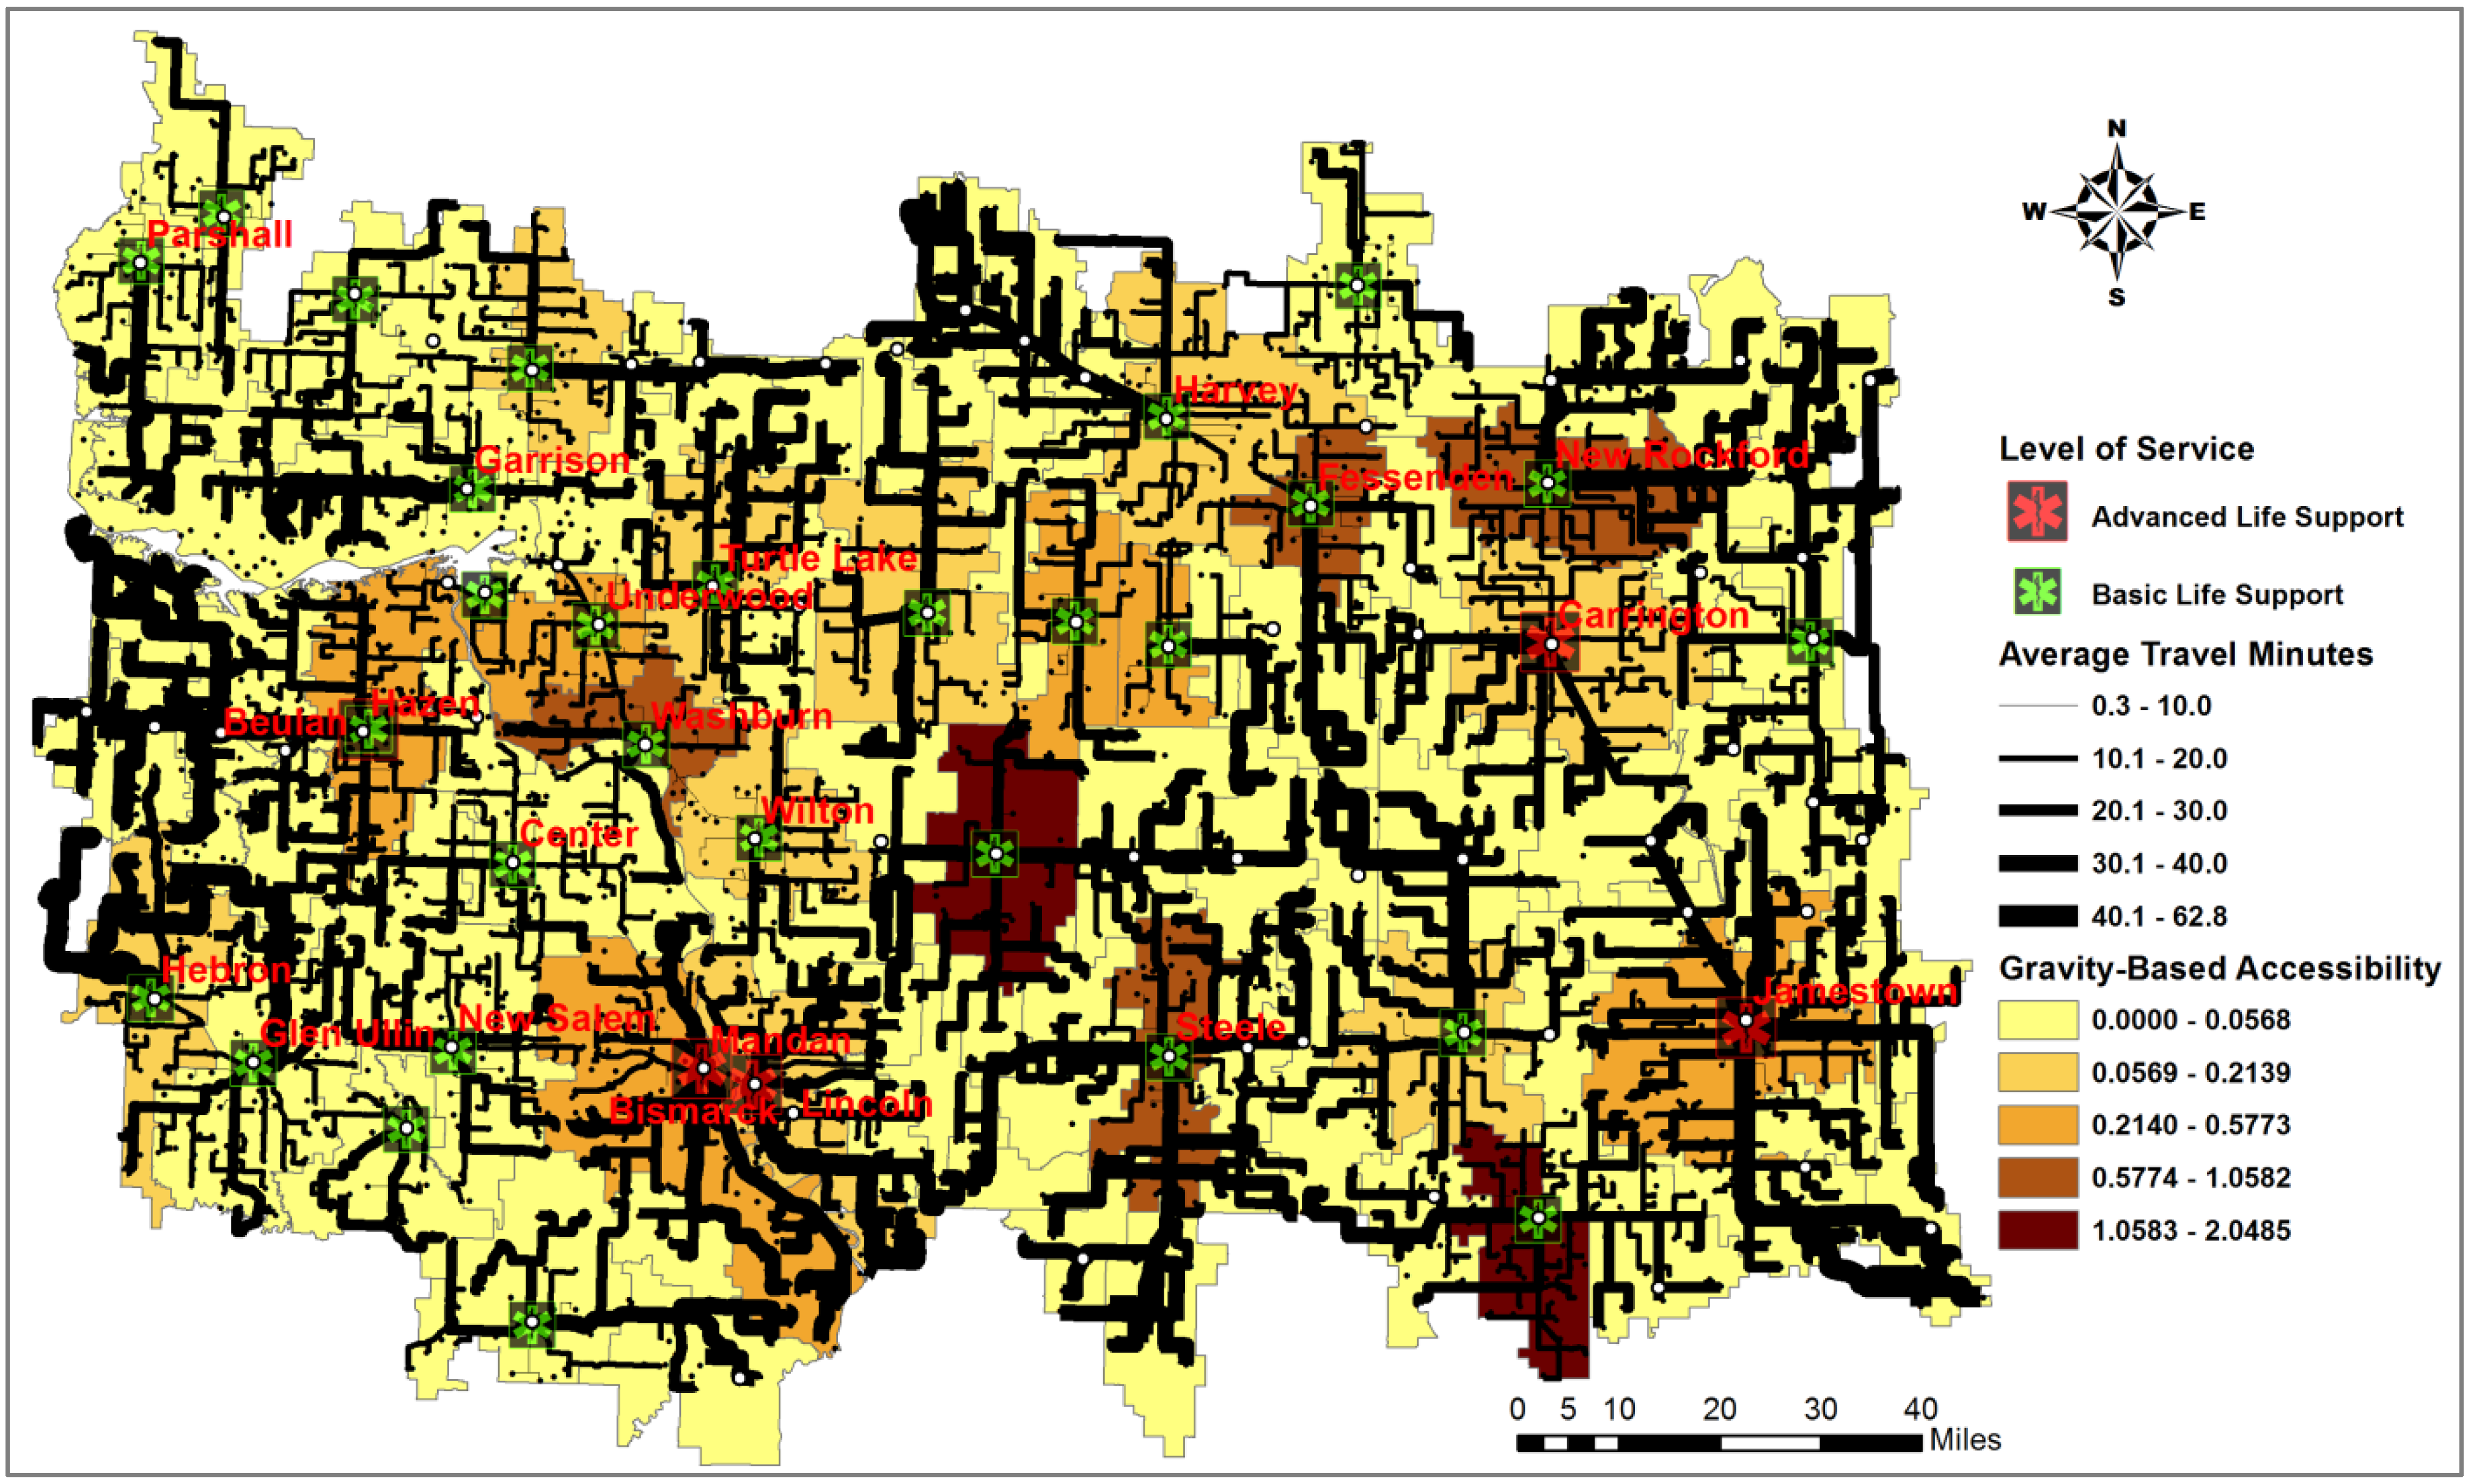
 ) to the hypothetical incidents is the total response time from an ambulance location j to the connected demand i divided by the number of incidents connected to the ambulance location j in Equation (4).

 ) to the average response time of the ambulance location j. The ambulance location j belongs to either an urban, frontier, or rural area in Equation (5).
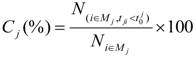
 ) recommended to the number of all incidents served by an ambulance location j, Ni∈M j (6). The ambulance-covering-ratio is in the range of 0% to 100%.
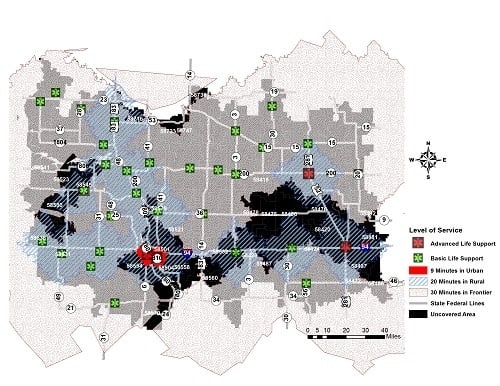
5. Case Study
5.1. Study Area

5.2. The Gravity-Based Two-Step Floating Catchment Area (2SFCA) Method


| ZIP code | Required service time (  ) ) | # of Random events | # of events within | Travel Distance (miles) | Response Time (minutes) | Accessibility (AZ) | Demand–Covered-Ratio (CZ) | ||||
|---|---|---|---|---|---|---|---|---|---|---|---|
| Mean | Min | Max | Mean | Min | Max | ||||||
| 58504 | 9 | 26 | 4 | 18.2 | 2 | 37.7 | 20 | 2.2 | 46.7 | 0.4 | 15.38% |
| 58554 | 9 | 97 | 17 | 15.4 | 0.9 | 35.5 | 17 | 0.9 | 36.1 | 0.5 | 17.53% |
| 58501 | 9 | 28 | 5 | 12.4 | 0.8 | 19.7 | 13.6 | 0.8 | 22.3 | 0.7 | 17.86% |
| 58560 | 20 | 7 | 4 | 30.8 | 25.1 | 36.1 | 31 | 26.6 | 38.8 | 0.6 | 57.14% |
| 58541 | 30 | 24 | 6 | 40.1 | 24.3 | 51.4 | 44.2 | 26.5 | 52.3 | 0.8 | 25.00% |
| 58466 | 30 | 20 | 3 | 37.2 | 25.5 | 47.9 | 36.8 | 24.4 | 48 | 0.8 | 15.00% |
| 58553 | 20 | 6 | 1 | 25.9 | 14.4 | 35.7 | 26.3 | 12.1 | 38.4 | 0.8 | 16.67% |
| 58625 | 30 | 13 | 2 | 38.4 | 33 | 48.3 | 46.4 | 40.5 | 50.4 | 0.9 | 15.38% |
| 58475 | 30 | 11 | 5 | 29.2 | 20.9 | 38.9 | 32.5 | 25.1 | 42.1 | 0.9 | 45.45% |
| 58638 | 20 | 55 | 28 | 17 | 2.9 | 44.9 | 22.9 | 3.2 | 58.9 | 0.9 | 50.91% |
| 58487 | 20 | 23 | 9 | 21.3 | 13.6 | 30.1 | 22.8 | 12.7 | 33.8 | 0.9 | 39.13% |
| 58558 | 20 | 26 | 8 | 21 | 13 | 27.9 | 22.6 | 13.6 | 33.2 | 0.9 | 30.77% |
| 58535 | 30 | 31 | 31 | 10.4 | 1.3 | 21.6 | 12.2 | 1.5 | 23.2 | 2.5 | 100.00% |
| 58575 | 30 | 48 | 48 | 10 | 1.3 | 19.6 | 12.2 | 2.7 | 24 | 2.5 | 100.00% |
| 58356 | 30 | 55 | 55 | 10.6 | 0.6 | 22.9 | 12 | 0.6 | 24.7 | 2.5 | 100.00% |
| 58341 | 30 | 82 | 82 | 10.4 | 0.7 | 17.7 | 11.5 | 0.8 | 23.1 | 2.6 | 100.00% |
| 58442 | 30 | 31 | 31 | 9.4 | 1.5 | 18 | 11.2 | 1.8 | 19.8 | 2.7 | 100.00% |
| 58530 | 30 | 61 | 60 | 9.6 | 0.6 | 23.4 | 11.1 | 0.7 | 36 | 2.7 | 98.36% |
| 58348 | 30 | 50 | 50 | 9.5 | 2.1 | 19 | 10.7 | 2.1 | 23.8 | 2.8 | 100.00% |
| 58771 | 30 | 26 | 26 | 9 | 1.9 | 24 | 10.7 | 2.1 | 26.6 | 2.8 | 100.00% |
| 58770 | 30 | 41 | 40 | 8.8 | 1.9 | 21.7 | 10.4 | 1.9 | 31 | 2.9 | 97.56% |
| 58443 | 30 | 14 | 14 | 8.3 | 2.7 | 12.9 | 10.1 | 4.7 | 15.3 | 3 | 100.00% |
| 58444 | 30 | 19 | 19 | 8.3 | 1.4 | 17 | 9.9 | 1.6 | 21.2 | 3 | 100.00% |
| 58451 | 30 | 11 | 11 | 7.1 | 1.7 | 10.6 | 8.7 | 1.8 | 16.8 | 3.4 | 100.00% |
| 58438 | 30 | 27 | 27 | 6.3 | 2.4 | 11.2 | 6.9 | 2.4 | 12.5 | 4.3 | 100.00% |

| Ambulance Location | Required service time (  ) ) | # of Random events | # of events within | Travel Distance (miles) | Response Time (min) | Serviceability (Sj) | Ambulance-Covering-Ratio (Cj) | ||||
|---|---|---|---|---|---|---|---|---|---|---|---|
| Mean | Min | Max | Mean | Min | Max | ||||||
| 30 | 9 | 83 | 19 | 17.4 | 0.8 | 37.7 | 18.8 | 0.8 | 46.7 | 0.5 | 22.89% |
| 17 | 9 | 93 | 29 | 15.6 | 0.9 | 35.5 | 17.1 | 0.9 | 36 | 0.5 | 31.18% |
| 31 | 20 | 146 | 82 | 20.3 | 3.3 | 50.4 | 22.4 | 3.3 | 62.8 | 0.9 | 56.16% |
| 22 | 20 | 45 | 28 | 14.7 | 2.9 | 33 | 19.9 | 3.2 | 47.1 | 1 | 62.22% |
| 6 | 20 | 133 | 77 | 18.2 | 3.1 | 35.1 | 19.7 | 3.6 | 37.4 | 1 | 57.89% |
| 52 | 20 | 175 | 143 | 18.4 | 0.7 | 47.9 | 18.9 | 0.7 | 48 | 1.1 | 81.71% |
| 45 | 20 | 87 | 71 | 15.9 | 0.5 | 38.9 | 17.5 | 0.6 | 42.1 | 1.1 | 81.61% |
| 24 | 20 | 89 | 66 | 13.7 | 0.7 | 34 | 16.5 | 0.7 | 52.4 | 1.2 | 74.16% |
| 137 | 20 | 78 | 75 | 13.5 | 3.6 | 33.8 | 14.5 | 3.6 | 36.7 | 1.4 | 96.15% |
| 23 | 20 | 15 | 15 | 12.1 | 2.2 | 17.6 | 14.4 | 2.2 | 23.9 | 1.4 | 100.00% |
| 65 | 20 | 93 | 93 | 13.5 | 3.3 | 28.3 | 14.4 | 3.7 | 29.2 | 1.4 | 100.00% |
| 1 | 30 | 73 | 54 | 18.2 | 1.2 | 38.1 | 20.6 | 1.2 | 38.8 | 1.5 | 73.97% |
| 46 | 30 | 102 | 92 | 19.1 | 2.7 | 36.2 | 20.6 | 4.1 | 37.7 | 1.5 | 90.20% |
| 10 | 20 | 63 | 47 | 11.5 | 0.3 | 23.6 | 12.9 | 0.3 | 24.6 | 1.5 | 74.60% |
| 69 | 30 | 117 | 103 | 16.8 | 0.7 | 39.9 | 17.7 | 0.8 | 39.7 | 1.7 | 88.03% |
| 7 | 20 | 16 | 16 | 9.6 | 0.9 | 13.6 | 11.9 | 0.9 | 17.6 | 1.7 | 100.00% |
| 90 | 30 | 62 | 60 | 14.8 | 4 | 30.8 | 17.1 | 6.2 | 36.1 | 1.8 | 96.77% |
| 2 | 20 | 53 | 50 | 10.2 | 2.7 | 23.3 | 11.4 | 2.6 | 26.7 | 1.8 | 94.34% |
| 26 | 30 | 42 | 36 | 13.9 | 1.3 | 29.5 | 16 | 1.5 | 37.1 | 1.9 | 85.71% |
| 42 | 30 | 117 | 112 | 14.8 | 0.6 | 37.2 | 15.9 | 0.6 | 36.6 | 1.9 | 95.73% |
| 130 | 30 | 82 | 79 | 13.3 | 1.3 | 27.5 | 15.7 | 2.7 | 30.9 | 1.9 | 96.34% |
| 57 | 30 | 86 | 78 | 13.9 | 1.5 | 30.1 | 15.6 | 1.8 | 32.6 | 1.9 | 90.70% |
| 4 | 20 | 44 | 43 | 9.4 | 1.2 | 23.4 | 10.5 | 1.4 | 25.1 | 1.9 | 97.73% |
| 25 | 30 | 75 | 73 | 13.7 | 2.7 | 28.6 | 15.3 | 2.9 | 40.8 | 2 | 97.33% |
| 91 | 30 | 41 | 41 | 12.6 | 1.6 | 25.7 | 14.3 | 1.8 | 28.5 | 2.1 | 100.00% |
| 86 | 30 | 58 | 56 | 13.1 | 1.9 | 30.5 | 14.3 | 1.9 | 31.2 | 2.1 | 96.55% |
| 5 | 20 | 49 | 49 | 8.2 | 1.8 | 14.1 | 9.7 | 2 | 19.8 | 2.1 | 100.00% |
| 100 | 30 | 30 | 29 | 11.6 | 1.7 | 29.7 | 13.6 | 1.8 | 34.1 | 2.2 | 96.67% |
| 95 | 30 | 34 | 34 | 11.7 | 1.4 | 21.9 | 13.3 | 1.6 | 24.3 | 2.2 | 100.00% |
| 34 | 30 | 20 | 20 | 11.1 | 3.6 | 18.6 | 13.3 | 5.1 | 21.7 | 2.3 | 100.00% |
| 28 | 30 | 73 | 64 | 10.7 | 0.6 | 21.5 | 12.3 | 0.7 | 24.5 | 2.4 | 87.67% |
| 97 | 30 | 75 | 73 | 11.5 | 2.4 | 34.5 | 12.3 | 2.4 | 38.8 | 2.4 | 97.33% |
| 117 | 30 | 56 | 56 | 10.1 | 2.1 | 19 | 11.4 | 2.1 | 23.8 | 2.6 | 100.00% |
| 85 | 30 | 29 | 29 | 9.6 | 1.9 | 24 | 11.4 | 2.1 | 26.6 | 2.6 | 100.00% |
6. Conclusions and Limitations
Acknowledgments
Conflicts of Interest
References
- Burkey, M.L.; Bhadury, J.; Eiselt, H.A. A location-based comparison of health care services in four U.S. states with efficiency and equity. Socio-Econ. Plan. Sci. 2012, 46, 157–163. [Google Scholar] [CrossRef]
- North Dakota Department of Health. North Dakota Ambulance Response Areas Map Book; North Dakota Department of Health: Bismarck, ND, USA, 2009. [Google Scholar]
- North Dakota Legislative Branch. Chapter 33-11-01.2. North Dakota Ground Ambulance Services. Available online: http://www.legis.nd.gov/information/acdata/pdf/33-11-01.2.pdf (accessed on 11 November 2010).
- SafeTech Solutions, LLP. A Crisis and Crossroad in Rural North Dakota Emergency Medical Services: For the North Dakota Rural EMS Improvement Project; North Dakota Department of Health: Bismarck, ND, USA, June 2011. [Google Scholar]
- Radke, J.; Cova, T.; Sheridan, M.F. Application challenges for geographic information science: Implications for research, education, and policy for emergency preparedness and response. J. Urban Reg. Inf. Syst. Assoc. 2000, 12, 15–30. [Google Scholar]
- Church, R.L. Geographical information systems and location science. Comput. Oper. Res. 2002, 29, 541–562. [Google Scholar] [CrossRef]
- Schuurman, N.; Fiedler, R.S.; Grzybowski, S.C.W. Defining rational hospital catchment for non-urban areas based on travel-time. Int. J. Health Geogr. 2006, 5, 1–11. [Google Scholar] [CrossRef]
- Knox, P.L. The accessibility of primary care to urban patients: A geographical analysis. J. R. Coll. Gen. Pract. 1979, 29, 160–168. [Google Scholar]
- Parker, E.B.; Campbell, J.L. Measuring access to primary medical care: Some examples of the use of geographical information systems. Health Place 1998, 4, 183–193. [Google Scholar] [CrossRef]
- Miller, H.J.; Shaw, S.L. Geographic Information Systems for Transportation; Oxford University Press: New York, NY, USA, 2001. [Google Scholar]
- Beraldi, P.; Brundi, M.E.; Conforti, D. Designing robust emergency medical service via stochastic programming. Eur. J. Oper. Res. 2004, 158, 183–193. [Google Scholar] [CrossRef]
- Peters, J.; Hall, G.B. Assessment of ambulance response performance using a geographical information system. Soc. Sci. Med. 1999, 49, 1551–1566. [Google Scholar]
- McGrail, M.R.; Humphreys, J. Measuring spatial accessibility to primary care in rural areas: Improving the effectiveness of the two-step floating catchment area method. Appl. Geogr. 2009, 29, 533–541. [Google Scholar] [CrossRef]
- Knox, P.L. The intra urban ecology of primary medical care: Patterns of accessibility and their policy implications. Environ. Plan. A 1978, 10, 415–435. [Google Scholar]
- Arentze, T.A.; Borgers, A.W.J.; Timmerman, H.J.P. Spatial Analytical Perspectives on GIS: Integrating GIS into the Planning Process; Taylor & Francis Ltd.: Bristol, UK, 1996. [Google Scholar]
- Church, R.L. Location Modeling and GIS; John Wiley & Sons: New York, NY, USA, 1997. [Google Scholar]
- Hale, T.S.; Moberg, C.R. Location science research: A review. Ann. Oper. Res. 2003, 123, 21–35. [Google Scholar] [CrossRef]
- Beaumont, J.R. Location-allocation problems in the plane: A review of some models. Socioecon. Plan. Sci. 1981, 15, 217–229. [Google Scholar] [CrossRef]
- ReVelle, C.S.; Eiselt, H.A. Location analysis: A synthesis and survey. Eur. J. Oper. Res. 2005, 165, 1–19. [Google Scholar] [CrossRef]
- Radke, J.; Mu, L. Spatial decompositions, modeling and mapping service regions to predict access to social programs. Geogr. Inf. Sci. 2000, 6, 105–112. [Google Scholar]
- Luo, W.; Wang, F. Measures of spatial accessibility to health care in a GIS environment: Synthesis and a case study in the Chicago region. Environ. Plan. B Plan. Des. 2003, 30, 865–884. [Google Scholar] [CrossRef]
- Joseph, A.E.; Phillips, D.R. Accessibility and Utilization: Geographical Perspectives on Health Care Delivery; Harper and Row: New York, NY, USA, 1984. [Google Scholar]
- Winston, W.L. Operations Research: Application and Algorithms, 4th ed.; Thomson Learning: Belmont, CA, USA, 2004. [Google Scholar]
- Timmermans, H.; Arentz, T.; Joh, C.H. Analyzing space-time behavior: New approaches to old problems. Prog. Hum. Geogr. 2002, 16, 175–190. [Google Scholar] [CrossRef]
- Luo, W. Using a GIS-based floating catchment method to assess areas with shortage of physicians. Health Place 2004, 10, 1–11. [Google Scholar] [CrossRef]
- Higgs, G. The role of GIS for health utilization studies: Literature review. Health Serv. Outcomes Res. Method 2009, 9, 84–99. [Google Scholar] [CrossRef]
- Joseph, A.E.; Bantock, P.R. Measuring potential physical accessibility to general practitioners in rural areas: A method and case study. Soc. Sci. Med. 2002, 16, 85–90. [Google Scholar] [CrossRef]
- Murawski, L.; Church, R.L. Improving accessibility to rural health services: The maximal covering network improvement problem. Socio-Econ. Plan. Sci. 2009, 43, 102–110. [Google Scholar] [CrossRef]
© 2014 by the authors; licensee MDPI, Basel, Switzerland. This article is an open access article distributed under the terms and conditions of the Creative Commons Attribution license (http://creativecommons.org/licenses/by/3.0/).
Share and Cite
Lee, E. Designing Service Coverage and Measuring Accessibility and Serviceability of Rural and Small Urban Ambulance Systems. Systems 2014, 2, 34-53. https://doi.org/10.3390/systems2010034
Lee E. Designing Service Coverage and Measuring Accessibility and Serviceability of Rural and Small Urban Ambulance Systems. Systems. 2014; 2(1):34-53. https://doi.org/10.3390/systems2010034
Chicago/Turabian StyleLee, EunSu. 2014. "Designing Service Coverage and Measuring Accessibility and Serviceability of Rural and Small Urban Ambulance Systems" Systems 2, no. 1: 34-53. https://doi.org/10.3390/systems2010034
APA StyleLee, E. (2014). Designing Service Coverage and Measuring Accessibility and Serviceability of Rural and Small Urban Ambulance Systems. Systems, 2(1), 34-53. https://doi.org/10.3390/systems2010034