Abstract
This study explores the innovative application of Artificial Intelligence (AI) in transforming data engineering practices, with a specific focus on optimizing data modeling and data warehouse automation for Business Intelligence (BI) systems. The proposed framework automates the creation of Data Vault models directly from raw source tables by leveraging the advanced capabilities of Large Language Models (LLMs). The approach involves multiple iterations and uses a set of LLMs from various providers to improve accuracy and adaptability. These models identify relevant entities, relationships, and historical attributes by analyzing the metadata, schema structures, and contextual relationships embedded within the source data. To ensure the generated models are valid and reliable, the study introduces a rigorous validation methodology that combines syntactic, structural, and semantic evaluations into a single comprehensive validity coefficient. This metric provides a quantifiable measure of model quality, facilitating both automated evaluation and human understanding. Through iterative refinement and multi-model experimentation, the system significantly reduces manual modeling efforts, enhances consistency, and accelerates the data warehouse development lifecycle. This exploration serves as a foundational step toward understanding the broader implications of AI-driven automation in advancing the state of modern Big Data warehousing and analytics.
1. Introduction
The rapid expansion of Big Data has fundamentally transformed a wide range of industries, from healthcare and finance to retail and manufacturing, creating both opportunities and challenges in data management. The increased volume, velocity, and variety of data generated by different businesses have made traditional data management practices insufficient. As a result, advanced data techniques for data integration, storage, and analysis are needed to handle these complexities while enabling faster access to meaningful insights. In response, organizations are increasingly turning to cloud computing platforms, which offer scalable infrastructure and powerful processing capabilities that enable them to store, process, and analyze vast amounts of data with flexibility and efficiency. A study conducted in 2022 analyzed the transition of sectors such as education and healthcare to cloud environments based on criteria such as accessibility, cybersecurity, and elasticity [1]. In addition, a recent industry survey conducted in January 2023 among 104 data professionals from Romania and the United Kingdom revealed that only 7% still rely exclusively on on-premises systems, while more than 90% work with cloud-native or hybrid environments. The respondents represented a diverse mix of IT roles, including data engineering, data/cloud architecture, data science, and other data-related activities, such as visualization, delivery, and testing, spanning multiple industries [2].
In modern enterprises, data-driven decision-making has become essential to maintain a competitive edge, yet the rapid increase in data volume, velocity, and variety challenges the limits of traditional data management approaches. Business Intelligence (BI) and analytics initiatives now depend on integrating information from diverse, often fragmented, data sources, which require scalable and flexible data warehousing solutions. A well-designed data warehouse serves as a centralized authoritative source, combining historical data from multiple systems to support analytics and reporting. However, the efficiency and agility of these systems depend heavily on the quality of their underlying data model, which governs how data is stored, retrieved, and interpreted. Poor modeling choices can lead to bottlenecks, data redundancy, and scalability issues, affecting the very goals of BI. Therefore, selecting a robust data modeling methodology is not just a technical concern but a strategic one, critical to ensuring data integration, maintaining data quality, and supporting long-term adaptability.
At the same time, the exponential growth of data, driven by digital transformation, IoT, and smart technologies, makes it increasingly difficult for organizations to derive actionable insights from complex and unstructured sources [3]. In this evolving context, data warehouses remain the foundation of enterprise BI systems, providing centralized storage and advanced analytical capabilities. However, their success hinges on how well the data is modeled. A strong data model ensures that the information is logically structured, consistently organized, and efficiently queried, enabling timely and informed decision-making. In contrast, outdated or fragmented modeling techniques risk creating data silos, inefficiencies, and reduced system scalability, limiting the value of enterprise analytics. Thus, choosing the right modeling framework is essential, which serves as the backbone for reliable high-quality data analysis and enterprise-wide intelligence.
Several methodologies have been proposed to structure data for analytics, with the two classical approaches being Inmon’s normalized approach [4] and Kimball’s [5] dimensional star schema. While effective for many Business Intelligence applications, these models can be rigid when adapting to rapid change or integrating new data sources. Data Vault modeling, introduced by Linstedt [6] and refined in Data Vault 2.0 [7], addresses these challenges by emphasizing historical traceability, flexibility, and scalability through its use of hubs, links, and satellites. However, Data Vault remains complex and resource-intensive, with data modeling and ETL processes among the most time-consuming phases of warehouse development [8,9], highlighting the need for tools that accelerate modeling workflows without compromising accuracy or compliance.
Artificial Intelligence, particularly Large Language Models, offer a promising direction for automating and optimizing data modeling tasks. These models, such as OpenAI’s GPT-4, Google’s Gemini, and Meta’s LLaMA, are capable of interpreting natural language prompts, generating structured output, and supporting a wide range of data engineering and software design applications [10,11,12,13]. LLMs are already being used in technical domains to automate code generation, interpret metadata, infer relationships between entities, and produce SQL scripts for schema definitions. Their ability to comprehend domain-specific language and generate consistent high-quality results positions them as useful tools in tasks traditionally reliant on expert judgment. For example, the authors of [14] demonstrated the potential of GPT models to draft the Data Vault DDL, although they noted limitations in ensuring full compliance with formal modeling standards.
This paper presents an AI-based framework that leverages LLMs to automate the generation of Data Vault models from high-level specifications. To evaluate its feasibility, we explore two central research questions:
RQ1: To what extent can an AI model comply with the principles and standards of Data Vault modeling? This question focuses on whether an LLM can consistently generate schema components (hubs, links, and satellites) that align with the best practices and constraints defined by the Data Vault 2.0 methodology.
RQ2: What are the benefits and limitations of using LLMs in this context? This includes assessing the performance, flexibility, and accuracy of the generated models, as well as understanding the scenarios in which AI assistance provides value or may require human correction.
To answer these questions, we conducted a set of controlled experiments using multiple datasets with increasing complexity. The output generated by the LLMs was evaluated based on a formal checklist of Data Vault 2.0 compliance rules, complemented by expert feedback. The study highlights the strengths of LLMs in accelerating early-stage modeling and identifies areas where additional constraints, prompt engineering, or post-processing are needed to ensure compliance and robustness.
In summary, this paper contributes to the intersection of AI, Business Intelligence, and data warehousing by demonstrating how LLMs can enhance the agility and scalability of data modeling processes. It also lays the groundwork for future hybrid modeling frameworks that combine the generative capacity and adaptability of AI with the precision and control of human experts. Thus, it paves the way for more intelligent and responsive BI ecosystems that are better equipped to meet the demands of today’s data-driven enterprises.
The current paper is structured as follows: It begins with a brief introduction of data warehouse modeling systems and the challenges posed by the increasing volume of sources and entities. This is followed by a comprehensive literature review and discussion of the related work. Next, the research methodology is presented along with the proposed approach for generating Data Vault models, including the validation process and evaluation criteria. The paper then introduces the architecture of the proposed framework. Section 4 details the experimental setup, including the datasets and Large Language Models used, the evaluation metrics considered, and an analysis of the results obtained through multiple iterations. The final section concludes the article and outlines directions for future research.
2. Literature Review
2.1. Data Modeling Approaches and the Data Vault Methodology
Data modeling represents a critical process in the design and management of data warehouses, providing a blueprint of how data is structured, stored, and accessed. Its role is to define and organize the entities and relationships of the data, ensuring that the result is accurate, consistent, and accessible to end users through various applications. There are various approaches to data modeling, each tailored to different business needs.
The main methodologies used for data warehouse projects are Dimensional Modeling, proposed by Ralph Kimball, and the Corporate Information Factory (CIF), proposed by Bill Inmon [15]. Bill Inmon, known as the ’father of data warehousing’, advocated for a centralized Enterprise Data Warehouse (EDW) where data from multiple sources are stored in a single integrated repository using a top-down approach [4]. This EDW is modeled in third normal form (3NF), serving as the authoritative source for downstream data marts.
Ralph Kimball, on the other hand, proposed the use of Dimensional Modeling as the foundation for data warehouses, following a bottom-up approach in which data is organized directly into star schemas consisting of fact and dimension tables to serve specific business needs [5]. This approach enables faster delivery of analytical capabilities and follows an iterative and agile process.
The key distinction is that Kimball’s methodology uses fact and dimension tables as the central design of the entire data warehouse. In contrast, the CIF approach keeps EDW fully normalized in 3NF, and fact and dimension tables are introduced only at a later stage, when building dependent data marts for reporting and analytics [8,16,17].
The Data Vault model replaces conventional fact and dimension tables with hubs, satellites, and links. To summarize the purpose of these key elements, the hub tables store the core business concepts (such as vendors, products, and customers) and only contain the business key and some metadata, while the attributes and details of the entities are stored in satellite tables, which also preserve the history of the data; link tables connect multiple entities with relationships, ranging from one-to-one to many-to-many [18]. In addition to the standard key elements described earlier, the complexity of the model can increase by including additional Data Vault components, such as bridge tables or PIT (point-in-time) tables, used to handle large amounts of data and increase performance [7].
Compared to traditional Dimensional Modeling, the Data Vault approach offers distinct advantages and challenges. One key advantage is its alignment with agile project management since development can be structured into sprints. Data Vault is also particularly effective at integrating multiple data sources through satellite tables, whereas Dimensional Modeling typically requires structural changes to accommodate new sources. With respect to loading efficiency, Data Vault enables independent and parallel data loading, while Dimensional Modeling introduces dependencies that restrict parallel loading. However, Data Vault also presents challenges, particularly in query performance, due to the large number of tables and the consequent reliance on careful model design. Studies have shown that Data Vault can perform well, and many of its challenges can be addressed depending on the project requirements [17,18].
This paper introduces a novel contribution to the field of Data Vault modeling by addressing gaps in the existing literature. Although there are limited specialized studies in the literature that have mainly focused on Data Vault, focusing instead on comparing Data Vault to traditional data warehouse methodologies in terms of ETL implementation, life cycle management, or traceability [19], for instance, presents a comparative theoretical study between Inmon, Kimball, and Data Vault that highlights Data Vault’s flexibility in case of source changes and methodological agility without including experimental performance measurements. Subsequently, an experimental study in the telecom field [20] was conducted that provides empirical evidence that Data Vault is better at auditability and ETL, but insufficient for direct reporting. The experiment was conducted on a single case, so it is not generalizable and does not address long-term operational costs. Ref. [21] discusses new types of data (semi-structured and Big Data) and shows how Data Vault can handle these cases, with limited emphasis on quantitative assessments or cost–benefit analysis. Taken together, these works suggest that Data Vault is more flexible and scalable than classical methods, yet the literature remains fragmented: there are few extensive empirical studies and very little research on costs and performance in large industrial scenarios. With respect to AI integration, Helskyaho conducted a study that focuses on a limited dataset [14]. This study aimed to explore the challenges of modeling large and complex structures and combining data modeling with different prompt engineering techniques. The primary focus of the existing studies has been on providing an overview of Data Vault or evaluating it in comparison to traditional data warehouse methodologies. Specifically, they have explored the difficulties of modeling a large number of tables, adapting to dynamic changes in existing models, the unique transformations required by Data Vault, and the potential for human errors in manual model creation.
2.2. Artificial Intelligence in Data Modeling: LLMs and Prompt Engineering
Considering all the challenges and effort involved in designing the Data Vault data model, the integration of AI and LLMs might offer a powerful advantage. AI can speed up the traditionally time-consuming tasks of deriving data definition by quickly generating data structures and identifying potential relationships. In a recent paper, Helskyaho [22] used LLMs to generate data definition structures for a Data Vault model, providing the initial data structure as input. Using different iterations, the author observed that the AI tool was able to generate the model but omitted certain elements at each iteration. However, the author concluded that AI could be a viable option to automate the design, but further investigations and experiments are still required to validate that. In further research [14], the same author conducted the experiment using ChatGPT 3.5 in different versions (May 2023, September 2023 and January 2024) and compared them using various quality factors, such as correctness, completeness, integrity, flexibility, and simplicity. By analyzing four models generated with AI, it was observed that two of them satisfied over 80% of the criteria. Both analyses focused on an initial dataset with four source tables containing information on customers, products, orders, and order details. The current paper aims to analyze how ChatGPT can be used to design a Data Vault model by using a more complex dataset that would require the definition of multiple satellites and links between tables. In addition to that, it will also evaluate AI’s performance in terms of defining the changes that are required when additional sources are integrated.
An important element to obtain accurate and reliable results from an LLM is to provide suggestions that can guide the model to the relevant output [23]. A prompt represents a text-based input provided to the LLM in order to evoke a response. The model interprets the prompt and generates a response according to the instructions and context embedded in the prompt, providing the language model specific instructions to accomplish a particular task. Prompt engineering provides a framework for documenting patterns used to structure prompts and solve various problems. It also allows developers to adapt prompts to different domains [23,24].
Prompt engineering techniques can be used to improve the performance of language models by enabling them to generate more relevant, coherent, and sophisticated responses. Some of the most known and used prompt engineering techniques are as follows:
- Few-Shot Prompting—which involves providing some examples of the desired input–output pairs to the LLM so that it can adapt and provide a response based on the pattern observed in the examples provided [25];
- Contextual Prompting—which requires providing a context or background information (a few lines describing the area, domain, and why it is required to generate the output) to the LLM so that it can base the response on the context provided [26];
- Dynamic or Iterative Prompting—which refers to the practice of modifying prompts in real time based on previous responses so that performance improves [27];
- Zero-Shot Prompting—which requires asking the model to perform a task without providing any examples and relying solely on the instructions within the prompt [28];
- Instruction-Based Prompting—which refers to crafting clear, direct instructions in the prompt to specify the task that needs to be performed; it is usually used in combination with few-shot or zero-shot techniques [29];
- Chain-of-Thought Prompting—which requires the user to encourage the model to think through its reasoning process step by step and explain its thought process rather than just providing the final output, which might lead to more accurate and logical outputs [30].
Prompts are essential for increasing the accuracy and relevance of results, thereby minimizing the human intervention required in model validation. Therefore, it is necessary that the chosen prompt meets the requirements of the task, and it is useful to combine multiple prompting techniques mentioned above.
The performance of a model is largely dependent on its configuration parameters. The correct selection of these parameters, in addition to the defined prompt, influences the quality, creativity, and consistency of the generated results. The most important and commonly used parameters include the following:
- Temperature—This controls the diversity and creativity of the model-generated responses. Lower values (between 0.1 and 0.5) lead the model to be more conservative, while higher values make it more exploratory, generating varied and less predictable responses. In this context, it is recommended that the temperature be kept low, ideally as close to 0 as possible, to adhere to the established rules and avoid hallucinations;
- Maximum Number of Tokens—This parameter defines the maximum length of text that can be generated in a single response. It is used to control the output length, especially when the output needs to be integrated further and a specific format is expected;
- Top-k Sampling—This refers to the the sampling strategy used during the generation process. Lower values result in a more precise and less varied output, while higher values introduce greater diversity in the responses;
- Frequency and Presence Penalties—These are applied to regulate the tendency of the model to repeat certain phrases or introduce new concepts.
Although these parameters provide flexibility and control, it is important to acknowledge the inherent limitations of LLMs, especially in high-precision domains such as data modeling. Two critical challenges remain:
- Hallucination, where the model generates plausible but incorrect or non-verifiable content (e.g., nonexistent table structures or invalid SQL syntax).
- Verifiability, where an output may appear structurally correct but fail to comply with formal standards or business rules upon closer inspection.
To address these challenges, the current solution incorporates a robust validation mechanism (described in previous sections), which systematically verifies the output against a predefined set of rules. Additionally, by carefully tuning parameters (particularly temperature and top k) and enforcing consistency through iterative prompting and response chaining, the risks of hallucination and unverifiable content are significantly reduced.
In summary, parameter optimization not only enhances generation quality but also plays a key role in increasing model reliability and trustworthiness when applied in critical rule-based environments.
Both the prompt techniques and the hyperparameters presented here are configuration options applicable to various models. The choice of LLM depends on multiple factors, such as intended use, model size, and operational costs. Among the most widely used LLMs that are also applicable in Business Intelligence are the following:
- GPT—Developed by OpenAI in 2023, this is one of the most advanced LLMs, optimized for coherent text generation, data analysis, and the automation of technical tasks. It is a versatile model that requires access through the OpenAI API, which involves operational costs. Currently in active development, it exists in multiple versions with varying costs, from smaller variants such as GPT-4o-mini to more advanced and faster versions, such as GPT-4o, which are available at higher costs [31];
- LLaMA—Developed by Meta in 2023, this open-source model is designed for users who seek greater control over their data and ability to customize the model through fine-tuning [32];
- Gemini—Developed by Google in 2023, this model focuses on advanced text comprehension and natural language analysis. It is integrated within the Google Cloud ecosystem, enabling compatibility with BigQuery and other Google services. Its pricing is consumption-based, similar to OpenAI’s model [32].
The choice of an LLM depends on the requirements of the organization, by balancing factors such as performance, cost, and data governance requirements.
Data solution development can be enhanced with the help of AI, which improves the efficiency, accuracy, and scalability of various tasks. For example, AI-driven algorithms have been created to detect and correct data anomalies, which can significantly reduce the manual effort required to clean and preprocess data [33]. Artificial Intelligence can also be used for intelligent data mapping and scheme matching, where AI can align data sources and enable more seamless data integration across different platforms [34]. All these examples demonstrate AI’s potential to transform traditional data tasks and make them more reliable, faster, and adaptable to the growing demands of the market.
3. Methodology
The current paper focuses on addressing two research questions: To what extent can an AI model ensure compliance with the principles and standards of Data Vault modeling? and What are the benefits and limitations of using LLMs in this context? To explore these questions, a framework was developed that leverages Large Language Models to automatically generate Data Vault models, thereby reducing or even bypassing the manual design process.
As part of the methodology, the study introduced a validation mechanism based on a custom validity coefficient designed to assess the compliance of the generated models with the core principles of the Data Vault methodology. The experimental setup involved using four different LLMs to automatically generate Data Vault models for four distinct datasets. These datasets included two transactional systems and two university-level systems, each with varying complexity driven by the number and structure of their tables. For each LLM, ten iterations were executed for each dataset, enabling a consistent and comparative analysis of performance and validity in different data scenarios. The general process flow followed during the experiment is illustrated in Algorithm 1.
| Algorithm 1 Automated Data Vault Model Generation Process |
|
| ▹ Step 1: Construct dynamic prompt |
|
|
|
|
| ▹ Step 2: Submit prompt to LLM |
|
|
|
|
| ▹ Step 3: Parse generated output |
|
|
|
|
| ▹ Step 4: Evaluate model quality |
|
|
|
|
|
|
|
|
|
|
|
| ▹ Step 5: Return output and validity score |
|
|
Furthermore, insights from interviews with data professionals supported the hypothesis that, while Data Vault modeling is efficient in terms of scalability and data integration, its manual design phase remains time-consuming and resource-intensive [8]. The proposed AI-driven approach aims to mitigate these challenges by providing an automated and standardized modeling process.
3.1. Data Vault Model Generation Process
The generation of a Data Vault model in this study is carried out through a fully automated pipeline that integrates prompt engineering and Large Language Models. This process is designed to translate a relational source schema into a normalized Data Vault architecture, preserving business semantics while enabling historical tracking and scalability. The process consists of four main stages: input preparation, prompt construction and submission, output retrieval, and model evaluation.
1. Input Preparation. The process starts with the extraction of metadata from the source system. This metadata is expressed as SQL Data Definition Language (DDL) statements. These statements describe the structure of the relational source model, including table names, columns, data types, and constraints such as primary and foreign keys. The DDL serves as the fundamental input for the transformation process.
2. Prompt Engineering and Model Invocation. A dynamic and modular prompt is constructed to instruct the LLM to generate a valid Data Vault model from the input schema. The prompt is composed of four key components:
- Context—describes the goal and modeling paradigm (e.g., “You are an expert data architect generating a Data Vault 2.0 model.”).
- Instructions—provides specific expectations for the LLM, such as table types to use, naming conventions, and required columns.
- Example—includes one or more sample input–output pairs demonstrating the expected format and logic.
- Dynamic Input—embeds the actual input DDL corresponding to the user’s source schema.
The complete prompt template used to guide the Large Language Model in generating Data Vault schemas is provided in Appendix A.
The resulting prompt is sent to an LLM (for example, GPT-4 or equivalent) through an API call. The model processes the prompt and generates a target Data Vault model in the form of DDL statements.
3. Output Retrieval. The LLM’s response is parsed and structured into output DDLs that represent the Data Vault tables. These include the following:
- Hubs—representing unique business keys.
- Links—capturing relationships between hubs.
- Satellites—storing historical and descriptive attributes related to hubs or links.
4. Model Evaluation. The quality of the generated model is assessed using the formal evaluation methodology described in Section 3.2.
Algorithm 1 provides a pseudocode representation of the automated Data Vault model generation process, implemented using structured prompt engineering. The function Generate-Data-Vault-Model receives the source schema as DDL statements and produces two outputs: the generated Data Vault model (also in DDL format) and a validity coefficient that quantifies the quality of the resulting model.
Validation is performed by an independent automated evaluation procedure independent of the LLM that generated the model. The procedure parses the generated DDL and applies a predefined set of validation rules. For each rule, a score is calculated as the ratio between the number of generated elements that satisfy the rule and the total number of relevant elements. For example, for naming convention rules, the number of tables following the convention is divided by the total number of generated tables. Similarly, for datatype consistency rules, the generated tables are checked against the expected data types from the input schema, and the proportion of correctly typed tables contributes to the rule score.
Each rule score is weighted by its assigned impact factor, and the overall validation score is obtained as the weighted sum of these normalized scores. In addition, a set of penalty rules are applied to detect critical violations (e.g., duplicate tables and missing mandatory entities), where each penalty accounts for the number of occurrences and applies a negative weight to the total score according to its severity coefficient. The final validity coefficient (CV) is calculated as the weighted validation score minus the aggregated penalties, ensuring an objective and reproducible quality assessment.
3.2. Validation and Evaluation Criteria
To ensure the accuracy and reliability of the automatically generated Data Vault models, a formal and structured validation methodology is proposed. This methodology is designed to assess the quality of the model from multiple perspectives, extending beyond simple schema validation. It integrates rules grounded in both theoretical principles and practical implementation considerations.
The core premise is that the quality of the model directly impacts the accuracy of the data warehouse and the decisions derived from it. The validation rules included in this methodology were derived from a combination of sources: (i) the official principles and standards outlined in the Data Vault 2.0 specification [7], (ii) established data modeling best practices documented in the literature (e.g., Hoberman’s Data Model Scorecard [35] and Moody’s quality model [36]), and (iii) recent advances in automated model evaluation, such as those proposed by [14]. By aligning with these sources, the rule set captures both formal correctness and pragmatic considerations essential for real-world deployment. To ensure that the evaluation is comprehensive, the rules are grouped into three major categories:
- Structural Integrity—which verifies that the core architectural components of a Data Vault model (hubs, links, satellites) are present and correctly configured. These rules check for structural soundness, such as the presence of unique business keys in hubs, correct cardinality and connectivity in links, and the existence of surrogate technical keys.
- -
- R1. Presence of all mandatory table types (hubs, links, and satellites).
- -
- R2. Correct linkage between link tables and their corresponding hub tables.
- -
- R3. Satellites must be attached to either hub or link tables where applicable.
- -
- P1. Absence of duplicate tables.
- -
- P2. Absence of duplicate columns.
- -
- R4. Number of satellite tables ≥ number of hub tables.
- -
- R5. Number of satellite link tables ≥ number of link tables.
- -
- R6. All descriptive attributes provided in the input must be preserved in the output model.
- Conformance to Data Vault Standards—assesses adherence to the Data Vault modeling conventions. This includes naming standards, proper placement of descriptive attributes within satellites, inclusion of mandatory metadata columns such as LoadDate, RecordSource, and hash keys, and avoidance of disallowed constructs (e.g., foreign keys defined between satellites).
- -
- R7. Adherence to naming conventions.
- -
- R8. Inclusion of mandatory columns for each type of table.
- -
- R9. Validation of data types and nullability constraints.
- -
- R10. Validation of primary key definitions.
- -
- R11. Validation of foreign key relationships.
- -
- R12. Historical data separation according to model specifications.
- Performance and Scalability—evaluates the model’s readiness for production use. This includes redundancy, fragmentation, scalability under volume growth, and the model’s adaptability to future changes.
- -
- R13. Appropriateness of chosen data types for performance optimization.
- -
- R14. Balanced ratio between the link and hub tables to ensure scalability and query efficiency.
The following set of 16 rules (R1–R14 plus the two penalty rules P1–P2) was defined to evaluate the quality of a Data Vault model. These rules were mapped to the key data model quality dimensions—completeness, consistency, flexibility, comprehensibility, and maintainability. As shown in Table 1, each rule contributes to one or more quality dimensions. For each dimension, the rules involved are listed alongside a brief rationale explaining how each supports that specific aspect of model quality.

Table 1.
Mapping of rules to quality dimensions with rationale.
Each rule is assigned a quantitative score and an associated weight that reflect its relative importance in the overall quality of the model. This scoring mechanism enables objective and comparable evaluation across different models and iterations. The weights were determined through iterative calibration and expert judgment, prioritizing factors that influence the model correctness and its operational robustness. To ensure that the weighting reflects real-world modeling practices, feedback was collected from three senior experts in Data Vault modeling, each with over 10 years of experience. Their expertise spans multiple industries, including insurance, wholesale, and retail, ensuring that the selected factors and weights are representative of diverse data modeling scenarios. Impact levels were assigned to the corresponding factor values, as shown in Table 2, ranging from Very Low (1) to Very High (5).
Table 2.
Impact levels and corresponding factor values.
For the 14 core validation rules (), each weight was calculated by normalizing the corresponding impact factor over the total number of rules using the following formula:
This normalization ensures that the sum of all weights equals 1, maintaining a balanced influence of individual rules on the overall score.
Unlike the 14 core rules, the two additional penalty rules () were not assigned weights based on impact factors but were instead modeled as penalty terms. This distinction emphasizes the critical nature of the issues they capture, such as structural inconsistencies or redundancy, which can severely compromise the integrity of the model. The corresponding penalty weights were determined based on their severity and likelihood, allowing stronger penalization of models that exhibit such violations.
The overall quality score (CV) is then computed as the weighted sum of individual rule scores minus the aggregated penalties:
where
- = score for validation rule i;
- = weight for rule i;
- = penalty score for violation j (e.g., duplicate tables or columns);
- = penalty weight for violation j.
The resulting coefficient ranges from . The interpretation of these intervals is based on empirical experience and has been validated with experts. This classification provides a practical framework for understanding the behavior of CV values across different scenarios, ensuring that the results are both theoretically sound and aligned with real-world observations.
- : Perfect model—all rules satisfied, no penalties;
- : Very good model—minor issues or minimal duplication;
- : Acceptable model—moderate structural or rule violations;
- : Weak model—significant issues with structure or conformance;
- : Invalid model—fundamental non-compliance with Data Vault methodology.
The proposed rule set is considered comprehensive because it addresses the fundamental dimensions of data model quality: completeness, consistency, flexibility, comprehensibility, and maintainability. These dimensions are consistent with the quality criteria defined by [36], which emphasize the need for both semantic and structural correctness in data models. Additionally, by incorporating evaluation metrics similar to those used in frameworks such as the Data Model Scorecard, this methodology ensures that both technical and business-facing aspects of the model are addressed. During the development of this methodology, existing approaches from the literature were reviewed and integrated where appropriate. The Data Model Scorecard [35] provides a checklist-based assessment of relational models in ten quality areas, such as completeness, structural integrity, and naming standards. Although valuable, it is not tailored to the Data Vault paradigm. Similarly, Moody’s framework (1998) [36] introduces conceptual quality dimensions but lacks practical mechanisms for automated validation. More recently, Ref. [14] proposed a model that classifies Data Vault validation into schema-level, column-level, and manual checks. Although closer to the context, it remains mostly qualitative and does not offer a weighted scoring mechanism.
This proposal extends existing foundations by introducing a scalable rule-based validation process tailored for LLM-generated Data Vault models. Since LLMs can produce syntactically correct but structurally flawed outputs, issues such as hallucinations, inconsistencies, and semantic drift may lead to critical design flaws. Therefore, a robust validation layer is essential to ensure compliance with Data Vault standards and detect problems prior to deployment. Rather than replacing existing frameworks, this approach enhances them by supporting automated scalable model generation, balancing theoretical rigor with practical application to ensure quality and consistency in modern data warehousing.
3.3. Architecture of the Proposed Solution
The proposed architecture was implemented as a web-based application developed in Python (version 3.13) using the Flask framework to create an intuitive user interface. The application allows users to interact with the automated data model generation system, integrating both the model creation and the validity testing component. It is designed to support the entire workflow, from the initial definition of source tables to the storage of the resulting model in a local database.
The components and workflow of the prototype web application are illustrated in Figure 1. Users interact with the interface through the browser, where they can either input text or select an available action. Upon submission, the request is sent to the web server, which, via the WSGI interface, forwards it to the Flask application. Depending on the action, the application may send the input to an external LLM API (e.g., GPT or Gemini), execute internal functions, or store the results in a local database. An authorization token is used during communication with the LLM API to authenticate the request. Once processing is complete, the response is returned to the user through the browser interface.
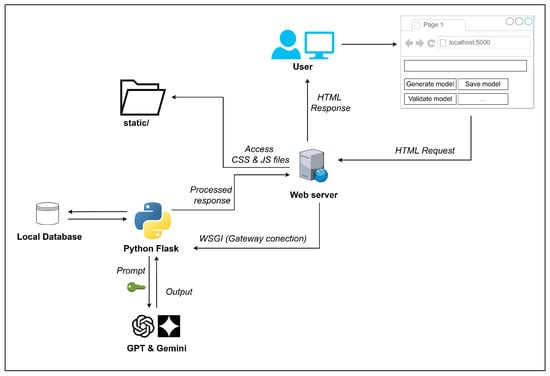
Figure 1.
System architecture of the prototype web application.
The interface presented in Figure 2 was designed to be clear, minimalist, and efficient, enabling users to navigate intuitively through each stage of the process. Functional elements are organized logically. The DDL input text area is centrally positioned under the instructions, followed by a compact set of action buttons. For example, the “Generate Data Vault Model” and “Show Data Model” buttons are immediately visible and accessible, whereas the “Save Data Vault Model” button remains disabled until a model is successfully generated. Additionally, for operations involving requests to LLMs, a loading message is displayed (e.g., Loading…) to inform users that the request may take several seconds up to a minute to complete. All these elements ensure clarity and responsiveness throughout the workflow while providing an easy-to-understand and easy-to-use interface.
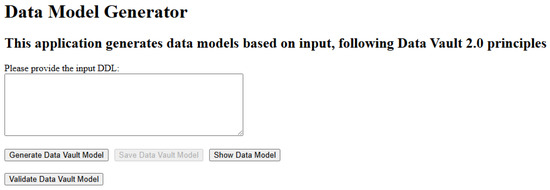
Figure 2.
User interface of the prototype web application.
4. Results and Discussion
This section presents the results obtained from the experiment, highlighting the key observations, trends, and relevant metrics. Four datasets were used in the experiment across multiple iterations to provide a comprehensive understanding of the outcomes. Visual representations such as charts and tables are included to support the interpretation and to facilitate comparison across different experimental conditions.
4.1. Experimental Datasets
To test the methodology for validating Data Vault models, four synthetic datasets were created within two distinct domains. These domains were selected for their relevance and diversity in real-world data modeling scenarios. The datasets are proprietary, specifically designed to reflect the common challenges in enterprise data warehousing. The aim was to evaluate the approach in domains with different structures, semantics, and data variability.
- Transactional datasets simulate typical operational systems, such as sales, orders, and payments. These are commonly used in Business Intelligence environments for tasks like performance analysis, forecasting, and financial reporting.
- University datasets represent complex institutional systems, including students, courses, exams, and academic results. These support use cases such as curriculum management and student progress tracking.
Each domain includes two scenarios:
- Category A—a moderately complex case, containing approximately 10 source tables.
- Category B—a more complex scenario, comprising approximately 16 source tables and various data inconsistencies.
These four scenarios, labeled 1A, 1B (transactional) and 2A, 2B (university), as detailed in Table 3, enable comparative analysis across domains and complexity levels, ensuring that the methodology is tested under diverse conditions.
Table 3.
Overview of test scenarios.
Table 4 summarizes the input tables used in the four case studies analyzed in this research. These tables represent the raw source data from which the Data Vault models are generated and cover both business and academic domains. Each case is classified as either medium-complexity (Scenario A) or high-complexity (Scenario B). This classification enables thorough evaluation of model generation and validation under different levels of complexity.
Table 4.
Input tables used for each case study.
For each case study, the source tables, provided as DDLs, are processed by the developed application to compute the validity coefficients. In addition, the generated models are manually reviewed to identify further inconsistencies.
Each dataset is tested over 10 iterations to observe how the model improves through automatic correction. The number of iterations needed to reach a valid model, as well as the LLM’s ability to manage and refine Data Vault models, are also analyzed.
4.2. LLMs Used in the Experiment
As part of the testing process for the proposed architecture, which integrates LLMs, four distinct models were selected to evaluate their behavior and performance differences. The goal of this experiment was to understand to what extent different LLM versions can be applied within the proposed solution architecture for generating and validating Data Vault models.
From OpenAI, two models were selected: GPT-4o and GPT-4o-mini. The GPT-4o-mini model represents a cost-effective variant, optimized for fast tasks while maintaining reasonable performance. Due to its low cost, this model was widely used during the early testing stages and in the prototype phase of the application. Later, for detailed evaluations and the actual testing phase, GPT-4o was used. At the time of the experiment (April 2025), GPT-4o was OpenAI’s most recent model, offering a strong balance between speed, cost, and reasoning ability.
In parallel, two models from Google’s Gemini family were also tested: Gemini 2.5 Pro and Gemini 2.5 Flash. The Gemini 2.5 Pro model performs similarly to GPT-4o and was used to evaluate extended contextual processing capabilities. In contrast, Gemini 2.5 Flash is similar in efficiency to GPT-4o-mini, suitable for low-latency cost-sensitive tasks. A key advantage of the Gemini models was the availability of free access levels or limited daily usage.
All the LLMs used in the experiment were tested under consistent conditions, with their key parameters standardized to ensure fair comparison. In particular, the models were prompted using a temperature value of 0.4, balancing creativity with determinism, and a maximum token limit of 16,300 per interaction. This configuration aimed to generate reliable and reproducible output suitable for formal data modeling tasks.
Since LLMs have an upper limit on the number of tokens processed per request, the system included a mechanism to handle responses exceeding this threshold. If a response was truncated due to token overflow, the system automatically detected this condition and issued a follow-up request to resume generation from the cut-off point. This iterative completion strategy was essential to generate extended model definitions or complete DDL statements, particularly in complex scenarios, to ensure that no relevant information was lost in interactions.
This combination of parameter control and multi-request handling proved crucial in enabling the application to reliably interact with the models and obtain complete and consistent outputs for evaluation and further processing.
Table 5 presents a cost comparison for all four LLMs used in the experiment, available online in April 2025 [37,38]. Each model was tested across 10 iterations per dataset scenario to evaluate the consistency of the output over multiple runs.
Table 5.
Cost comparison for LLMs used in the experiment.
4.3. Analyzed Metrics and Model Evaluation
To perform the evaluation, a total of 160 iterations were conducted—10 iterations for each dataset and for each model used in the experiment. The main objective of the analysis was to assess and quantify the quality of the generated models by assessing their compliance with the predefined rules and constraints. This was achieved by calculating the validity coefficients, which serve as indicators of the degree to which the models adhere to the imposed requirements and their ability to generalize to unseen data scenarios.
The analysis aimed to identify possible performance variations and determine whether the results remained consistent or varied significantly between iterations. In addition, special attention was afforded to analyzing the errors produced by the evaluated models. This involved investigating the types of errors, their frequency, severity, and whether they were corrected in subsequent iterations.
The ultimate goal was to better understand the behavior of the model and identify potential issues, including those arising from inherent limitations or vulnerabilities in the algorithm.
Overall, these metrics and analyses enabled a comprehensive assessment of the proposed model performance and configuration parameters, offering concrete insights into its stability, accuracy, and efficiency.
4.4. Validity Coefficient Calculation and Weight Allocation
The weighting process followed the methodology described in Section 3.2. Each of the 14 validation rules was assigned an impact factor between 1 and 5, which was then normalized to obtain the final weight. Table 6 summarizes all the rules, with their assigned factors and corresponding weights.
Table 6.
Assigned factors and weights for validation rules.
However, two additional rules, related to duplicate detection, were treated separately. These were excluded from impact-based weights as normalization would have resulted in negligible weight values, reducing their influence on the final model evaluation. Since duplicate structures are considered critical flaws that directly affect the efficiency and clarity of the model, a fixed penalty score was chosen instead to emphasize their importance.
A higher penalty was assigned for duplicate tables as such structures can severely compromise model integrity and clarity, leading to ambiguity, redundancy, and inefficient storage or querying. Duplicate columns, while still problematic, tend to have a more localized effect and were therefore penalized less severely.
These penalties were directly subtracted from the total score at each iteration, ensuring that the final CV not only reflects structural correctness but also discourages poor or inefficient modeling practices.
To test the robustness of the selected weights, a sensitivity analysis was performed by varying each weight by ±15%. The objective was to determine whether small fluctuations in weighting would significantly alter the final model evaluation scores.
- For a +15% increase, weights were adjusted upward and rounded up. Any weight exceeding the maximum threshold of 5 was capped accordingly.
- For a −15% decrease, weights were reduced and rounded down, with a minimum threshold of 1 enforced to preserve the influence of essential rules.
The comparative results were visualized using a whisker plot, as in Figure 3, demonstrating that the CV distributions remained consistent across all the scenarios. The median, interquartile range, and extremes showed minimal variance, indicating a high level of stability in the scoring system. The average difference in scores across the scenarios was below 0.002 units, suggesting that the model evaluation process is not overly sensitive to moderate changes in weight allocation. Additionally, the number of models classified in each category was also reviewed. The results showed that those models assigned to the highest quality category remained constant, while minor shifts (of at most two models) were observed between the lower two categories. This further supports the conclusion that the weighting system is robust and well balanced.
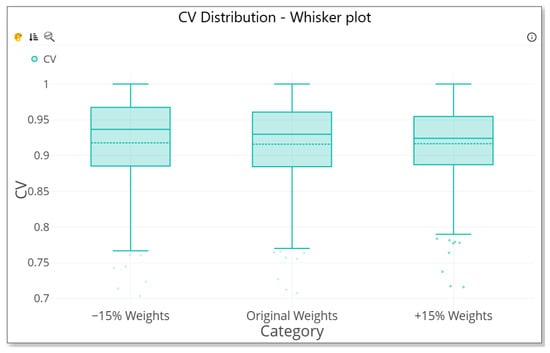
Figure 3.
Various weight plot.
Through this comprehensive evaluation framework, which incorporates iterative testing, rule-based scoring, penalization for structural inefficiencies, and sensitivity testing, the behavior and quality of LLM-generated Data Vault models can be reliably assessed. This approach enables objective comparison, error analysis, and fine-tuning of both LLM prompts and architectural components within the proposed system.
4.5. Result Interpretation
This section provides a detailed interpretation of the model performance results across all the datasets used in the experiments. The analysis focuses on the CV score as the primary evaluation metric, used to assess the stability, consistency, and accuracy of the models generated by different LLMs. For each dataset, comparative results across multiple iterations are presented, highlighting the strengths and weaknesses of each LLM variant. To provide better context for both the datasets and the obtained results, reference models were manually created in collaboration with experienced data architects. These served as a benchmark to understand how the ideal models should look against those generated automatically. The following subsections summarize the findings for each dataset individually.
The results illustrated in Figure 4 for Dataset 1A show that GPT-4o consistently achieves the high CV scores, remaining consistently close to 1.00 across all ten runs, indicating exceptional stability and precision. Gemini 2.5 Flash also demonstrates strong and consistent performance, nearly matching GPT-4o, although with slightly higher variations. In contrast, Gemini 2.5 Pro shows significant variability, dropping as low as 0.90 in multiple runs, signaling potential reliability issues. GPT-4o-mini consistently performs lower than the other models, with CV scores hovering around 0.90 and showing a marked decline in the ninth run. This suggests that, while GPT-4o-mini may be efficient, it sacrifices accuracy and robustness.
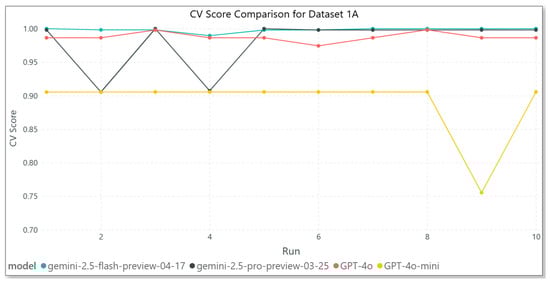
Figure 4.
Model results—Dataset 1A.
In Figure 5, for Dataset 1B, GPT-4o continues to outperform the other models, maintaining near-perfect CV scores across every iteration. This reinforces both its reliability and ability to generalize effectively to new data. Gemini 2.5 Flash shows moderate variability, with performance improving toward later iterations, whereas Gemini 2.5 Pro demonstrates higher fluctuation and fluctuates between runs, indicating inconsistent model behavior. GPT-4o-mini again underperforms, with a notable drop below 0.85 during the eighth iteration, raising concerns about its resilience to errors or edge cases. Overall, the results highlight GPT-4o as the most stable and accurate model, while the Gemini models, particularly the Pro version, show uneven performance across iterations.
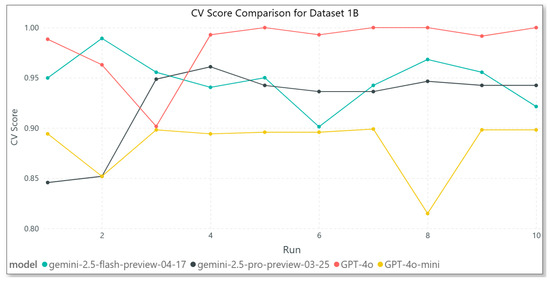
Figure 5.
Model results—Dataset 1B.
The results shown in Figure 6 for Dataset 2A, which includes university-related tables, demonstrate that GPT-4o continues to exhibit excellent stability and high performance, with CV scores consistently close to 1.00 across all the iterations. Gemini 2.5 Pro also demonstrates strong consistency, maintaining scores around 0.96 without significant fluctuations. However, Gemini 2.5 Flash displays significant variability, with a sharp drop near the fifth run, suggesting occasional instability. GPT-4o-mini remains the least consistent and lowest-performing model within this dataset, with CV scores fluctuating between 0.85 and 0.91, highlighting its limited ability to maintain performance under varying conditions.
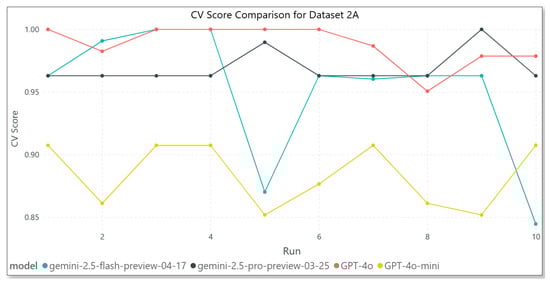
Figure 6.
Model results—Dataset 2A.
In Figure 7, which presents the results for Dataset 2B, GPT-4o once again emerges as the top performer, with flawless CV scores of 1.00 across all the iterations, highlighting its robustness and precision. Gemini 2.5 Pro performs relatively well, although it shows slight fluctuations and does not consistently achieve perfect scores. Gemini 2.5 Flash exhibits high instability, with two significant drops in performance, suggesting reduced reliability in this dataset. GPT-4o-mini continues its trend of underperformance, maintaining stable yet modest CV scores around 0.90. These results further reinforce GPT-4o’s superior consistency and overall reliability, while the Gemini models, particularly Flash, struggle to sustain peak performance.
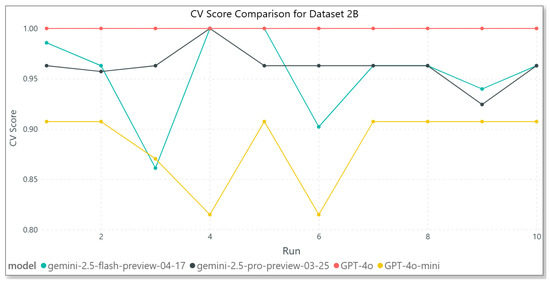
Figure 7.
Model results—Dataset 2B.
Based on the classification of each rule under one or more data quality dimensions, as defined in Section 3.2, an average score was computed for every dataset–model combination. For each of the ten iterations, rule violations were identified, and the error-free percentage was calculated. The average score for a given dimension was then calculated as the mean of all its component rules, resulting in a value between 0 and 10. A perfect score of 10 therefore indicates that no violations were observed for any rule in that dimension across all the iterations.
The results presented in Table 7 reveal clear differences between the models and datasets. The table reports the average scores for each quality dimension: QD1 (Completeness), QD2 (Consistency), QD3 (Flexibility), QD4 (Comprehensibility), and QD5 (Maintainability). Notably, Dataset 2B, evaluated with GPT-4o, achieved perfect scores across all five quality dimensions, indicating that no rule violations occurred in any of the iterations. Similarly, Gemini 2.5 Pro achieved very high scores on both Datasets 2A and 2B, particularly for Completeness and Comprehensibility.
Table 7.
Average quality dimension scores by dataset and model.
Among the five dimensions, Consistency shows the lowest overall averages. For instance, Dataset 1A has an average Consistency score of only 31.78, and GPT-4o on the same dataset achieves just 6.89—the lowest single-model value in the table. This indicates that rules related to Consistency were the most frequently violated across iterations.
In contrast, Flexibility and Comprehensibility remain consistently strong across nearly every combination, often reaching or approaching the maximum score of 10. Completeness generally remained high but showed a noticeable decline for Dataset 1B, where Gemini 2.5 achieved only 7.50. Maintainability showed greater variability, with lower scores for Dataset 1A (e.g., 6.67 for GPT-4o) but near-perfect results for Dataset 2B.
Overall, these findings highlight Consistency as the most challenging quality dimension across the datasets and models. In contrast, Flexibility and Comprehensibility emerge as the most robust, yielding high scores for all the tested models.
The distribution of CV across model classifications is presented in Table 8. GPT-4o consistently performs at a high level, with strong results in every dataset, achieving perfect or very good classifications and notably attaining a perfect score in Dataset 2B. GPT-4o-mini shows moderate performance, frequently achieving very good classifications, but it does not reach the “perfect” level in any dataset and occasionally produces acceptable outputs, particularly in Datasets 1A and 2B.
Table 8.
Distribution of validity coefficient classifications by dataset and model.
The Gemini models exhibit more varied behavior. Gemini 2.5 Flash tends to outperform Gemini 2.5 Pro, showing a higher number of perfect classifications, especially in Datasets 1A and 2B. However, both versions of Gemini models still show inconsistencies compared to the GPT-4 series. Although they mostly avoid generating weak or invalid models, the lack of consistently perfect results across the datasets suggests lower stability and reliability. In general, GPT-4o emerges as the most robust and consistently high-performing model, while GPT-4o-mini offers a lighter but moderately less accurate alternative. The Gemini models, although occasionally competitive, demonstrate greater variability in performance.
5. Conclusions
This study investigated the potential of Large Language Models (LLMs) to automate Data Vault modeling and evaluated their performance through two main research questions.
RQ1 asked to what extent an AI model can ensure compliance with the principles and standards of Data Vault modeling. The experiments performed showed that GPT-4o achieved the highest level of compliance, consistently generating hubs, links, and satellites that adhered to the best practices of Data Vault 2.0 and rapidly correcting errors when guided. GPT-4o-mini produced lower-quality outputs, often retaining the same modeling errors across iterations. The Gemini models displayed high variability between runs, reducing their overall reliability. These findings indicate that, under controlled conditions, state-of-the-art LLMs can produce valid Data Vault schemas with high accuracy, but model choice significantly affects stability and repeatability.
RQ2 explored the benefits and limitations of using LLMs in this context. The main benefits observed were a substantial reduction in manual effort and faster schema generation. However, the limitations include the need for precise prompt engineering, sensitivity to model type, and the fact that some LLMs exhibit hallucinations or inconsistent outputs across iterations. These findings suggest that, while LLMs can accelerate the early stages of BI and data warehouse projects, human oversight remains essential to guarantee correctness and maintain compliance with strict modeling standards.
Despite these promising results, the study has important limitations. The experiments were performed under a predefined set of hyperparameters and utilized a limited collection of datasets, which may restrict the generalizability of the conclusions. Additionally, the evaluation focused primarily on schema compliance rather than downstream performance indicators, such as query efficiency or maintainability.
Future research should expand the scope of experimentation by testing a wider variety of datasets, hyperparameter configurations, and LLM providers, as well as newer model versions. Fine-tuning LLMs on domain-specific corpora, including ER diagrams, technical documentation, and industry case studies, could further improve precision and reduce variability. Another valuable direction is extending the solution to support semi-structured data (e.g., JSON and XML), thereby increasing its applicability to modern enterprise environments with diverse data sources.
Another area of future work would be to develop a correction model, also based on an LLM, to refine the results obtained. It would take as input the initially generated model together with the list of errors identified based on the defined validation rules and output improved data models. These would then undergo an iterative cycle of generation, validation, and correction until a fully compliant model is achieved. This process would increase the robustness and reliability of the proposed solution and could be adjusted depending on the complexity of the use case and the required quality level.
From a practical perspective, this AI-based modeling approach shows strong potential to streamline one of the most time-intensive phases of BI and data warehouse initiatives: the creation of a scalable and standard-compliant data model. By accelerating this phase, organizations can reduce delivery timelines, minimize human error, and achieve faster alignment of their data infrastructure with business requirements, turning LLM-driven automation into a strategic enabler of agile data-driven decision-making.
Author Contributions
Conceptualization, A.V. and A.-R.B.; methodology, A.V. and A.-I.B.; software, A.V.; validation, A.-R.B.; writing—original draft preparation, A.V.; writing—review and editing, A.-R.B.; supervision, A.-R.B. All authors have read and agreed to the published version of the manuscript.
Funding
This paper was co-financed by The Bucharest University of Economic Studies during the PhD program.
Data Availability Statement
The data presented in this study are available on request from the corresponding author as they are part of ongoing research.
Conflicts of Interest
The authors declare no conflicts of interest.
Correction Statement
This article has been republished with a minor correction to the Data Availability Statement. This change does not affect the scientific content of the article.
Appendix A
This appendix includes the complete prompt text used to instruct a Large Language Model to generate a Data Vault 2.0 schema from a given dataset. The prompt enforces strict naming conventions and modeling rules to ensure consistency.
- """ You are an expert in Data Vault modeling. Your task is to generate a Data Vault schema that accurately represents this dataset.
- You need to use Data Vault 2.0 principles to generate the output.
- Do not include the sql prefix before code.
You need to ensure that the following rules are being respected:
Naming conventions:
- -
- Hub tables: hub_[entity]
- -
- Hub satellite tables: hsat_[entity]__main
- -
- Link tables: lnk_[entity1]__[entity2]
- -
- Link satellite tables: lsat_[entity1]__[entity2]__main
- -
- Remove unnecessary spaces in names (e.g., lnk _product should be lnk_product, h sat_column should be hsat_column)
Table structure:
- -
- All tables must include: id, source_key, source_id, date_effective
- -
- Satellite tables (hsat, lsat) must also include: date_ended
- -
- Hub and link tables must contain only metadata columns and technical/key columns
- -
- Satellite tables must contain only attribute columns
- -
- Each link and hub need to be followed by a lsat or hsat table (even if there are no attribute columns, they should have at least metadata and technical columns)
Relationships and keys:
- -
- Columns ending with _sk, _id, or starting with id_ are keys, not attributes
- -
- Use these keys to define relationships and create appropriate link tables
- -
- Link tables need to be created based on existing hub tables.
- -
- Do not change the granularity or the context of the data, so all necessary links that represent relationships between entities need to be created
Attribute handling:
- -
- Very Important!!—Preserve original attribute column names from the source (DO NOT rename them)
- -
- Columns that contain “date” in the name should be typed as date
Example of output (please make sure you keep the original attribute names, and they are not renamed as per the output - to include atr_original_name):
CREATE TABLE hub_table AS (
hub_table_id STRING NOT NULL,
source_key STRING NOT NULL,
source_id STRING NOT NULL,
date_effective TIMESTAMP NOT NULL
);
CREATE TABLE hsat_table__main AS (
hsat_table__main_id STRING NOT NULL,
hub_table_id STRING NOT NULL,
source_key STRING NOT NULL,
source_id STRING NOT NULL,
date_effective TIMESTAMP NOT NULL,
date_ended TIMESTAMP NOT NULL,
atr_1 STRING,
atr_2_date DATE,
atr_3 INT
);
CREATE TABLE hub_table_2 AS (
hub_table_2_id STRING NOT NULL,
source_key STRING NOT NULL,
source_id STRING NOT NULL,
date_effective TIMESTAMP NOT NULL
);
CREATE TABLE hsat_table_2__main AS (
hsat_table_2__main_id STRING NOT NULL,
hub_table_2_id STRING NOT NULL,
source_key STRING NOT NULL,
source_id STRING NOT NULL,
date_effective TIMESTAMP NOT NULL,
date_ended TIMESTAMP NOT NULL,
atr_1 STRING,
atr_5_date DATE,
atr_3 DOUBLE
);
CREATE TABLE lnk_table__table_2 AS (
lnk_table__table_2_id STRING NOT NULL,
hub_table_id STRING NOT NULL,
hub_table2_id STRING NOT NULL,
source_key STRING NOT NULL,
source_id STRING NOT NULL,
date_effective TIMESTAMP NOT NULL
);
CREATE TABLE lsat_table__table_2__main AS (
lsat_table__table_2__main_id STRING NOT NULL,
lnk_table__table_2_id STRING NOT NULL,
source_key STRING NOT NULL,
source_id STRING NOT NULL,
date_effective TIMESTAMP NOT NULL,
date_ended TIMESTAMP NOT NULL,
atr_1 STRING,
atr_2 STRING,
atr_date_4 DATE
);
If the input provided doesn’t have any table, just display ‘No input could be modelled.’.
Please use the below DDL to generate the output, no further explanations.
Input: """
References
- Golightly, L.; Chang, V.; Xu, Q.A.; Gao, X.; Liu, B.S.C. Adoption of cloud computing as innovation in the organization. Int. J. Eng. Bus. Manag. 2022, 14, 1–17. [Google Scholar] [CrossRef]
- Vines, A.; Tanasescu, L. An overview of ETL cloud services: An empirical study based on user’s experience. In Proceedings of the International Conference on Business Excellence, Bucharest, Romania, 23–24 March 2023; Volume 17, pp. 2085–2098. [Google Scholar] [CrossRef]
- Clissa, L.; Lassnig, M.; Rinaldi, L. How Big is Big Data? A comprehensive survey of data production, storage, and streaming in science and industry. Front. Big Data 2023, 6, 1271639. [Google Scholar] [CrossRef] [PubMed]
- Inmon, W.H.; Zachman, J.A.; Geiger, J.G. Data Stores, Data Warehousing, and the Zachman Framework: Managing Enterprise Knowledge; McGraw-Hill: New York, NY, USA, 2008; ISBN 0070314292. [Google Scholar]
- Kimball, R.; Ross, M.; Thornthwaite, W.; Mundy, J.; Becker, B. Data Warehouse Lifecycle Toolkit: Practical Techniques for Building Data Warehouse and Business Intelligence Systems, 2nd ed.; Wiley: New York, NY, USA, 2008. [Google Scholar]
- Linstedt, D. Data Vault Series 1—Data Vault Overview. The Data Administration Newsletter (TDAN). Available online: https://tdan.com/data-vault-series-1-data-vault-overview/5054 (accessed on 5 April 2025).
- Linstedt, D. Building a Scalable Data Warehouse with Data Vault 2.0, 1st ed.; Morgan Kaufmann: Boston, MA, USA, 2016; ISBN 978-0-128-02648-9. [Google Scholar]
- Vines, A.; Tănăsescu, L. Data Vault Modeling: Insights from Industry Interviews. In Proceedings of the International Conference on Business Excellence, Bucharest, Romania, 21–22 March 2024; Volume 18, pp. 3597–3605. [Google Scholar] [CrossRef]
- El-Sappagh, S.; Hendawi, A.; El-Bastawissy, A. A proposed model for data warehouse ETL processes. J. King Saud Univ.—Comput. Inf. Sci. 2011, 23, 91–104. [Google Scholar] [CrossRef]
- Fan, L.; Lee, C.-H.; Su, H.; Feng, S.; Jiang, Z.; Sun, Z. A New Era in Human Factors Engineering: A Survey of the Applications and Prospects of Large Multimodal Models. arXiv 2024, arXiv:2405.13426. Available online: https://arxiv.org/abs/2405.13426 (accessed on 15 May 2025). [CrossRef]
- Ege, D.N.; Øvrebø, H.H.; Stubberud, V.; Berg, M.F.; Elverum, C.; Steinert, M.; Vestad, H. ChatGPT as an inventor: Eliciting the strengths and weaknesses of current large language models against humans in engineering design. arXiv 2024, arXiv:2404.18479. Available online: https://arxiv.org/abs/2404.18479 (accessed on 15 May 2025). [CrossRef]
- Choi, S.; Gazeley, W. When Life Gives You LLMs, Make LLM-ADE: Large Language Models with Adaptive Data Engineering. arXiv 2024, arXiv:2404.13028. Available online: https://arxiv.org/abs/2404.13028 (accessed on 15 May 2025). [CrossRef]
- Mantri, A. Intelligent Automation of ETL Processes for LLM Deployment: A Comparative Study of Dataverse and TPOT. Eur. J. Adv. Eng. Technol. 2024, 11, 154–158. [Google Scholar]
- Helskyaho, H.; Ruotsalainen, L.; Männistö, T. Defining Data Model Quality Metrics for Data Vault 2.0 Model Evaluation. Inventions 2024, 9, 21. [Google Scholar] [CrossRef]
- Inmon, W.H.; Imhoff, C.; Sousa, R. Corporate Information Factory, 2nd ed.; John Wiley & Sons: Hoboken, NJ, USA, 2002; ISBN 978-0-471-43750-5. [Google Scholar]
- Smith, J.; Elshnoudy, I.A. A Comparative Analysis of Data Warehouse Design Methodologies for Enterprise Big Data and Analytics. Emerg. Trends Mach. Intell. Big Data 2023, 15, 16–29. [Google Scholar]
- Giebler, C.; Gröger, C.; Hoos, E.; Schwarz, H.; Mitschang, B. Modeling Data Lakes with Data Vault: Practical Experiences, Assessment, and Lessons Learned. In Proceedings of the 38th Conference on Conceptual Modeling (ER 2019), Salvador, Bahia, Brazil, 4–7 November 2019; Lecture Notes in Information Systems and Applications. pp. 63–77. [Google Scholar] [CrossRef]
- Vines, A.; Samoila, A. An Overview of Data Vault Methodology and Its Benefits. Inform. Econ. 2023, 27, 15–24. [Google Scholar] [CrossRef]
- Yessad, L.; Labiod, A. Comparative Study of Data Warehouses Modeling Approaches: In-mon, Kimball, and Data Vault. In Proceedings of the 2016 International Conference on System Reliability and Science (ICSRS), Paris, France, 15 November 2016; pp. 95–99. [Google Scholar] [CrossRef]
- Naamane, Z.; Jovanovic, V. Effectiveness of Data Vault compared to Dimensional Data Marts on Overall Performance of a Data Warehouse System. Int. J. Comput. Sci. Issues 2016, 13, 16. [Google Scholar] [CrossRef]
- Vines, A. Performance Evaluation of Data Vault and Dimensional Modeling: Insights from TPC-DS Dataset Analysis. In Proceedings of the 23rd International Conference on Informatics in Economy (IE 2024), Timisoara, Romania, 23–24 May 2024; Smart Innovation, Systems and Technologies. Volume 426, pp. 27–37. [Google Scholar] [CrossRef]
- Helskyaho, H. Towards Automating Database Designing. In Proceedings of the 34th Conference of Open Innovations Association (FRUCT), Riga, Latvia, 15–17 November 2023; pp. 41–48. [Google Scholar] [CrossRef]
- Ggaliwango, M.; Nakayiza, H.R.; Jjingo, D.; Nakatumba-Nabende, J. Prompt Engineering in Large Language Models. In Proceedings of the Data Intelligence and Cognitive Informatics (ICDICI 2023), Tirunelveli, India, 27–28 June 2023; pp. 387–402. [Google Scholar] [CrossRef]
- Lo, L.S. The CLEAR Path: A Framework for Enhancing Information Literacy Through Prompt Engineering. The Journal of Academic Librarianship 2023, 49, 102720. [Google Scholar] [CrossRef]
- Ahmed, T.; Pai, K.S.; Devanbu, P.; Barr, E. Improving Few-Shot Prompts with Relevant Static Analysis Products. arXiv 2023, arXiv:2304.06815. Available online: https://arxiv.org/abs/2304.06815 (accessed on 20 May 2025).
- Khattak, M.U.; Rasheed, H.; Maaz, M.; Khan, S.; Khan, F.S. MaPLe: Multi-modal Prompt Learning. In Proceedings of the 2023 IEEE/CVF Conference on Computer Vision and Pattern Recognition (CVPR), Vancouver Convention Center, Vancouver, BC, Canada, 18–22 June 2023; pp. 19113–19122. [Google Scholar]
- Wang, B.; Deng, X.; Sun, H. Iteratively Prompt Pre-trained Language Models for Chain of Thought. arXiv 2022, arXiv:2203.08383. Available online: https://arxiv.org/abs/2203.08383 (accessed on 20 May 2025). [CrossRef]
- Kojima, T.; Gu, S.S.; Reid, M.; Matsuo, Y.; Iwasawa, Y. Large Language Models are Zero-Shot Reasoners. arXiv 2023, arXiv:2205.11916. Available online: https://arxiv.org/abs/2205.11916 (accessed on 20 May 2025). [CrossRef]
- Alhindi, T.; Chakrabarty, T.; Musi, E.; Muresan, S. Multitask Instruction-based Prompting for Fallacy Recognition. arXiv 2023, arXiv:2301.09992. Available online: https://arxiv.org/abs/2301.09992 (accessed on 20 May 2025). [CrossRef]
- Diao, S.; Wang, P.; Lin, Y.; Pan, R.; Liu, X.; Zhang, T. Active Prompting with Chain-of-Thought for Large Language Models. arXiv 2024, arXiv:2302.12246. Available online: https://arxiv.org/abs/2302.12246 (accessed on 20 May 2025).
- OpenAI. GPT-4 Technical Report. arXiv 2023, arXiv:2303.08774. Available online: https://arxiv.org/abs/2303.08774 (accessed on 25 April 2025). [CrossRef]
- Touvron, H.; Lavril, T.; Izacard, G.; Martinet, X.; Lachaux, M.-A.; Lacroix, T.; Roziere, B.; Goyal, N.; Hambro, E.; Azhar, F.; et al. LLaMA: Open and Efficient Foundation Language Models. arXiv 2023, arXiv:2302.13971. Available online: https://arxiv.org/abs/2302.13971 (accessed on 10 April 2025). [CrossRef]
- Hegde, C. Anomaly Detection in Time Series Data using Data-Centric AI. In Proceedings of the 2022 IEEE International Conference on Electronics, Computing and Communication Technologies (CONECCT), Bangalore, India, 8–10 July 2022; IEEE: New York, NY, USA, 2022; pp. 1–6. [Google Scholar] [CrossRef]
- Chai, C.; Tang, N.; Fan, J.; Luo, Y. Demystifying Artificial Intelligence for Data Preparation. In Proceedings of the Companion of the 2023 International Conference on Management of Data (SIGMOD ’23), Seattle, WA, USA, 18–23 June 2023; pp. 13–20. [Google Scholar] [CrossRef]
- Hoberman, S. Data Model Scorecard: Applying the Industry Standard on Data Model Quality, 1st ed.; Technics Publications: Bradley Beach, NJ, USA, 2015; pp. 1–250. ISBN 978-1-63462-082-6. [Google Scholar]
- Moody, D. Metrics for Evaluating the Quality of Entity Relationship Models. In Conceptual Modeling—ER ’98; Thalheim, B., Ed.; Lecture Notes in Computer Science; Springer: Berlin, Germany, 1998; Volume 1507, pp. 211–225. [Google Scholar]
- OpenAI. Pricing—OpenAI API Documentation. Available online: https://platform.openai.com/docs/pricing (accessed on 15 April 2025).
- Google Cloud. Generative AI Pricing—Vertex AI. Available online: https://cloud.google.com/vertex-ai/generative-ai/pricing (accessed on 5 April 2025).
Disclaimer/Publisher’s Note: The statements, opinions and data contained in all publications are solely those of the individual author(s) and contributor(s) and not of MDPI and/or the editor(s). MDPI and/or the editor(s) disclaim responsibility for any injury to people or property resulting from any ideas, methods, instructions or products referred to in the content. |
© 2025 by the authors. Licensee MDPI, Basel, Switzerland. This article is an open access article distributed under the terms and conditions of the Creative Commons Attribution (CC BY) license (https://creativecommons.org/licenses/by/4.0/).