Article

Efficiency in High-Rise Building Design: A Lean Approach to Waste Identification and Reduction

by
Nicolás Morales-Caballero
1,
Karen Castañeda
1,
Eric Forcael
2 and
Rodrigo F. Herrera
1,*
1
School of Civil Engineering, Pontificia Universidad Católica de Valparaíso, Valparaíso 2374631, Chile
2
Facultad de Ingeniería, Universidad San Sebastián, Concepción 4080871, Chile
*
Author to whom correspondence should be addressed.
Systems 2025, 13(9), 782; https://doi.org/10.3390/systems13090782
Submission received: 21 July 2025 / Revised: 26 August 2025 / Accepted: 3 September 2025 / Published: 5 September 2025
(This article belongs to the Special Issue Systems Approach to Innovation in Construction Projects)

Abstract

The design phase of buildings represents a dynamic and complex process, constantly evolving with modifications and feedback. It involves numerous professionals from various specialties, resulting in a fragmented and iterative trial-and-error process. Analyzing waste is the first step towards increasing the efficiency of the design process for high-rise buildings using Lean methodology. Initially, the design phase was characterized, and processes were classified into productive, contributory, and non-contributory work. Typical waste in building design was identified, analyzed, and ranked based on frequency and impact to facilitate understanding and elimination. Three traditional design stages were identified: Schematic Design (SD), Design Development (DD), and Construction Documentation (CD). A total of 33 typical wastes were classified into the eight Lean categories. Key waste ranked by the Frequency-Adjusted Importance Index (FAII) for cost, schedule, and quality metrics were late-stage design changes, waiting for resources and information, rework, and late-stage clarification of requirements.

1. Introduction

The architecture, engineering, and construction (AEC) industry is one of the most significant contributors to the economic development of both developed and developing countries [1]. Despite its importance, this industry has historically faced low productivity levels [2]. This low productivity is primarily due to problems such as cost overruns, delays, poor knowledge management, high fragmentation, and poor scheduling [3]. These issues are caused by the large number of processes, the high number of specialists participating, and the different approaches involved in the various phases of the project. Additionally, the lack of technology integration, automation, and collaborative work increases uncertainty and complexity in industry projects [3].
Within the AEC industry, a separation between the design and construction phases is usual, leading to fragmentation, which is considered one of the main problems of the sector [4]. It is often found that professionals dedicated to design do not anticipate how to construct the designed project, leading to delays, disputes, and claims that negatively impact various aspects of the construction phase [3]. It is currently estimated that errors made in the design process cause approximately 30% of the errors during the construction stage and about 55% during the project’s operation and maintenance phase [3].
The challenge, therefore, is to enable the development of systems that facilitate information exchange within organizations. In this regard, the Building Information Modeling (BIM) methodology is the confluence of the digital information necessary to support design and construction processes, promoting collaborative work and information exchange [5]. Similarly, construction companies have successfully adopted the Lean production philosophy, introducing new concepts and principles of operations management aimed at eliminating waste and improving value generation [6]. On the other hand, the use of Lean Design methodology in projects is designed to achieve three fundamental objectives that could address the problems: delivering a product, maximizing value, and minimizing waste, thereby breaking old management paradigms and contributing innovation and continuous improvement to the process [7].
The Lean philosophy applies management measures such as involving specialists, designers, and builders during the early phases, encouraging client participation in decision-making, and holding meetings to solve problems and identify waste, among others [5]. In this context, identifying waste is the first step to increasing the efficiency of the design process. In high-rise building projects, the design phase exhibits significant levels of operational waste, such as rework, waiting for information/resources, late clarifications, and unplanned changes, arising from disciplinary fragmentation and weak cross-team coordination. These wastes undermine the reliability of the design and propagate adverse impacts on cost, schedule, and quality into construction, compromising the project’s overall efficiency. However, in recent years, most of the studies have been focused on construction waste management, while studies on waste identification and reduction are scarce, and found within structural engineering offices, such as the waste identification in the operation of structural engineering companies according to Lean management [8], and architectural offices, such as Lean design management, based on evaluating the waste items for the architectural design process [9]. In addition, another study also identified waste in a design company primarily devoted to civil, mining, and industrial projects, covering advanced design stages, considering the achievement of a lean design process [10]. Olanrewaju and Ogunmakinde [11] surveyed 47 architects in Akure, Nigeria to identify causes, barriers, approaches, and strategies for minimizing waste in the design phase, analyzing Likert-type responses using the Relative Importance Index (RII). They found as the main causes last-minute client modifications, design changes, and detailing errors; as the most used approaches, designing for flexibility and adaptability, using standardized materials, and dimensional/modular coordination; and as barriers, lack of training, poorly defined roles, and the normalization of waste. Key drivers focused on training and policy/legislation, and the strategies highlighted modular coordination and adequate detailing.
Nölle [12] presents CLiAR, a digital tool to support design decisions oriented toward resource-conscious use and circularity in the built environment, describing its logic, components, and exploratory application in early project processes. The study reports qualitative results: CLiAR structures interdisciplinary discussions and systematizes options for materiality, disassembly, and reuse, but it does not provide prioritization of waste by design stage or performance metrics, which reinforces the gap addressed by this study. It also notes that CLiAR can operate without relying on BIM or LCA, broadening its applicability in contexts with low digital maturity. Quiñones et al. [13] developed the Waste Estimation BIM Add-in (WE-BIM Add-in), an application integrated into Revit that quantifies, in early design stages, the expected construction waste by element according to the European List of Waste (LoW), linking BIM objects with codes from the Andalusian Construction Cost Database (BCCA) and automating numerical and graphical visualization. They validated its operation with a residential building, comparing two structural alternatives: reinforced concrete versus steel. The results are generated automatically and show that O2 reduces total waste by 56% compared to O1, increases the recycling rate by 49%, and decreases potentially hazardous waste by 92%, demonstrating the feasibility of integrating C&D waste quantification into the design workflow to evaluate options. Baldwin et al. [14] compare traditional in situ design with design using prefabrication in high-rise residential buildings, modeling the detailed design process with ADePT/Design Structure Matrix (DSM) on the “New Harmony” case in Hong Kong. They build and optimize information-flow models, showing that early integration reduces rework and iterative loops. They report that prefabrication shifts wet trades off-site, reduces waste, and although it raises unit costs of components, the overall cost premium is moderated to approximately 3–5% when material and productivity savings are considered.
Ajayi and Oyedele [15] employ a sequential mixed-methods design to identify design measures that minimize waste: first, four interdisciplinary focus groups (n = 30) to generate factors, and then a survey (n = 285) with SEM/CFA to confirm them. The final model consolidates four underlying dimensions: standardization and dimensional coordination, collaborative design process (including early contractor involvement), design for MMC (modern methods of construction; prefabrication/modular), and waste-efficient design documentation. The Kruskal–Wallis test showed high agreement across roles, with differences only in early contractor involvement. Despite the diffusion of Lean and BIM approaches, the available empirical evidence remains limited for systematically discriminating and prioritizing waste by design stage: Schematic Design (SD), Design Development (DD), and Construction Documents (CD), and by performance dimension cost, schedule, and quality, in high-rise building projects involving multiple designers. Unlike previous studies focused on specific design disciplines, this research provides a systematic characterization of design processes in high-rise building projects, identifying and prioritizing the wastes perceived by different designers and coordinators. In response to this gap, this research analyzes waste in design processes for buildings with more than six stories within the AEC industry. Initially, the projects’ design processes were characterized. Subsequently, the typical wastes of the design phase were identified. Then, an analysis was conducted based on the frequency and perceived importance reported by the different designers and coordinators involved. Finally, the results obtained by the various participants in the process were compared. This study expands the available evidence by showing how waste manifests in design practice, providing insights that can guide improvements in collaborative management at a critical stage in project performance.

2. Literature Review

2.1. Definitions of Fundamental Concepts

Table 1 presents general definitions of the key concepts used in the manuscript: Lean design practices; waste in the design phase; waste management in design; design stages such as Schematic Design, Design Development, and Construction Documents; and performance dimensions defined as cost, schedule, and quality. Its purpose is to unify terminology, avoid ambiguities, and establish a common framework for interpreting the prioritization of waste by process and by performance dimension.

2.2. Design Process in High-Rise Buildings and Lean Principles

The design phase of high-rise buildings is a complex and iterative process that involves many professionals from diverse disciplines, all working together to create a cohesive final project. In this multifaceted setting, design activities can be viewed as interconnected systems, where individual decisions and tasks influence one another in dynamic and sometimes unpredictable ways. Thus, systems theory emphasizes the need to understand and manage interrelationships effectively to maximize overall performance, focusing on change patterns instead of static views [36]. On the other hand, within the context of building design, interactive processes face problems related to communication, collaboration, fragmentation, and information exchange, among others, leading to inefficiencies such as delays, rework, and poor coordination between teams [37]. By understanding the entire system of design processes, it becomes possible to identify inefficiencies and waste, which can then be systematically addressed to improve overall project outcomes.
Under a lean perspective, high-rise building design is inherently complex due to the coordination of various specialists, disciplines, and phases of design [38]. In this context, the design process can be fragmented, often leading to inefficiencies, miscommunication, and errors. On the other hand, waste plays a significant role in this environment, as delays, rework, and misaligned priorities can lead to increased costs and schedule overruns, where lean and sustainability are two approaches with strong potential to address the challenges related to building design [39].
Lean construction, which is rooted in Lean manufacturing principles, has been broadly adopted to improve efficiency within the construction sector. In building design, Lean focuses on minimizing waste and boosting value by streamlining processes and enhancing communication. Accordingly, Ballard [40] stated that Lean construction focuses on reducing resource waste and improving the flow of materials and information throughout the design and construction phases. This approach is essential in high-rise buildings, where new sustainable-lean implementation methodologies for high-rise residential projects have been developed, emphasizing the importance of integrating lean and sustainability in sustainable construction [41].

2.3. Waste in Building Design

In Lean methodology, waste refers to any activity that does not add value from the customer’s point of view [42]. In the design phase of high-rise buildings, typical waste includes rework, delays due to waiting for information or resources, and late design changes that affect cost, quality, and schedule. From the perspective of waste in building design, Garcés et al. [43] highlight that Lean Construction and sustainability work together to benefit various stakeholders by reducing waste, optimizing resource use, enhancing quality, and lowering environmental impact. This combined effect boosts project profitability and improves working conditions. The approach offers a comprehensive perspective on waste, going beyond just delivering a product, since minimizing waste directly improves building design.
From this view, according to Hines & Taylor [44], the seven types of waste include overproduction, defects, unnecessary inventory, inappropriate processing, excessive transportation, waiting, and unnecessary motion. In this sense, lean tools can be used to analyze and reduce waste, such as Value Stream Mapping (VSM) and Waste Relationship Matrix (WRM), which help describe and analyze the production flow of waste, and Waste Assessment Questionnaire (WAQ) to determine the percentage of waste occurring [45]. However, it should be noted that reducing waste accounts for only one-third of successful lean implementation, since equally important are eliminating overburden on people and equipment, as well as reducing unevenness in the production schedule, which are often overlooked by companies trying to adopt lean principles [46]. In high-rise building design, waste appears in different forms, such as unnecessary design iterations (extra processing), delays in decision-making (waiting), and miscommunications leading to rework (defects).
Since construction waste should be minimized at its source, building design can significantly contribute by encouraging designers to focus on waste reduction during the planning stages [14]. Specifically, focusing on the design phase, some wastes in high-rise building design include late-stage design changes, resource delays, and late-stage clarification of requirements. These are all critical factors that impact the project’s cost, schedule, and quality. From the building design’s perspective, about one-third of construction waste can be prevented by making careful decisions during the design phase, where implementing informed processes to reduce waste is essential in building projects [47].

2.4. Impact of Lean on Building Design Efficiency

Applying Lean principles during the design phase of high-rise buildings enhances coordination, cuts delays, and boosts overall quality. By systematically identifying and removing waste, design teams can improve precision and efficiency, which helps prevent delays and cost overruns. In this sense, using Lean tools during the design phase can offer multiple advantages, including improved coordination, clearer communication, and enhanced visualization, which help identify and resolve issues early, streamline workflows, and minimize delays in construction projects [48].
Other lean approaches, such as the Lean Project Delivery System (LPDS), have demonstrated their effectiveness in improving productivity, primarily when lean tools focus on visualization and adequate information flow are used, like Virtual Design and Construction (VDC), creating new prospects for the construction industry by enabling multidisciplinary integration of design and construction processes and increasing automation through visualization [49].
Correspondingly, since tools like BIM and lean principles can be adopted separately, their integration aims to produce better results, playing a pivotal role in the Integrated Project Delivery (IPD) and virtual design and construction (VDC), where owners, designers, and contractors work together to share success, with all revenue linked to the project’s overall success [50].
Finally, applying Lean principles during the design phase of high-rise buildings provides a structured method to reduce waste and improve processes. By identifying and categorizing waste, design teams can optimize workflows, improve communication, and enhance the quality of the final design. This approach helps prioritize the most significant waste areas, allowing resources to be focused on removing the inefficiencies with the greatest potential for improvement.

3. Research Method

The research methodology was structured in three stages. In the first stage, the design process was characterized. In the second stage, non-value-adding activities were identified. Finally, in the third stage, the frequency and impact of waste were evaluated. Figure 1 presents each research stage’s tools, activities, and deliverables.
This study adopted a non-experimental, cross-sectional, exploratory-descriptive research design, suitable for analyzing perceptions and practices in a specific professional context at a particular point in time. Thus, the present study constitutes exploratory research focused on developing and testing the fundamental concepts of efficiency in high-rise building design, under a Lean approach to waste identification and reduction. Consequently, this work serves as proof-of-concept that advances the theoretical and methodological basis, setting the stage for future empirical research and large-scale validation for efficiency in high-rise building design through a Lean perspective focused on identifying and reducing waste. The target population comprised professionals involved in the design phase of high-rise building projects (more than six stories), including architects, structural engineers, MEP engineers, project coordinators, and client representatives. A purposive sampling strategy was used to ensure participants met predefined inclusion criteria: (i) a minimum of five years of experience in their discipline, and (ii) direct participation in at least one high-rise building design project. The final sample consisted of 21 professionals meeting these criteria. The survey instrument was developed based on a literature review and refined through expert judgment from senior AEC professionals. Before full deployment, the instrument underwent pilot testing with a small group of professionals to assess clarity, structure, and content relevance, leading to minor adjustments. Reliability of the instrument was verified using Cronbach’s alpha, with values above 0.90 for all evaluated dimensions, indicating excellent internal consistency.
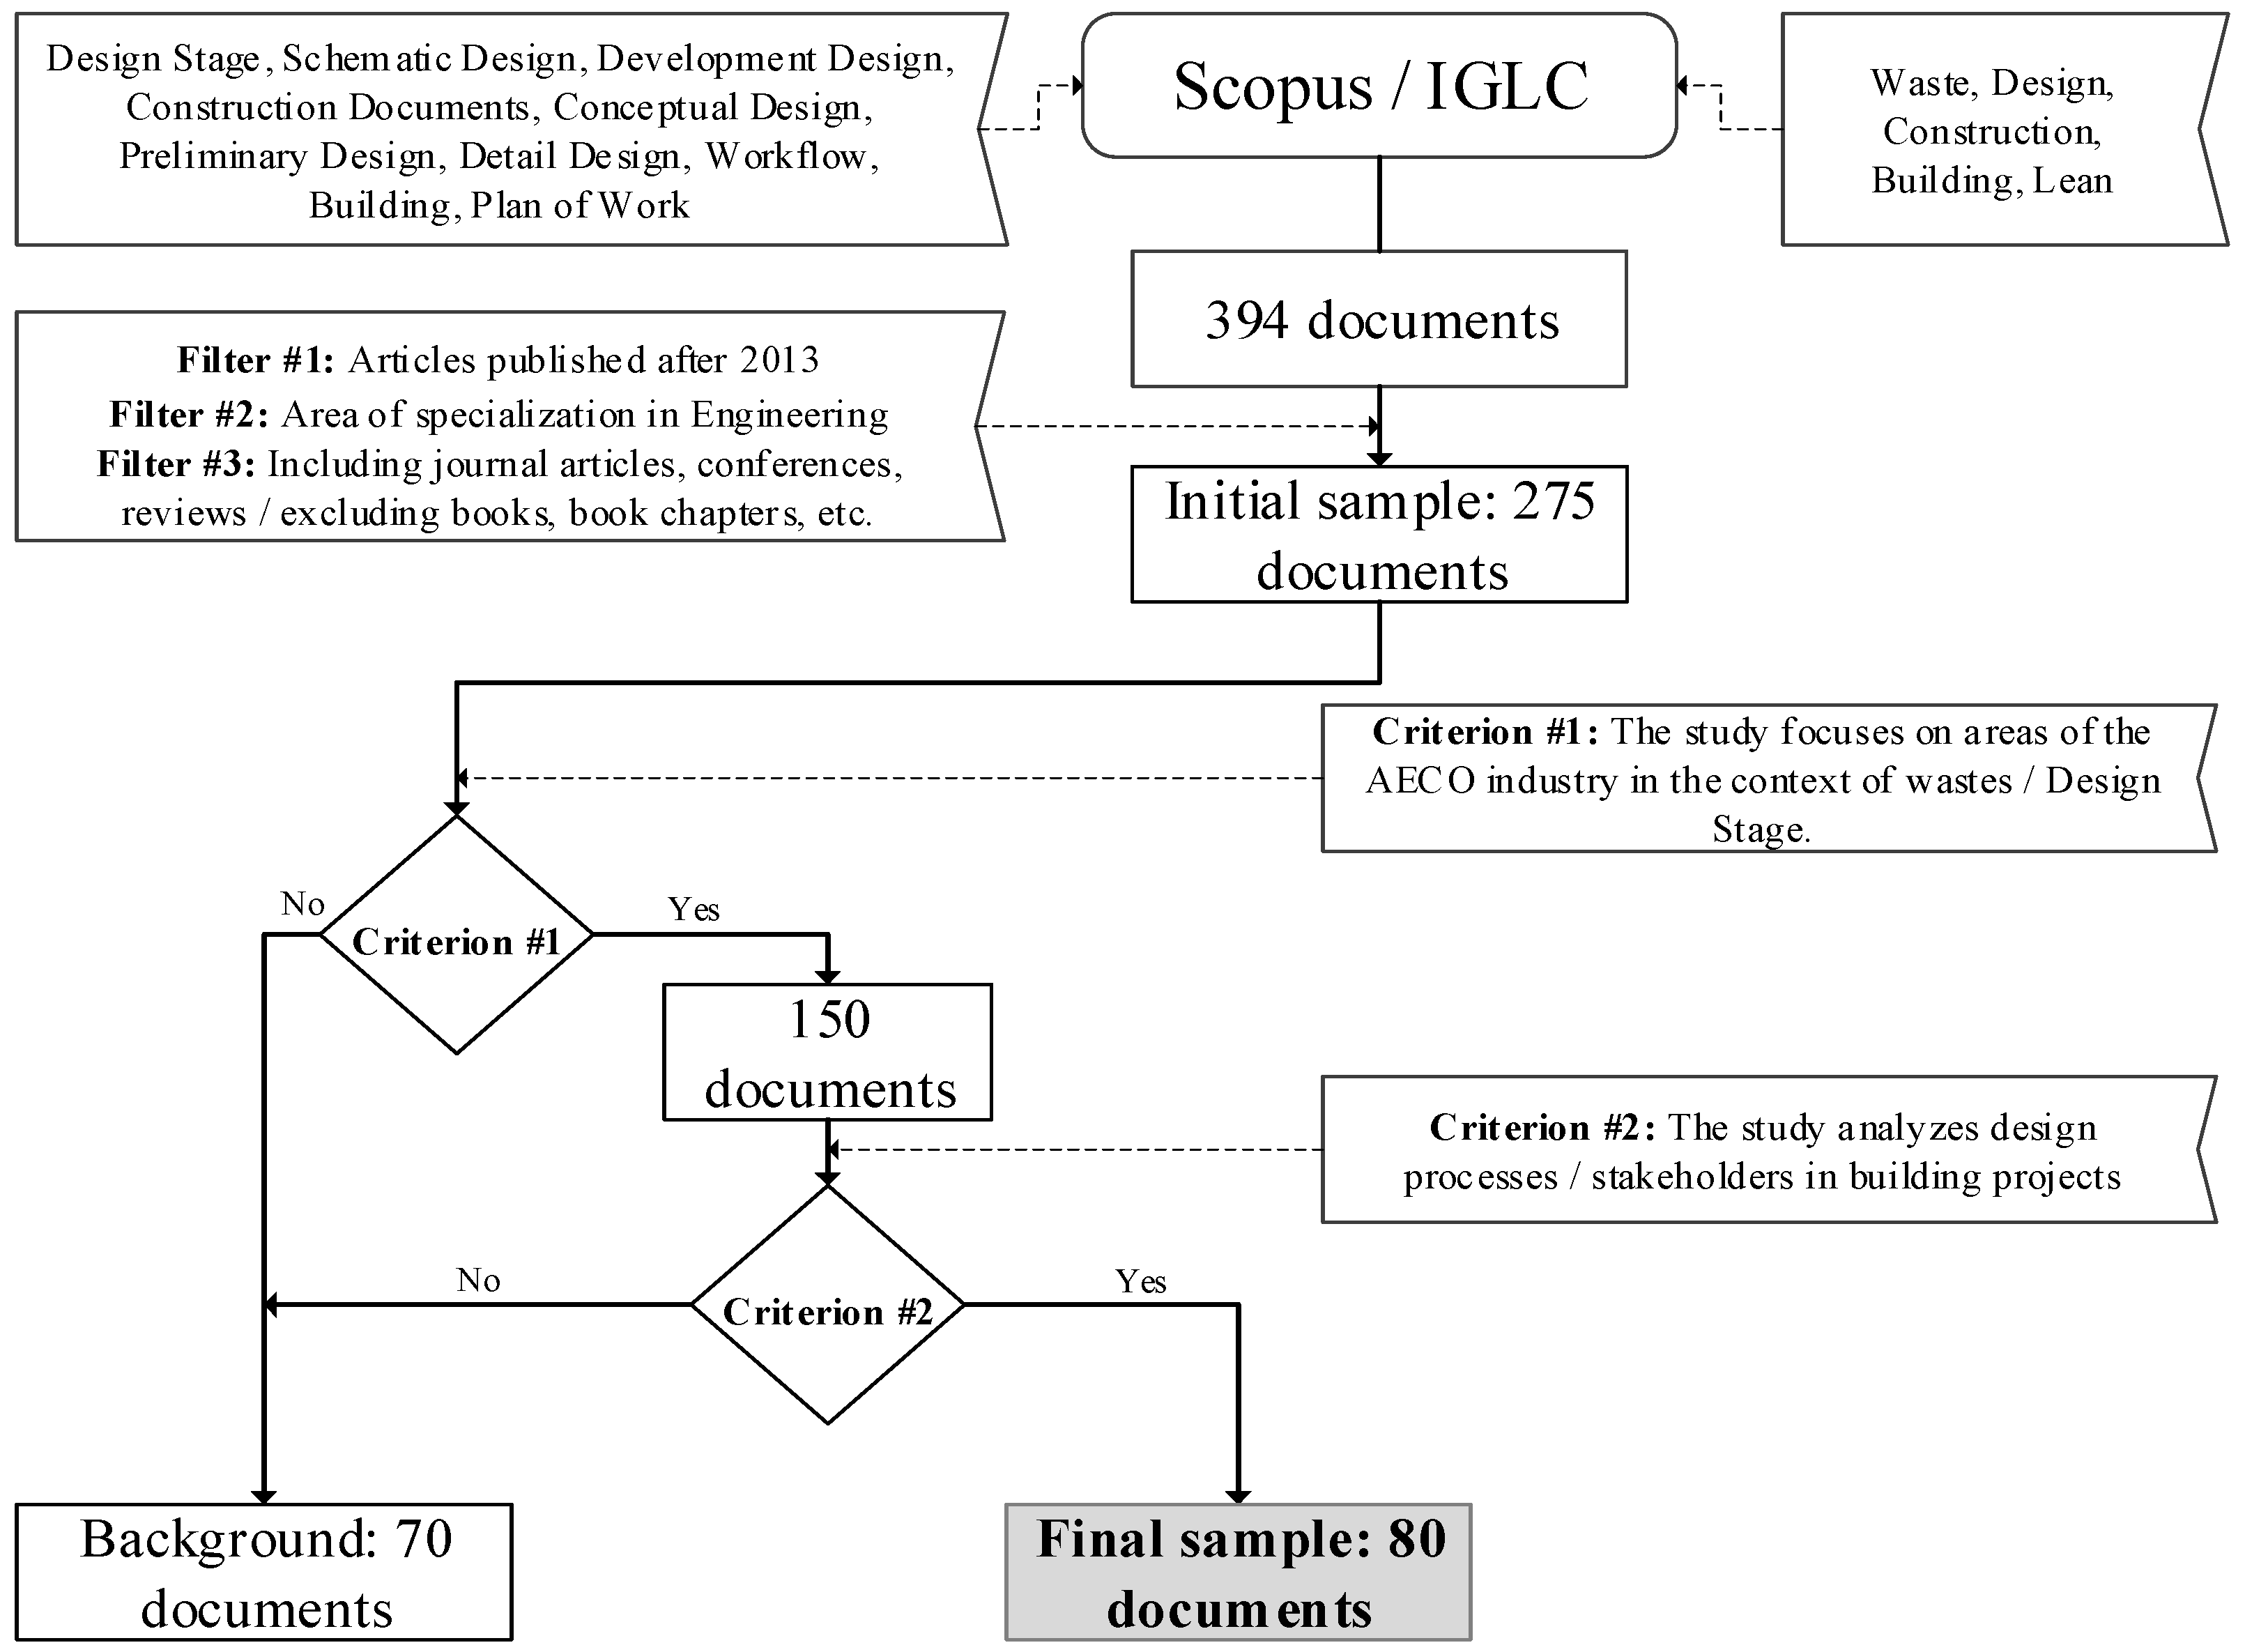
The literature reviews for the first two stages of the research focused on the design phase of high-rise building projects. These information searches were conducted on the Scopus and IGLC (International Group for Lean Construction) platforms, limiting document selection to those published in the last twelve years from 2023. This selection criterion was implemented to ensure the inclusion of up-to-date information in the study. Figure 2 shows a simplified view of the steps used for the literature review, listing the preliminary activities, filters, selection criteria, and the number of articles selected.
Figure 2 illustrates the systematic process followed to refine the document sample. The initial search in Scopus and IGLC, using the defined keywords (“Design Stage”, “Schematic Design”, “Development Design”, “Construction Documents”, “Workflow”, “Building”, “Lean”, among others), yielded a total of 394 documents. To ensure relevance and quality, three preliminary filters were applied: (1) only articles published after 2013, (2) restricted to the area of specialization in Engineering, and (3) only journal articles, conference papers, and literature reviews, excluding books and book chapters. These filters reduced the sample to 275 documents. Subsequently, two content-based inclusion criteria were applied. Criterion #1: The study focuses on areas of the AECO industry in the context of waste/design Stage. This refinement reduced the sample to 150 documents. Criterion #2: The study analyzes design processes/stakeholders in building projects. This step further reduced the final sample to 80 documents. To ensure compliance with inclusion criteria 1 and 2, a content review of each document was conducted. In this process, those that did not meet the established criteria were excluded from the main sample and considered only as background, thus guaranteeing that the final 80 documents strictly corresponded to the defined scope of the research. As shown in the figure, the remaining 70 documents were retained as background material but were not included in the final analysis.

3.1. Stage 1: Design Process Characterization

The literature review aimed to identify the participants and stages involved in the design phase of high-rise buildings. Based on these keywords: design stages, design phases, buildings, and work plans, a final selection of 7 relevant articles was considered.
The review began with the evaluation of three work plans: (i) “RIBA Plan of Work 2020” [44]; (ii) “Integrated Project Delivery: A Guide” [4]; (iii) “BIM Standard For Public Projects” [7]. Subsequently, the seven selected documents were incorporated into the study to complement the analysis. This activity initially resulted in identifying the project phases at a macro level. Then, the stages, participants, and processes that comprise the design phase were identified from the beginning of design to the start of construction.
Once the stages, participants, and processes were identified in the literature, they were validated through professional judgments from the AEC industry. For this verification, at least one professional from each design area was sought. For the selection of professionals, they required previous work experience in the design of buildings over six stories high. The characterization of the professionals is detailed in Table 2.
Then, these were diagrammed using the SIPOC tool (Suppliers, Inputs, Processes, Outputs, and Customers). This procedure was done to identify the suppliers, inputs, process names, outputs, and customers for each stage in the design phase [6]. Suppliers are the key actors who provide the necessary inputs for the process. Inputs are the materials or information used within the process, while processes represent the activities and operations that transform these inputs into specific results. Outputs or process products are described as the results obtained, and finally, the customers who will receive or benefit from these results are identified.
Subsequently, the literature review focused on identifying activities and mapping the workflow. For this information search, the following keywords were used: schematic design, design development, construction documentation, and workflow. The workflow was diagrammed using the Business Process Modeling and Notation (BPMN) tool. This diagram identifies the flow of activities, the type of information transfer, the main participants, interactions between different areas, instances of rework, and iteration [51]. Expert panels from the AEC industry were conducted to validate the activities and workflow. These reviews were carried out synchronously with all participants, and the workflow diagrams were modified based on discussions and comments arising from these sessions. The characterization of the expert panel is presented in Table 3.

3.2. Stage 2: Identification of Non-Value-Adding Activities

The second stage of the research began with the BPMN diagram obtained in the previous stage. An initial classification of the activities was proposed based on productive, contributory, and non-contributory classifications. Productive activities are those that add value, contributory activities do not add value but are necessary, and non-contributory activities neither add value nor are required [52,53,54,55]. The classification of activities was based on articles found in the literature and expert panel discussions in stage 1. Validation was performed through an asynchronous expert judgment, and the characterization of the experts participating in the judgment was previously presented in Table 3. Experts were asked for their opinions on the classifications, and iterations were conducted until an agreement was reached, a process widely used in qualitative research in the AEC industry [56]. Subsequently, a literature review was carried out to identify the primary wastes related to the design stage of buildings. The selected documents identified Lean waste categories and typical wastes according to each category’s design.

3.3. Stage 3: Evaluation of the Frequency and Impact of Waste

A virtual questionnaire was created and applied, consisting of three parts: consent (one question), personal data (eight questions), and perception of the frequency and impact. The purpose of the consent was to confirm the participation of professionals in the research, thereby authorizing the use of the data they provided. To obtain data on the frequency and impact of the 33 wastes considered, the following questions were asked: (1) probability of occurrence; (2) impact on project cost; (3) impact on project schedule; (4) impact on project quality. Each of these questions had a response range using a 5-point Likert scale: (1) very low; (2) low; (3) medium; (4) high; (5) very high.
The review of the wastes and the validation of the instrument were carried out through an expert judgment [57]. A survey proposal was presented where experts were asked to evaluate the parts of the survey, questioning the relevance and clarity of all the questions and the described wastes, also allowing them to provide comments and observations if they deemed it pertinent. To validate the data, Cronbach’s alpha test was conducted to assess the consistency of the collected data, ensuring the sample’s reliability [58]. Acceptable values were selected as parameters greater than 0.7 [58].
For data analysis, the following indicators were used: Relative Importance Index (RII), Frequency Index (FI), and Frequency Adjusted to Importance Index (FAII) [59]. The indicators were calculated using Equations (1), (2), and (3), respectively. The FI and FAII values were calculated using the five-point Likert scale values for the three selected types of impacts. The FAII method was selected because it integrates both frequency and perceived importance into a single index, allowing for a clear and transparent prioritization of wastes [60,61]. Unlike other multi-criteria decision-making approaches, such as AHP or TOPSIS, FAII does not require pairwise comparisons or weighting matrices, which reduces subjectivity and methodological complexity [62,63,64]. This makes it suitable for empirical studies involving multiple designers and coordinators, ensuring consistent results while maintaining methodological simplicity.
R I I ( % ) = W N 100 A
F I % = W n N 100 A
F A I I % = R I I × F I
where “W” represents the weight given in the responses (1 to 5), “A” means the highest weight of the responses (five in this case), “N” the number of responses (21 in this case), and “n” the frequency of the responses [59]. The RII value fluctuates between 0 and 1, while the FI and FAII values vary between 0% and 100%. The higher the values, the greater the measured frequency and impact [6]. Using the FAII values, the losses found in the literature were ranked according to the frequency adjusted to the importance index. To complement the analysis, the FAII values were categorized as follows: High (H) (80% ≤ FAII ≤ 100%); High-Medium (H-M) (60% ≤ FAII < 80%); Medium (M) (40% ≤ FAII < 60%); Medium-Low (ML) (20% ≤ FAII < 40%); Low (L) (0% ≤ FAII < 20%).
Correlations and Mann–Whitney U tests were used to identify differences between the responses from the different identified groups of professionals to complement the data analysis. The identified groups and the formulated hypotheses are presented in Table 4. A total of six tests were conducted. The first compares designers (architecture, structure, and MEP) with managers (coordinators and client representatives). The second and third tests compare groups based on their perception of the use of BIM and Lean methodologies with those who do not perceive the use of these methodologies. The fourth and fifth analyses compare groups that perceive the use of BIM and Lean tools simultaneously against groups that only use the BIM tool and those that do not use any tools, respectively. The final test compares the people who only use BIM but not Lean with those who do not use any tools. The analysis of the group that only uses the Lean tool versus the group that does not use any tools was not conducted because the sample of people who only used Lean without BIM was less than five.

4. Results and Discussion

4.1. Design Process Characterization

The literature review identified the first three phases of building projects: pre-design, design, and construction [44]. The scope of this document will cover the entire design phase. Starting with the characterization of the phase, nine work plans from different countries were identified, detailing the stages within the design phase. The diverse work plans are shown in Table 5.
Table 5 clearly shows that there is no agreement among different countries regarding the names of the stages in the design phase. Additionally, authors have identified changes in the traditional design stages depending on the methodology implemented, such as Integrated Project Delivery (IPD) and Building Information Modeling (BIM) [65,66]. This research focused on the traditional design methodology, and the stage names used are according to the American Institute of Architects (AIA) [4]. These consist of Schematic Design (SD), Design Development (DD), and Construction Documentation (CD).
Table 6 presents a detailed description of the stages that comprise the pre-design and design phases, spanning the project’s conception to the start of construction. The pre-design phase consists of the following stages: Strategic Definition, Preparation, and Briefing. These stages aim to determine the best way to meet the client’s needs and verify the necessary resources for the design [67,68]. The design phase, on the other hand, comprises the stages SD, DD, and CD, mentioned earlier, and aims to decide the appearance and functions of the structure [67,68].
There was agreement between the expert panel and the judgment of professionals regarding the information found in the literature, identifying the pre-design and design phases as phases preceding the construction phase. The groups correctly identified most of the stages belonging to the design phase. However, the judgment of professionals identified the CD stage as “detailed design.” Despite this discrepancy, professionals recognized that the CD stage and “detailed design” serve the purpose of finalizing and compiling all the necessary documentation for the construction of the building.
The expert panel and the judgment of professionals identified all the actors involved in the design phase, recognizing the roles of owner, project coordinator, architect, civil engineer, structural engineer, mechanical, electrical, and plumbing (MEP) engineers, and other specialty engineers [4]. The professionals highlighted the participation of specialties such as elevators, landscaping, and geotechnical engineering as necessary for constructing high-rise buildings.

4.1.1. Schematic Design (SD)

Schematic design is the initial stage of the design process; this stage represents the starting point of the design, following the definition of the client’s needs. Four processes were identified for this stage, carried out by the architect, civil engineer, MEP engineers, and project coordinator. The criteria of the professionals align with the processes identified in the literature [69]. It is noted that, due to the time required to design high-rise buildings, the client’s requirements and needs may change throughout the design process. This dynamic leads to a non-linear development of the stages and demands continuous adjustments in the design as it evolves, increasing the overall complexity of the phase. Additionally, professionals indicate that, in particular situations, soil mechanics studies may be needed at this stage as a preventive measure to analyze the project’s feasibility.
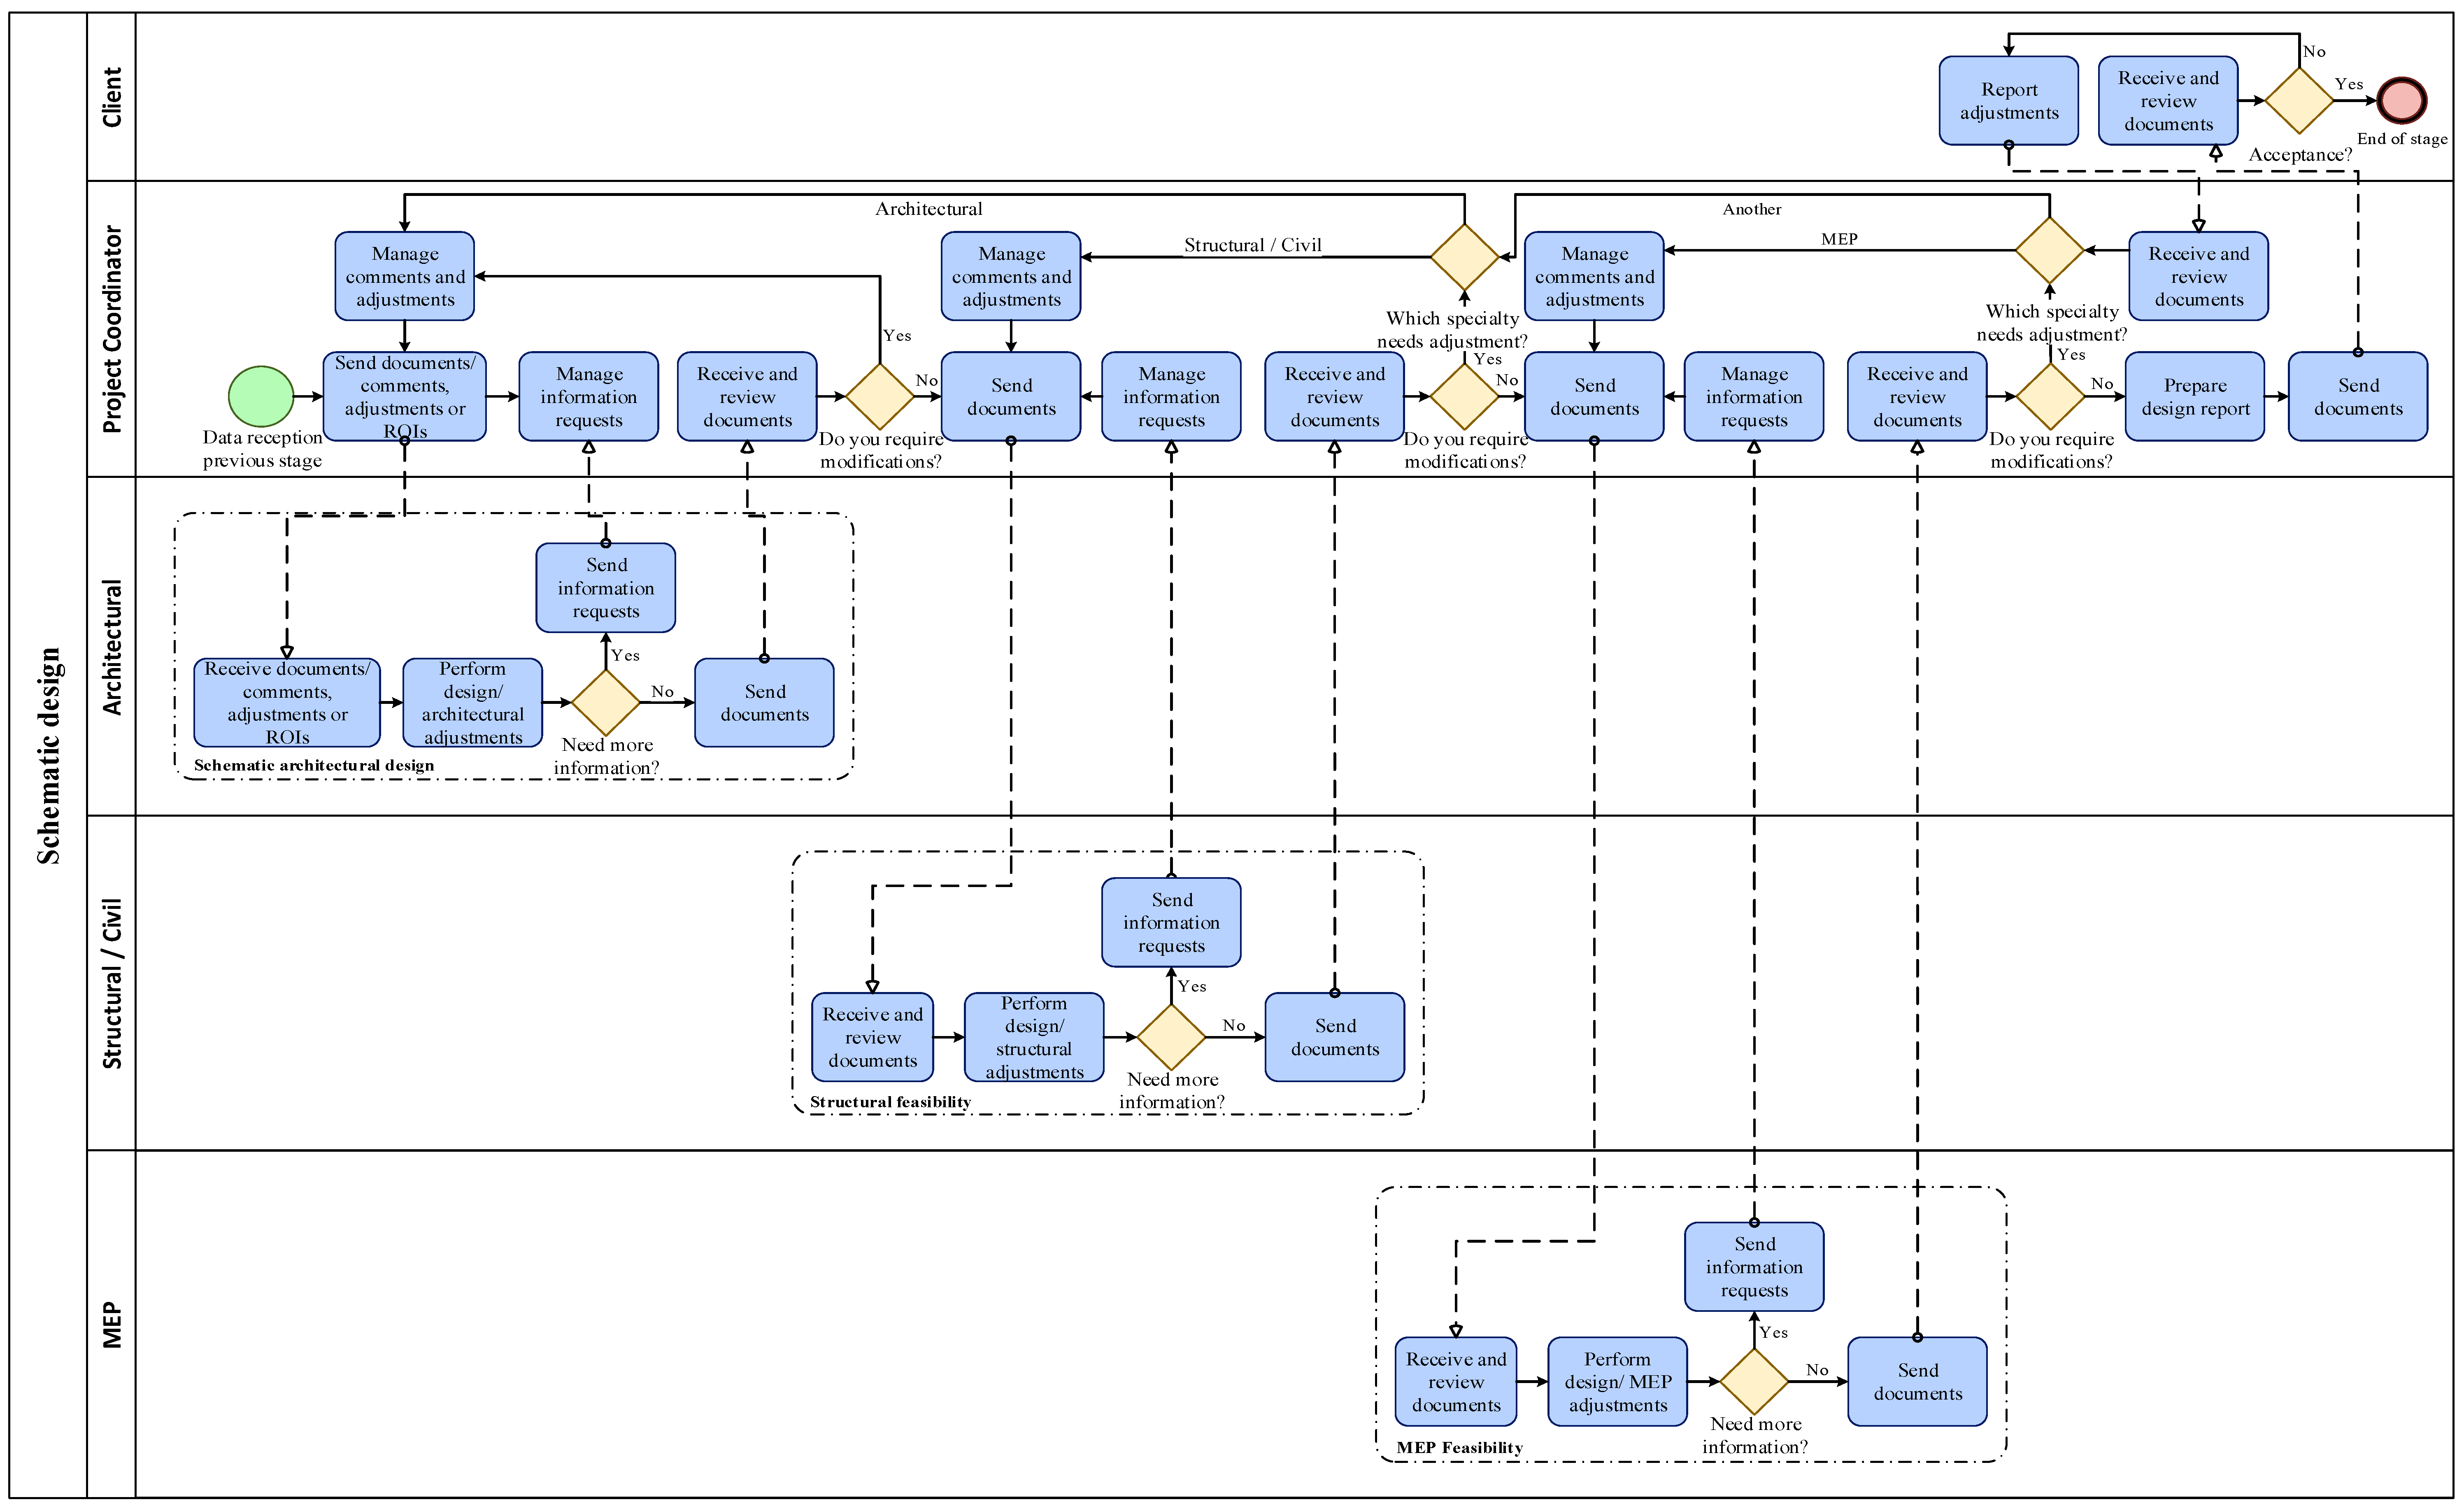
Professionals also pointed out that, in the past, the architect typically performed the project coordinator role. However, due to the complexity and difficulty of the processes, the role of the project coordinator has gradually evolved into a new specialization within the workflow. Furthermore, it is highlighted that, in the context of high-rise construction, most owners are real estate institutions. This finding is consistent with the fact that the resources needed to erect buildings of this magnitude are typically inaccessible to individuals. Figure 3 presents the resulting workflow; this BPMN diagram visually represents the various crucial processes and activities identified in the schematic design stage.
The workflow begins with the project coordinator’s delivery of the data from the pre-design phase. This data is then handed over to the architect, marking the start of the Schematic Design process. Once the information is received, the architecture office generates a schematic architectural design.
The project coordinator reviews schematic architectural design. If changes are needed, it is returned to the architecture office with the respective comments. It is then transferred to the structural office, where a preliminary review of the wall and beam thicknesses is conducted, along with preliminary calculations, as part of the structural feasibility process [69,70]. Professionals indicated that, depending on the proximity between the structural and architecture offices, this process might not be managed separately and could potentially be carried out jointly. If any doubts or design changes arise, they are coordinated with the project coordinator for follow-up.

4.1.2. Design Development (DD)

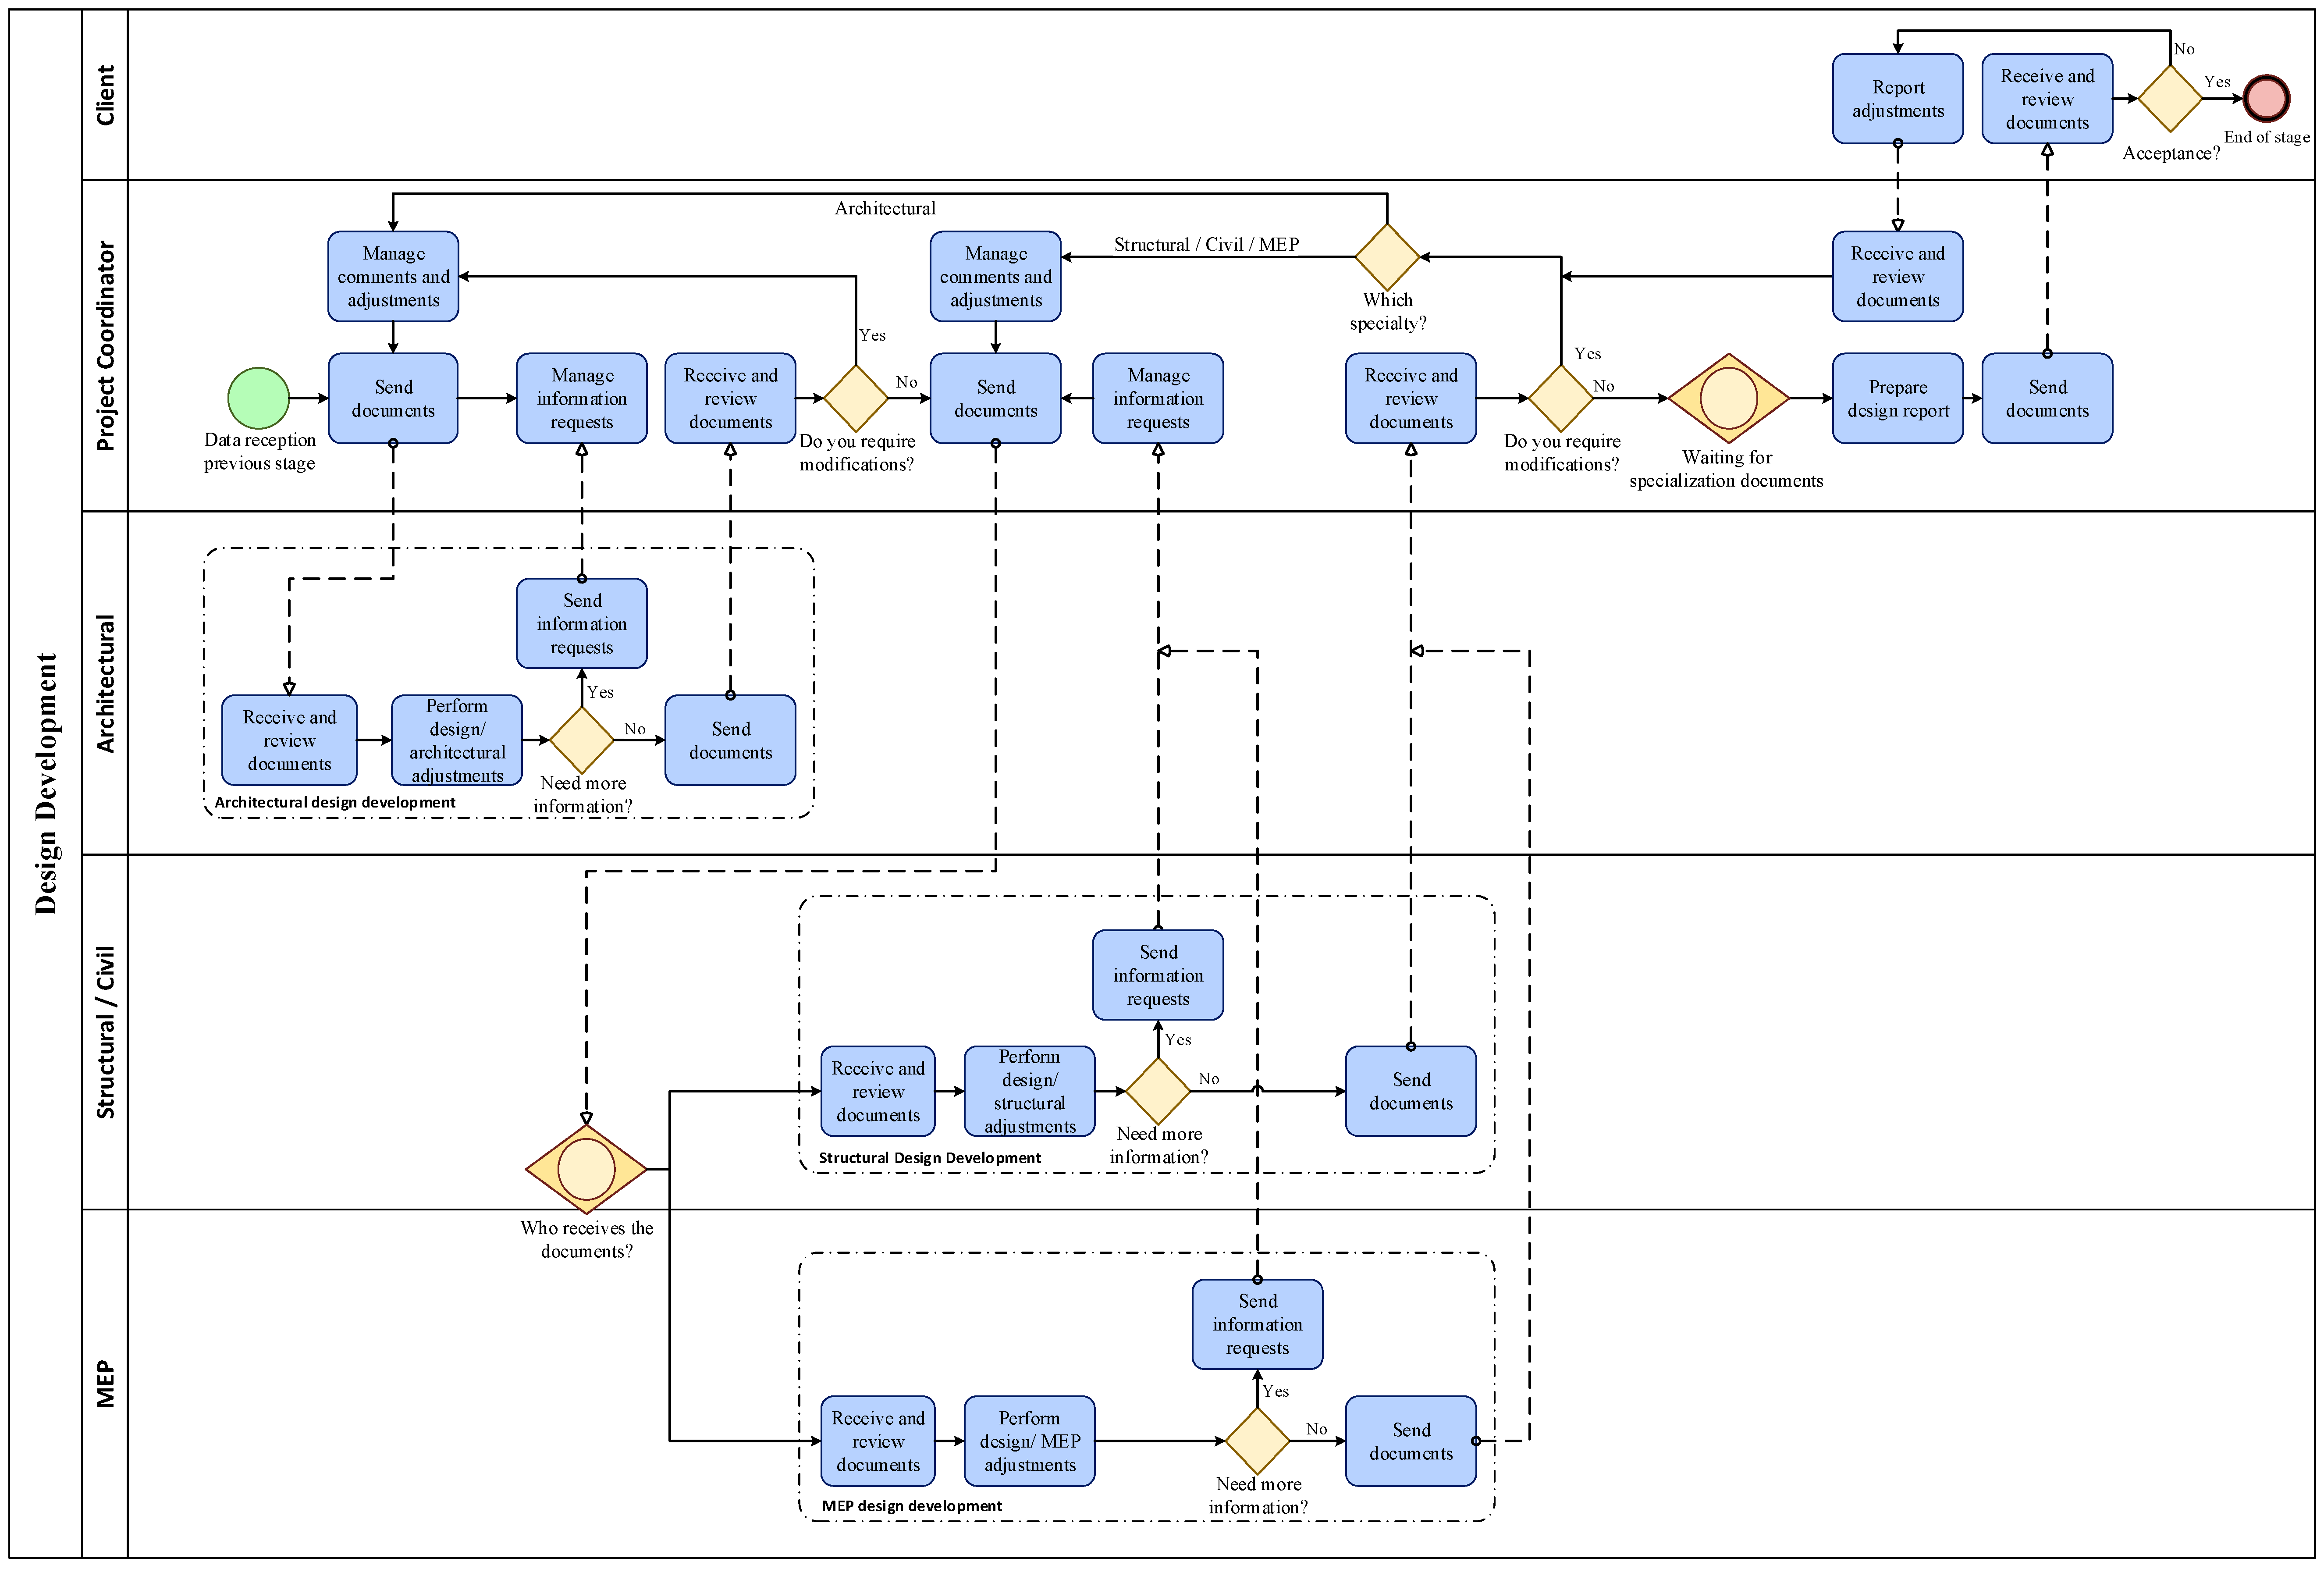
At this stage, the schematic design provided by the architect and validated by the structural specialist, along with the feasibility conducted by other MEP specialties, is available. At this point, professionals accurately identified the process inputs. Specifically, for structural design, both professionals and experts highlighted the importance of soil mechanics as a crucial input for developing the structural system, which is conducted in the specialized structural office. Experts and professionals pointed out that for the development of MEP design, it is possible that the architectural plans at this stage could be delivered simultaneously to the structural office and other specialties. This finding could lead to issues related to interferences between specialties and the structural part, creating complications when coordinating the files and hindering constructability. Structural and architectural specialists warned that, in developing countries like Chile, the environmental impact study is not always necessary, depending on the project’s location. If required, this analysis would be conducted as part of the building’s civil analysis. Figure 4 shows the workflow related to design development, which starts with the data delivery from the previous stage, specifically the schematic design phase.
For this stage, the project coordinator provides the architect with the data collected from the previous stage. After this initial delivery, the design is returned to the project coordinator for review. If changes are needed, the files are sent back to the architectural office; otherwise, the design is transferred to the specialized structural office and other specialties. Once the design development in the structural and MEP areas is completed, they are independently reviewed. These reviews may generate architectural and structural design changes [6]. When no modifications are required, the files are sent to the project coordinator, who integrates the elements to create an updated, detailed, and more comprehensive budget for the stage. In line with the previous stage, professionals and experts identified all the specialties involved in the process. The order of delivering architectural files to other disciplines was discussed, and a consensus was reached that providing them simultaneously to the structural and MEP disciplines is a common but unfavorable practice in traditional design. This finding is due to the issues arising from starting the specialty designs without a clear structural design. This fragmented approach can result in interferences, as each specialty works without a complete understanding of the design.
Professionals emphasized the non-linear nature of this process, showing that structural documents could generate changes in the architectural plans, documents from other specialties could impact structural and architectural plans, and architectural changes could result from client-requested modifications, which in turn would require adjustments in the other two disciplines. It was noted that client review could occur at different points in the stage and not exclusively at the end. This condition would depend on the level of client involvement in the project. Additionally, it was highlighted as a common practice to introduce design changes during the construction phase due to interferences generated by coordination errors [69].

4.1.3. Construction Documentation

At this stage, the primary objective is to finalize the analyses and designs by the various specialties and to obtain all the documents and permits required for the proper execution of the building construction.
As in the previous stages, professionals identified all the relevant participants and processes of this stage. The experts knew this as the detailed design stage. However, they share the same fundamental objective: to detail and finalize the designs and consolidate all necessary information to materialize the building’s construction, integrating all specialties and their respective designs into a coherent and complete set. Professionals and the literature highlight the importance of also including designs generated by specialties such as landscaping and elevators within this phase. These additional elements are essential to ensure the functionality and constructability of the building.
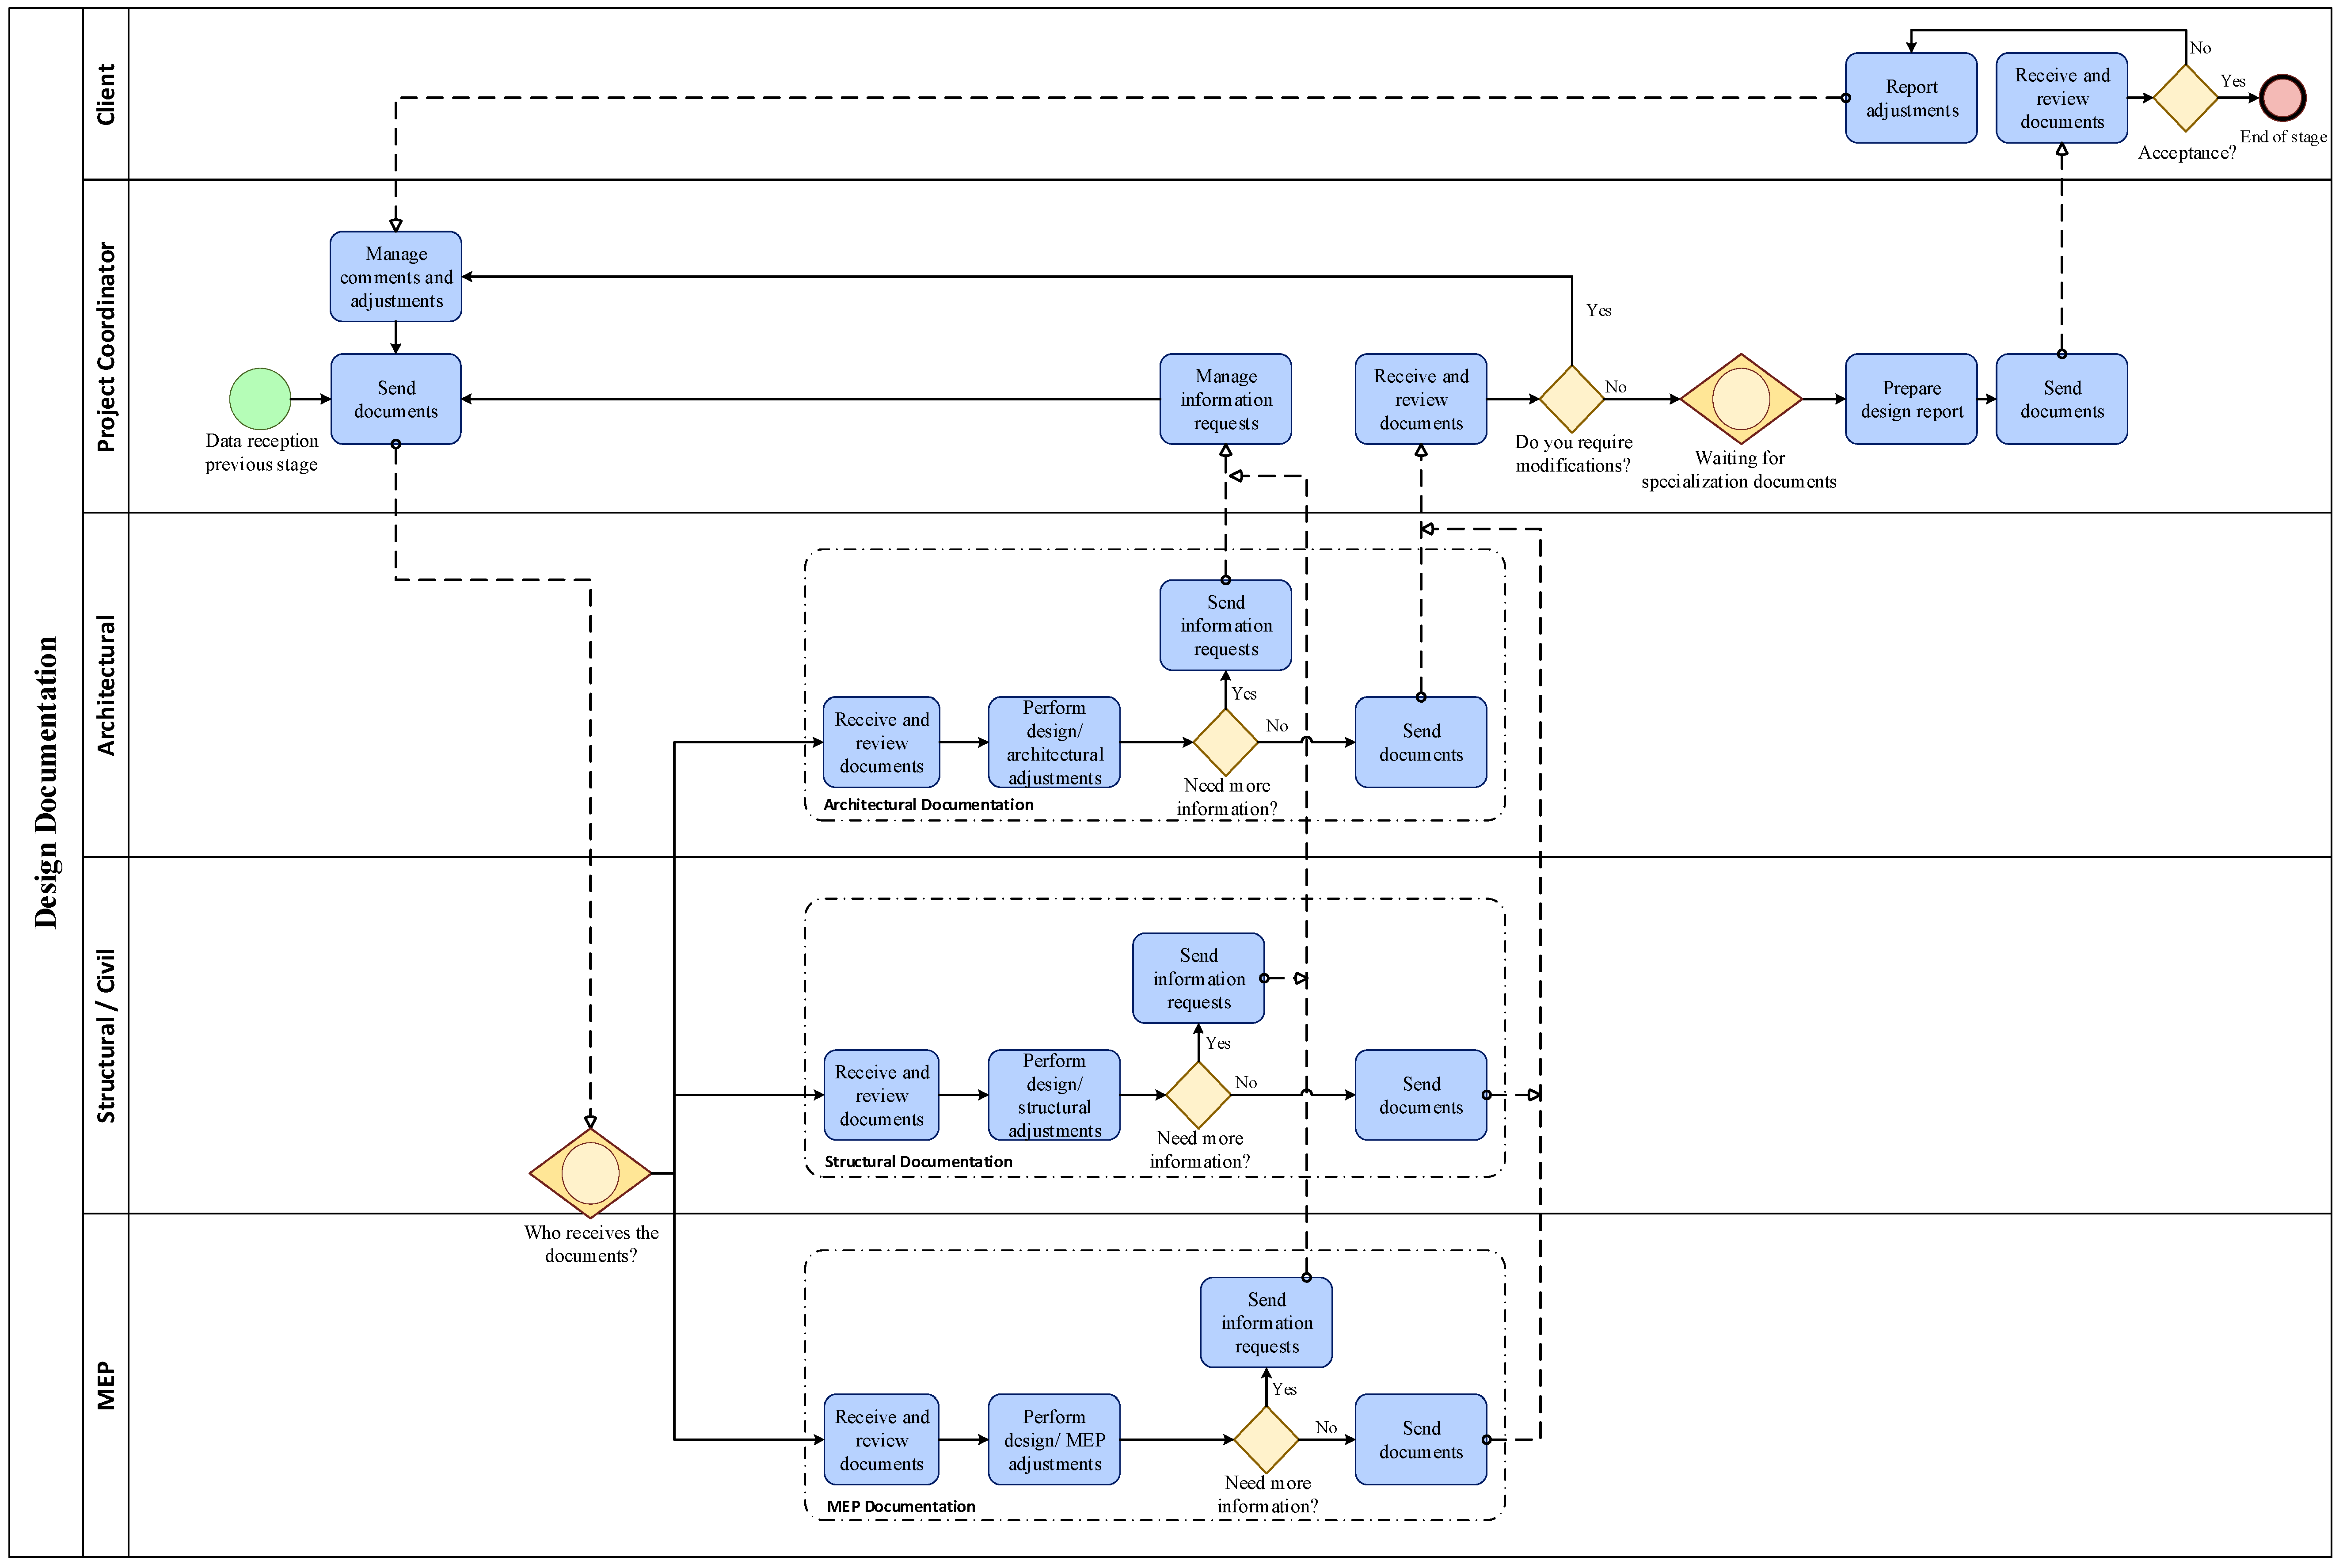
The workflow begins with the input of data from the previous stage. This data is delivered simultaneously to the disciplines involved to ensure they have all the necessary information to make pertinent adjustments and modifications. This procedure facilitates the efficient identification and implementation of any required design changes to ensure the overall coherence of the construction project, as shown in Figure 5.

4.2. Identification of Non-Value-Adding Activities

Activities with a similar nature were identified and consolidated using the results gathered in Section 3.1. The consolidated activities are listed in Table 7.
As found in the literature, it is usual for the project coordinator not to be involved in productive work, being closely linked to contributory work [71]. Similarly, the owner’s representative does not actively participate in productive work. As mentioned in Section 3.1, the client’s role can sometimes be associated with activities related to arrangements and changes caused by misunderstandings or changes in their needs. Finally, it was identified that various designers, such as architects, structural engineers, and other specialists, are involved in the core design process. From the expert panel and professional judgment, it was concluded that designers also participate in non-contributory work.
From the literature review, eight typical categories of waste were identified according to Lean Management methodology: waiting time (W1), Overprocessing (W2), Defects (W3), Inventory (W4), Overproduction (W5), Talent (W6), Transportation (W7), and Motion (W8). Many authors have reformulated and adapted the typical categories of waste. These changes in categories were not considered for the study due to the lack of evidence of their application in the building design phase, and to simplify the understanding of the categories for professionals. Similarly, the analysis was unified for high-rise building design overall, without distinguishing between different structural types or building performances. The analysis of typical wastes identified in building design was conducted. The classification of the wastes with their respective descriptions is shown in Table 8. In total, 33 wastes were identified: six related to waiting time, seven to overprocessing, four to defects, four to inventory, five to overproduction, three to talent, two to motion, and two to transportation. In addition to identifying the different waste categories, Table 8 also shows specific Lean-based measures aimed at reducing or eliminating these inefficiencies, thereby improving value creation and overall project performance.
Among the various authors covering the topic of design wastes, Freire & Alarcón [10] identified 17 wastes in the design process, of which 12 were individually considered for the analysis, while wastes such as delay in accessing work, excessive reviews, excessive supervision, and internal control of activities, defects, and incomplete work were grouped according to their nature. The study conducted by Mazlum & Pekeriçli [9], identified 28 wastes found in architectural design offices, from which 22 were used individually and were grouped: waiting for information from other disciplines and waiting for information from the client, inefficient previous work, low work speed, inefficient employee deployment, unnecessary information exchanges, and inability to acquire institutional habits, communication problems with the coordinator, failure to notify changes made, lack of initial coordination and problems with client relations, work done to provide site information, work done to provide technical reference information, and ineffective meeting organization; compliance with regulations, preparation of technical plans, and defective details.
Compared with found documents, some intrinsic wastes of architecture and structural offices are excluded or grouped, as they are not transversal to the whole design phase. Some typical Lean wastes applied to construction, identified in the design phase, were also selected, and the same was done with wastes found in the product development process. Unlike other studies, the identified wastes were assigned to only one waste category.

4.3. Frequency and Impact of Wastes

A total of 21 people responded to the survey, including 14 designers and 7 managers. Among the professionals, 14 reported using the BIM methodology in their company, 8 reported using the Lean philosophy, 6 people reported using both tools in their company, and 8 only used BIM and not Lean. Only two people used Lean without BIM. Finally, 5 people did not use any methodology in their projects. Among the responses, 43% of the designers were architects, 50% were structural engineers, and only 7% were engineers from other specialties. Among the managers, 71% were project coordinators, and 29% were client representatives.
For the waste’s perceived frequency values, the Cronbach’s alpha coefficient was 0.93. For the perceived impact values on schedule, Cronbach’s alpha coefficient was 0.97. For the impact on cost values, Cronbach’s alpha coefficient was 0.96, and finally, for the perceived effects on quality values, the Cronbach’s alpha coefficient was 0.95. Thus, according to the Cronbach’s alpha values obtained, excellent consistency is observed in all indicators since the alpha value was greater than 0.9 in all cases.
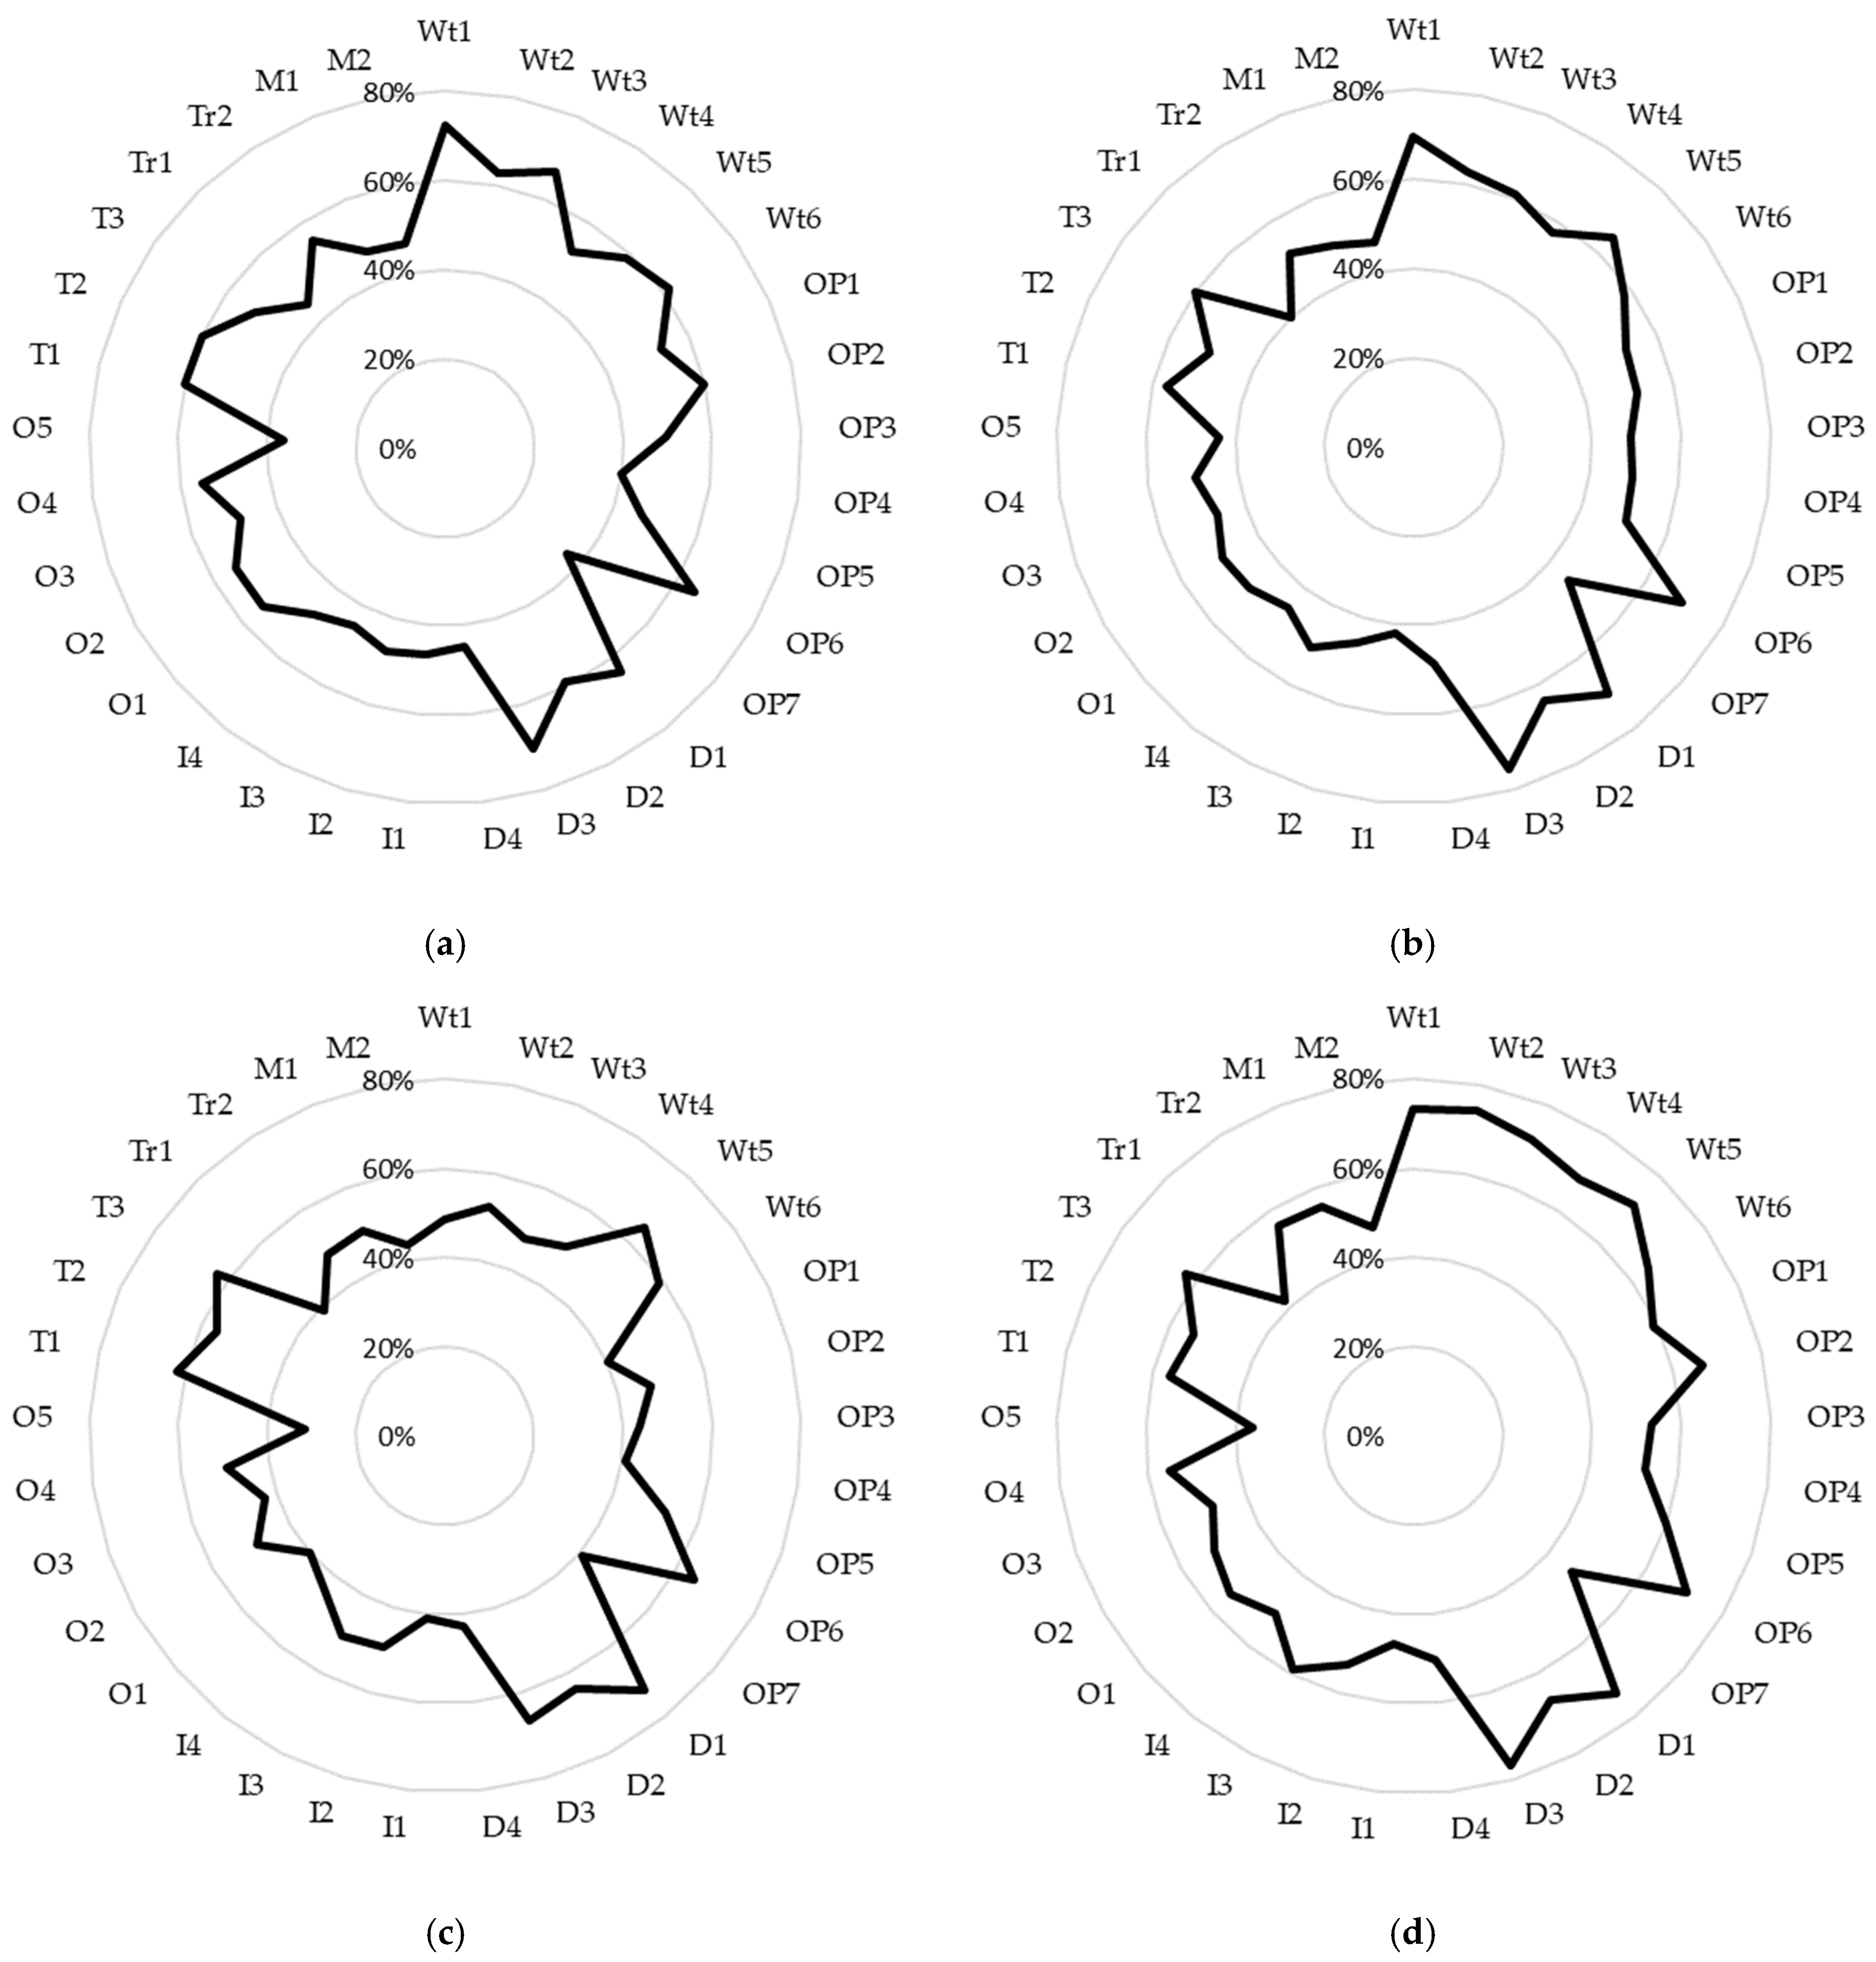
The data collected from the 33 wastes found in the building design process were analyzed. The frequency index (FI) metric and the relative importance index (RII) metric (applied to the three types of impacts) are presented below in Figure 6. Among the different categories, those that exceeded 60% in FI and RII with at least one waste were waiting time, overprocessing, defects, and talent.
In the literature, authors recognize the most frequent wastes in architectural offices as: “review work based on data provided by other disciplines”; “problems with client relationships”; “problems with public administration”; “rework”; “waiting for information from other disciplines”; “waiting for information from the client”; “late delivery of information from the client”; “not utilizing the creative capacity of the staff.” Similarly, the most frequent wastes in structural offices identified in the literature were: “a large amount of rework”; “failure to notify changes”; “work interruptions”; “inefficient communication channels.” The data obtained in the research regarding the frequency of wastes agree with the literature that the most frequent wastes in the design process are: “waiting for resources and information (Wt1)”; “delays in information delivery (Wt3)”; “errors/omissions in work (D1)”; “communication problems (Wt6)”; “inefficient use of people’s capacities (T1)”; “unutilized creativity (T2).” Additionally, it is worth noting that the waste of “rework (D2)” was found to be one of the ten most frequent wastes according to the literature, and in this study, it is the eleventh most frequent, with an FI of 59.05%.
Regarding the perceived impact of wastes, those that had the most significant impact on the cost, quality, and schedule of the project within architectural offices were: “rework”; “information review”; “late delivery of information”; “changes in architectural design.” On the other hand, the wastes found in structural offices that had the most significant impact on the project were: “a large amount of rework”; “attention to activities of other projects”; “lack of communication”; “lack of coordination”; “inefficient communication channels”; “design errors.” The data obtained in the research showed that the wastes with the most significant impact on the cost, quality, and schedule of the projects are: “errors (D1); rework (D2); design changes (D3); “inefficient work (Wt5); “communication problems” (Wt6); delays in starting tasks (Wt2). The impact of these wastes is closely linked to the effect of the wastes found in architecture and structure.

Ranking of Wastes According to the Frequency Adjusted to Importance Index (FAII)

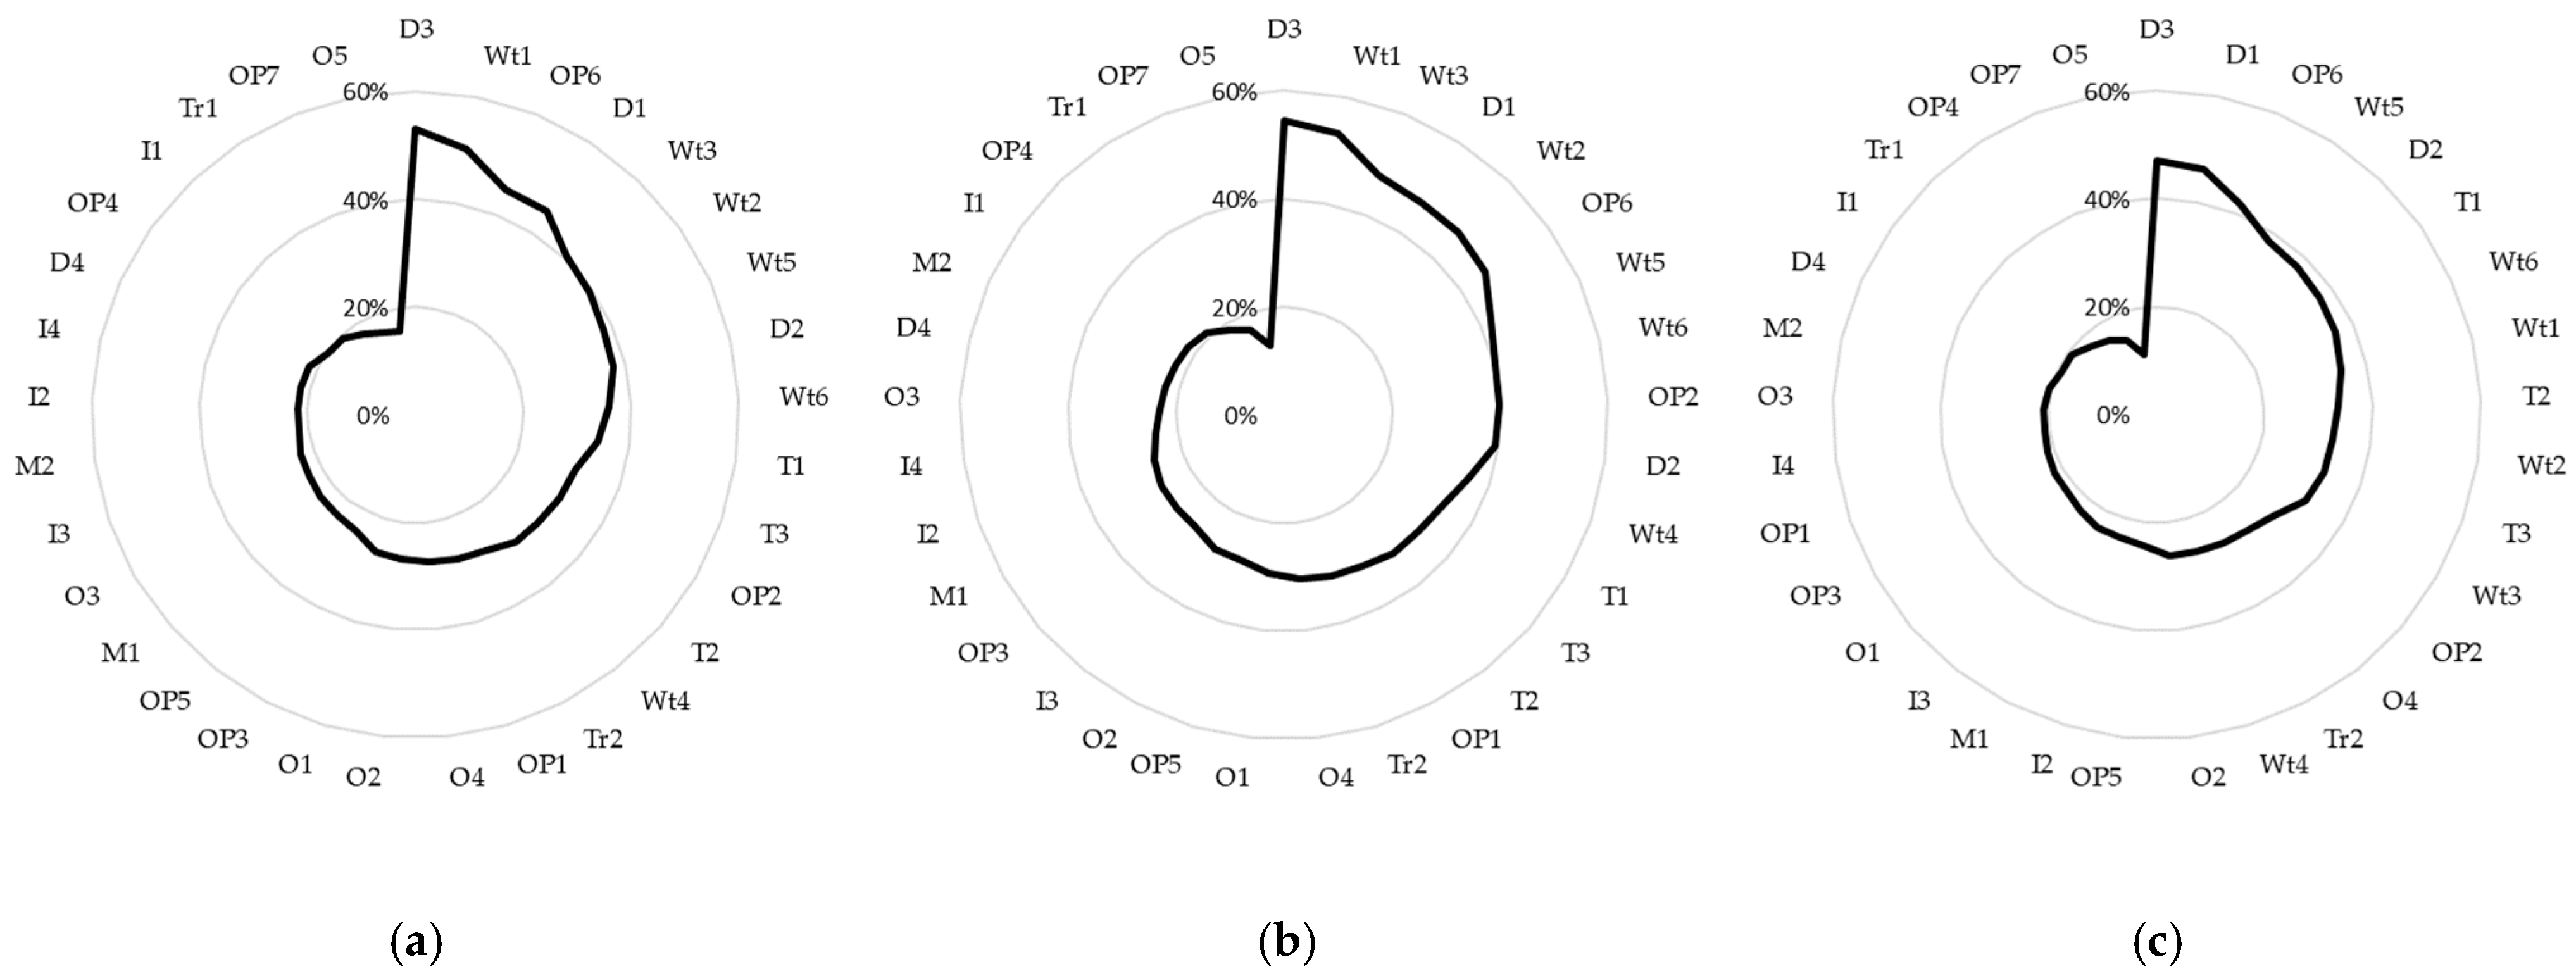
The analysis of the waste ranking according to the FAII compares waste based on their frequency and importance, allowing the identification of the waste ranking. The graphs showing the ranking are displayed in Figure 7. Below, the results of the most relevant waste according to the FAII are specified:
  • “Changes in designs in late stages (D3)”. This waste obtained the highest FAII values for cost, schedule, and quality, with values of 53%, 54%, and 46%, respectively, making it the most relevant waste in the study.
  • “Waiting for resources and information (Wt1)”. This waste ranks 2nd in the cost and schedule categories and 8th in the quality category, with values of 50%, 53%, and 35%, respectively.
  • “Clarification of needs in late design stages (OP6)”. This waste ranks 3rd in the cost and quality categories and 6th in the schedule category, with values of 45%, 41%, and 45%, respectively.
  • “Errors/omissions in work (D1)”. This waste ranks 2nd in the quality category and 4th in the cost and schedule categories, with values of 46%, 44%, and 46%, respectively.
  • “Delays in information delivery (Wt3)”. This waste ranks 3rd in the schedule category and 5th in the cost category, with values of 47% and 40%, respectively.
  • “Delays in starting tasks (Wt2)”. This waste ranks 5th in the cost and schedule categories, with scores of 39% and 46%, respectively.
  • “Rework (D2)” ranks 5th in the quality category with a score of 38%.
Comparing with the literature found, the wastes “changes in designs in late stages (D3),” “waiting for resources and information (Wt1),” “clarification of needs in late design stages (OP6),” “errors/omissions in work (D1),” “delays in information delivery (Wt3),” “delays in starting tasks (Wt2),” and “rework (D2)” are among the 10 most relevant wastes in architectural offices, structural offices, and those detected in 2002 [10].
The research data were subjected to the Mann–Whitney test to investigate possible variations according to the group to which the individuals belonged, whether designers or coordinators. Possible differences were also evaluated between those who considered themselves trained in BIM and those who did not, as well as between those trained in Lean and those who were not. It was also analyzed whether there were differences between people trained in Lean and BIM and those without training. Finally, people who were exclusively trained in BIM were compared with those without training. These analyses enabled the identification of possible relationships and differences in the data based on training categories and roles within the study group. Below are the wastes, their frequency, and their impact on quality, schedule, and cost.
The findings reveal distinct perceptions of waste among different groups, particularly concerning “waiting time,” “overprocessing,” “defects,” “inventory,” “overproduction,” “talent,” “transportation,” and “motion.” Key differences emerged between users of BIM, Lean, and those employing both methodologies.
For “waiting time” (including delays in starting tasks, work interruptions, inefficient work, and communication problems), coordinators reported more frequent delays in starting tasks, whereas designers noted more interruptions. BIM users generally perceived a lower frequency and impact of these wastes than non-BIM users. Lean users, however, perceived a more significant impact on costs. Interestingly, those employing BIM and Lean methodologies reported a higher overall impact on task duration than exclusive BIM users. Regarding “overprocessing” (involving unnecessary processes, excessive information exchange, overqualified results, and excessive supervision), BIM users again reported a lower frequency, while Lean users indicated a higher frequency of such wastes. This trend suggests a nuanced understanding among Lean users of the inefficiencies related to these activities. In the context of “defects” (rework, late-stage design changes, and failures in technological infrastructure), BIM users perceived these issues as less frequent, likely due to the advantages of BIM in mitigating such problems. Lean users, conversely, noted a higher impact on quality and duration, with users of both methodologies observing the most significant overall impact. For “inventory” (excess materials/data, information storage, and loss of resources), BIM users consistently reported lower waste perceptions, whereas Lean users recognized higher frequency and impact. The combination of BIM and Lean heightened this perception, particularly regarding waste frequency and impact. In “overproduction” (unused documentation, duplicate information, and premature requirements), the pattern continued, with BIM users downplaying the waste frequency and Lean users identifying significant impacts, especially when both methodologies were in use. This finding suggests a comprehensive understanding of these issues among Lean practitioners. Regarding “talent” (inefficient use of personnel, unutilized creativity, and misallocated expertise), the perception of waste varied similarly, with BIM users reporting fewer issues and Lean users identifying more significant impacts, particularly on costs. In “transportation” (unnecessary information transfers and impractical communication channels) and “motion” (excessive personnel movement), BIM users perceived lower waste levels, while Lean users highlighted higher frequency and cost implications.
In synthesis, comparing the previous results with the literature review, there is a clear trend among professionals using the Lean methodology. As a philosophy based on waste reduction, these professionals have a greater understanding of this waste [71], making this group the one with the highest overall perception of the frequency and impact of waste. Conversely, those who claim to use the BIM methodology perceive less frequency and impact of the wastes, presumably because the BIM methodology has advantages over traditional work methods and is used to solve some typical problems evidenced in the design phase related to information flow [38,72].

4.4. Discussion

The present study confirms that waste in the design phase of high-rise buildings is both systemic and multi-dimensional, with 33 wastes identified across eight Lean categories: waiting, overprocessing, defects, inventory, overproduction, talent, transportation, and motion. These wastes appear consistently across the three main design stages—Schematic Design, Design Development, and Construction Documentation reflecting the complexity of multi-actor systems, where iterative feedback, fragmented responsibilities, and asynchronous information flows are common. The findings also highlight how different methodological approaches, particularly BIM, Lean, or both, influence perceptions of waste frequency and impact. This dual view emphasizes not only the main wastes but also how they are experienced and addressed under different management strategies.
From a systemic view, the study’s FAII ranking identifies seven key wastes—late design changes, waiting for resources, delays, clarification needs, errors, rework, and task delays as major impacts on cost, schedule, and quality. These findings align with earlier research in design offices and extend to high-rise projects, showing that hand-offs, approvals, and requirement stability drive waste across scales. Importantly, perceptions of these wastes vary depending on whether teams focus on BIM, Lean, or both, offering new insights into how tools and methods influence awareness and performance.
On the other hand, cross-sectional comparisons by role and methodology show these differences clearly. Design coordinators are more sensitive to wastes involving task readiness, like delays, while designers report more interruptions during execution. Methodological orientation causes further divergence: BIM users perceive lower waste frequency and impact, particularly in terms of coordination and information quality. Conversely, Lean users notice more waste, especially concerning cost and schedule impacts, due to Lean’s focus on flow and waste identification. Notably, BIM + Lean users report the greatest perceived waste duration, indicating that combining approaches improves visibility and highlights delays and inefficiencies, helping teams address them.
This finding highlights the difference between BIM and Lean’s roles. BIM streamlines info and reduces errors, which can hide systemic issues like late requirement clarification. Lean exposes waste through planning, commitments, and metrics, enabling proactive resolution. Together, BIM enhances data quality and speed, while Lean enforces discipline and continuous improvement. Their combined effect lies in BIM’s transparency and Lean’s use of data for reliable commitments and reducing variation.
Organizations adopting BIM without Lean might improve documentation, but risk false efficiency due to unresolved inefficiencies. Lean alone offers process discipline but may lack digital data integration, limiting clash prevention. The best results come from combining both: BIM offers a shared digital platform, and Lean ensures that this info leads to reliable workflows and waste reduction.
The study links each waste to specific Lean countermeasures like Last Planner System and information plans for waiting, Target Value Design for overprocessing, BIM validation to reduce defects, and 5S, standardization, and Kaizen to improve flow and talent. These form a Lean design system for high-rise building projects, integrated into governance, collaboration, and technology. Consequently, this research shows that waste in design is a strategic issue, influenced by how organizations combine BIM, Lean, or both, affecting how waste is managed. Practitioners should see BIM and Lean as complementary, not interchangeable, to maximize value.
In summary, the discussion shows that high-rise building design involves recurring waste patterns caused by systemic complexity. These wastes can be measured and addressed, and BIM and Lean each contribute differently but complementarily to reducing them. By combining digital integration with process discipline, teams can better identify waste and act more effectively, providing a strategic way to improve cost, schedule, and quality in complex building projects.

5. Conclusions

Within the design phase, various processes, interactions, and activities exist among designers from diverse specialties, leading to multiple problems and non-value-adding activities. Several authors have described activities and workflows primarily in the complete design and construction process, but they do not focus on or detail the stages, iterations, and processes of high-rise building design.
This study identifies, characterizes, and classifies processes related to the design of high-rise buildings, placing the phase’s productive, contributory, and non-contributory activities. Additionally, it identifies and analyzes the 33 primary wastes found in the phase, evaluating their frequency and impacts on different project parameters, such as cost, quality, and duration. Furthermore, it was confirmed that there are differences in the measured metrics according to the type of methodology implemented in the companies, with a higher perception of the metrics in companies using the Lean methodology and a lower perception in companies using the BIM methodology.
The conclusions of this study provide a foundation for advancing the goal of increasing the efficiency of the high-rise building design process using the Lean methodology. While the Lean philosophy addresses the elimination of all wastes in pursuit of increased value and continuous improvement, it is necessary to have a general overview of the wastes in terms of their frequency and impact on the processes to diagnose problems and propose improvement plans for the systematic mitigation or elimination of these wastes. This study offers the identification of wastes ranked by frequency/impact from the perspective of cost, duration, and quality to facilitate understanding and subsequent elimination of the wastes. This way, process participants can propose improvements in the efficiency of activities through the use of new technologies, critical evaluation of their processes, and adoption of new methodologies.
From a design perspective, contracts and delivery methods can greatly influence waste generation. The findings of this research were “contract-type neutral,” but different procurement strategies (design-bid-build (DBB), design-build (DB), engineering-procurement-construction (EPC), or integrated project delivery (IPD)) can lead to varying waste patterns. In traditional design-bid-build contracts, design is fully completed before construction bidding begins. This sequential process often leads to more late-stage design changes and wasteful rework (RFIs, change orders, etc.). In contrast, design-build or EPC contracts assign a single entity to handle both design and construction, which enhances coordination. IPD arrangements go even further by involving the owner, designers, and contractor early in the process, with the explicit objective of reducing waste and minimizing rework through collaboration. Since this study did not categorize results by delivery method, its applicability to specific procurement types is limited. Future studies should compare waste outcomes across different contract types (DBB, DB, EPC, IPD, etc.) to better understand these effects and enhance the practical relevance of the findings.
In terms of limitations, the present research did not evaluate the relationships between waste and Lean principles and tools in detail, nor did it investigate different methodologies or philosophies that can be employed to eliminate the waste presented in this study. Moreover, the identified wastes were presented in an aggregate manner, without establishing direct correspondences with the design stages (SD, DD, and CD). This methodological decision allowed a broad overview but limited the ability to derive stage-specific recommendations. In addition, it has to be noted that the identified workflows and activities are not exhaustive, as the workflow formation did not consider practices associated with Lean, BIM, Agile, or IPD management methodologies. Other studies could evaluate the impact of these methodologies and technologies and the improvements they bring to the processes. Additionally, the relatively small sample size (n = 21) and the uneven distribution between designers and managers may limit the statistical power and generalizability of the findings. Therefore, caution should be exercised when extrapolating these results beyond the study context. Furthermore, this study did not distinguish waste analysis based on structural type or building performance, nor did it explore the process characterization by jointly assessing design and construction. Determining optimal design parameters for specific structural systems and performance requirements was beyond the scope of this research. Future studies could adapt and apply the proposed method to diverse structural typologies to identify optimal parameters and evaluate potential differences in waste prioritization.
Future research could also develop comparative analyses that classify the frequency and impact of waste across each design stage, using matrices or heatmaps to enhance practical usefulness. Additionally, future studies might extend this research by systematically exploring the causal mechanisms through which each waste type reduces design efficiency in high-rise projects, relating them to measurable performance impacts such as delays, rework rates, and coordination issues. Finally, future research should also test the proposed method in real high-rise building projects to assess its practical effectiveness and refine the prioritization results based on actual project conditions.

Author Contributions

Conceptualization, N.M.-C., K.C. and R.F.H.; Methodology, K.C., E.F. and R.F.H.; Validation, K.C. and E.F.; Formal analysis, N.M.-C.; Writing—original draft, N.M.-C. and K.C.; Writing—review & editing, E.F. and R.F.H.; Visualization, N.M.-C.; Supervision, R.F.H.; Funding acquisition, R.F.H. All authors have read and agreed to the published version of the manuscript.

Funding

Rodrigo F. Herrera acknowledges the financial support from ANID FONDECYT Iniciación 2023 No. 11230455.

Data Availability Statement

Not applicable.

Acknowledgments

The authors thank the Technology, Innovation, Management, and Sustainability in Civil Engineering (TIMS) research group of the Pontificia Universidad Católica de Valparaíso for the support received during her research internship. Karen Castañeda thanks the Technology, Innovation, Management, and Sustainability in Civil Engineering (TIMS) research group of the Pontificia Universidad Católica de Valparaíso for the support received during her research internship.

Conflicts of Interest

The authors declare no conflicts of interest.

References

  1. Sarhan, J.G.; Xia, B.; Fawzia, S.; Karim, A. Lean Construction Implementation in the Saudi Arabian Construction Industry. Constr. Econ. Build. 2017, 17, 46–69. [Google Scholar] [CrossRef]
  2. Hakansson, H.; Ingemansson, M. Industrial Renewal within the Construction Network. Constr. Manag. Econ. 2013, 31, 40–61. [Google Scholar] [CrossRef]
  3. Yeganeh, A.A.; Azizi, M.; Falsafi, R. Root Causes of Design-Construction Interface Problems in Iranian Design-Build Projects. J. Constr. Eng. Manag. 2019, 145, 05019014. [Google Scholar] [CrossRef]
  4. AIA California Council. Integrated Project Delivery: A Guide. Am. Inst. Archit. 2007, 1, 1–62. [Google Scholar]
  5. Gambatese, J.A.; Pestana, C.; Lee, H.W. Alignment between Lean Principles and Practices and Worker Safety Behavior. J. Constr. Eng. Manag. 2017, 143, 04016083. [Google Scholar] [CrossRef]
  6. Kaswan, M.S.; Rathi, R. Green Lean Six Sigma for Sustainable Development: Integration and Framework. Environ. Impact Assess. Rev. 2020, 83, 106396. [Google Scholar] [CrossRef]
  7. Planbim (CORFO). Estándar BIM Para Proyectos Públicos; CORFO: Santiago, Chile, 2021. [Google Scholar]
  8. Muñoz-La Rivera, F.; Vielma, J.C.; Herrera, R.F.; Gallardo, E. Waste Identification in the Operation of Structural Engineering Companies (SEC) According to Lean Management. Sustainability 2021, 13, 4249. [Google Scholar] [CrossRef]
  9. Mazlum, S.K.; Pekeriçli, M.K. Lean Design Management—An Evaluation of Waste Items for Architectural Design Process (1). Metu J. Fac. Archit. 2016, 33, 1–20. [Google Scholar] [CrossRef]
  10. Freire, J.; Alarcón, L.F. Achieving Lean Design Process: Improvement Methodology. J. Constr. Eng. Manag. 2002, 128, 248–256. [Google Scholar] [CrossRef]
  11. Olanrewaju, S.D.; Ogunmakinde, O.E. Waste Minimisation Strategies at the Design Phase: Architects’ Response. Waste Manag. 2020, 118, 323–330. [Google Scholar] [CrossRef]
  12. Nölle, T. CLiAR A Digital Tool for the Conscious Use of Resources. IOP Conf. Ser. Earth Environ. Sci. 2020, 588, 032012. [Google Scholar] [CrossRef]
  13. Quiñones, R.; Llatas, C.; Montes, M.V.; Cortés, I. Quantification of Construction Waste in Early Design Stages Using Bim-Based Tool. Recycling 2022, 7, 63. [Google Scholar] [CrossRef]
  14. Baldwin, A.; Poon, C.-S.; Shen, L.-Y.; Austin, S.; Wong, I. Designing out Waste in High-Rise Residential Buildings: Analysis of Precasting Methods and Traditional Construction. Renew. Energy 2009, 34, 2067–2073. [Google Scholar] [CrossRef]
  15. Ajayi, S.O.; Oyedele, L.O. Critical Design Factors for Minimising Waste in Construction Projects: A Structural Equation Modelling Approach. Resour. Conserv. Recycl. 2018, 137, 302–313. [Google Scholar] [CrossRef]
  16. Franco, J.V.; Picchi, F.A. Lean Design in Building Projects: Guiding Principles and Exploratory Collection of Good Practices. In Proceedings of the 24th Annual Conference of the International Group for Lean Construction, Boston, MA, USA, 18–24 July 2016; pp. 113–123. [Google Scholar]
  17. Majerus, N. Leveraging Lean Principles in R&D: The experience of The Goodyear Tire & Rubber Company shows how applying to Lean principles to R&D can improve the efficiency and effectiveness of new product development. Res.-Technol. Manag. 2017, 60, 17–25. [Google Scholar] [CrossRef]
  18. Lee, H.W.; Tommelein, I.D.; Ballard, G. Product Development and Design Management. In Proceedings of the 18th Annual Conference of the International Group for Lean Construction, Haifa, Israel, 14 July 2010; pp. 113–122. [Google Scholar]
  19. Aslam, M.; Gao, Z.; Smith, G. Optimizing Construction Design Process Using The Lean Based Approach. Lean Constr. J. 2020, 176–204. Available online: https://leanconstruction.org/lean-construction-journal/doi-info-2020-176-204/ (accessed on 25 August 2025).
  20. Mossad, G.N.; Othman, A.A.E.; Harinarain, N. Lean Thinking as an Approach for Improving Client Communication During the Design Process. In Construction in 5D: Deconstruction, Digitalization, Disruption, Disaster, Development; Springer International Publishing: Cham, Switzerland, 2023; pp. 309–325. [Google Scholar]
  21. Hashemi, M.H.; Haj, N.; Mamaghani, M.H.; Daei, M. Design and Utilization Wastes in Construction. ARPN J. Eng. Appl. Sci. 2014, 9, 2212–2219. [Google Scholar]
  22. Waheed, W.; Khodeir, L.; Fathy, F. Integrating Lean and Sustainability for Waste Reduction in Construction from the Early Design Phase. HBRC J. 2024, 20, 337–364. [Google Scholar] [CrossRef]
  23. Elsawaf, L.A.; Othman, A.A.E. Design out Waste as an Approach for Achieving Sustainability in Egyptian Housing Projects. IOP Conf. Ser. Mater. Sci. Eng. 2020, 974, 012022. [Google Scholar] [CrossRef]
  24. Othman, A.A.E.; Abdelrahim, S.M. Achieving Sustainability through Reducing Construction Waste during the Design Process. J. Eng. Des. Technol. 2019, 18, 362–377. [Google Scholar] [CrossRef]
  25. Moreton, A.; Coffey, V.; Sadiqi, Z. Training for Reduction of Design Waste. Proc. Inst. Civ. Eng.–Waste Resour. Manag. 2016, 169, 123–130. [Google Scholar] [CrossRef]
  26. Kelly, M.; Dowd, D. A Review of Construction Waste Management Practices on Selected Case Studies in Ireland. Proc. Inst. Civ. Eng.–Waste Resour. Manag. 2017, 170, 78–84. [Google Scholar] [CrossRef]
  27. Vallero, D.A. Green Engineering and Sustainable Design Aspects of Waste Management. In Waste; Elsevier: Amsterdam, The Netherlands, 2011; pp. 11–21. [Google Scholar]
  28. Thyberg, K.; Tonjes, D. A Management Framework for Municipal Solid Waste Systems and Its Application to Food Waste Prevention. Systems 2015, 3, 133–151. [Google Scholar] [CrossRef]
  29. Royal Institute of British Architects. RIBA Plan of Work 2020 Overview; Royal Institute of British Architects: London, UK, 2020. [Google Scholar]
  30. Norton, J.N.; Brouwer, A.B. The Planning, Design and Construction Process. In Planning and Designing Research Animal Facilities; Elsevier: Amsterdam, The Netherlands, 2009; pp. 17–44. [Google Scholar]
  31. Lam, P.T.I.; Wong, F.W.H. Improving Building Project Performance: How Buildability Benchmarking Can Help. Constr. Manag. Econ. 2009, 27, 41–52. [Google Scholar] [CrossRef]
  32. Park, Y.-J.; Yi, C.-Y. Resource-Based Quality Performance Estimation Method for Construction Operations. Appl. Sci. 2021, 11, 4122. [Google Scholar] [CrossRef]
  33. Rachmawati, F.; Mudjahidin, M.; Dewi Widowati, E. Work Rate Modeling of Building Construction Projects Using System Dynamic to Optimize Project Cost and Time Performance. Int. J. Constr. Manag. 2024, 24, 213–225. [Google Scholar] [CrossRef]
  34. Ling, F.Y.Y. Key Determinants of Performance of Design-Bid-Build Projects in Singapore. Build. Res. Inf. 2004, 32, 128–139. [Google Scholar] [CrossRef]
  35. Cha, H.S.; Kim, C.K. Quantitative Approach for Project Performance Measurement on Building Construction in South Korea. KSCE J. Civ. Eng. 2011, 15, 1319–1328. [Google Scholar] [CrossRef]
  36. Senge, P. The Fifth Discipline: The Art and Practice of Learning Organization; Bantam Doubleday Dell Publishing Group, Inc.: New York, NY, USA, 1990; ISBN 9780385260947. [Google Scholar]
  37. Galaz-Delgado, E.I.; Herrera, R.F.; Atencio, E.; Rivera, F.M.-L.; Biotto, C.N. Problems and Challenges in the Interactions of Design Teams of Construction Projects: A Bibliometric Study. Buildings 2021, 11, 461. [Google Scholar] [CrossRef]
  38. Koskela, L. An Exploration Toward a Production Theory and Its Application to Construction; VTT Technical Research Centre of Finland: Espoo, Finland, 2000. [Google Scholar]
  39. Waheed, W.; Khodeir, L.; Fathy, F. Investigation of Sustainability and Lean Approaches for Efficient Architecture Design Management. Results Eng. 2025, 27, 105847. [Google Scholar] [CrossRef]
  40. Ballard, G. The Last Planner System of Production Control. Ph.D. Thesis, The University of Birmingham, Birmingham, UK, 2000. [Google Scholar]
  41. Khanapure, V.U.; Shastri, S.S. A Sustainable–Lean Implementation Methodology: A Catalyst for Sustainability Enhancement of High-Rise Residential Projects. Eng. Constr. Archit. Manag. 2024, 31, 2585–2603. [Google Scholar] [CrossRef]
  42. Womack, J.P.; Jones, D.T. Lean Thinking: Banish Waste and Create Wealth in Your Corporation; Free Press: New York, NY, USA, 2010; ISBN 0-7432-4927-5. [Google Scholar]
  43. Garcés, G.; Forcael, E.; Osorio, C.; Castañeda, K.; Sánchez, O. Systematic Review of Lean Construction: An Approach to Sustainability and Efficiency in Construction Management. J. Infrastruct. Preserv. Resil. 2025, 6, 1–28. [Google Scholar] [CrossRef]
  44. Hines, P.; Taylor, D. Going Lean; Lean Enterprise Research Centre: Cardiff, UK, 2000; ISBN 0-9537982-0-8. [Google Scholar]
  45. Rahmanasari, D.; Sutopo, W.; Rohani, J.M. Implementation of Lean Manufacturing Process to Reduce Waste: A Case Study. IOP Conf. Ser. Mater. Sci. Eng. 2021, 1096, 012006. [Google Scholar] [CrossRef]
  46. Liker, J.K. The 14 Principles of the Toyota Way: An Executive Summary of the Culture behind TPS. In The Toyota Way: 14 Management Principles from the World’s Greatest Manufacturer; McGraw-Hill: New York, NY, USA, 2004; pp. 35–41. ISBN 0071392319. [Google Scholar]
  47. Mahinkanda, M.M.M.P.; Ochoa Paniagua, J.J.; Rameezdeen, R.; Chileshe, N.; Gu, N. Design Decision-Making for Construction Waste Minimisation: A Systematic Literature Review. Buildings 2023, 13, 2763. [Google Scholar] [CrossRef]
  48. Aziz, R.M.; Nasreldin, T.I.; Hashem, O.M. The Role of BIM as a Lean Tool in Design Phase. J. Eng. Appl. Sci. 2024, 71, 23. [Google Scholar] [CrossRef]
  49. Aslam, M.; Gao, Z.; Smith, G. Integrated Implementation of Virtual Design and Construction (VDC) and Lean Project Delivery System (LPDS). J. Build. Eng. 2021, 39, 102252. [Google Scholar] [CrossRef]
  50. Marzouk, M.; Elmaraghy, A. Design for Deconstruction Using Integrated Lean Principles and BIM Approach. Sustainability 2021, 13, 7856. [Google Scholar] [CrossRef]
  51. Dumas, M.; La Rosa, M.; Mendling, J.; Reijers, H.A. Fundamentals of Business Process Management; Springer: Berlin/Heidelberg, Germany, 2013; ISBN 978-3-642-33142-8. [Google Scholar]
  52. Formoso, C.T.; Isatto, E.L.; Hirota, E.H. Method for Waste Control in the Building Industry. In Proceedings of the 7th Annual Conference of the International Group for Lean Construction (IGLC), Berkeley, CA, USA, 26–28 July 1999; pp. 330–353. [Google Scholar]
  53. Akadiri, P.O.; Olomolaiye, P.O.; Chinyio, E.A. Multi-Criteria Evaluation Model for the Selection of Sustainable Materials for Building Projects. Autom. Constr. 2013, 30, 113–125. [Google Scholar] [CrossRef]
  54. da Silva Etges, B.M.B. Value-Adding Activities Level in Brazilian Infrastructure Construction Companies—9 Cases Study. In Proceedings of the 26th Annual Conference of the International Group for Lean Construction (IGLC), Chennai, India, 18–22 July 2018; pp. 1323–1333. [Google Scholar]
  55. Zhao, Y.; Chua, D.K.H. Relationship Between Productivity and Non Value-Adding Activities. In Proceedings of the 11th Annual Conference of the International Group for Lean Construction (IGLC), Blacksburg, VA, USA, 22–24 July 2003. [Google Scholar]
  56. Hallowell, M.R.; Gambatese, J.A. Qualitative Research: Application of the Delphi Method to CEM Research. J. Constr. Eng. Manag. 2010, 136, 99–107. [Google Scholar] [CrossRef]
  57. Forcael, E.; Morales, H.; Agdas, D.; Rodríguez, C.; León, C. Risk Identification in the Chilean Tunneling Industry. Eng. Manag. J. 2018, 30, 203–215. [Google Scholar] [CrossRef]
  58. Tavakol, M.; Dennick, R. Making Sense of Cronbach’s Alpha. Int. J. Med. Educ. 2011, 2, 53–55. [Google Scholar] [CrossRef]
  59. Sánchez, O.; Castañeda, K.; Mejía, G.; Pellicer, E. Delay Factors: A Comparative Analysis between Road Infrastructure and Building Projects. In Proceedings of the Construction Research Congress 2020, Tempe, AZ, USA, 8–10 March 2020; American Society of Civil Engineers, Ed.; American Society of Civil Engineers: Reston, VA, USA, 2020; pp. 223–231. [Google Scholar]
  60. Gunduz, M.; Abu-Hijleh, A. Assessment of Human Productivity Drivers for Construction Labor through Importance Rating and Risk Mapping. Sustainability 2020, 12, 8614. [Google Scholar] [CrossRef]
  61. Abdelalim, A.M.; Salem, M.; Al- Sabah, R.; Said, S.O.; ElShafei, H.M.; Galal Badawy, M. Optimizing Claim Management Process Groups to Enhance Construction Project Success. Int. J. Constr. Manag. 2025, 1–13. Available online: https://www.tandfonline.com/doi/full/10.1080/15623599.2025.2453931 (accessed on 25 August 2025). [CrossRef]
  62. Giri, B.C.; Molla, M.U.; Biswas, P. TOPSIS Method for Neutrosophic Hesitant Fuzzy Multi-Attribute Decision Making. Informatica 2020, 31, 35–63. [Google Scholar] [CrossRef]
  63. Sun, C.; Li, S.; Deng, Y. Determining Weights in Multi-Criteria Decision Making Based on Negation of Probability Distribution under Uncertain Environment. Mathematics 2020, 8, 191. [Google Scholar] [CrossRef]
  64. Bahrami, S.; Yaakob, R.; Azman, A.; Atan, R. An Integrated of Fuzzy Rule Base System and TOPSIS Technique for Multi-Attribute Decision Making. In Proceedings of the 3rd International Conference on Software Engineering and Information Management, New York, NY, USA, 12 January 2020; pp. 58–62. [Google Scholar]
  65. Kelly, D.; Ilozor, B. Performance Outcome Assessment of the Integrated Project Delivery (IPD) Method for Commercial Construction Projects in USA. Int. J. Constr. Manag. 2020, 22, 2808–2816. [Google Scholar] [CrossRef]
  66. Ilozor, B.D.; Kelly, D.J. Building Information Modeling and Integrated Project Delivery in the Commercial Construction Industry: A Conceptual Study. J. Eng. Proj. Prod. Manag. 2012, 2, 23–36. [Google Scholar] [CrossRef]
  67. Samset, K. Early Project Appraisal; Palgrave Macmillan: London, UK, 2010; ISBN 978-1-349-32375-3. [Google Scholar]
  68. Hollberg, A.; Genova, G.; Habert, G. Evaluation of BIM-Based LCA Results for Building Design. Autom. Constr. 2020, 109, 102972. [Google Scholar] [CrossRef]
  69. Lee, J.W.; Cho, K.; Hwang, T.; Han, J.; Kim, T. Process for Integrating Constructability into the Design Phase in High-Rise Concrete Buildings: Focused on Temporary Work. Int. J. Concr. Struct. Mater. 2018, 12, 81. [Google Scholar] [CrossRef]
  70. Al Hattab, M.; Hamzeh, F. Simulating the Dynamics of Social Agents and Information Flows in BIM-Based Design. Autom. Constr. 2018, 92, 1–22. [Google Scholar] [CrossRef]
  71. Pikas, E.; Koskela, L.; Seppänen, O. Design Management in a Design Office: Solving the Problem of Relevance. In Proceedings of the 25th Annual Conference of the International Group for Lean Construction 2017, IGLC 2017, Heraklion, Greece, 9–12 July 2017; pp. 547–554. [Google Scholar]
  72. Al Hattab, M.; Hamzeh, F. A Process-Social Perspective for Understanding Design Information Flow. Lean Constr. J. 2017, 11, 1–11. [Google Scholar]
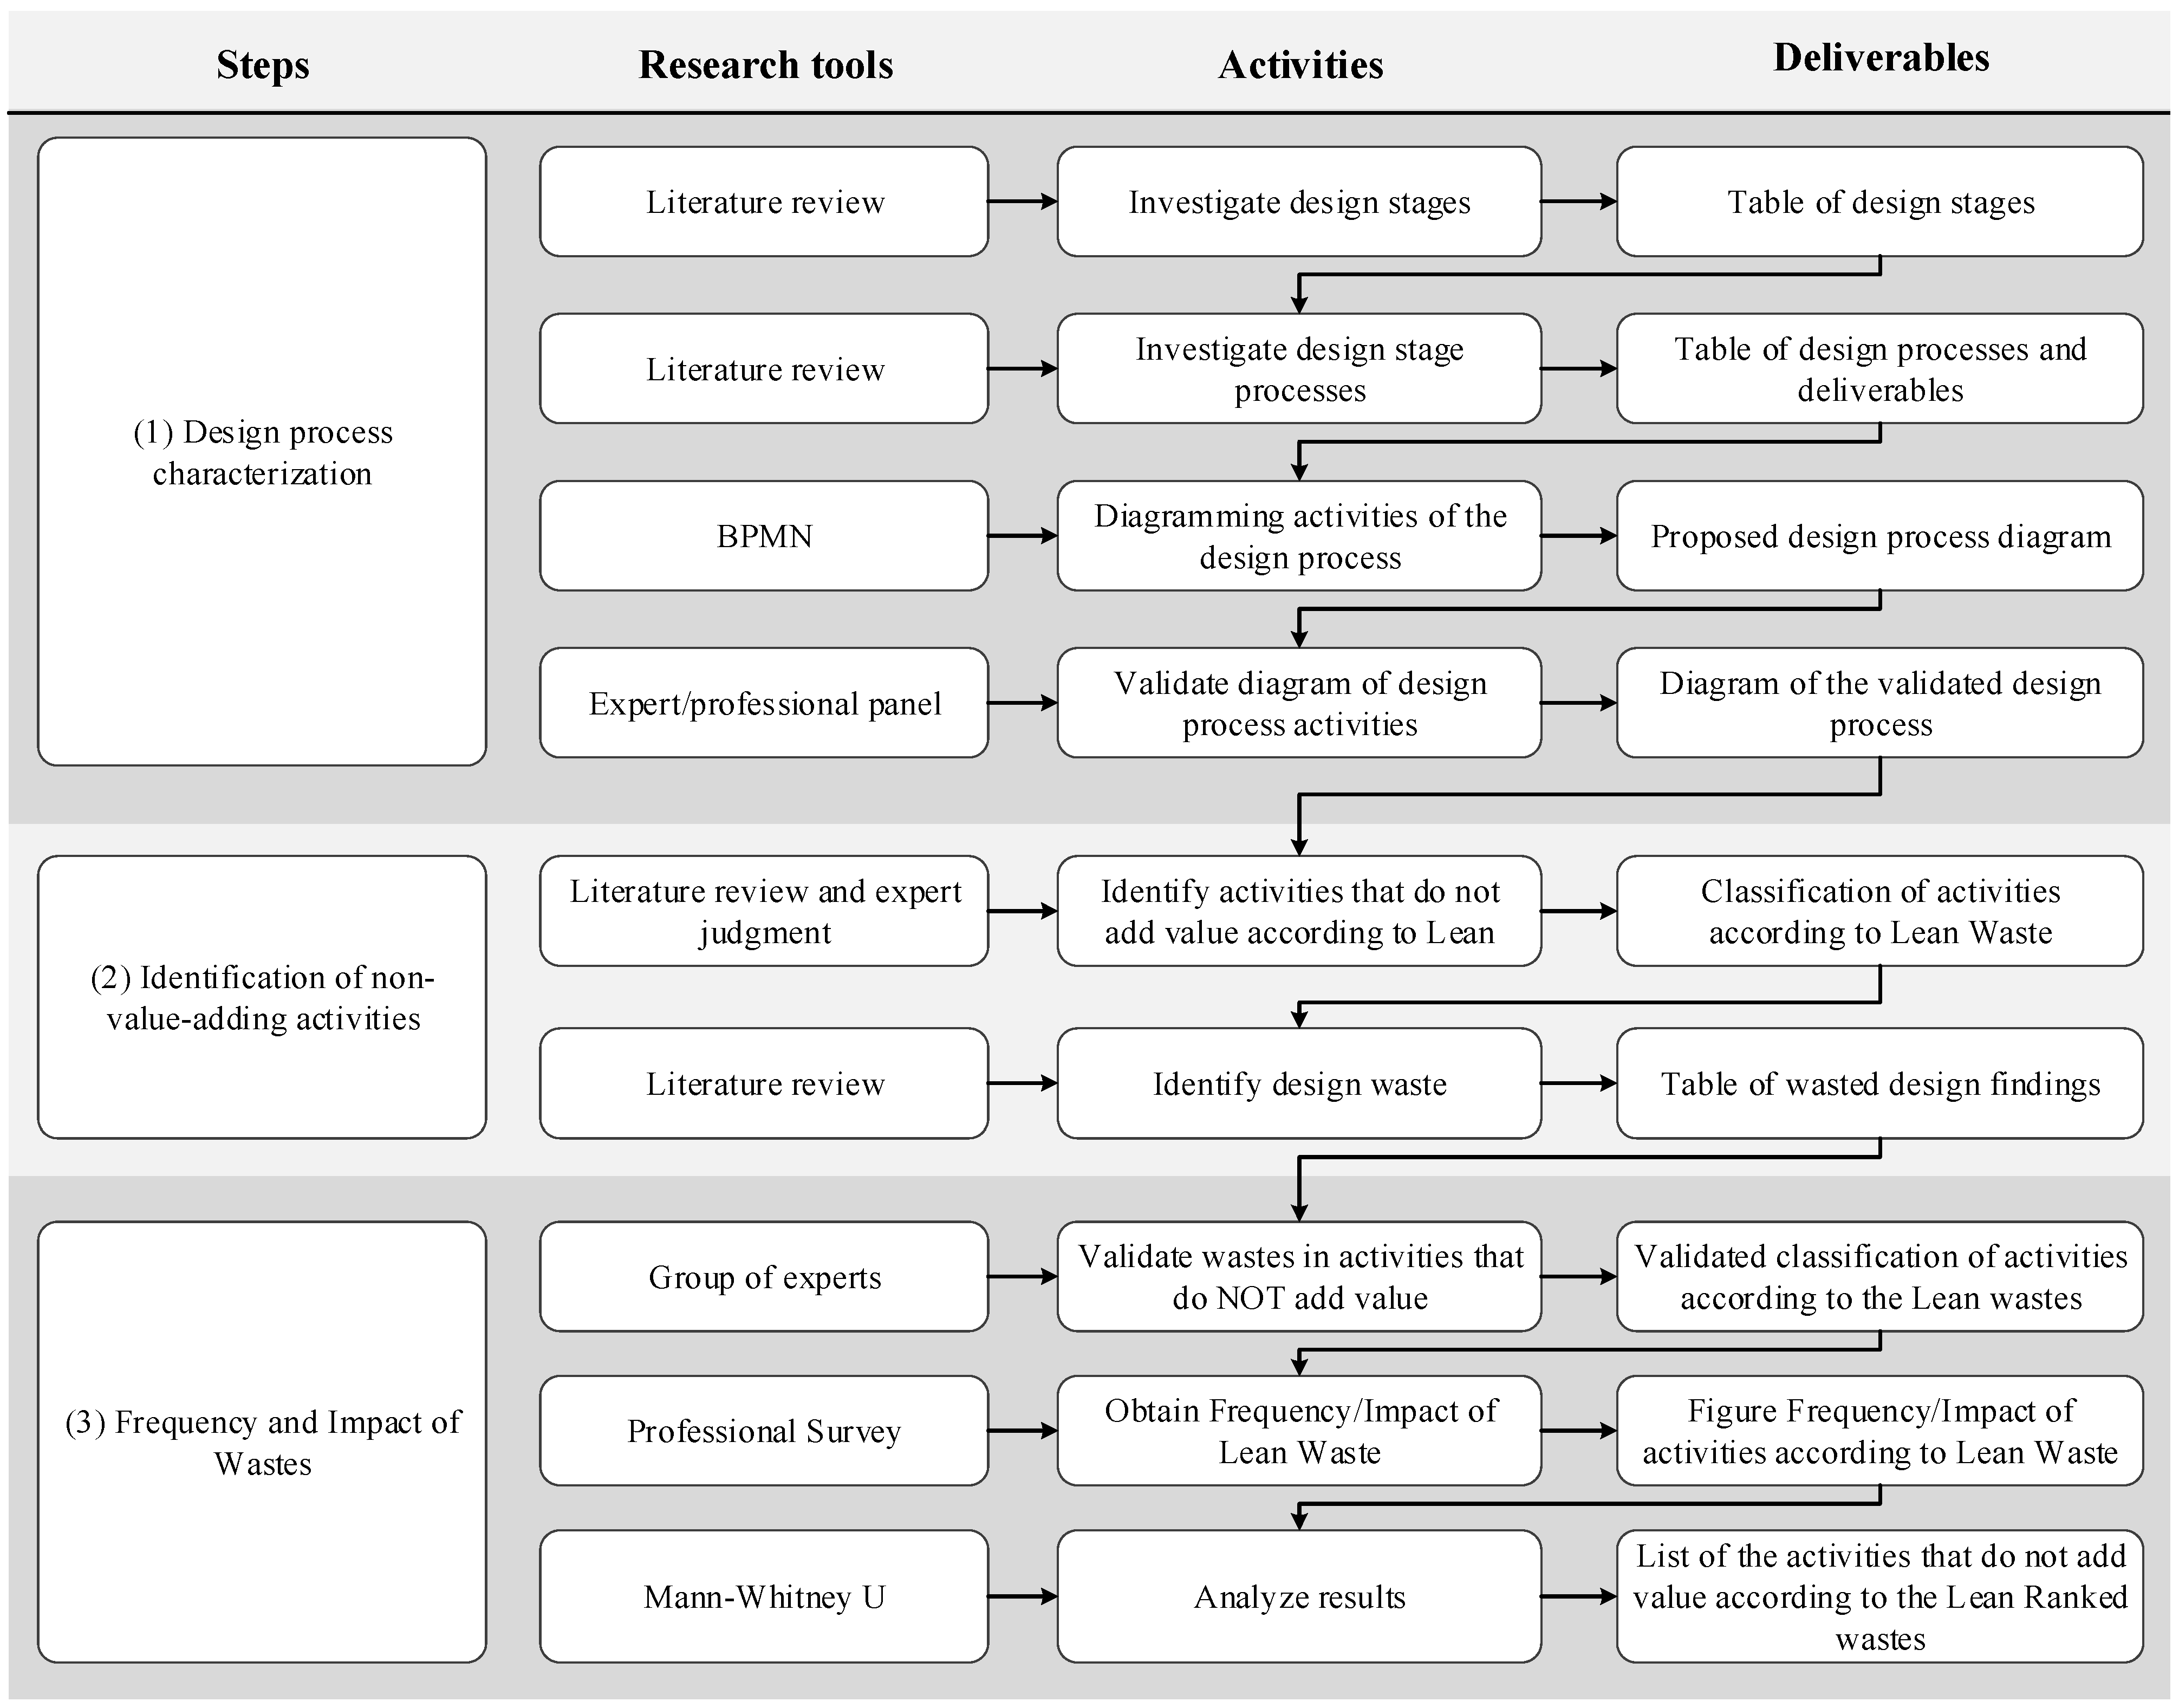
Figure 1. Research method.
Systems 13 00782 g001
Figure 2. Summary of the Literature Review Process.
Systems 13 00782 g002
Figure 3. Workflow Schematic Design.
Systems 13 00782 g003
Figure 4. Workflow Design Development.
Systems 13 00782 g004
Figure 5. Workflow Construction Documentation.
Systems 13 00782 g005
Figure 6. (a) FI Frequency; (b) RII Cost; (c) RII Quality; (d) RII Schedule.
Systems 13 00782 g006
Figure 7. (a) FAII Cost; (b) FAII Schedule; (c) FAII Quality.
Systems 13 00782 g007
Table 1. Taxonomy of Concepts and Definitions.
IdConceptDefinitionReferences
C1Lean design practicesA systematic set of management principles and methods applied to the design process to maximize customer value and minimize waste. It includes reducing variability, synchronizing information flows, standardizing and coordinating dimensions, involving stakeholders early, and continually improving.[16,17,18,19,20]
C2Waste in the design phaseActivity or resource consumption that does not add value to the design product as perceived by the client or user; it usually appears as rework, waiting, overprocessing, unnecessary iterations, or inefficient information transfers.[21,22,23,24,25]
C3Waste management in designA systematic process of identifying, measuring, analyzing, prioritizing, and controlling wastes during the design phase to guide preventive and corrective interventions by stage and performance dimension.[21,26,27,28]
C4Design stages (SD–DD–CD)Sequential building design phases that increase in detail and commitment, each with specific goals and decision points. Schematic Design (SD): defines the project concept, explores options, and coordinates initial ideas. Design Development (DD): refines the concept into coordinated architectural, structural, and MEP systems with specs and code checks. Construction Documents (CD): provides detailed drawings and specs for permitting, procurement, and construction, including dimensions, tolerances, schedules, and notes.[29,30]
C5Performance dimensionsA set of criteria for assessing the impact of design decisions and processes. These criteria include: cost, which refers to resource and budget usage; deadline, related to timing and plan reliability; and quality, assessed by technical adherence and requirement satisfaction.[31,32,33,34,35]
Table 2. Professional panel characterization.
ProfessionRole/PositionYears of Experience (Years)
ArchitectOwner’s Representative>25
ArchitectArchitecture>25
Civil Engineer, PhD.Geotechnical engineering>25
Civil EngineerStructural engineering>5
Civil EngineerMEP engineering>5
Table 3. Experts’ characterization.
Profession, GradePositionYears of Experience (Years)
Civil Engineer, PhDProfessor>25
Civil Engineer, PhDProfessor and Consultant>10
Civil Engineer, PhDBIM manager>5
Civil Engineer, PhDProfessor>5
Civil Engineer, PhDConsultant>5
Table 4. Hypotheses for the Mann–Whitney U Test.
TestHypotheses
1H0 = There are no differences between designers and managers.
H1 = There are differences between designers and managers.
2H0   =   There   are   no   differences   between   B I M / B I M ¯ .
H 1   =   There   are   differences   between   B I M / B I M ¯ .
3H0   =   There   are   no   differences   between   L e a n / L e a n ¯ .
H 1   =   There   are   differences   between   L e a n / L e a n ¯ .
4H0   =   There   are   no   differences   between   BIM     Lean / BIM     L e a n ¯
H 1 = There   are   differences   between   BIM     Lean / BIM     L e a n ¯
5H0   =   There   are   no   differences   between   BIM     Lean / B I M     L e a n ¯
H 1 = There   are   differences   between   BIM     Lean / B I M     L e a n ¯
6H0   =   There   are   no   differences   between   BIM     L e a n ¯ / B I M     L e a n ¯
H 1 = There   are   differences   between   BIM     L e a n ¯ / B I M     L e a n ¯
Table 5. Stages of the design process according to work plans [44].
Work PlansDesign Stage
Riba (UK)Conceptual DesignNot usedDesign DevelopmentTechnical Design
ACE (Europe)Conceptual DesignPreliminary DesignDesign DevelopmentDetailed Design
AIA (USA)Schematic DesingNot usedDesign DevelopmentConstruction Documentation
APM (Global)FeasibilityNot usedConceptual DesignDetailed Design
SpainBasic ProjectNot usedNot usedExecution Project
Natspec (Australia)Conceptual DesignSchematic DesingDesign DevelopmentConstruction Documentation
NZCIC (New Zealand)Conceptual DesignSchematic DesingDesign DevelopmentDetailed Design
RussiaAGR stageP stageBidding PhaseConstruction Documentation
Table 6. Description of the stages of each phase of the design process.
PhasesPhase DescriptionStagesStage Objective
Pre-DesignAll activities that occur from the conception of the construction idea until the decision to invest in the project is made [67]Strategic DefinitionDetermine the best way to meet the client’s needs [44]
Preparation and BriefingDevelop the needs in detail, ensuring all requirements are met to begin the Design phase, determining what, who, and how the construction will be done [44]
DesignThe first step of a construction project can be defined as “the process of deciding the appearance and functionality of the structure.” The design of a project can be entirely new or a combination of ideas to meet the project’s needs [67](SD)Ensure the key elements of the building align with the client’s vision, instructions, and budget. The project begins to take shape, and the main options are evaluated, tested, and selected [58]
(DD)Start the coordination of the different building systems with their architecture, refining system criteria, and beginning to develop project specifications [44]
(CD)Obtain all the necessary design information to manufacture and construct the project, coordinating plans and assessing construction feasibility [44]
Table 7. Classification of Activities by Type of Work.
Type of WorkConsolidated Activities
ProductiveSchematic Design
Design Development
Construction Documentation
Other Specialties
ContributoryCommunication
Control and Supervision
Authorizations
Meetings
Non-contributoryArrangements
Changes
Information Requests
Non-project-related Activities
Table 8. Lean waste found in the design phase, and measures to reduce waste.
CategoryIDWasteDescriptionMeasures to Reduce Lean Wastes
W1Wt1Waiting for resources and informationInability to start activities or processes due to the lack of necessary resources or crucial informationUse the Last Planner System with look-ahead planning to remove constraints before commitments; assign responsibilities and due dates for resources in a shared platform (BIM/Common Data Environment), and track blockers visually
Wt2Delays in starting tasksDelays that occur when starting activities or processesPlan task begins with pull planning based on downstream readiness, defining clear “start/entry” criteria and holding short daily huddles to confirm prerequisites before work starts
Wt3Delays in information deliveryDelays in providing data, documents, or informationCreate an information delivery plan detailing who provides what, to whom, and by when; manage it in a Common Data Environment with alerts and reminders, and escalate delays in meetings
Wt4Work interruptionsUnplanned pauses in tasks and activitiesProtect work with uninterrupted time windows, resolve constraints early (Last Planner), and use an Obeya/Big Room for quick escalation during interruptions
Wt5Inefficient workDelays or interruptions caused by the inefficient execution of tasks or processesEstablish standard work instructions, right-size batch sizes, apply 5S to keep tools, files, and templates ready for use, and coach teams to stabilize cycle times
Wt6Communication problemsDelays or interruptions caused by difficulties in information transmissionDefine communication protocols (who shares what, when, how), use structured forms for info requests and submissions, and maintain a single source of truth to prevent teams from chasing conflicting messages
W2OP1Unnecessary additional processesUnnecessary performance of tasks or processes that do not add real valueRun Value Stream Mapping to remove non-value steps, standardize workflows, and confirm value with the client or users
OP2Unnecessary approval processesReview and authorization procedures that do not add significant value to the outcome of a processSimplify the approval map, delegate low-risk decisions, and use digital workflows with clear service targets so reviews happen once
OP3Unnecessary information exchangeTransmission of data or information that does not add value or is irrelevant to a process or taskShare only essential information by stage via a Common Data Environment instead of email chains; avoid duplicate reports
OP4Overqualified resultsSituations where results or products unnecessarily exceed the requested requirementsUse Target Value Design with stage-appropriate detail levels to meet client and contract requirements without exceeding them
OP5Excessive supervisionExcessive review and control of interdisciplinary processes or internal controlsDefine roles and authorities, use risk-based reviews and checklists, and replace blanket oversight with sampling and specific audits
OP6Clarification of needs in late design stagesIdentification or review of essential project requirements in the advanced stages of its developmentFront-load requirements workshops, early validation, freeze a baseline at the right milestone, and apply formal change management with impact checks
OP7Excessive training timesExaggerated use of resources in training personnel to perform specific tasks or functionsProvide standard work guides and concise, just-in-time training focused on the specific task; use mentoring and reusable resources to avoid repeating sessions
W3D1Errors/omissions in workMistakes, inaccuracies, failures, or omissions in performing tasks or processesUse checklists, peer reviews, BIM clash detection, model validation, and brief quality checks at key points
D2ReworkRepetition of tasks or processes due to errors, lack of quality, or lack of clarity in instructionsPrevent rework with quality at the source (clear inputs, templates, and standards), confirm readiness in Last Planner meetings, and fix root causes using A3 problem solving
D3Changes in designs in the late stagesSignificant modification or review of project plans or designsAlign stakeholders early, explore options with set-based concurrent engineering, and enforce change control with explicit criteria and impact analysis
D4Equipment/infrastructure/software/hardware failuresTechnical problems, malfunctions, or breakdowns in tools, devices, and infrastructure, among others.Standardize toolsets, schedule preventive maintenance and timely updates, keep reliable backups, and provide responsive technical support
W4I1Excess materials/dataUnnecessary accumulation of physical materials or digital information not needed for near-term processingApply just-in-time information flow and small batches; produce only what is needed for the next milestone and avoid premature detailing
I2Storing defective information/documentationPractice of keeping records, data, documents, or files with deficiencies, errors, or quality problemsValidate content before storage using checklists and version control; quarantine or remove obsolete/incorrect files
I3Loss of material/informationDisappearance, degradation, or unintentional elimination of physical materials or digital informationStore work in a centralized platform with permissions, backups, and naming conventions; avoid local ad hoc storage that risks loss
I4Searching for information/dataExaggerated use of resources in obtaining, locating, and retrieving information or dataUse 5S for digital information (standard names, folders, and tags), maintain a shared index or dashboard, and agree on where to find each type of data
W5O1Creation of unused documentationUnnecessary generation of documents, reports, or records that are not used or lack purpose in a process or projectDefine required deliverables with the client and downstream users; generate documents only when tied to a decision or milestone
O2Obtaining duplicate informationUse of resources in acquiring repeated or redundant information or dataAssign data ownership, enter information once and reuse it via integrations, and eliminate re-entry across systems
O3Receiving information requirements prematurelyRequesting or providing information requirements without proper evaluation or prior analysisGate information requests by milestone, verify the need with the requester, and trigger data only when the next process is ready
O4Receiving excessive information requiring classificationOverwhelming flow of data or details that need to be organized, categorized, or classifiedUse standard templates and data schemas, filter inputs to essentials, and automate classification where possible
O5Excessive spaceDisproportionate allocation or use of physical spaceOptimize layouts using lean space planning, consolidate archives, retire low-value materials, and set clear rules for physical and digital storage
W6T1Inefficient use of people’s capabilitiesSituations where individuals’ skills, knowledge, or capabilities are not fully utilized, leading to less benefit for the organizationBuild a skills matrix, match tasks to strengths, remove low-value admin from specialists, and offer purposeful cross-training
T2Unutilized creativitySituations where individuals’ or teams’ creative potential is not fully utilizedRun continuous improvement (Kaizen) workshops, use A3 problem solving to turn ideas into trials, and recognize implemented improvements
T3High demands on unqualified specialistsThe practice of assigning tasks or responsibilities requiring specialized skills or knowledge to individuals lacking the necessary trainingDefine competency requirements, provide targeted training before assignment, pair with mentors, and stage supervision until proficiency is proven
W7Tr1Unnecessary information transfersTransport of data, documents, or communications that are not essentialShare work through a single collaboration platform (links, not file copies), automate system integrations, and remove redundant handoffs
Tr2Impractical communication channelsComplicated, inefficient, or ineffective methods or means of transmitting informationChoose simple, direct channels with visual management (dashboards, boards, Obeya reviews) and standard templates to avoid long, fragmented threads
W8M1Excessive personnel movement outside the workspaceExcessive movement of employees outside the work area to perform tasks or activities related to their jobProvide remote access to models, documents, and approvals; collocate key roles in Big Room/Obeya sessions when physical presence adds value
M2Excessive personnel movement within the workspaceFrequent and inefficient movements of employees within their work environmentRedesign the layout using spaghetti diagrams, apply 5S so tools and information are at the point of use, and enable mobile access to data
Disclaimer/Publisher’s Note: The statements, opinions and data contained in all publications are solely those of the individual author(s) and contributor(s) and not of MDPI and/or the editor(s). MDPI and/or the editor(s) disclaim responsibility for any injury to people or property resulting from any ideas, methods, instructions or products referred to in the content.