Abstract
Exploring the spatiotemporal characteristics and spatial correlation structure of the coupling and coordination relationship between urban economic development and ecological resilience is of great significance for optimizing the regional coordinated development strategies of urban agglomerations and building high-quality economic development regions. Taking 33 counties (cities, districts) in the Qianzhong Urban Agglomeration as the research objects, this study adopts the analytical paradigm of “mechanism exploration—level measurement—relationship evolution—spatial correlation”, expands and constructs a four-dimensional ecological resilience evaluation index system based on the “risk resistance—adaptation—recovery” framework, and systematically analyzes the spatiotemporal dynamics and spatial correlation characteristics of the coupling and coordination between economic development and ecological resilience from 2005 to 2020 by combining the coupling coordination model, trend surface analysis, and spatial gravity model. The research results show that the overall coupling coordination degree between economic development and ecological resilience in the Qianzhong Urban Agglomeration presents an upward trend, and the key to optimizing the coupling coordination lies in improving the level of urban economic development. The spatial correlation of regional coupling coordination degree is increasingly close, and its spatial connection structure shows the characteristics of “core polarization, edge collapse and multi-center germination”. The research results provide important enlightenment for formulating differentiated sustainable development strategies for urban agglomerations in ecologically fragile areas.
1. Introduction
With the growing exacerbation of global warming and the progressive deepening of the sustainable development agenda, the synergistic relationship between the high-quality development of regional economy and ecological resilience has become a critical breakthrough point for resolving the “growth-environment” paradox [1]. As the United Nations’ “2030 Sustainable Development Goals” emphasize, economic growth must be constrained within the thresholds of ecosystem carrying capacity, whereas ecological resilience, as a core capability of systems to withstand disturbances and sustain functionality, underpins the sustainability of regional development [2]. China’s economy is currently at a critical juncture of shifting from high-speed growth to high-quality development, with the coordination of economic development and ecological protection emerging as a core theme in achieving sustainable development goals [3]. As a pilot zone for China’s ecological civilization construction and a key vehicle of the Western Development Strategy, the Guizhou Central Urban Agglomeration is currently situated in a crucial transformative phase between industrialization acceleration and ecological conservation. The proposal of the dual carbon goals in 2020 and the deepened implementation of the National Plan on Main Functional Zones have imposed dual imperatives on this region: achieving intensive economic development while undertaking karst ecosystem restoration [4,5]. Against this backdrop, investigating the coordinated development dynamics between economic growth and ecological resilience in the Guizhou Central Urban Agglomeration carries significant practical implications for guiding regional ecological environment restoration, governance, and high-quality economic development.
Currently, academic research on the relationship between economic development and the ecological environment is relatively mature. Scholars have gradually constructed a systematic theoretical framework and proposed various analytical models to explore the interaction mechanisms between the two. At the theoretical level, Boulding was the first to integrate economic development and environmental protection into a unified analytical framework, putting forward the concept of a “circular economic-environmental system” and emphasizing the importance of a coordinated development model between the economy and the environment [6]. Grossman’s empirical research revealed an “inverted U-shaped” relationship between economic growth and ecological environment quality, namely the Environmental Kuznets Curve (EKC) theory [7]. Subsequent studies, mostly based on the EKC theory, have explored whether the relationship between the two presents an inverted U-shape or other forms from different perspectives. The research methods mainly involve the ecological footprint method, coupling degree model, energy analysis method, grey GM model, and system dynamics (SD) model [8], with research scales covering different regions such as provinces, urban agglomerations, and typical ecological zones.
However, traditional ecological environment assessment cannot depict the adaptive adjustment ability of urban ecosystems in response to risk stress during economic development. In 1973, Holling innovatively introduced the concept of “resilience” into the field of ecology, proposing the concept of “ecological resilience,” which he defined as the ability of an ecosystem to absorb shocks, maintain its functions, and self-reorganize when subjected to disturbances [9]. The subsequent “Adaptive Cycle” model explained the response mechanism of social–ecological systems (SES) to disturbances and the dynamic feedback process of their changes, shifting the research focus from static equilibrium to dynamic adaptation [10]. Based on this, scholars from interdisciplinary backgrounds have integrated ecological resilience with climate change, urban development, and landscape planning, promoting the in-depth development of theoretical research [11]. Colding et al. [12] found that the complementarity of ecological land use helps improve biodiversity and landscape functions, thereby enhancing urban ecological resilience. Folke et al. [13] proposed a social–ecological system (SES) resilience framework, distinguishing between “adaptive” and “transformative” resilience pathways. Ziervogel et al. [14] criticized the applicability of Western resilience theory in non-Western contexts (such as African slums) and proposed a “Community-led Resilience” framework that emphasizes localized practices.
An overview of existing studies reveals that assessments of urban ecological resilience primarily include two approaches: the comprehensive indicator evaluation method based on social statistical data and land use data [15,16], and the ecological footprint method grounded in ecological footprint and carrying capacity frameworks [17,18]. Multidimensional evaluation frameworks have been constructed, including Natural–Economic–Social [19], Resistance–Adaptability–Resilience [20], Pressure–State–Response [21], and Scale–Density–Resilience frameworks [22]. Regarding the spatial patterns of ecological resilience and their influencing factors, scholars have employed models such as the standard deviational ellipse, spatial autocorrelation, geographical detector, and spatiotemporal geographically weighted regression to conduct studies across different scales and time periods [20,23,24]. Some scholars have also employed the P-VAR model, Haken model, and coupling coordination model to explore the interactive response mechanisms, synergistic relationships, and coupling coordination dynamics between ecological resilience and new-type urbanization, economic resilience, and economic development [25,26,27]. Additionally, the hindrance degree model and coordination influence model are employed to analyze the impacts of different indicators or subsystems on the coupling coordination degree [28].
In summary, existing research has provided relatively rich theoretical foundations and methodologies for the coupling study of urban economic development and ecological resilience, yet the following shortcomings persist: Firstly, in previous ecological resilience evaluation frameworks, there has been insufficient construction of evaluation indicator systems from the perspective of the “risk-resistance-adaptation-recovery” joint effects of ecosystems. Secondly, discussions on the coupling coordination relationships between economic development and ecological resilience have only focused on the development changes within regions themselves, overlooking the spatial interdependencies of regional development and lacking analyses of the spatial linkages in their coordinated development. Thirdly, most existing studies have concentrated on developed regions, with less attention paid to research on urban economic development levels and ecological resilience in ecologically fragile less-developed areas.
The Guizhou Central Urban Agglomeration serves as the core economic region of Guizhou Province, playing a pivotal role in propelling regional economic growth, industrial upgrading, and the urbanization process. However, ecological vulnerability serves as a critical factor trapping it in the “development-protection” dual dilemma [29]. Taking the Guizhou Central Urban Agglomeration as the research area, this study aims to analyze the spatiotemporal evolution characteristics and spatial connection structure of the coupling coordination relationship between economic development and ecological resilience in the agglomeration from 2005 to 2020. This analysis is conducted based on the comprehensive levels of regional economic development and ecological resilience, employing the coupling coordination degree model, trend surface method, and spatial gravity model. The study aims to provide empirical insights and theoretical foundation for promoting the benign interactive development between economic growth and ecological resilience in the Qianzhong Urban Agglomeration, as well as for designing high-quality pathways to achieve this coordination.
2. Materials and Methods
2.1. Overview of the Study Area
The Guizhou Central Urban Agglomeration is situated in the central region of Guizhou Province, Located between 105°20′–107°25′ E longitude and 25°22′–27°25′ N latitude (Figure 1). Covering six cities/prefectures including Guiyang City, Zunyi City, Anshun City, Bijie City, Qiandongnan Miao and Dong Autonomous Prefecture, and Qiannan Buyi and Miao Autonomous Prefecture, as well as 33 counties (county-level cities and districts) in Gui’an New Area, the region has a total area of 53,800 square kilometers. It is explicitly identified as one of the 19 national urban agglomerations in China. In 2022, the per capita regional GDP reached 64,800 yuan, approximately 1.24 times the provincial average per capita GDP. Its strategic positioning is to establish a pilot demonstration zone for new-type urbanization with mountainous characteristics and a green ecological livable urban agglomeration. However, geographically, it is situated in the upper reaches of the Yangtze and Pearl Rivers, serving as a critical ecological barrier. Moreover, its unique karst topography results in scarce land resources and a fragile ecological environment. Urban agglomeration construction thus imposes enormous pressure on the region’s ecological resources and environment. Therefore, measuring and analyzing the spatiotemporal evolution characteristics and spatial connection structure of the coupling coordination relationship between urban economic development and ecological resilience in the Guizhou Central Urban Agglomeration can not only furnish new empirical content for research on the coordinated development of regional economy and ecological environment but also offer valuable perspectives for ecological protection and high-quality development in the Guizhou Central Urban Agglomeration.
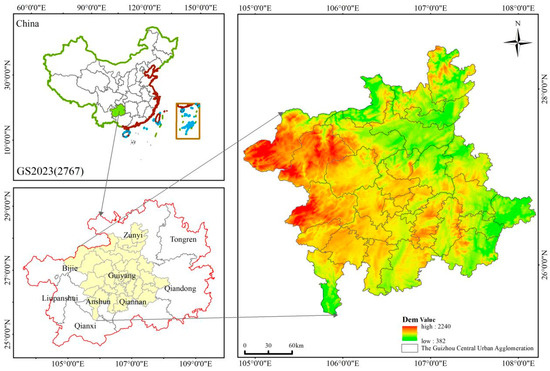
Figure 1.
Study area.
2.2. Data Sources and Preprocessing
This study takes the 33 counties (county-level cities and districts) in the Guizhou Central Urban Agglomeration as research units and uses the period from 2005 to 2020 as the study period. The data employed includes land use data and statistical yearbook data. (1) Land use data: The Guizhou Central Urban Agglomeration with 30 m spatial resolution for 2005, 2010, 2015, and 2020 are all sourced from the Resource and Environment Science Data Center of the Chinese Academy of Sciences (http://www.resdc.cn accessed on 19 June 2025). The data were preprocessed using ArcGIS 10.7 and Frag 4.0. (2) Socioeconomic data. Economic development-related data, including regional GDP, total social retail consumption, and fixed asset investment, are derived from the Guizhou Statistical Yearbook (2005–2020) and the statistical bulletins on national economic and social development of each county (district/city). For missing data, linear interpolation was employed for completion. The study applied a standardization approach to conduct dimensionless processing on all data, normalizing them to the interval [0, 1], with all indicators computed at the county-level scale.
2.3. Research and Framework
Under the strategic guidance of urban green and high-quality development, the optimization and upgrading of the economic system and the enhancement of ecosystem resilience do not exist in isolation. Instead, they form a coupled and interactive relationship through a dynamic mechanism of “support-feedback-collaboration,” ultimately achieving a synergistic and progressive linkage effect (Figure 2).
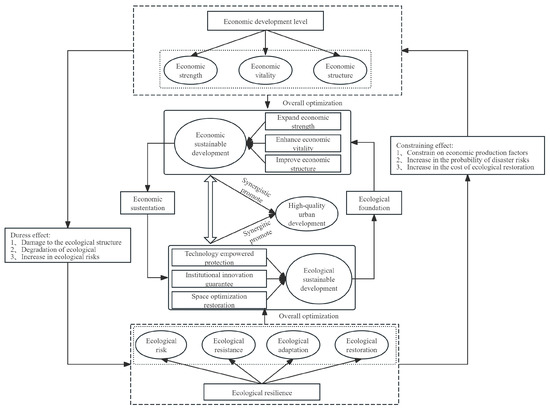
Figure 2.
The coupling mechanism between economic development and ecological resilience.
(1) The Supporting Mechanism of Ecological Resilience for Economic Development
A highly resilient urban ecosystem is the fundamental guarantee for the sustained and stable development of the economy, and its supporting role is reflected in two core dimensions: Risk buffering and stability assurance: By improving the ecosystem structure (such as urban green spaces, wetlands, and shelterbelts), it exerts ecological regulation functions (purifying air, mitigating the heat island effect) and disaster resistance effects (retaining floodwaters during heavy rains, preventing wind and fixing sand). This reduces the direct impact of extreme climates, environmental pollution, and other events on industrial and agricultural production and the operation of infrastructure, minimizes economic losses, and ensures the continuity of production activities [30]. Resource conversion and kinetic energy upgrading: The manifestation of the value of ecological resources (such as the marketization of ecological products and carbon sink trading) promotes the transformation of traditional resource utilization models, forcing economic growth to shift from factor input-driven to innovation-driven. For example, relying on its high-quality ecological background, the Central Guizhou Urban Agglomeration focuses on developing low-environmental-disturbance industries such as eco-tourism, green agriculture, and health and wellness industries, realizing the synergistic effect of ecological protection and economic value-added, which confirms the guiding role of ecological resilience in optimizing the economic structure [31].
(2) The Feedback Mechanism of Economic Development on Ecological Resilience
In the stage of high-quality development, the economic system feeds back into ecological resilience construction through three pathways, forming a positive feedback loop: Financial support pathway: The enhancement of economic strength provides financial guarantees for ecological infrastructure. The government can increase investment in projects such as sewage treatment, mine restoration, and biodiversity protection, thereby improving the ecosystem’s restoration capacity and stress resistance. Technology empowerment pathway: Economic vitality attracts talents and capital to gather in the environmental protection field, promoting the research, development, and application of new energy technologies, pollution control technologies, and ecological monitoring technologies. Technological innovation solves ecological restoration problems (such as soil heavy metal treatment and river ecological purification), providing solutions for enhancing ecosystem resilience. Institutional optimization pathway: The upgrading of industrial structure (such as the decline in the proportion of high-energy-consuming industries and the rise of green industries) gives birth to stricter ecological supervision standards, promotes the improvement of ecological space management and control systems (such as delimiting ecological protection red lines and establishing environmental access systems), curbs ecological damage at the institutional level, and provides rule guarantees for resilience enhancement [32].
(3) Dynamic Balance between Bidirectional Stress and Collaborative Evolution
The coupled relationship between economic development and ecological resilience presents a dialectical unity of “contradiction-collaboration”: Potential risks of bidirectional stress: Economic expansion may damage ecological structure and functions by occupying ecological space and emitting pollutants, leading to a decline in ecological resilience [32,33]. Meanwhile, ecological constraints (such as resource shortages and limited environmental capacity) may restrict the input of production factors (such as restrictions on high-energy-consuming industries) and increase the cost of disaster response, thereby inhibiting economic growth. Breakthrough pathways for collaborative evolution: By building a two-way closed loop of “ecological background supporting the economy and economic development feeding back into the ecology,” the synergistic promotion of ecological sustainability and economic sustainability can be realized. This closed loop breaks through the limitations of single-dimensional development, avoids the vicious cycle of “economic imbalance stressing the ecology” or “ecological fragility restricting the economy,” and ultimately deeply integrates ecological resilience with economic vitality. Its core breakthrough pathways include:
Spatial optimization: Balancing the spatial layout of development and protection by delimiting ecological red lines and constructing ecological corridors.
Technology empowerment: Promoting clean production and circular economy technologies to reduce the ecological disturbance of economic activities.
Institutional innovation: Establishing mechanisms such as ecological compensation and carbon trading to incorporate ecological value into the economic accounting system.
Industrial upgrading: Developing low-carbon industries and green manufacturing to promote the adaptation of economic growth models to ecological protection.
2.4. Methods
2.4.1. Construction of an Indicator System for Economic Development Level
As the connotation of economic development continues to enrich, its evaluation criteria have gradually evolved from initially relying solely on the gross domestic product (GDP) indicator to a comprehensive set of multi-dimensional indicators [34]. Although there are differences in the selection of economic development indicators across different regions, the evaluation system for economic development level is mainly constructed from three dimensions: economic strength, economic vitality, and economic structure (Table 1).
Economic strength mainly reflects the development scale and accumulation level of the regional economy in various dimensions from the perspective of total volume, serving as the foundation and backbone of regional economic development [35]. Indicators included in this dimension are regional GDP, fiscal revenue, and total social fixed-asset investment [36]. Regional GDP directly presents the overall scale of the regional economy; fiscal revenue reflects the government’s ability to regulate the economy and control resources; total social fixed-asset investment indicates the investment intensity of the region in infrastructure, industrial development, and other fields, providing support for economic growth. Additionally, economic growth rate, as an important external manifestation of economic strength, can intuitively show the growth trend of the regional economy within a certain period, offering a key basis for judging the dynamic changes in economic strength.
Economic vitality [37], on the other hand, focuses on reflecting the operational efficiency and development potential of the regional economy in different dimensions from the perspective of per-unit output, and it is an important indicator for measuring the driving force of urban economic development. This dimension includes per capita regional GDP, per capita income of rural residents, per capita disposable income of urban residents, and total retail sales of social consumer goods. Per capita regional GDP reflects the per capita output efficiency of the regional economy and is an important indicator for measuring the average economic level of residents. The per capita income of rural residents and per capita disposable income of urban residents respectively reflect the income status of different groups. The level of income directly affects consumption capacity and economic activity. High economic vitality means that the region has advantages in resource allocation, innovation-driven development, etc., which can inject vitality into sustained economic growth. The total retail sales of social consumer goods show the consumption scale of the regional market and reflect the regional consumption potential.
Economic structure mainly reflects the rationality and coordination of the regional industrial structure, including the proportional relationship between the three industries and the internal composition of each industry. The added value of the primary industry, the added value of the secondary industry, and the added value of the tertiary industry are the core indicators for measuring the economic structure, and their output values can clearly reflect the regional industrial structure [38]. A reasonable economic structure can promote the effective allocation of resources, improve the stability and risk resistance of economic development, and serve as an important guarantee for the high-quality development of the regional economy.

Table 1.
Comprehensive evaluation index system of economic development level.
Table 1.
Comprehensive evaluation index system of economic development level.
| Target Layer | Dimension | Indicator | Units | Weight (%) | Category | Author |
|---|---|---|---|---|---|---|
| Comprehensive Index of Economic Development | Economic Strength | GDP | 108 yuan | 10.53 | + | L. A. Gallo. (2025) [39] |
| Fiscal Revenue | 108 yuan | 10.65 | + | |||
| Total Social Fixed Asset Investment | 108 yuan | 12.21 | + | |||
| Economic Vitality | Per Capita Regional GDP | yuan per capita | 7.49 | + | ||
| Per Capita Income of Rural Residents | yuan per capita | 4.85 | + | Y.-Y. Yu. (2025) [40] | ||
| Per Capita Disposable Income of Urban Residents | yuan per capita | 6.74 | + | |||
| Total Retail Sales of Social Consumer Goods | 108 yuan | 15.19 | + | |||
| Economic Structure | Added Value of Primary Industry | 108 yuan | 8.08 | + | C. Peng, Y. (2025) | |
| Added Value of Secondary Industry | 108 yuan | 10.89 | + | [41] | ||
| Added Value of Tertiary Industry | 108 yuan | 13.37 | + |
2.4.2. Research Status and Innovation Path of Ecological Resilience Evaluation Framework
The academic community has developed a multi-perspective research system for ecological resilience evaluation frameworks, which can be summarized into four core categories: the perspective of core resilience capabilities, the perspective of system interaction relationships, the perspective of urban spatial characteristics, and the perspective of ecological footprint. There are significant differences in the core logic, advantages, and disadvantages of different frameworks (Table 2), and their common problems are concentrated in two aspects.
Table 2.
Comparison table of main ecological resilience evaluation frameworks.
Existing frameworks show obvious differences in their emphasis on the core connotations of “resilience” (such as key capabilities like resistance, adaptation, and recovery), resulting in a lack of unified standards and comparability in evaluation results. For example, some frameworks emphasize the “resistance” of the system, while others focus on “recovery capacity”. A consensus definition of the full-cycle process of resilience has not yet been formed.
From a methodological perspective, although the resistance–response–innovation framework can capture the dynamic characteristics of resilience, the selection of indicators is susceptible to subjective factors; although the ecological footprint method can reflect the carrying capacity of the system through threshold judgment, it is difficult to describe the active adaptation and recovery process of the ecosystem when facing disturbances. In addition, mainstream frameworks (such as the PSR model and the natural–economic–social composite system framework) mostly stay at the level of “state description” or “system interaction analysis”, and the definition of the core “dynamic ability to respond to disturbances” of ecological resilience is vague, leading to a disconnection between indicators and the essential connotation of resilience.
To address the existing shortcomings, this study introduces the “ecological risk” dimension based on the “resistance-adaptation-recovery” framework, and constructs a four-dimensional evaluation framework of “risk (disturbance identification)—resistance (disturbance tolerance)—adaptation (system adjustment)—recovery (function restoration)”. Its core advantages are as follows: It covers the entire process from the occurrence of disturbances to the restoration of system functions through the four-dimensional chain, transforming “resilience” from an abstract concept into an operable indicator system, and solving the problem of disconnection between indicators and the essential connotation of resilience. It not only retains the theoretical core of dynamic capability evaluation but also strengthens the focus on the source of disturbances through the “risk identification” link, improving the practical adaptability of the framework. Focusing on the continuous actions of “resistance-adaptation-recovery” makes up for the deficiency of traditional frameworks in depicting the “dynamic response process” and more accurately reflects the real resilience level of ecosystems in responding to disturbances.
2.4.3. Construction of Ecological Resilience Index
This study fully considers the combined “risk-resistance-adaptation-recovery” effect of ecosystems and constructs a comprehensive evaluation system for ecological resilience of the Central Guizhou Urban Agglomeration from four dimensions: ecological risk, ecological resistance, ecological adaptation, and ecological recovery (Table 3).
Table 3.
Index system of ecological resilience.
- Ecological Risk Index
The ecological risk index is used to characterize the degree to which urban ecosystems are subjected to external risk stressors. In the process of urban development, the structure and function of ecosystems will adjust accordingly with changes in land use patterns, which to a certain extent increases the types of sources of ecological risks, as well as their occurrence probability and intensity. From the perspective of landscape ecology, based on the “source-sink” theory, different landscape types in the study area can be divided into two categories: “source” and “sink”. Among them, woodlands and grasslands, as main ecological land, can hinder the development process of ecological risks, and their distribution area and spatial structure will affect the blocking effect on ecological risk processes to varying degrees; while for construction land, as an agglomeration area of social and economic activities, the frequent and high-intensity social production activities in this area often greatly promote the development of ecological risk processes and increase the occurrence frequency of ecosystem risks [52]. The formula is as follows:
ERI denotes the Ecological Risk Index; Ai represents the area of the i-th land use type; A signifies the total land area; n is the number of land use types; ERi represents the risk intensity index of land use type i. The ecological risk weights for various land use types are determined based on existing academic research, with specific values as follows: cultivated land (0.32), forest land (0.12), grassland (0.16), water area (0.53), construction land (0.85), and unused land (0.82). A smaller ERi value means a lower degree of external risk stress on the urban ecosystem.
- 2.
- Ecological Resistance Index
The ecological resistance index reflects the ability of urban ecosystems to resist external risk stressors and provide services to the outside world, which can be evaluated through ecosystem service value. A higher ecosystem service value means that the ecosystem has stronger service capabilities and more prominent ability to resist and adapt to external disturbances. The calculation of ecosystem service value is based on Costanza et al. [53] ecosystem service value evaluation model, while referring to the value of main service categories obtained by Xie et al. [54] through research on different dominant land use/land cover (LULC) types in China, including supply services, support services, regulatory services, and cultural services. In addition, based on the research results of Lin et al. [55], the per unit area ecological service value of various land types in the study area was obtained (see Table 4 for details). The specific calculation formula for the ecosystem service value of the Central Guizhou Urban Agglomeration is as follows:
Table 4.
Table of ecosystem service value coefficients of the urban agglomeration in Central Guizhou (yuan/hm2).
In the formula, ESV represents the Ecological Resistance Index; Ai denotes the area of the i-th land type in the study area; VCi signifies the ecosystem service value coefficient per unit area of land type i.
- 3.
- Ecological Adaptation Index
The ecological adaptation index reflects the ability of urban ecosystems to maintain stability through self-adjustment when facing risk stressors. Some scholars have proposed that spatial patterns are important influencing factors in ecosystem process management at the landscape scale, and the stability of ecosystems is determined by landscape patterns related to spatial heterogeneity and landscape connectivity. Therefore, from the perspective of landscape pattern, landscape heterogeneity and connectivity can be used to characterize the adaptability of ecosystems. Among them, landscape heterogeneity is represented by the area-weighted average patch fractal dimension and the Shannon diversity index, and landscape connectivity is reflected by landscape fragmentation. The calculation formula is as follows:
In the formula, EA represents the Ecological Adaptation Index; SHDI denotes the Shannon Diversity Index; AWMPFD signifies the Area-weighted Mean Patch Fractal Dimension, and FI stands for the Landscape Fragmentation Index.
- 4.
- Ecological Restoration Index
The ecological recovery index reflects the ability of urban ecosystems to recover or adjust their structure and behavior patterns to the original state after being impacted by external disturbances. Since the recovery capacity of ecosystems is difficult to measure directly, and land use has a significant impact on ecosystem resilience, different resistance coefficients and recovery coefficients can be assigned to different land use types to measure their ability to resist external disturbances and their contribution to the recovery of ecosystems to their original state. The calculation formula of this index refers to the ecological resilience model and coefficients proposed by Peng et al. [56]. assigning different ecological resistance coefficients (Cresistance) and elasticity coefficients (Crestore) to different land use types (Table 5). The formula is:
Table 5.
Resistance coefficients and elasticity coefficients of different land use types.
In this equation, ERC represents the ecological restoration index. Ai denotes the area proportion of the i-th land use type within the region. Cresistance,i and Crestore,i signify the resistance coefficient and elasticity coefficient of the i-th land use type, respectively.
2.4.4. Entropy Weight Method and Comprehensive Evaluation Method
This study adopts a comprehensive evaluation system with multiple indicators and dimensions. As an objective weighting method, the entropy method determines indicator weights based on the degree of data dispersion, which can effectively avoid deviations caused by subjective weighting. This method has advantages such as strong objectivity, high adaptability, and simple calculation, and is particularly suitable for comprehensive evaluation problems involving multiple indicators and dimensions. However, the entropy method also has limitations, such as high dependence on data quality. To avoid the possible impact of differences in units and dimensions between different indicators on the results, this study standardized each indicator after systematically sorting out the data, further ensuring the scientificity and reliability of the evaluation results. The study uses the entropy method to evaluate the economic development and ecological resilience of the Central Guizhou Urban Agglomeration, with specific steps as follows.
Among them, Formula (5) is used for the standardization of positive indicators, while Formula (6) is applicable to the standardization of negative indicators. Here, xij represents the original value of the indicator data, uij denotes the j-th indicator of the i-th subsystem, and xmax and xmin correspond to the maximum and minimum values of the j-th indicator, respectively.
Calculate the indicator weights according to the definition of the entropy weight method:
where fij can be calculated as:
and calculate the information utility of the indicators:
Indicator weight calculation:
xij represents the original data of the j-th indicator in the i-th city, and n is the sample size. The information utility d is the difference between 1 and the information entropy e of each indicator and each dimension of indicators. A larger d value indicates that the individual indicator has a more significant impact on the comprehensive indicator, and its value directly affects the weight. wj denotes the weight of the j-th indicator. The weights of each indicator for economic development and ecological resilience are shown in Table 1 and Table 2.
Comprehensive Evaluation Method:
ui represents the comprehensive evaluation score of each system; Wj is the weight of the j-th indicator; u′ij is the standardized sample value.
2.4.5. Construction of the Coupling Coordination Degree Model
In the context of physics, coupling refers to a phenomenon where two or more systems interact through their own attributes and external effects. To analyze the interaction mechanism and evolution law between the economic development level and ecological resilience of the Central Guizhou Urban Agglomeration, this study introduces the coupling coordination degree model from the field of physics for quantitative analysis. The model construction process is as follows:
In the model, the coupling degree (C) is used to measure the intensity of interaction between the economic development system (U1) and the ecological resilience system (U2), and its calculation formula can be characterized as the degree of correlation between the elements of the two systems. The value range of C is [0,1]: when C is closer to 1, it indicates that the interaction between the two systems is more significant (such as the stronger disturbance intensity of economic activities on the ecosystem or the stronger constraint effect of the ecological state on economic development); when C is closer to 0, it means that the mutual influence between the systems is weaker. The coordination index (T) reflects the overall development level and comprehensive benefits of the two systems, and its calculation integrates the comprehensive contributions of the economic development index (U1) and the ecological resilience index (U2). A higher T value indicates a better overall development quality of the two systems (such as a more significant synergistic effect between economic growth and ecological protection); a lower T value reflects a lower overall development level. In this study, the weights (a, b) of the economic development index (U1) and the ecological resilience index (U2) are both set to 0.5, assuming that they are equally important in the overall development evaluation. It should be noted that the coupling degree can only measure the degree of mutual influence between system elements, but cannot objectively reflect the level of comprehensive coordinated development between elements; while the coupling coordination degree (D), as an indicator to measure the degree of harmony and consistency between systems or internal elements of a system, can intuitively reflect the quality of coordination through quantifying the coupling coordination level. In this study, a higher D value indicates a high-level mutually promoting relationship between regional economic development and ecological resilience; a lower D value means that the synergy between the two systems is weak, or even there is mutual restriction.
It is worth noting that the coupling coordination degree model is only used to judge the coupling coordination level between economic development and ecological resilience, and cannot directly determine the relative development status of the two. Therefore, this study combines the coupling coordination grade classification standards in the existing literature, and classifies the types according to the value of coupling coordination degree (D) and the relative size of the two system indices (U1, U2): when D is in the unbalanced type, if U1 > U2, it indicates that the development of ecological resilience is hindered; if U1 < U2, it means that the economic development process is restricted. When D is in the coordinated type, if U1 > U2, it shows that the development of ecological resilience is relatively lagging; if U1 < U2, it indicates that the economic development speed is relatively slow. The specific type classification scheme and corresponding value ranges are shown in Table 6.
Table 6.
Classification of evaluation levels of coupling coordination degree.
2.4.6. Trend Surface Analysis
The trend surface method reflects the systematic spatial variations of data by using mathematical fitting to simulate spatial surfaces, so as to analyze and describe the overall trends in geographic or spatial data [39]. This study employs the trend surface method to analyze the characteristics of spatial trend variation in the coupling coordination degree between economic development and ecological resilience within the Guizhou Central Urban Agglomeration.
2.4.7. Spatial Interaction Gravity Model
The Gravity Model is commonly used to measure the potential intensity of spatial interactions between regions [57]. In this study, the model is applied to quantify the spatial interaction potential of the coupled and coordinated development relationship between economic development and ecological resilience among counties in the Central Guizhou Urban Agglomeration. Furthermore, it aims to analyze the intensity and directionality of their spatial connections, so as to identify the core growth poles of the coupled and coordinated development of the regional composite system. It should be clearly stated that the application of this model is based on the following core assumptions: The intensity of spatial interaction between counties is mainly affected by their own coupled coordination degree (representing “quality”) and geographical distance (representing “frictional resistance”), and follows the distance decay law (usually the inverse square law). The specific form of the model is as follows:
In the formula [58,59], Rij is the gravitational value of the coupling coordination degree between county i and county j, which represents the theoretical potential for spatial interaction between the two counties in terms of the coordination level of economic development and ecological resilience. A larger Rij value theoretically indicates a stronger potential for spatial interaction between the two counties. Ti and Tj are, respectively, the coupling coordination degrees of economic development and ecological resilience of county i and county j, serving as the core parameters representing the “quality” of counties in the model. Dij refers to the Euclidean distance between geometric centers, acting as a proxy variable for spatial resistance; K is the gravitational constant, usually set to 1, aiming to eliminate the influence of dimensions and focus on comparing the relative intensity between various connection pairs. Ri represents the overall connection potential of county i in the regional coupling coordination network and is a key indicator for identifying core growth poles (a larger Ri value indicates a stronger radiation or agglomeration potential of the county as a growth pole). It should be emphasized that the connection intensities (Rij and Ri) calculated by the gravity model reflect the theoretical potential of spatial interaction based on specific variables (coupling coordination degree T and distance D), rather than the realized and specific cooperative relationships. A stronger theoretical connection potential (Rij) does not necessarily equate to the actual level of regional collaboration in reality.
3. Results
3.1. Temporal–Spatial Evolution Characteristics of Comprehensive Economic Development Level in the Guizhou Central Urban Agglomeration
In this study, with the help of ArcGIS 10.8 software, the Jenks Natural Breaks method was used to classify the comprehensive economic development indices of county-level units in the Central Guizhou Urban Agglomeration in 2005, 2010, 2015, and 2020, which were sequentially defined as the low-level area, relatively low-level area, medium-level area, relatively high-level area, and high-level area (Figure 3).
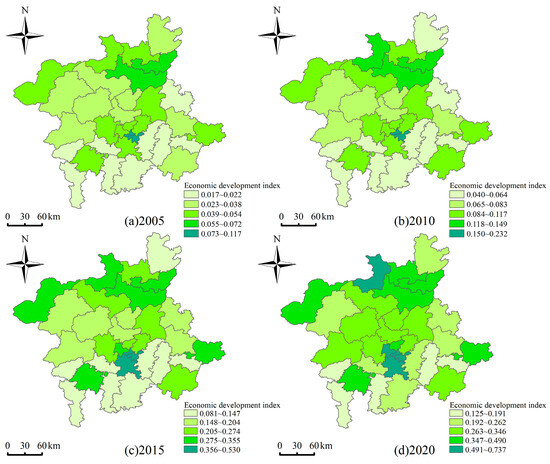
Figure 3.
Spatial distribution of the economic development level of the urban agglomeration in Central Guizhou from 2005 to 2020.
From 2005 to 2020, the economic development level of the Central Guizhou Urban Agglomeration showed a significant improvement. The average values of the comprehensive economic development index were 0.041, 0.092, 0.235, and 0.345 in sequence, showing an overall stepped growth trend. Among them, the period from 2010 to 2015 was the stage with the fastest growth rate, with the comprehensive index increasing by 155%. This growth trend is closely related to policy drivers. It is mainly because in 2012, the National Development and Reform Commission of China officially approved the Development Plan for the Central Guizhou Economic Zone, clearly designating the Central Guizhou Economic Zone as a key area in the new round of China’s western development. The institutional legitimacy endowed by the top-level design and the inclination of supporting policy resources (such as financial support, industrial project layout, etc.) have injected strong impetus into the regional economy. Although showing an overall growth trend, the absolute value of the economic development level in the study area is still in a relatively low range, reflecting the development characteristics of the Central Guizhou Urban Agglomeration as an urban agglomeration in the cultivation stage, and the current situation of a relatively weak economic foundation has not fundamentally changed [60].
In addition, there are obvious differences in the regional economic development level. The high-level and relatively high-level areas of economic development show a high degree of agglomeration, mainly distributed in the main urban areas of Guiyang (such as Nanming District, Yunyan District), the main urban areas of Zunyi (Honghuagang District, Huichuan District), and Kaili City and other central cities, forming obvious regional development cores. This spatial pattern reveals the hierarchical characteristics of economic development in the Central Guizhou Urban Agglomeration. Areas with high administrative levels (such as municipal districts of prefecture-level cities), relying on advantages such as the agglomeration of administrative resources and improved infrastructure, have a significantly higher comprehensive level of economic development than the surrounding counties. Counties at low and relatively low levels are mainly distributed on the edge of the study area. Due to geographical isolation leading to the outflow of factors and the difficulty in breaking through the path dependence of the traditional agriculture-dominated model, the marginal counties lag behind, showing a spatial locking effect.
3.2. Spatiotemporal Evolution Characteristics of the Comprehensive Level of Ecological Resilience in Guizhou Central Urban Agglomeration
From 2005 to 2020, the average value of the comprehensive index of ecological resilience in the Central Guizhou Urban Agglomeration remained stable, being 0.522, 0.524, 0.524, and 0.523 in sequence, showing an overall trend of stabilization amid fluctuations. From the perspective of the evolution of indicators in various dimensions (Table 7), the dynamic balance of ecological resilience is mainly affected by the following factors: the ecological resistance index and the ecological adaptation index have become the core driving forces for resilience improvement. From 2005 to 2020, the ecological resistance index increased by 1.33%, reflecting a slight enhancement in the basic ability of the ecosystem to resist external disturbances; the ecological adaptation index increased by 5.58%, indicating that the flexibility of the system to respond to long-term changes through self-regulation has improved, which is closely related to the implementation of regional ecological protection policies (such as the delineation of ecological red lines and the improvement of resource utilization efficiency). The ecological risk index and ecological recovery index continued to decline, with decreases of 8.29% and 6.23%, respectively, over the 15 years. This change reveals two major problems: first, the external risk pressure faced by the ecosystem is constantly increasing; second, the self-repair ability of the system after damage is weakened, the degree of ecosystem discretization is improved, and the response sensitivity to disturbances is enhanced. The main reason is that in the process of rapid urbanization of the Central Guizhou Urban Agglomeration, the intensity of human activities has continued to increase, and a large amount of ecological land such as forest land and grassland has been converted into construction land, resulting in damage to the integrity and connectivity of the ecosystem.
Table 7.
Average values and change rates of various indicators of ecological resilience in the urban agglomeration in Central Guizhou from 2005 to 2020.
In terms of spatial distribution (Figure 4), areas with high ecological resilience are concentrated in the ecological barrier zone in the northwest (such as Qixingguan District, Dafang County, and Jinsha County). Located in the protected area of the Chishui River water ecological corridor, these areas rely on high forest coverage and low development intensity, with comprehensive values stably above 0.600. This region is widely distributed with karst landforms, and its ecological background is fragile. It still faces potential threats such as soil erosion, deterioration of mine geological environment, and water ecological security, so the stability of the high resilience state is weak. Areas with weak, low ecological resilience are centered on the central urban area of Guiyang (Yunyan District, Nanming District, Guanshanhu District). Strongly affected by economic development and urbanization expansion, the land use pattern has changed drastically (such as construction land encroaching on ecological land), and the comprehensive value of ecological resilience is generally lower than 0.450. This indicates that the spatial mismatch between ecological pressure caused by urbanization and restoration input may be the key driver of the spatial differentiation of ecological resilience. The counties in the transition zone (such as Qingzhen and Kaiyang), with the help of ecological restoration projects and industrial transformation, have seen their resilience values rise from 0.679 and 0.522 in 2005 to 0.706 and 0.559 in 2020, respectively, forming a secondary center of resilience improvement in the “northwest-southeast” gradient differentiation.
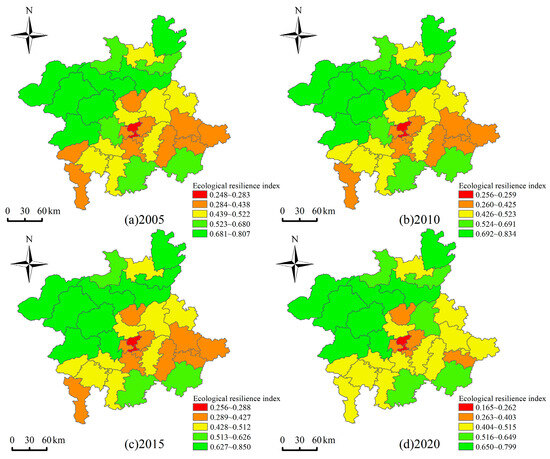
Figure 4.
Spatial distribution of the ecological resilience level of the urban agglomeration in Central Guizhou from 2005 to 2020.
3.3. Analysis of Coupling and Coordination Between Economic Development and Ecological Resilience in Guizhou Central Urban Agglomeration
3.3.1. Characteristics of Time-Series Changes in the Coupling and Coordination Degree Between Economic Development and Ecological Resilience
Overall, from 2005 to 2020, the average value of the coupling and coordination degree between economic development and ecological resilience in Guizhou Central Urban Agglomeration increased from 0.362 to 0.666, representing an 83.97% growth. This significant change indicates that the synergy between regional ecological protection and economic development has been gradually enhanced. As shown in Figure 5, in 2005, the coupling and coordination degree of each county-level region in Guizhou Central Urban Agglomeration fell within the interval of [0.239, 0.505], representing stages of moderate disharmony and marginal coordination. Notably, since 2005, Majiang County has consistently recorded the lowest coupling and coordination degree, primarily because its comprehensive economic development index has remained the lowest, with its economic development lagging behind urban ecological resilience. In 2010, the range of coupling and coordination degree in Guizhou Central Urban Agglomeration expanded to [0.340, 0.619], with the coupling and coordination degree of each county-level region showing an improvement. Among them, Zhenning County, Changshun County, and Majiang County showed the most significant increases, with coupling and coordination degrees of 0.371, 0.371, and 0.34, respectively, entering the mild disharmony category. In 2015, the coupling and coordination degree in Guizhou Central Urban Agglomeration ranged from [0.417, 0.782], generally spanning the stages from on the verge of disharmony to moderate coordination. Honghuagang District and Bozhou District have consistently maintained the highest coupling and coordination degrees from 2005 to the present by virtue of their high levels of economic development and ecological resilience. In 2020, among all county-level regions in Guizhou Central Urban Agglomeration, only the coupling and coordination degree between economic development and ecological resilience in Yunyan District of Guiyang City experienced a decline, dropping from 0.554 to 0.309, a decrease of 44.42%. In contrast, the coupling and coordination levels of other regions improved to varying degrees. Qixingguan District, Renhuai City, Bozhou District, and Honghuagang District further upgraded their coupling and coordination types between economic development and ecological resilience from moderate coordination to good coordination.
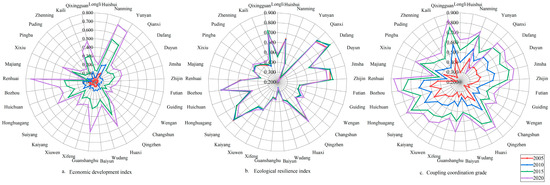
Figure 5.
Radar chart of the comprehensive results of the coupling and coordination between economic development and ecological resilience from 2005 to 2020.
During the study period, the coupling and coordination relationship between economic development and ecological resilience in the Central Guizhou Urban Agglomeration continuously strengthened with the improvement of economic level, and the “economy-ecology” system remained in a benign interaction range. The formation of this trend lies in the strategic orientation of “ecological protection first” and the virtuous cycle of “economic feedback to ecology” in regional development.
In terms of policies, the proposal of the “ecological province-building” strategy in 2006 established the core position of ecological protection in regional development. The promulgation of the Regulations on Promoting Ecological Civilization Construction in Guizhou Province in 2014 further set an ecological bottom line for economic activities through rigid constraints such as the delimitation of ecological protection red lines, cross-regional ecological compensation mechanisms, and accountability systems. The implementation of a series of special actions (such as the comprehensive rocky desertification control project, which has treated a total area of over 12,000 square kilometers, and the conversion of farmland to forests and grasslands covering more than 8 million mu) has effectively buffered the ecological risks caused by changes in land use patterns during urban expansion (e.g., the proportion of construction land increased from 3.2% in 2005 to 6.8% in 2020), keeping the ecological resilience index stable in the medium-to-high range.
In terms of economic support, the benefits of economic development have continuously covered the costs of ecological protection. From 2005 to 2020, the GDP of the Central Guizhou Urban Agglomeration grew at an average annual rate of 11.3%, with the total economic output increasing nearly 8 times, providing a solid financial guarantee for ecological governance and promoting the upgrading of pollution control technologies. This positive cycle of “ecological protection laying the foundation—economic development empowering—ecological resilience enhancing” has become the key driving force for the continuous rise in the coupling coordination degree.
3.3.2. Spatial Evolution Characteristics of Coupling and Coordination Degree Between Economic Development and Ecological Resilience
Spatially (Figure 6), from 2005 to 2020, the coupling and coordination degree between economic development and ecological resilience in Guizhou Central Urban Agglomeration exhibited spatial heterogeneity, presenting a northwest-high and southeast-low spatial pattern similar to the level of ecological resilience. This is linked to the ecological endowments and economic development paths of each county (city, district) [61]. In the northwestern region, counties (cities, districts) such as Dafang County, Jinsha County, and Qianxi County have developed eco-tourism economies relying on high forest coverage. With the manifestation of eco-economic effects, a “dual-excellence corridor of ecology-economy” was formed in 2020, and the coupling and coordination degree between economic development and ecological resilience in these areas entered the moderate coordination stage. Renhuai City, Qixingguan District, and the central urban area of Zunyi City, with their advanced economic and social development, have prioritized regional ecological environment protection and restoration, thereby maintaining consistently high levels of ecological resilience. As a result, their overall coupling and coordination degrees have led among county (city, district) levels during the same period. The central region mainly includes the main urban districts of Guiyang City and its adjacent counties (districts). As the provincial capital and regional economic development center of Guizhou Province, the overall natural resilience of its ecological system is relatively low. With the rapid regional economic development and the increase in population base, the expansion of construction land in the core area has led to fragmentation of ecological space, while the increase in industrial and domestic sewage discharge has generally increased the pressure on the ecological environment, causing a decline in ecological resilience and a slowdown in the growth rate of coupling and coordination degree. From 2015 to 2020, the coupling and coordination degree growth rates in Nanming District and Baiyun District of Guiyang City were 5.06% and 2.75%, respectively, falling below the average growth rate of 9.66%. In Yunyan District, due to the risk stress from urban economic development exceeding the carrying capacity of urban ecological resilience, the coupling and coordination degree experienced a 44.22% decline, regressing from the marginal coordination category to mild disharmony.
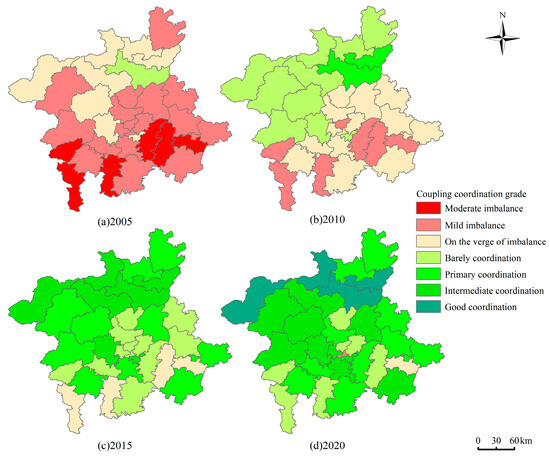
Figure 6.
Spatial distribution characteristics of the coupling and coordination between economic development and ecological resilience in the urban agglomeration in Central Guizhou.
To further analyze the spatial trend changes in the coupling and coordination degree between economic development and ecological resilience in Guizhou Central Urban Agglomeration, ArcGIS 10.5 was employed to map the spatial trend change diagrams of the coupling and coordination degree in 2005, 2010, 2015, and 2020 (Figure 7). During the study period, the spatial trends in the coupling and coordination degree between economic development and ecological resilience in Guizhou Central Urban Agglomeration generally exhibited a “north-high south-low, west-high east-low” distribution pattern, demonstrating obvious spatial directivity characteristics. Trend line changes differ across directions: the north–south trend lines are steeper, while the east–west ones are relatively gentler, indicating more pronounced differentiation characteristics in the coupling and coordination degree along the north–south direction. From the analysis of different time periods, the differences in coupling and coordination degrees among county-level regions in the east–west and north–south directions exhibited an expanding trend from 2005 to 2015. From 2015 to 2020, the differences in coupling degree changes among county-level regions in the north–south and east–west directions decreased. This is attributed to the implementation of the Guizhou Central Urban Agglomeration development strategy, where the central urban areas of Guiyang City and Zunyi City, along with developed urban districts, exerted radiation and driving effects on the economic development of their neighboring counties. This thereby promoted the improvement in the coupling and coordination degree between economic development and ecological resilience in southern and eastern regions.
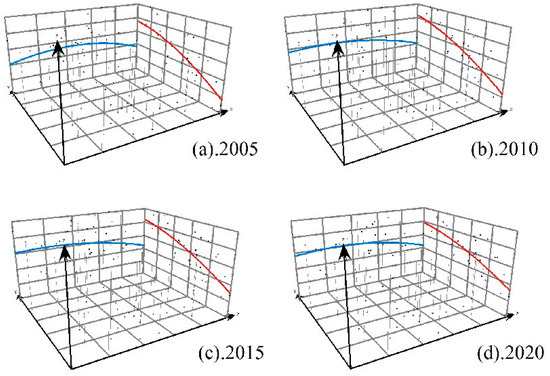
Figure 7.
Changes in the trend surface of the coupling and coordination degree between economic development and ecological resilience in the urban agglomeration in Central Guizhou from 2005 to 2020. The X-axis points due east, and the Y-axis points due north. The red curve represents the fitting line of the coupling coordination degree’s variation in the east-west direction, while the blue curve denotes the fitting line of its variation in the north-south direction.
3.3.3. Coupling and Coordination Type Transition Characteristics of Economic Development and Ecological Resilience in Guizhou Central Urban Agglomeration
From the perspective of changes in coupling and coordination types between economic development and ecological resilience (Figure 8), the coupling and coordination types of each county (city, district) in Guizhou Central Urban Agglomeration experienced significant changes during the study period. The key to optimizing the coupling and coordination between economic development and ecological resilience lies in improving the level of urban economic development. The distribution and change characteristics of coupling and coordination types in each county (city, district) remain consistent with the above-mentioned “northwest-high, southeast-low” spatial distribution pattern:
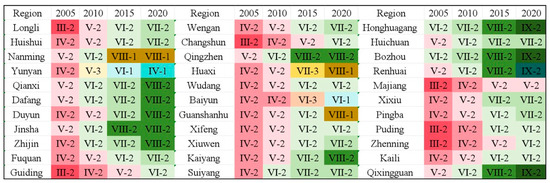
Figure 8.
Types of coupling and coordination between the ecological resilience and the level of economic development of each city in the urban agglomeration in Central Guizhou from 2005 to 2020.
From 2005 to 2020 in the northwestern region, the coupling and coordination types of Dafang County, Qianxi County, Jinsha County, and Suiyang County transitioned from “imminent disharmony with hindered economic development” and “mild disharmony with hindered economic development” to “moderate coordination with lagging economic development” and “primary coordination with lagging economic development”. From 2005 to 2015, Renhuai City transitioned from “imminent disharmony with hindered economic development” to “moderate coordination with lagging economic development”, during which its economic development index exceeded the ecological resilience index, and the coupling and coordination type upgraded in grade as the economic development index increased. By 2020, its coupling and coordination type shifted to “good coordination with ecological resilience lagging”, primarily due to the further integration of the regional “liquor industry + cultural tourism” model, where the mutually reinforcing effect between the high economic development index and high ecological resilience index achieved holistic coordinated development. However, under the state of high coupling and coordination, it is necessary to guard against the decline in ecological resilience caused by economic development and prevent potential risks of ecological overconsumption.
In the central region of Guizhou, the coupled coordination development phase for Huaxi District, Guanshanhu District, and Nanming District evolved from a mild dysfunctional state with economic development constraints to an intermediately coordinated phase characterized by ecological resilience lag during the 2005–2020 period. This transition primarily stemmed from rapid economic advancement driven by high-tech industrial expansion, which maintained the comprehensive economic development index at an elevated level. Concurrently, accelerated urbanization and large-scale population concentration constrained ecological resilience to a moderate range, resulting in a high–medium collaborative configuration of robust economic growth and intermediate ecological resilience. Wudang District serves as the core ecological protection area in Guizhou and is endowed with abundant natural resources. From 2005 to 2020, its coupling and coordination type transitioned from “mild disharmony with hindered economic development” to “marginal synergy with lagging economic development,” presenting characteristics of high ecological resilience and low economic development level. This indicates that its ecological dividends have not been fully translated into economic value. Baiyun District’s economic development relies on traditional manufacturing industries, with its economic transformation having lagged behind, resulting in both a low comprehensive index of economic development level and a low ecological resilience index. From 2005 to 2020, its coupling and coordination type transitioned from “mild disharmony with hindered economic development” to “marginal coordination with ecological resilience lagging”. In Yunyan District, high-intensity development, unipolar economic expansion, and the absence of ecological protection have led to an imbalance between economic development and ecological resilience. The coupling and coordination type transitioned from “mild disharmony with hindered economic development” in 2005 to “mild disharmony with ecological resilience hindered”.
Due to differences in locational conditions, the radiation-driven effects from the central urban area of Guiyang, and the influence of their natural background conditions, other counties (cities, districts) showed a transition from the “disequilibrium type—hindered economic development” to the “coordination type—lagging economic development” during 2005–2020. Majiang County in the southeastern region, as a core area for rocky desertification control, features a fragile ecological environment and a traditional agriculture-dominated development model. During 2005–2020, its economic development and ecological resilience indices remained at persistently low levels, leading to its coupling coordination degree consistently remaining in the “disequilibrium type with hindered economic development. Most of the remaining counties are located in the periphery of the Guizhou Central Urban Agglomeration, distant from the central development core area. They face limited radiation-driven effects on economic development, coupled with small urban scales and weak transportation infrastructure. These counties are generally categorized as “barely coordinated-lagging economic development” and “primary coordinated-lagging economic development” types.
3.4. Analysis of the Spatial Connection Network Structure of Coupling Coordination Degree Between Economic Development and Ecological Resilience in the Guizhou Central Urban Agglomeration
The above research indicates that the spatial differentiation of the coupling coordination degree in the composite system of economic development and ecological resilience within the Guizhou Central Urban Agglomeration is remarkably significant. To explore the spatial association pattern of the coupling coordination degree in this composite system and thus formulate targeted optimization measures, this study employs the spatial gravity model to measure the connection strength of coupled and coordinated development among various counties in the Guizhou Central Urban Agglomeration. Using ArcGIS 10.5, the Natural Breaks method was employed to classify the spatial connection strength of coupling coordination between economic development and ecological resilience in the Guizhou Central Urban Agglomeration from 2005 to 2020 into five levels: weak connection, relatively weak connection, general connection, relatively strong connection, and strong connection, as shown in Figure 9 and Table 8.
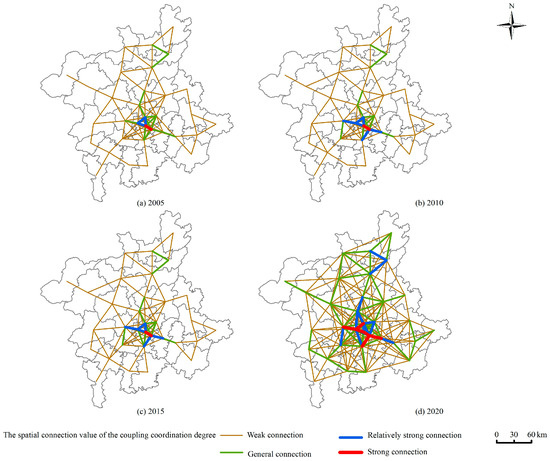
Figure 9.
The spatial connection structure of the coupling and coordinated development between economic development and ecological resilience in the urban agglomeration in Central Guizhou.
Table 8.
Potential values of coupling coordination degree of the urban agglomeration in Central Guizhou from 2005 to 2020.
From 2005 to 2020, the spatial connections of coupling and coordination among the 33 counties in the Central Guizhou Urban Agglomeration showed a continuous trend of tightening, which echoes the policy orientation of strengthening regional synergy and building an ecological–economic linkage network in the Development Plan for the Central Guizhou Urban Agglomeration. In terms of spatial distribution, the connection structure presents a differentiated pattern of “core polarization, edge collapse, and multi-center sprouting”, which is the result of the dual role of geographical conditions and policy tools.
Core polarization: The strong linkage network along the Guiyang–Anshun–Zunyi axis. This axis is located in the Central Guizhou Basin, where the flat terrain provides inherent advantages for transportation construction. The construction cost of trunk lines such as the Shanghai–Kunming High-speed Railway and the Guiyang–Zunyi Expressway is 30% lower than that in other karst mountainous areas. Coupled with the policy of “strengthening the main axis” proposed in the Guizhou Provincial 14th Five-Year Plan for New Urbanization (with transportation investment accounting for 60% of the province’s total), a dual drive of “industrial collaboration + ecological compensation” has been formed. Guiyang purchases ecological services from Anshun through carbon sink trading in the Gui’an New Area, and Zunyi realizes the synergy between the liquor industry and ecological protection relying on the Chishui River Ecological Economic Belt, keeping the coupling and coordination of the core area in a “strong connection” state and radiating to the surrounding areas to form a chain network.
Edge collapse: The predicament of weak connections in southwestern and southeastern Guizhou. Karst landforms account for more than 60% of the area in these two regions. The peak clusters and depressions result in high transportation costs, with the density of expressway networks being only 1/4 of that in the core area. Moreover, they are not included in the key nodes of the Master Plan for the New Western Land–Sea Corridor, leading to insufficient policy support. Constrained by the triple factors of “rocky desertification control areas + traffic occlusion + economic weakness”, the contradiction between ecological protection and development is prominent, and the coupling and coordination have long been in a “weak connection” state, forming a development fault with the core area.
Multi-center sprouting: The potential of secondary nodes and ecological zones to break the deadlock. Relying on the positioning of “cultivating secondary growth poles” in the Spatial Development Strategy of the Central Guizhou Urban Agglomeration, Duyun and Kaili have developed characteristic ecological industries such as Maojian tea and Miao embroidery with the help of the Xiamen–Chengdu Expressway and the Shanghai–Kunming High-speed Railway, becoming local coordination centers. The Miaoling Mountains and the Wujiang River Basin have transformed ecological advantages into economic value through the control measures in the Guizhou Provincial Measures for the Administration of Ecological Protection Red Lines and the pilot projects of forestry carbon sink trading, promoting the connection intensity to transition to “relatively strong connection” and providing the possibility to break the solidification of the “core-edge” pattern.
To sum up, geographical conditions lay the foundation for urban development, and policy intervention reshapes the spatial pattern. The core area forms a collaborative network by virtue of its terrain and policies, the edge areas lag behind due to natural and policy constraints, and the secondary nodes show the potential to break the deadlock through policy empowerment, providing a precise basis for differentiated coordination strategies.
4. Discussion
4.1. The Applicability of the Method
This study focuses on the temporal and spatial characteristics of the coupling and coordination relationship between economic development and ecological resilience in the Central Guizhou Urban Agglomeration, and has formed an innovative framework for evaluating ecological resilience levels. On the basis of drawing on existing research results, the dimension of “ecological risk” is incorporated into the evaluation system, constructing a four-dimensional analytical framework of “risk (disturbance identification)—resistance (disturbance bearing)—adaptation (system adjustment)—recovery (function restoration)” [62].
The core values of this framework are as follows [63]: First, it fully covers the entire chain process from the occurrence of disturbances to the restoration of system functions, transforming the abstract concept of “resilience” into a quantifiable and operable indicator system, which effectively solves the problem that indicators are disconnected from the essential connotation of resilience in traditional evaluations. Second, while retaining the theoretical core of dynamic capability evaluation, by adding the “risk identification” link, it strengthens the attention to the source of disturbances, making the evaluation framework more in line with the actual operation rules of regional ecosystems and improving practical adaptability. This innovative exploration provides a new perspective and methodological supplement for ecological resilience evaluation research, and also lays a theoretical foundation for similar regions to explore the complex interaction between economic and ecological systems.
4.2. Policy Implications
Empirical studies show that economic development in the Central Guizhou Urban Agglomeration has a positive feedback effect on the synergistic relationship between the economic and ecological composite systems, indicating that a “win-win” situation for economic development and ecological protection is the future development direction of the Central Guizhou Urban Agglomeration [64]. However, in the evolution process of the coupling and synergistic relationship between economic development and ecological resilience, the problem of regional imbalance is significantly prominent [65]. Combining the characteristics of counties with different coupling and coordination types and the intensity of spatial correlation, we put forward the following optimization suggestions:
Counties with good coordination but lagging ecological resilience (such as Renhuai City and Honghuagang District) have a solid regional economic foundation and close spatial connection with core cities. It is necessary to focus on preventing the risk of ecological overdraft. They can join hands with closely related surrounding counties to establish a cross-regional ecological monitoring network, implement total sewage discharge control for leading industries such as liquor brewing and equipment manufacturing, and include ecological restoration costs into enterprise production costs. At the same time, relying on the advantage of strong correlation, they should export green production technologies to the surrounding areas and jointly build ecological economic belts in the Chishui River Basin and Xiangjiang River Basin to realize two-way synergy between industrial upgrading and ecological protection.
Counties with intermediate coordination but lagging economic development (such as Dafang County and Qianxi County) have a good ecological background but insufficient economic momentum, and most of them are in a general correlation state with the core area in the northwest. They should take the initiative to undertake industrial radiation from cities such as Zunyi and Bijie, and develop characteristic industries such as ecological tourism and green agriculture. Promote transportation densification projects with the core area to reduce logistics costs, and convert ecological resources such as Baili Azalea and Huawuji Miao Village into economic advantages. Establish a pairing assistance mechanism with counties with strong coordination such as Renhuai City, and improve the added value of agricultural products through technology introduction to break the dilemma of “excellent ecology but weak economy”.
Counties with intermediate coordination but lagging ecological resilience (such as Huaxi District and Guanshanhu District) belong to the core circle of Guiyang, with extremely strong spatial correlation but prominent ecological pressure. It is necessary to strictly delimit ecological protection red lines, include ecological spaces such as Ahha Lake Wetland and Yueshan Lake into rigid control, and implement the “demolish illegal buildings and build green spaces” project in urban renewal. Relying on the advantages of the big data industry, we can develop smart environmental protection platforms to provide ecological monitoring technical services for related regions. We must also promote industrial upgrading to a higher end, reduce ecological consumption per unit of GDP, and balance the relationship between population agglomeration and ecological carrying capacity [66].
Counties with barely coordinated but lagging economic development (such as Wudang District) have significant ecological advantages but loose connection with the main urban area. It is necessary to break the transportation bottleneck with the core area of Guiyang, extend urban rail transit, and meet the needs of urban leisure consumption; build a characteristic industrial chain of “forest health care + rural tourism”; jointly build an ecological industry enclave park with Guanshanhu District, and promote the conversion of ecological value through the model of “ecological resource shares + economic income sharing” to make up for economic shortcomings.
Counties with mild imbalance and hindered ecological resilience (such as Yunyan District), as the central urban area of Guiyang, have high correlation intensity but declining coupling and coordination degree. It is necessary to implement the “return urban land to green space” campaign, transform inefficient industrial land into urban parks, and strictly control the building floor area ratio; transfer high-pollution industrial links to surrounding districts and counties, focus on low-carbon industries such as headquarters economy and green finance, establish a horizontal compensation mechanism with ecologically advantageous areas, and make up for ecological deficits through financial feedback [67].
Counties with imbalance and hindered economic development (such as Majiang County) are located in the marginal weak correlation zone, with both low economic and ecological levels. They should promote transportation network connection with Kaili and Duyun, and access the secondary urban correlation network; develop characteristic planting such as Chinese prickly ash and honeysuckle in combination with rocky desertification control, and realize production and marketing connection through Kaili’s market channels; strive for assistance from Guiyang to build agricultural product processing bases, expand sales channels through e-commerce platforms in the core area, and form a “governance—income increase” cycle.
Marginal counties with barely coordinated development (such as border counties in southwestern Guizhou) need to take the initiative to integrate into the industrial division of labor of secondary nodes such as Duyun and Xingyi, and undertake supporting processing links; tap karst landforms and ethnic cultural resources to create niche cultural and tourism IPs, break through geographical restrictions through new media drainage, and jointly apply for ecological protection special projects with surrounding counties to alleviate protection pressure and create conditions for economic take-off.
Through such differentiated strategies, various counties can be promoted to develop their strengths and avoid weaknesses, realize complementary advantages through spatial correlation networks, and promote the “economic—ecological” synergy of the Central Guizhou Urban Agglomeration towards balanced development in the whole region.
5. Conclusions
The article takes 33 counties (cities, districts) in the Central Guizhou Urban Agglomeration as research units, follows the research paradigm of “mechanism exploration—level measurement—relationship evolution—spatial correlation”, and systematically analyzes the spatiotemporal evolution characteristics and spatial connection structure of the coupling and coordination relationship between urban economic development and ecological resilience, drawing the following conclusions:
(1) Analysis of the comprehensive development level of economy and ecology.
From 2005 to 2020, the economic development level of the Central Guizhou Urban Agglomeration improved significantly, with the average comprehensive index increasing from 0.041 to 0.346. Spatially, it showed a pattern of “core polarization and edge locking”—the core urban areas (such as the main urban areas of Guiyang and Zunyi) had prominent economic agglomeration effects, while the development of edge counties lagged behind. The level of ecological resilience maintained a stable trend with significant spatial differentiation: the northwest maintained a high level due to high forest coverage and low karst proportion; the southeast remained low for a long time due to the impact of rocky desertification; and the central urban areas saw continuous degradation of ecological resilience due to urbanization expansion.
(2) Spatiotemporal evolution logic of coupling coordination relationship.
During the research period, the average coupling coordination degree between economic development and ecological resilience increased from 0.362 to 0.666, showing an overall continuous upward trend. This indicates that the “economy-ecology” system has always been in a benign interaction range, and the synergy between ecological protection and economic development has gradually strengthened. Spatially, the coupling coordination degree presents a distribution characteristic of “high in the northwest and low in the southeast”, which is highly consistent with the background of ecological resilience; the trend surface analysis further reveals its spatial directivity of “high in the north and low in the south, high in the west and low in the east”, and the differentiation in the north–south direction is more significant than that in the east–west direction. This pattern is not only constrained by the natural background of the eastern foot of the Miaoling Mountains and the karst peak cluster landform, but also closely related to the policy inclination towards the core growth poles in the “Development Plan of the Central Guizhou Urban Agglomeration”.
(3) Conversion path of coupling coordination types.
From 2005 to 2020, the regional coupling coordination type as a whole changed from “imbalanced—economic development lag type” to “coordinated—economic development lag type”, which confirms that the improvement of economic development level is the core driving force for coordination optimization, but the conversion path is profoundly affected by industrial structure and ecological policies. Counties in the northwest have achieved a leap from being on the verge of imbalance to intermediate coordination through ecological industries such as “ecological tourism + under-forest economy” (e.g., Dafang County); Renhuai City, relying on the industrial integration of “liquor + culture and tourism” and the ecological compensation mechanism, has upgraded to a good coordination—ecological resilience lag type, showing the synergistic potential of high economy and high ecology; Baiyun District in the central region, due to its dependence on traditional manufacturing, and Yunyan District, due to high-intensity urban development, have fallen into an unbalanced state of ecological resilience lag and ecological resilience obstruction, respectively.
(4) Formation and differentiation of spatial connection pattern.
The spatial connections of coupling coordination between counties have become increasingly close, with the structure showing the characteristics of “core polarization, edge collapse, and multi-center sprouting”. The Guiyang–Anshun–Zunyi axis, relying on the flat terrain of the Central Guizhou Basin and transportation networks such as the Shanghai–Kunming High-Speed Railway, has formed a strong connection chain network through industrial chain extension and carbon sink trading pilots, with policy drivers and geographical advantages jointly strengthening the core radiation; edge counties in southwestern and southeastern Guizhou, due to the barrier of karst landforms and insufficient policy resources, are mainly dominated by weak connections and trapped in the dual constraints of “ecological fragility—economic backwardness”; secondary nodes such as Duyun and Kaili have gradually grown into local coordination centers with the help of characteristic industries and expressway networks; the Miaoling and Wujiang River basins have shown the potential for multi-center linkage through ecological red line management and control and carbon sink trading, providing the possibility to break the solidified “core-edge” pattern.
Author Contributions
Writing—original draft, Writing—review and editing, Visualization, Methodology, Investigation, Formal analysis, Data curation, Z.L.; Writing—original draft, Methodology, Formal analysis, Data curation, J.Z.; Writing—review and editing, Formal analysis, Supervision, Conceptualization, B.C.; Methodology, Investigation, Formal analysis, Data curation, Y.Y.; Methodology, Formal analysis, Data curation, M.Z. All authors have read and agreed to the published version of the manuscript.
Funding
National Natural Science Foundation of China (Grant No. 42462027); Guizhou University of Finance and Economics 2025 Student Research Project (Grant No. 2025BAZYSY091).
Data Availability Statement
The original contributions presented in this study are included in the article. Further inquiries can be directed to the corresponding author.
Conflicts of Interest
The authors declare no conflicts of interest.
References
- Pu, Y.; Wei, X.; Liu, J.; Zhang, K.; Li, B.; Wei, Z.; Zhang, M.; He, T.; Wang, Y.; Shao, X. Relationship between environmental evolution and human activities in the northeastern Qinghai-Xizang Plateau throughout the past millennium and its implications for the onset of the Anthropocene. Sci. China Earth Sci. 2024, 67, 3536–3549. [Google Scholar] [CrossRef]
- Hong, W.; Zhao, Y.; Yang, S.; Yang, X.; Li, Y.; Wang, C. An analytical framework based on social-ecological systems for identifying priority areas for ecological restoration in coastal regions. J. Environ. Manag. 2024, 370, 122958. [Google Scholar] [CrossRef] [PubMed]
- Yan, M.; Zhao, J.; Yan, M. Patterns, processes, and differentiation mechanisms of China’s transition from old to new economic drivers. J. Geogr. Sci. 2024, 34, 1697–1718. [Google Scholar] [CrossRef]
- Wu, Z.; Zhu, D.; Xiong, K.; Wang, X. Dynamics of landscape ecological quality based on benefit evaluation coupled with the rocky desertification control in South China Karst. Ecol. Indic. 2022, 138, 108870. [Google Scholar] [CrossRef]
- Ye, D.; Yang, L.; Zhou, M. Spatiotemporal Variation in Ecosystem Health and Its Driving Factors in Guizhou Province. Land 2023, 12, 1439. [Google Scholar] [CrossRef]
- Wang, K.; Ma, H.; Fang, C. The relationship evolution between urbanization and urban ecological resilience in the Northern Slope Economic Belt of Tianshan Mountains, China. Sustain. Cities Soc. 2023, 97, 104783. [Google Scholar] [CrossRef]
- Stern, D.I. The Rise and Fall of the Environmental Kuznets Curve. World Dev. 2004, 32, 1419–1439. [Google Scholar] [CrossRef]
- Cao, M.X.; Lu, X.Y.; Qin, Z.X.; Liu, X.L.; Li, F. Social-ecological system changes in China from 1990 to 2018. Ecol. Indic. 2022, 139, 108926. [Google Scholar] [CrossRef]
- Holling, C.S. Resilience and Stability of Ecological Systems. Annu. Rev. Ecol. Evol. Syst. 1973, 4, 1–23. [Google Scholar] [CrossRef]
- Ostrom, E. A general framework for analyzing sustainability of social-ecological systems. Science 2009, 325, 419–422. [Google Scholar] [CrossRef] [PubMed]
- Witharana, L.; Chen, D.; Curio, J.; Burman, A. Traditional ecological knowledge in High Mountain Asia: A pathway to climate resilience in agriculture amidst changing climates. Adv. Clim. Chang. Res. 2025, 16, 167–182. [Google Scholar] [CrossRef]
- Colding, J. ‘Ecological land-use complementation’ for building resilience in urban ecosystems. Landsc. Urban Plan. 2007, 81, 46–55. [Google Scholar] [CrossRef]
- Preiser, R.; Biggs, R.; De Vos, A.; Folke, C. Social-ecological systems as complex adaptive systems organizing principles for advancing research methods and approaches. Ecol. Soc. 2018, 23, 46. [Google Scholar] [CrossRef]
- Ziervogel, G.; Enqvist, J.; Metelerkamp, L.; van Breda, J. Supporting transformative climate adaptation: Community-level capacity building and knowledge co-creation in South Africa. Clim. Policy 2022, 22, 607–622. [Google Scholar] [CrossRef]
- Srinivasan, J.; Jones, K.; Morgan, M. Unpacking the Taxonomy of Wildland Fire Collaboratives in the United States West: Impact of Response Diversity on Social-Ecological Resilience. Environ. Manag. 2025, 75, 1349–1367. [Google Scholar] [CrossRef]
- Wang, Y.; Cai, Y.; Xie, Y.; Chen, L.; Zhang, P. An integrated approach for evaluating dynamics of urban eco-resilience in urban agglomerations of China. Ecol. Indic. 2023, 146, 109859. [Google Scholar] [CrossRef]
- Lu, F.; Liu, Q.; Wang, P. Spatiotemporal characteristics of ecological resilience and its influencing factors in the Yellow River Basin of China. Sci. Rep. 2024, 14, 16988. [Google Scholar] [CrossRef]
- Chu, X.; Deng, X.; Jin, G.; Wang, Z.; Li, Z. Ecological security assessment based on ecological footprint approach in Beijing-Tianjin-Hebei region, China. Phys. Chem. Earth Parts A/B/C 2017, 101, 43–51. [Google Scholar] [CrossRef]
- Zhu, S.; Feng, H.; Shao, Q. Evaluating Urban Flood Resilience within the Social-Economic-Natural Complex Ecosystem: A Case Study of Cities in the Yangtze River Delta. Land 2023, 12, 1200. [Google Scholar] [CrossRef]
- Huang, J.; Zhong, P.; Zhang, J.; Zhang, L. Spatial-temporal differentiation and driving factors of ecological resilience in the Yellow River Basin, China. Ecol. Indic. 2023, 154, 110763. [Google Scholar] [CrossRef]
- Xie, X.; Zhou, G.; Yu, S. Study on Rural Ecological Resilience Measurement and Optimization Strategy Based on PSR-“Taking Weiyuan in Gansu Province as an Example”. Sustainability 2023, 15, 5462. [Google Scholar] [CrossRef]
- Pan, Y.; Jiao, S.; Hu, J.; Guo, Q.; Yang, Y. An Ecological Resilience Assessment of a Resource-Based City Based on Morphological Spatial Pattern Analysis. Sustainability 2024, 16, 6476. [Google Scholar] [CrossRef]
- Li, K.; Yan, Q.; Wu, Z.; Li, G.; Yi, M.; Ma, X. A Study on the Spatiotemporal Heterogeneity and Driving Forces of Ecological Resilience in the Economic Belt on the Northern Slope of the Tianshan Mountains. Land 2025, 14, 196. [Google Scholar] [CrossRef]
- Ji, X.; Nie, Z.; Wang, K.; Xu, M.; Fang, Y. Spatiotemporal evolution and influencing factors of urban resilience in the Yellow River Basin, China. Reg. Sustain. 2024, 5, 100159. [Google Scholar] [CrossRef]
- Wang, L.; Yuan, M.; Li, H.; Chen, X. Exploring the coupling coordination of urban ecological resilience and new-type urbanization: The case of China’s Chengdu–Chongqing Economic Circle. Environ. Technol. Innov. 2023, 32, 103372. [Google Scholar] [CrossRef]
- Wang, S.; Cui, Z.; Lin, J.; Xie, J.; Su, K. The coupling relationship between urbanization and ecological resilience in the Pearl River Delta. J. Geogr. Sci. 2022, 32, 44–64. [Google Scholar] [CrossRef]
- Wang, Y.; Li, Y. The Impact of the Digital Economy on Urban Ecosystem Resilience in the Yellow River Basin. Sustainability 2025, 17, 790. [Google Scholar] [CrossRef]
- Xie, X.; Fang, B.; He, S. Is China’s Urbanization Quality and Ecosystem Health Developing Harmoniously? An Empirical Analysis from Jiangsu, China. Land 2022, 11, 530. [Google Scholar] [CrossRef]
- Wang, Z.; Liu, Y.; Li, Y.; Su, Y. Response of Ecosystem Health to Land Use Changes and Landscape Patterns in the Karst Mountainous Regions of Southwest China. Int. J. Environ. Res. Public Health 2022, 19, 3273. [Google Scholar] [CrossRef]
- Lu, N.; Liu, L.; Yu, D.; Fu, B. Navigating trade-offs in the social-ecological systems. Curr. Opin. Environ. Sustain. 2021, 48, 77–84. [Google Scholar] [CrossRef]
- Sun, M.; Li, X.; Yang, R.; Zhang, Y.; Zhang, L.; Song, Z.; Liu, Q.; Zhao, D. Comprehensive partitions and different strategies based on ecological security and economic development in Guizhou Province, China. J. Clean. Prod. 2020, 274, 122794. [Google Scholar] [CrossRef]
- Anser, M.K.; Ali, S.; Umair, M.; Javid, R.; Mirzaliev, S. Energy consumption, technological innovation, and economic growth in BRICS: A GMM panel VAR framework analysis. Energy Strategy Rev. 2024, 56, 101587. [Google Scholar] [CrossRef]
- Meng, G.; Wang, K.; Wang, F.; Dong, Y. Analysis of the tourism-economy-ecology coupling coordination and high-quality development path in karst Guizhou Province, China. Ecol. Indic. 2023, 154, 110858. [Google Scholar] [CrossRef]
- Mulder, C.; Conti, E.; Mancinelli, G. Carbon budget and national gross domestic product in the framework of the Paris Climate Agreement. Ecol. Indic. 2021, 130, 108066. [Google Scholar] [CrossRef]
- Zheng, Z.; Zhu, Y.; Zhang, Y.; Yin, P. The impact of China’s regional economic integration strategy on the circular economy: Policy effects and spatial spillovers. J. Environ. Manag. 2025, 373, 123669. [Google Scholar] [CrossRef] [PubMed]
- Ouyang, X.; Chen, J.; Wei, X.; Li, J. Ecological resilience in China’s ten urban agglomerations: Evolution and influence under the background of carbon neutrality. Ecol. Model. 2025, 508, 111226. [Google Scholar] [CrossRef]
- Doan, Q.C. The spatiotemporal trends of urban-rural green spaces and their heterogeneous relationships with population and economic vitality: Evidence from the Red River Delta, Vietnam. Socio-Econ. Plan. Sci. 2024, 93, 101885. [Google Scholar] [CrossRef]
- Huang, H.; Chen, Z.; Tan, C.; Liu, H. Using a three-tier structural decomposition analysis to assess industrial structure transformation and carbon emissions in China. Energy 2025, 335, 137817. [Google Scholar] [CrossRef]
- Gallo, L.A.; Jin, H.; Sridharan, S.A. Unraveling the time-series dynamics between aggregate earnings and GDP. J. Account. Econ. 2025, 101806, in press. [Google Scholar] [CrossRef]
- Yu, Y.-Y.; Zhong, C.-Y.; Zhang, S.-X.; Jiang, H.-D. The economic burden of a carbon tax on Chinese residents: A gender and income perspective. Energy Econ. 2025, 147, 108601. [Google Scholar] [CrossRef]
- Peng, C.; Qiao, Y.; Long, H.; Wang, Y. Assessing economic resilience in a manufacturing-based region through industrial restructuring with environmental thresholds: An updating framework. China Econ. Rev. 2025, 92, 102441. [Google Scholar] [CrossRef]
- Shmelev, S.E.; Shmeleva, I.A. Smart and sustainable benchmarking of cities and regions in Europe: The application of multicriteria assessment. Cities 2025, 156, 105533. [Google Scholar] [CrossRef]
- Han, H.; Qian, X.; Dong, L. Resilience and sustainability: The Stimulus-Recovery-Adaptation Model for adaptation of Anthropogenic Social-Ecological-Technological Systems to external disasters. Resour. Conserv. Recycl. 2025, 223, 108501. [Google Scholar] [CrossRef]
- Jatav, S.S.; Naik, K. Measuring the agricultural sustainability of India: An application of Pressure-State-Response (PSR) model. Reg. Sustain. 2023, 4, 218–234. [Google Scholar] [CrossRef]
- Wang, H.; Ge, Q. Ecological resilience of three major urban agglomerations in China from the “environment–society” coupling perspective. Ecol. Indic. 2024, 169, 112944. [Google Scholar] [CrossRef]
- Ahtiainen, H.; Dodd, L.F.; Korpinen, S.; Pakalniete, K.; Saikkonen, L. Quantifying effectiveness and sufficiency of measures—An application of the DPSIR framework for the marine environment. Mar. Policy 2025, 172, 106480. [Google Scholar] [CrossRef]
- Xiu, C.; Wei, Y.; Wang, Q. Evaluation of urban resilience of Dalian city based on the perspective of “Size-Density-Morphology”. Acta Geogr. Sin. 2018, 73, 2315–2328. [Google Scholar]
- Zhu, Y.; Zhang, Y.; Ma, L.; Yu, L.; Wu, L. Simulating the dynamics of cultivated land use in the farming regions of China: A social-economic-ecological system perspective. J. Clean. Prod. 2024, 478, 143907. [Google Scholar] [CrossRef]
- Vibhatabandhu, P.; Leelakun, P.; Yottiam, A.; Kanokkantapong, V.; Srithongouthai, S. Integration of microplastics and heavy metals in the potential ecological risk index: Spatial pollution assessment of sediments in the inner Gulf of Thailand. Chemosphere 2025, 376, 144280. [Google Scholar] [CrossRef]
- Deng, S.; Luo, M.; Wang, W.; Lan, S.; Xu, W.; Mai, X.; Zhang, W. Assessment of biodiversity and landscape changes during the Pinglu Canal construction and the benefits of ecological restoration based on Rao’s Q index. Ecol. Eng. 2025, 219, 107709. [Google Scholar] [CrossRef]
- Zhao, X.; Zhang, Y.; Tang, H.; Zhang, Q.; Cui, C.; Qin, B. Water quality improvements and ecological inertia: A basin-wide assessment of ecosystem recovery in the Yangtze River system (2005–2022). Ecol. Indic. 2025, 176, 113700. [Google Scholar] [CrossRef]
- Li, Z.; Adam, N.A.; Mirzaliev, S.; Saydullaev, S.; Bai, H. An integrated approach for evaluating the spatial and temporal dynamics of ecosystem services and ecological risk urban agglomerations in China. Ecol. Indic. 2025, 172, 113248. [Google Scholar] [CrossRef]
- Costanza, R.; d’Arge, R.; de Groot, R.; Farber, S.; Grasso, M.; Hannon, B.; Limburg, K.; Naeem, S.; O’Neill, R.V.; Paruelo, J.; et al. The value of the world’s ecosystem services and natural capital. Nature 1997, 387, 253–260. [Google Scholar] [CrossRef]
- Xie, G.D.; Zhang, C.X.; Zhang, L.M.; Chen, W.H.; Li, S.M. Improvement of the Evaluation Method for Ecosystem Service Value Based on Per Unit Area. J. Nat. Resour. 2015, 30, 1243–1254. [Google Scholar]
- Lin, Q.; Su, H.; Sammonds, P.; Xu, M.; Yan, C.; Zhu, Z. Evaluation and Prediction of Ecosystem Services Value in Urban Agglomerations Using Land Use/Cover Change Analysis: Case Study of Wuhan in China. Land 2024, 13, 1154. [Google Scholar] [CrossRef]
- Kang, P.; Chen, W.; Hou, Y.; Li, Y. Linking ecosystem services and ecosystem health to ecological risk assessment: A case study of the Beijing-Tianjin-Hebei urban agglomeration. Sci. Total Environ. 2018, 636, 1442–1454. [Google Scholar] [CrossRef]
- Fujita, M.; Krugman, P. The new economic geography: Past, present and the future. Pap. Reg. Sci. 2004, 83, 139–164. [Google Scholar] [CrossRef]
- Tinbergen, J.; Bos, H. Mathematical Models of Economic Growth; McGraw-Hill Book Company, Inc.: Columbus, OH, USA, 1962. [Google Scholar]
- Shmelev, S. Sustainable Cities Reimagined; Routledge: London, UK, 2019. [Google Scholar]
- Sun, W.; Lin, X.; Liang, Y.; Li, L. Regional Inequality in Underdeveloped Areas: A Case Study of Guizhou Province in China. Sustainability 2016, 8, 1141. [Google Scholar] [CrossRef]
- Jiang, D.; Zhu, W.; Zhang, Z. The Spatiotemporal Coupling and Synergistic Evolution of Economic Resilience and Ecological Resilience in Africa. Sustainability 2025, 17, 863. [Google Scholar] [CrossRef]
- Cinner, J.E.; Barnes, M.L. Social Dimensions of Resilience in Social-Ecological Systems. One Earth 2019, 1, 51–56. [Google Scholar] [CrossRef]
- Zou, Y.; Wang, M. Does environmental regulation improve energy transition performance in China? Environ. Impact Assess. Rev. 2024, 104, 107335. [Google Scholar] [CrossRef]
- Qu, S.; Zhang, Y.; Huang, F.; Gao, J. Assessing regional sustainability from the perspective of reconciling social-ecological resilience and human well-being: Empirical evidence from China. Appl. Geogr. 2025, 182, 103720. [Google Scholar] [CrossRef]
- Chen, M.; Batlle, C.; Costa-Castelló, R.; Na, J. A Two-Dimensional State-Space Model for Metal Hydride Storage Tanks and Parameter Sensitivity Analysis. IFAC-Pap. 2024, 58, 162–167. [Google Scholar] [CrossRef]
- Zhang, K.; Jin, Y.; Li, D.; Wang, S.; Liu, W. Spatiotemporal variation and evolutionary analysis of the coupling coordination between urban social-economic development and ecological environments in the Yangtze River Delta cities. Sustain. Cities Soc. 2024, 111, 105561. [Google Scholar] [CrossRef]
- Frondoni, R.; Mollo, B.; Capotorti, G. A landscape analysis of land cover change in the Municipality of Rome (Italy): Spatio-temporal characteristics and ecological implications of land cover transitions from 1954 to 2001. Landsc. Urban Plan. 2011, 100, 117–128. [Google Scholar] [CrossRef]
Disclaimer/Publisher’s Note: The statements, opinions and data contained in all publications are solely those of the individual author(s) and contributor(s) and not of MDPI and/or the editor(s). MDPI and/or the editor(s) disclaim responsibility for any injury to people or property resulting from any ideas, methods, instructions or products referred to in the content. |
© 2025 by the authors. Licensee MDPI, Basel, Switzerland. This article is an open access article distributed under the terms and conditions of the Creative Commons Attribution (CC BY) license (https://creativecommons.org/licenses/by/4.0/).