Abstract
With the maturity of haptic technology and complex systems, tactile interaction has gradually become realized through specific hardware and software configurations in the e-commerce and business industries. As an innovative form depending on haptic systems, tactile interactive advertising could help both advertisers and consumers enhance the haptic experience of products through technology-mediated virtual environments and provide tactile information for purchase decision making that relies on restoring the real sense of touch. On the basis of the value-based adoption model (VAM) and the need for touch (NFT) from a preference for haptic information in a system, we conduct quantitative research and construct a partial least squares structural equation model, which aims to study the influencing factors that characterize the user preference of tactile interactive advertisements empowered by haptic systems among Chinese consumers. A total of 509 valid questionnaires were collected through online and offline channels. The study revealed that the perceived enjoyment (PE) and telepresence (TEL) of tactile interactive advertisements as benefit factors positively influence the perceived value (PV) and that the perceived fee (PF) as a sacrifice factor negatively influences PV, which further impacts the attitude and intention to use (IU). In addition, the study verified that a higher NFT positively affected PE, PU, and PF and IU for the perception of tactile interactive advertising. Through this study, we aim to provide insights from a consumer perspective to enhance the advertising effect and user experience through tactile interaction in further e-commerce, which transforms how we interact with digital systems and virtual environments.
1. Introduction
Touch is one of the most important and prominent senses for humans [1]. With the rapid development of haptic technology, the main types of haptic systems comprising robotic hardware and tactile feedback device for users are graspable, wearable, and touchable. The users are allowed to interact with virtual environments through mechanically simulated haptic [2] and could be provided a digital sensory experience that reflects the texture, stiffness, size, shape, temperature, weight, and orientation of an object in healthcare [3], manufacturing [4], advertising, and marketing [5], etc. The commercial value of haptic technology continues to be released [6]. Specifically, the global haptic technology market reached USD 3.05 billion in 2023 and would grow at a compound annual growth rate of 11.7% between 2024 and 2030 in the Asia–Pacific market [7]. According to IDTechEx, the haptic market will be worth close to USD 5 billion by 2025 [8] with considerable potential for future growth.
As a vital E-commerce application of haptic technology [9], tactile interaction can be used in the field of advertising. This form of advertising can be referred to as tactile interactive advertising. Relying on the communication and interaction between the haptic device and the control system, the encoding tactile information (such as surface material, temperature, and texture) is simultaneously transmitted with audiovisual material from the advertiser (or television group or digital platform) to the consumers. The remote haptic interaction with the sensation of the goods (e.g., vibration, force, and motion feedback) can be provided to consumers through haptic devices [10,11,12]. Like haptic feedback in the application of gaming or other industrial training, consumers can obtain the physical touch of virtual items through tactile interactive advertising in addition to the audiovisual presentation of a commodity (e.g., video and VR/AR advertising without tactile elements) which are contacted and appear to be genuine and real via tactile feedback. Haptic technology enhances the advertising experience and purchase intention. It is feasible to apply touch in mobile and digital marketing environments [13]. This can increase the engagement rate by providing tactile dimensions, and then enhance consumer purchase intentions with greater brand awareness. The immersion and IPG Media Lab revealed that the incorporation of haptic technology into advertisements enhances brand favorability by 50%, increases the awareness of advertising by 75%, and boosts purchase intention by 41% compared with the audiovisual advertisements alone [14].
Need for touch (NFT) describes consumers’ preference to obtain product information through tactile experiences [15], which is realized through tactile interaction. Consumers learn the relevant information about product attributes and enjoy themselves during the haptic experience for purposeful purchase decisions [16]. On this basis, the significance of tactile interactive advertising for consumers is shown in enhanced engagement, personalization, accessibility, and inclusiveness [17]. Some studies have demonstrated that tactile interaction techniques can enhance the user experience (UX) due to the increased sense of presence and enjoyment [18]. The simulation of the tactile sensation of the original item occurs when consumers use haptic interactive devices [19]. The emergence of tactile interactive advertising further aims to satisfy the haptic needs and user experience of consumers when viewing advertisements.
Therefore, the impact of haptic interaction technology on consumer experience and its effect on consumer attitudes, intentions, and behaviors is considered to be a salient topic in advertising research [20]. Current studies focus on whether haptic interaction technologies have an impact on consumer purchases or experiences, but how haptic interactions influence consumer judgments still needs to be further clarified [21]. Past studies have used the technology acceptance model (TAM) to address acceptance issues involving the application of new technologies. For haptic interaction technology, Oh et al. explored the adoption of haptic enabling technology via innovation and diffusion theory (IDT) and TAM [22]. Van et al. explored the specific features related to haptics that are worth using in online sales, including the ease of use, usefulness, and enjoyment [23]. Limerick et al. introduced the perceived characteristics (e.g., usability, aesthetics, and rewards) and the intention to use tactile interactive technologies from a user engagement perspective [24]. On the other hand, understanding how consumers with different needs for touch can interact with virtually touchable products via a haptic system is considered a research direction for future technological development [25]. In this way, we proposed the following research question (RQ):
RQ1: Do consumers’ need for touch affect their perception and intention to use tactile interactive advertising?
For users or consumers, what is given and what is received are the criteria by which they determine the value and adoption of technology [26]. Few existing studies have considered the impact of the negative aspects of technological features on consumers’ perceived value and even their attitudes and intentions to use, e.g., due to the deficiency of TAM and UTAUT framework. The value-based adoption model (VAM) is considered a balanced analytical model [27], since it not only describes the perceived benefits, i.e., perceived usefulness and perceived enjoyment, but also takes into account possible perceived sacrifices, i.e., monetary (perceived fee) and non-monetary (technicality) aspects of the costs involved in adopting the new application [28].
However, while NFT describes the need for consumers to access product information through haptic technology, past NFT research has focused more on consumers’ desire to touch and has not addressed the users’ access preference of haptic experiences through haptic technology [18]. Lee et al. previously attempted to demonstrate the negative impact of NFT on the perceived ease of use, perceived enjoyment, and loyalty intention during online shopping using TAM, but did not consider the digital sensory impact of haptic interaction techniques [29]. Another research question is presented as follows:
RQ2: What are the perceived characteristics of haptic technology that affect consumers’ perceived value and intention to use tactile interactive advertising?
In recent studies, on the one hand, researchers have found that the tactile interaction can affect consumers’ experience and willingness to purchase [13] and then develop pragmatic and hedonistic consumer motivations [30]. To determine how tactile interfaces affect consumers’ product evaluation and purchase intentions, Racat et al. revealed the effects on consumers’ understanding of product information and their pleasure when interacting with the product [31]. On the other hand, in terms of consumers’ technology acceptance, Pino et al. explored how haptic interaction technologies affect consumers’ expected ease of use of products, as well as their attitudes and intentions toward these products [32], whereas Lee et al. explored the impact of virtual touch on satisfaction in virtual reality (VR) stores [33]. Combined with touchscreen interactions, multimodal sensory interactions would enhance spatial presence, which can effectively alleviate consumer uncertainty and information overload about products [34]. Unlike existing studies, the contributions of this study are summarized as follows:
- Based on NFT and the value-based adoption model (VAM), we examine the consumer adoption of tactile interactive advertising in terms of both benefits and sacrifices by incorporating the characteristics of tactile interactive advertising, and further explored the intention to use.
- We found that different levels of need for touch have a direct impact on the perception of tactile interactive advertising features, as well as on the willingness to use them. For Benefit factors, perceived enjoyment and telepresence contribute to consumers’ perceived value; For Sacrifice factors, only a perceived fee negatively affects perceived value, which implies that developers need to develop or choose more affordable haptic interfaces/devices.
- These findings will provide practical recommendations for technology developers and advertisers to promote the popularity of tactile interactive advertising and empower product sales.
The structure of this paper is as follows. Section 2 introduces the review of haptic technology applications and advertising with new technologies, including tactile interactive advertising. Section 3 illustrates the research models and hypotheses. Section 4 describes the method and the demographic characteristic. Section 5 presents the data analysis process. Section 6 discusses the research result and points out its implications and limitations. Section 7 makes a final conclusion of the study.
2. Literature Review
2.1. Haptic Technology and Tactile Concept
Haptic interaction technologies can usually be categorized into three different domains, i.e., the master domain, the network domain, and the slave domain [35]. The master domain usually consists of either human controllers or machine controllers, with the former also including human–machine interfaces (HMIs), motion control devices, and auditory–visual feedback devices. Currently, the human–machine interfaces of high interest include encounter tactile displays (ETHDs) [36], mid-air ultrasonic haptics [5], and electro-haptic feedback [37]. The slave domain consists of various entities that are directly controlled by the master domain, and the constituent entities of the slave domain vary from case to case. For example, in the case of teleoperation, the slave domain is mainly robotic devices that interact and perform work based on command signals from the operator; and, in the case of networked control systems, the slave domain is mainly sensor and actuator systems. The network domain serves as the link between the master and slave domains and is the medium for their interaction. As a brief description, haptic interaction consists of a haptic device with sensors and actuators, and a control computer capable of inputting relevant human operations to a haptic information display. With the development of haptic technology in tactile rendering and information transfer, the concept of Tactile Internet (TI) has been proposed by both academia and the industry. According to the definition of the IEEE 1918.1 Working Group on Tactile Internet standard, the so-called Tactile Internet is a network (or network of networks) for remotely accessing, sensing, manipulating, or controlling real or virtual objects or processes perceived by a human or a machine in real time [38]. To realize the key performance requirements of the haptic Internet, in addition to accurate localization and manipulation, ultra-high reliability, ultra-low latency, and stable network connectivity are required from the data transmission layer to provide efficient multimodal information. Currently, the application of haptic Internet technologies has been widely explored in various fields and has resulted in initial applications in areas such as healthcare [39], industrial practices [40], and advertising [41].
As an application of human–computer interaction, haptic technology generally encompasses haptic perception/sense and haptic feedback between human and machine, and the tactile interaction within the body of the human, between the machine and the machine [2,42]. In fact, tactile emphasizes a subjective human perception, addressing tactile perceptions from the skin, such as vibration and temperature [43]. On the other hand, haptic emphasizes a technological concept, which plays an important role in today’s human–computer interaction (HCI) [44]. Haptic technology has expanded from simple haptic feedback to provide haptic experiences including HCI, which allows users to realize more tactile interactions [45,46]. Therefore, the concept of “tactile interactive advertising” is used in this paper.
2.2. The Applications of Tactile Interaction
We can see that the tactile interaction has been used in the fields of medical and healthcare, industrial simulation, and marketing campaigns. For medical and healthcare, tactile interaction can help the remote operation of various surgical operations and provide convenience for the disabled. Lacki and Rossa constructed a 3-degree-of-freedom haptic devices using brake actuators, which fills the gap in the tactile system that ensures transparency and stability in remote surgery [47]. Turkseven et al. proposed the tactile impedance model of Endoscopic Submucosal Dissection (ESD), which will be applied to the treatment of colon surgery [48]. In addition, TI technology has been studied in orthopedic milling surgery and the tactile localization of uterine fibroids [49,50]. TI will also provide convenience for the blind. Barontini et al. proposed an indoor navigation system based on wearable tactile technology to help visually impaired people avoid obstacles [51]. Espinosa-casta and Medell proposed a virtual tactile perception method that supports blind teaching by combining VR and tactile technology [52].
For industrial practice, remote operation based on tactile interaction will prevent people from working in a dangerous environment. Abi-Farraj et al. explored a new tactile sharing control method to help operators classify and separate radioactive waste [53]. At the practical application level, when Volkswagen commercial vehicles assembled the doors of T6 and T7, they implemented and tested “SenseGlove Nova” for vehicle VR training to improve the authenticity of VR simulation and protect expensive vehicles from possible damage during the handle training [54]. Additionally, tactile interactivity has been used in interactive marketing campaigns [24]. Especially for the usage of marketing campaigns, it will trigger wide application in advertising through tactile interaction.
2.3. Tactile Interaction in Advertising
The application of haptic technology in advertising and marketing is gradually emerging. Early haptic interfaces were mobile phones or gamepads. TouchSense had previously developed a haptic involvement toolkit that could provide designers with a solution for adding haptic effects to video advertising content and could set the parameters that matched the advertising campaign [55]. Peugeot released a haptic advertisement that simulates the roar of the car and the vibration of an engine using the vibration of a mobile phone [56]. With the sophisticated haptic technology, the kinds of haptic interfaces are developed to wearable or non-wearable interfaces, which are capable of reflecting physical properties, and in part can be integrated with VR/AR. Porsche has teamed up with Zerolight and Ultrahaptic to combine high-quality visualization with mid-air haptics to create personalized public advertisements [57]. P&G Health used Senseglove to simulate the state of patients with nerve injury, and organized a business activity with the theme of “raising awareness of nerve injury” worldwide [58]. Nissan, in conjunction with the company known as HaptX, realized the interior driving experience of the concept car Nissan IMs using VR and haptic technology [59].
In academia, Mulcahy et al., in addition to showing that tactile interaction can improve the advertising experience and enhance the willingness to purchase a product, the haptic touch is now a sensation that can be used in mobile and digital retail environments [13]. Consumers can already touch, feel, and manipulate objects in virtual reality environments via tactile interaction devices [60]. Some studies also show that mid-air haptic feedback significantly improves usability and aesthetics compared to digital signage without haptic feedback [24]. Kim et al. introduced Refinity, a digital signage using holographic projection and mid-air haptics, and exemplified a usage scenario in which a user is free to browse a room and pick up or feel the furniture of interest in the room [61]. Racat et al. demonstrated through exploratory experiments that haptic rendering technology can mimic product texture and influence product purchase intention by mobilizing sensory memory to feel an experience similar to offline shopping [31].
2.4. The Usage of New Media Advertisement Technology
In the era of traditional advertising, even with the birth of mobile advertising, most of the advertisements use static pictures or videos to promote products by highlighting product information [62], The way to attract consumers’ senses is to improve the effect of advertising. Bolognesi et al. studied the role of “metaphors” of different sensory cues in print advertising. Existing research on digital sensory marketing mainly focuses on audio-visual interaction [63]. Because technologies and devices related to vision and hearing are more mature and widespread [64]. With the development of new media, three-dimensional (3D) technology has brought advertising into a new era, which is enabling consumers to experience the floating 3D visualization of products with real depth off-screen [65]. Compared with 2D advertising, the virtual experience brought by 3D advertising brings consumers a more positive perception and sense of presence [66,67]. Nowadays, advertising with 3D display, interactive features, and personalized recommendations is more popular among consumers [68].
As an emerging form of advertising, virtual reality (VR) enable consumers to watch 3D images with its advantages of vividity and interactivity [69]. The researchers mainly focused on the consumers’ acceptance of VR advertising and its effects [70,71,72]. Through empirical research, VanKerrebroeck et al. proved that VR produced higher vividness than ordinary 2D video and positively affected consumers’ attitudes towards advertising [72]. DeGauquier et al. also confirmed that people using VR advertising have a higher purchase intention [70]. In terms of interactivity, Wang et al. revealed that users valued interactive experience most when they experience VR advertising [73]. When users experience VR interactive advertisements, users paid the most attention to interactive experience such as interactive content, interactive systems, interactive functions, and interactive interfaces. For VR ad personalization distribution, Kilic et al. compares algorithms for personalized advertising distribution in VR platforms to maximize expected returns [74].
In contrast to VR technology, augmented reality (AR) technology organically combines the virtual and the real environment [75], which have great application opportunities [76]. Using computer graphics to generate visual output, advertisers can transform real print advertisements into 3D virtual models or videos that can be played through AR. For the purpose of enhancing consumers’ physiological responses and participation, AR advertisements stimulate consumers’ positive attitudes [77], which consumers had a higher acceptance of in the commercial field [78]. The different content characteristics of AR advertisements will affect consumers’ attitudes towards AR advertisements [77]. For example, the controllability and fun dimensions of the perceived interaction of AR advertisements will affect the mental imagery, thereby affecting consumers’ attitudes and behavioral intentions towards products [79]. The immersive experience will also significantly affect people’s perception of AR applications. In addition, information quality, sensory quality, interactivity, etc. also directly or indirectly affect users’ willingness to use and even continue to use [80,81].
With the emerging 3D stereoscopic technology, also known as autostereoscopic technology (non-glasses type), viewers can see stereoscopic images without wearing special glasses [82,83] and holographic advertisements belong to this category. In advertisements, holographic technology can display 360-degree dynamic images, stereoscopic images, and music effects. Depending on its strong high emotion, sense of space, perspective, contrast and color reproduction, the audio-visual effects of advertisements are more realistic and immersive [84]. Kim et al. designed an interactive holographic signage called “Refinity” for a new retail shopping, which used an autostereoscopic 3D display and combined various interactive tools to enhance the interactivity of online shopping [61]. Naked eye 3D advertisements can also directly see the stereoscopic effect via a “pseudo-3D” imaging advertisement on a special LED screen aided by optical illusions, which has been widely spread all over the world, such as the Xiaomi advertisement in Taikoo Li, Chengdu, China, and the “DNA City Life” advertisement in Italy.
3. Research Model and Hypotheses
However, the original VAM also has weaknesses as it neglects the necessity of integrating with the technical characteristics of a particular technology. Most of the past studies have made adjustments in utilizing the VAM as a framework, e.g., Chloe et al. replaced the original perceived fee with captivating inputs when using the VAM to explore AR adoption [85]. Similarly, the shortcoming of VAM is also valid in haptic interaction advertisements, but so far, there is no very well-developed model that can characterize the technology of haptic interaction advertisements. Although previously, in order to better standardize the assessment of haptic feedback in haptic technology, some researchers developed the Haptic experience model (HX) based on user experience [86] and proposed four dimensions of Expressivity, Involvement, Realism, and Harmony after subsequent validation, it has yet to fully pass the reliability test [18].
In this study, a modified value-based adoption model (VAM) is proposed to investigate consumers’ value, attitude, and behavioral intention toward tactile interactive advertising. The constructs in the structural equation model (SEM) consist of the need for touch (NFT), benefit and sacrifice factors, perceived value (PV), attitude (ATT), intention to use (IU). The benefit factors include perceived enjoyment (PE), perceived usefulness (PU), telepresence (TEL), and sacrifice factors represented by physical risk (PR), complexity (COMP), perceived fee (PF), for which these terms are defined in Table 1.

Table 1.
Research model and hypotheses.
3.1. Attitude and Intention to Use
Attitude is defined as a psychological evaluation of an object, while the intention to use relates to the level of intensity in performing a particular behavior [89,92]. The Technology Acceptance Model (TAM) has determined that ATT and IU are positively correlated. Further studies exploring sensory interaction techniques based on TAM have validated this relationship. For instance, Zhang et al. revealed that the attitudes of construction workers towards using VR technology in safety training positively influenced their intention to use [88]. Pantano et al. found that users’ attitudes towards AR in online try-on positively and significantly affected their subsequent behavioral intentions to use the system [81]. Vo et al. discovered that the attitude of users towards mobile AR application had a positive effect on their usage intention [93]. Seong & Hong found that a positive attitude also influenced the intention to use VR movement [94]. Based on previous research regarding sensory technologies, we propose the following hypothesis:
H1:
Attitude will positively influence the intention to use of tactile interactive advertising among consumers.
3.2. NFT and Its Formative Construction
NFT, as a preference for extracting and utilizing information from the tactile system, is based on differences in motivation and ability among individuals [95]. When evaluating product characteristics, people with a higher NFT will pay more attention to the texture of the product and continuously pay attention to tactile information. NFT is a multi-dimensional structure, including autotelic NFT (aNFT) and instrumental NFT (iNFT). The former is driven by seeking fun and enjoyment (not necessarily for purchase), while the latter is result-oriented and gathers haptic information to reduce uncertainty, so as to pick out high-quality items for purchasing [15].
According to the conceptual explanation of NFT, aNFT and iNFT act as two factors of NFT and there exists an essential difference in their nature, respectively. A change in any of the variables causes the structure to change. aNFT is a more spontaneous process and iNFT is a more postulated one [15]. In other words, the higher-order variable represents the variance shared by the two indicator constructs [96]. Thus, transforming aNFT and iNFT into higher-order NFT has two advantages; on the one hand, it does not ignore the difference between aNFT and iNFT; At the same time it restores the parsimony and intuition of the variables. Whereas aNFT and iNFT are first-order formative constructs for NFT. Similarly, Kuhn et al. operationalized the second-order construct NFT by using the repetition indicator method in a reflective–formative hierarchical component model, where iNFT and aNFT comprise the total NFT [97]. Based on the above findings, we make the following hypothesis:
H2-1:
The second-order construct NFT holds, while aNFT (H2-1a) and iNFT (H2-1b) have a significant relationship with NFT.
Citrin et al. argued that the willingness to collect tactile cues is more pronounced among those with a higher need for tactile input, which is reflected in the online shopping environment, where those with a high need for tactile input would be deterred by the absence of tactile cues [98]. And, Rodrigues et al. showed that tactile information has a positive effect on consumers’ perception and purchase intention [99]. And, in the study of Zheng et al., it was shown that autotelic NFT and instrumental NFT influence consumers’ purchasing decisions [100]. The above literature illustrates a mechanism due to which people with high NFT have a higher willingness to collect tactile cues, and the collected tactile cues increase consumers’ purchase intention. However, in the past, online shopping has been characterized by a lack of tactile cues, causing the higher NFT group to have a lower willingness to consume. In this study, tactile interactive advertising precisely supplements the lack of tactile cues in online shopping. Based on the above assertion, this study hypothesizes that the group with a higher NFT has a stronger willingness to use tactile interactive advertising, and hypothesis is listed as follows:
H2-2:
The NFT positively affects the intention to use of tactile interactive advertising among consumers.
3.3. Perceived Value
Perceived value is the consumer’s assessment after weighing the benefits and sacrifices involved, which has a significant impact on consumer decision making [101]. Regarding the purchase of green products, Xia et al. showed the positive influence of perceived value on purchase intention [102]. Kim et al. combined VAM with TAM in mobile Internet research and found that there exists a correlation between perceived value with adoption intention [28]. The attitude was also introduced in VAM and proved the positive effect of perceived value on attitude [103]. Therefore, the hypothesis is made as follows:
H3-1:
Perceived value positively influences the attitude of tactile interactive advertising among consumers.
H3-2:
Perceived value positively influence the intention to use of tactile interactive advertising among consumers.
3.4. Benefit
Kim proposed that usefulness and enjoyment are the benefit components of perceived value [28]. In the research field of emerging ICT scenarios such as IoT, VR/AR, and smart home, several factors of benefit component had been proposed in VAM, such as perceived usefulness, perceived enjoyment and telepresence in technology adoption studies. Vishwakarma et al. examined how perceived enjoyment, perceived usefulness, and perceived immersion as benefits positively affected the perceived value of VR adoption by travelers, and demonstrated the impact of all three on PV [91]. Similarly, Mathavan et al. investigated the impact of PE and PU on PV in fitness wearables usage, and also incorporated three additional variables in the benefit dimension, namely perceived design aesthetics [104]. Based on these studies, the hypotheses of this research are formulated:
H4-1:
Perceived enjoyment (H4-1a) and perceived usefulness (H4-1b) will positively influence the perceived value of tactile interactive advertising among consumers.
In previous research, Lee et al. found the effect of NFT on TAM and demonstrated the positive effect of autotelic NFT on PE in e-commerce [29]. This suggests that NFT is an influential factor that affects perceptual dimensions in the market application of haptic technology. Gatter et al. demonstrated that people with a high iNFT usually touch objects in a goal-oriented, utility-oriented manner to evaluate product attributes, utility, and quality [25]. Therefore, the hypothesis is proposed in this study:
H4-2:
Consumers’ level of NFT will be positively related to perceived enjoyment (H4-2a) and perceived usefulness (H4-2b) of tactile interactive advertising among consumers.
Presence is a dimension that can be utilized in various technological studies. For instance, telepresence (TEL) is a fundamental concept in virtual reality (VR) technology [105]. Additionally, Maier et al. state that the haptic Internet transmits both non-tactile controls and data while also imposing haptic control capabilities, making it impossible for end-users to distinguish whether they are operating the system locally or from a remote location [106]. Therefore, telepresence constitutes a crucial dimension of haptic technology. In the study of AR mobile applications under the VAM framework, Yoon et al. included presence in the Benefit category based on PE and PU, and demonstrated its favorable impact on PV [107]. As a result, in this research, TEL serves as a component of Benefit and is hypothesized as follows:
H4-3:
Telepresence will positively influence the perceived value of tactile interactive advertising among consumers.
3.5. Sacrifice
Sacrifice consists of both non-monetary and monetary dimensions, and prior studies have used technicality and perceived fee as sacrifice dimensions of perceived value [28]. For instance, the studies confirmed that technicality negatively impacts the perceived value of self-customization services and AR, respectively, while perceived cost is negatively influential [107]. Ease of use is a commonly used indicator of technicality, and consumers tend to accept technologies that are uncomplicated and easy to use [108]. Perceived complexity is considered to be low perceived ease of use, which has a negative impact on the perceived value of VR [91]. Therefore, this study posits the following hypothesis:
H5-1:
Perceived fee (H5-1a) and Complexity (H5-1b) will negatively influence the perceived value of tactile interactive advertising among consumers.
For NFT, past research illustrates that consumers with a high NFT will compensate for the lack of tactile information by focusing on price reductions when they are unable to touch the item or capture tactile information, and will also be more confident in their judgment of the product at the time of the promotion [109]. In addition, it has been shown that people with a higher aNFT have more positive attitudes toward saving money [110]. All of the above studies are suggesting that groups with a higher aNFT are more sensitive to the perception of money costing. On the other hand, according to Pino et al., even alternative touches can increase consumers’ expectations about the ease of use of product features [32]. In contrast, Lee et al. demonstrated that NFT also influences technology acceptance, as evidenced by the positive impact of aNFT on PEOU when consumers fully interact with the seller [29], and this is further corroborated by the fact that groups with a higher NFT have higher perceived ease-of-use, and correspondingly will have higher perceptions of technological complexity. Therefore, this study hypothesizes the following:
H5-2:
Consumers’ level of NFT will be positively related to the perceived fee (H5-2a) and complexity (H5-2b) of tactile interactive advertising among consumers.
Current haptic technologies have the potential to enhance the sense of touch, but latency remains a prominent issue [39]. If the delay between the feedback and the interaction exceeds 1 ms, as is often the case with multiple sensory feedback like audio, video, and haptic, cybersickness can also occur [111]. Cybersickness presents a physical risk, and prior research on VR and 360-degree advertising has highlighted potential negative outcomes, such as eye strain, dizziness, and motion sickness [112,113]. Vishwakarma et al. defines physical risk and echoes the negative effects of this technology, and it also demonstrates that the perceived physical risk of using virtual reality technology has a negative impact on perceived value [91]. Hence, the hypothesis of this study is proposed as
H5-3:
Perceived physical risk will negatively influence the perceived value of tactile interactive advertising among consumers.
Based on the proposed hypothesis, the conceptual model is illustrated in Figure 1.
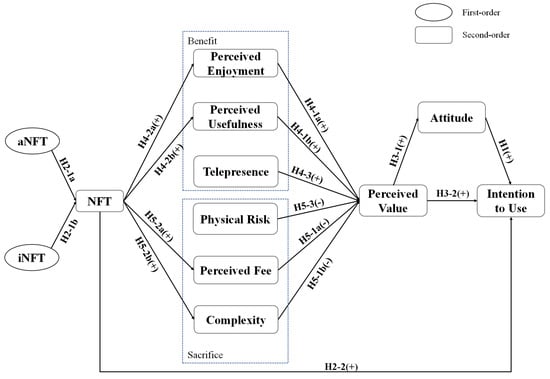
Figure 1.
Conceptual model.
4. Method
4.1. Sample and Data Collection
During the period from November 2022 to August 2023, we conducted purposive sampling and made an interview among consumers to investigate their perceptions and attitude toward tactile interaction and the form of tactile interactive advertising. The pre-test of the questionnaire was also delivered before large-scale distribution. The formal questionnaire survey was conducted from August 2023 to January 2024 via SurveyPlus and Credamo survey platforms and 576 questionnaires were collected totally.
In order to ensure that this study is not limited by geographical factors and to reach respondents more efficiency, especially those that are not active on the Internet, we conducted online and offline questionnaire distribution. Three channels were included: (1) offline on-site collection using SurveyPlus in Jinan, Shandong Province and Kunming, Yunnan Province, where 151 and 62 questionnaires were collected, respectively. (2) Online snowball sampling, where 213 questionnaires were collected by snowball sampling on the SurveyPlus platform; and (3) Online sample service, where 168 questionnaires were collected using Credamo platform in January 2024. After preliminary ad hoc analysis, there was no channel difference between online and offline.
In the screening session, this study removed invalid questionnaires based on the following criteria: (1) The questionnaire completion time was less than 5 min (300 s); (2) Setting a screening question “Please choose very dissatisfied” and choosing other options; (3) The answers to the questions were identical. Finally, 509 valid responses were retained after removing outliers and incomplete responses. Respondents’ characteristics are shown in Table 2 and Table 3. The final sample consisted of 200 males and 309 females. A total of 429 people (94.3%) are less than 35 years old. Most respondents are well educated, with 441 people (86.7%) have at least completed an undergraduate degree if not more. The respondents are from 32 provinces (n = 507) in China and Australia (n = 2). Regarding the user’s habit of watching advertisements as shown in Figure 2, we measured the advertisement forms they have been exposed to, the frequency of watching advertisements and the time of each viewing, and the characteristics of the advertisement content, respectively. Among them, respondents experience more 2D screen ads (N = 440) and naked eye 3D ads (N = 325), which are more popular nowadays. In addition, 48.5% of users viewed ads 1–2 times per day, while 35.2% reached 3–10 times. Meanwhile, 42.2% of users accept advertising duration for 6–15 s each time, while 31.0% watched for 15–30 s each time. Regarding the characteristics of the ads, information (N = 269), entertainment (N = 206), and contextual overlap (N = 281) were more valued.
Table 2.
Demographic characteristics of respondents (a).
Table 3.
Demographic characteristics of respondents (b).
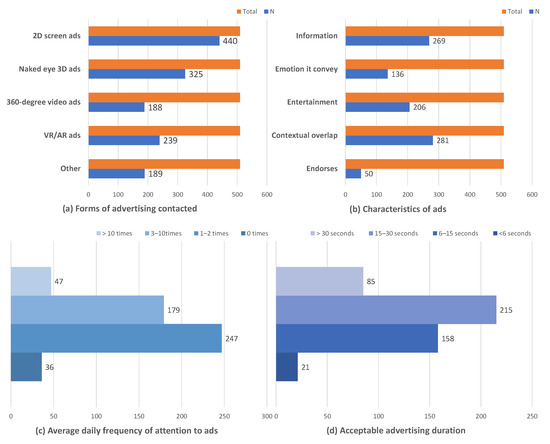
Figure 2.
The surveyed consumers’ advertising habit.
4.2. Instrument Procedure
Since haptic devices and tactile interactive advertisements have not yet been widely adopted, at the beginning of the questionnaire, an introduction video of the existing application related to haptic devices and tactile interactive advertising to stimulate the respondents’ awareness and subjective feelings about tactile interactive advertisements. The content of the video consists of two parts:
- The first part describes the haptic rendering principles of the haptic vest and haptic gloves, respectively. (1) The haptic vest video presents the haptic voice coil motors lined up on the haptic undershirt with fire ripples (presenting a sense of heat), wind ripples (presenting a sense of cold), and green waves (presenting a sense of impact). (2) The Haptic Glove introductory video tells viewers to use the Haptic Glove “if you can touch the objects you see in virtual reality” and shows the user switching between lifting with the gloves on and holding an apple in their bare hands. Later, it also introduced the haptic glove through the compressed air bit, using hundreds of tactile brakes to provide power, and this power directly touches the human skin to obtain realistic touch, but also introduced the haptic glove force feedback function. The images are presented with the user’s movements and the objects touched by the bare hand switching between the images.
- The second part describes the actual picture of the operator experiencing the Nissan concept car utilizing the Haptx gloves and VR equipment and the vision seen in the virtual space.
4.3. Measurement
After watching the video, we conducted the survey among these participants through a scale. This procedure is similar with the prior studies of travelers’ VR adoption intention [91] and the diffusion of VR glasses [112], where a few participants had tried VR devices and made their experiences uniform. Despite the fact that a proportion of respondents had not previously encountered tactile interactive advertising, the video employed in this study proved to be a persuasive medium. A 7-point Likert scale ranging from “Totally Disagree = 1” to “Totally Agree = 7” was used for type measurement. Each item of the measure was adapted or used based on an existing validated scale, as shown in Table A1 with 42 question items. Because common method bias (CMB) can negatively affect the validity of the research results, we evaluated the data using Harman’s one-factor test. The results of the principal component factor analysis showed that the first (largest) of the seven factors with eigenvalues greater than 1 accounted for 35.212% of the total, and no factor accounted for more than 50% of the total, indicating that CMB was not a serious problem for the collected dataset.
4.4. Model Estimation
As shown in Table 4, we conducted a normality test using the Kolmogorov–Smirnov and Shapiro–Wilk tests, which showed that these samples did not conform to a normal distribution. The partial least squares’ structural equation model (PLS-SEM) does not assume that the sample data is normally distributed, and is capable of exploring the relationships between latent variables and identifying critical paths [116]. Meanwhile, for the estimation of formative indicators, PLS-SEM is also considered a more recommended method compared to CB-SEM [117]. Therefore, we used SmartPLS 3 to evaluate our proposed model using the PLS algorithm to test the measurement model with a maximum number of 300 iterations and a stopping criterion of . We set 5000 sub-samples and performed PLS bootstrapping, bias correction, and acceleration, and a two-tailed hypothesis test.
Table 4.
Results of the normality test.
The formative second-order structure NFT consists of two indicators aNFT and iNFT as reflective first-order structures according to [15,118]. In this way, our measurement model contains a Type II (reflective–formative) second-order structure [119]. There are three main approaches, i.e., repeated indicator, two-stage, and hybrid approach [120]. For endogenous conformations, it is more appropriate to use two-stage [121]. We adopt the two-stage approach and the steps measuring the first-order reflective structures to obtain the latent variables scores of aNFT and iNFT, and then use the aNFT and iNFT scores in the first stage as explicit variables in the NFT measurement model. The measurement results are detailed in the next section.
5. Results
5.1. Measurement Model
This section presents the measurement model results for the first-order reflective constructs (PE, PU, TEL, PR, COMP, PF, PV, ATT, IU) as well as for the components of the NFT (aNFT as well as iNFT). We also tested the assessment of the second-order formative constructs.
In Table 5, for the first-order constructs, we first measured reliability and convergent validity. The measured Cronbach’s alpha values ranging between 0.796 and 0.929, which is higher than the required critical value of 0.7. composite reliability values ranging between 0.859 and 0.929, and rho_A values ranging from 0.851 to 0.937. For convergent validity, factor loadings, as shown in the bolded portion of Table A2, was as low as 0.515 and as high as 0.923, which are both higher than the criterion value of 0.5, as mentioned in [116], and therefore, we retained all the question items. In addition, the AVE values ranged from 0.632 to 0.823, which is higher than 0.50.
Table 5.
Cronbach’s , rho_A, Composite Reliability, AVE, and Fornell–Larcker criterion.
For the measurement of discriminant validity, three tests were performed, including the Fornell–Larcker criterion, cross-loading, and Heterotrait–Monotrait (HTMT) ratio [122], and all three methods were used in this study. We can see that, as for the Fornell-Larcker criterion, the data in Table 5 demonstrate that the AVE square root exceeds the correlation coefficients for each latent variable. For cross-loading, as shown in Table A2, all indicator loading exceeded the cross loading. For the HTMT ratio in Table 6, it proved that all the constructs were less than the critical value of 0.9, except for ATT and IU which had a value of 0.954. However, according to [122], even an HTMT greater than 1.0 does not quite indicate a lack of discriminant validity. Thus, the discriminant validity of our model is satisfied.
Table 6.
Heterotrait-monotrait (HTMT) ratio.
Thus, it can be said that our measurements of first-order structure are adequate. After obtaining the latent variables scores for aNFT and iNFT and as the explicit variables of NFT, we evaluate the second-order formative structure.
For the second-order formative structure in Table 7, the weight and T-statistic, as well as the VIF were measured, which shows that the weights of aNFT and iNFT were 0.276 (T-Statistic = 3.066, p < 0.01) and 0.812 (T-Statistic = 11.776, p < 0.001), respectively, which were significant. Also, the VIF of each item were less than 5 [123]. So, there is no significant multicollinearity. Combining the above analysis, the second-order structure was established, so hypotheses H2-1a and H2-1b were supported.
Table 7.
NFT measurement model assessment.
5.2. Structural Model
Table 8 reports the results of the path coefficient (), p-value, T-statistic, , and hypothesis testing for the structural model. The hypothesis testing results are shown in Figure 3. Ten of the fourteen hypotheses were confirmed to be significant. The ATT → IU ( = 0.636, T-Statistic = 12.646, p < 0.001), PV→IU ( = 0.194, T-Statistic = 4.045, p < 0.001) were confirmed to be strongly positively correlated with each other and the results supported H1 and H3-1. NFT was similarly positively correlated with IU ( = 0.107, T-Statistic = 2.840, p < 0.01) and H2-2 was confirmed. A strong positive correlation was also shown between PV and ATT ( = 0.764, T-Statistic = 27.992, p < 0.001), and H3-2 was established.
Table 8.
Path coefficients and hypothesis testing.
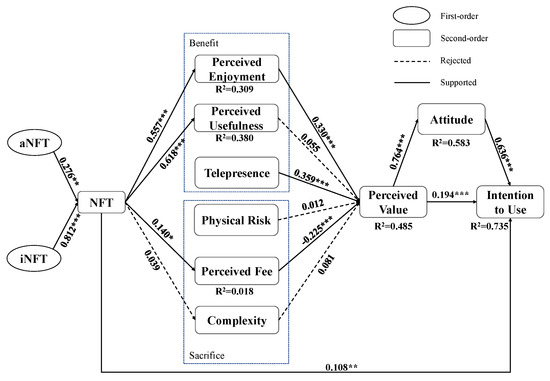
Figure 3.
Structural model results. (Notes: * p < 0.05; ** p < 0.01; *** p < 0.001).
For the hypotheses of the effect of NFT on the four variables, except for NFT → COMP which was not significant, NFT → PE ( = 0.557, T-Statistic = 11.526, p < 0.001), NFT → PU ( = 0.618, T-Statistic = 15.026, p < 0.001) and NFT→PF ( = 0.140, T-Statistic = 2.199, p < 0.05) were found to be significant, thus the results support H4-2a, H4-2b, and H5-2a.
Among the six variables of Benefit and Sacrifice with PV, PE ( = 0.330, T-Statistic = 4.955, p < 0.001), and TEL ( = 0.359, T-Statistic = 6.338, p < 0.001) positively affected PV, which was supported for H4-1a and H4-3. While PF ( = −0.225, T-Statistic = 3.778, p < 0.001) is negatively correlated with PV, COMP and PR in Sacrifice have an insignificant relationship with PV and H5-1a, H5-1b, and H5-3 were rejected.
We used , to evaluate the predictability as shown in Table 9. According to [124] and [125], predictive relevance is present if is greater than 0, whereas strong, moderate, and weak prediction are distinguished by three thresholds of 0.75, 0.50, and 0.25. In addition, greater than 0 is indicative of predictive relevance. As shown in Table 9, ATT ( = 0.583), PV ( = 0.485), and IU ( = 0.735) have a moderate level of predictive accuracy, while is greater than 0, which represents that the model has good predictive ability.
Table 9.
Path coefficients and hypothesis testing.
6. Discussion
6.1. Generate Discussion
The primary objective of this study is to reveal the adoption intention towards tactile interactive advertising from the consumer perspective. In doing so, we utilized the VAM as a research model and provided explanations for RQ1 and RQ2 from the consumer side as well as the technological characteristics of tactile interaction advertising.
The findings confirm that NFT has a direct positive effect on PE and PU in the benefit dimension. In previous studies, Lee et al. have confirmed the positive effect of aNFT on PE, but iNFT negatively affected PE. Because pragmatic and goal-oriented iNFT can dissipate fun due to the inability to perceive tactile sensations in the network [29]. In contrast, Gatter et al. confirmed that aNFT has a positive effect on PU due to the fact that it does not provide a haptic sensation from the point of view of AR functioning, whereas people with higher iNFT tend to believe that only a real touch can help them assess usefulness [25]. In this study, the reason why NFT as a second-order variable has a positive effect on both PE and PU is because haptic technology could compensate for the real sense of touch and complement the tactile needs of people with high iNFT. In addition, NFT had a significant positive effect on PF in the sacrifice dimension, which is the same as [110]. However, for hypothesis H5-2b, the effect of NFT on COMP was not significant, contradicting the results of [29]. As Gatter stated, AR does not provide haptics, and for high NFT consumers, it is still only possible to facilitate imagination through realistic visualization. Therefore, the usage of tactile interactive advertising caters to people with high NFT, where people are immersed in what amounts to live touch, and then ignores the operational complexity of tactile application [25]. Rodrigues et al. reported that people with a higher NFT are more reluctant to shop online shopping due to the lack of tactile information [99]. On the other hand, Kuhn et al. demonstrated that direct touch interfaces can reduce the negative impact of NFT [97]. Tactile interactive advertising utilizes haptic technology as a direct contact interface, resulting in higher usage intention for consumers with a higher NFT. Overall, the above discussion explains RQ1.
For RQ2, the results of the study demonstrate that the perceived value (PV) has a direct and significant effect on the intention to use (IU), i.e., the tactile interactive advertising, thereby validating the Kim’s prediction of value structure on adoption intention [28]. After introducing attitude (ATT), it shows that PV has a positive effect on ATT and ATT also has a positive effect on IU, which is consistent with [103]. Perceived enjoyment (PE) and telepresence (TEL), as part of the benefit factor, have a positive impact on PV, while perceived usefulness (PU) has no significant effect on PV (H4-1b reject). In previous research on VAM, there was a significant positive correlation between PU and PV, except for Yoon’s research which concluded that PU was not significant for PV in the study of AR-based mobile applications [107]. This study reached the same results as [107]. The reason is that tactile interactive advertising, such as AR applications, will be more commonly applied to hedonic usage scenarios. In the descriptive analysis of this study, entertainment is one of the advertising features that people pay more attention to, which also confirms the above view.
As a part of the sacrifice factor, the perceived fee (PF) has a significant negative effect on PV, which is consistent with the conclusions in [28]. Geng et al. proposed that the price barriers of VR devices hinder the acceptance of VR advertising compared with smartphones [126]. Bian et al. revealed that the product price would have a negative effect on the value cognition of high-tech products. At this stage, haptic technology has yet to be popularized and has reached more consumers due to the demand for hardware equipment. The costs and fees for those haptic devices would be attracted, thus reducing the perceived value for this advertising form [127]. We also found that complexity (COMP) had no significant impact on PV, which led to the rejection of the hypothesis H5-1b, while Vishwakarma noted that COMP can have a significant negative effect on PV in VR technology use [91]. This is inconsistent with previous research results. The reasons include the fact that tactile interactive advertising can provide people with an immersive experience. In this process, consumers mainly focus on the enjoyment rather than what effort is put into the experience, which is confirmed by Yersuren et al. in the research into VR [128]. Meanwhile, physical risk (PR) has a nonsignificant effect on PV (H5-3 reject), similarly contradicting the results of [91]. For the perception of PR, it is influenced by other factors such as enjoyment [129], i.e., if the experience of tactile interaction is related to enjoyment, the user is more willing to experience a certain level of discomfort symptoms, in addition to the symptoms of physical discomfort that may be caused by the technology itself. Another reason for COMP and PR being insignificant to PV is that the age of the respondents collected for this study is generally concentrated around 25 years old, an age group that happens to belong to Generation Z. The age of the respondents is not significant to PV, but rather to COMP and PR. Since Generation Z has been exposed to technology from an early age [130], the perception of the complexity and risk of using new technologies is correspondingly low. This finding is also reflected in the study by Rafdinal et al. [131].
Empowered by new technologies, there are two major trends: shifting from sensory integration to experience integration, and one-way communication to interactive communication [132]. In the past, traditional advertising used words, images, videos, symbols, etc., to realize brand value shaping and value symbol abstraction. New technology advertisements (e.g., holographic and VR advertising) will pursue the scene and experience, and bring more diversification through immersive and interactive scenes [84,133]. The usage of new technology advertisements enables users to actively engage with products and services, which enhances their willingness to purchase [133].
6.2. Implications
This study explores consumer intentions to use tactile interactive advertising and fills a research gap in the context of user perceptions of tactile interactive technologies. The theoretical and practical implications are summarized as follows:
For the theoretical implications, we applied modified VAM to explore the usage intention of tactile interactive advertising among consumers. The effects of benefit and sacrifice factors on perceived value are based on the perceived technological characteristics, and their relationships are verified. There is no further theoretical validation of how haptic technology affects the user experience, although a preliminary study developed the haptic experience (HX) model and reported on the various elements of measuring haptic experience [86,134]. In our research, the effects between perceived value and attitude or intention to use are further investigated, and the user acceptance of tactile interactive technology as a new advertising medium is measured. This study also extends the original VAM based on haptic technology features to include two new structures, TEL and PR, and confirms the effectiveness of TEL, which can be considered another extension of the VAM in the application domain of tactile interactive advertising. These findings provide a basis understanding of consumers’ perceptions and acceptance for this emerging advertising form. For the NFT aspect, we construct the second-order formative structure including the first-order reflective structures of aNFT and iNFT. On the one hand, NFT was analyzed as a higher-order variable, which was ignored by past studies that analyzed aNFT and iNFT separately. It has been confirmed that NFT promotes the perception of fun and usefulness and can meanwhile enhance consumers’ willingness to use tactile interactive advertising. The role of NFT on the perceived cost in tactile interactive advertising was also found, i.e., consumers with a higher NFT are more dissatisfied with the cost of tactile interactive advertising. On the other hand, the role of NFT on VAM was further confirmed, in addition to the effect of NFT on TAM [29].
In terms of practical implications, our findings make a strong case for the need to apply and promote tactile interactive advertising in the future, echoing the recommendation that advertisers should implement tactile experiences [13]. Because consumers with a higher NFT are more willing to use tactile interactive advertising, a sense of enjoyment and presence promotes the perceived value even more. In addition, the negative impact of PF on PV suggests that the development of tactile interactive advertising needs to reduce the cost paying for extra devices and interfaces. As an evolution of the haptic interaction technology, there are a variety of information interfaces including encountered-type haptic displays [36], Mid-Air Ultrasound Haptics [5], and Electrotactile Feedback [37], it would be better for advertisers to combine mid-air haptics and display techniques to increase telepresence in the upcoming tactile interactive advertising. The specific types of tactile experiences need to be generated for commodities, which will reduce the aesthetic fatigue among consumers. In terms of advertising content, advertisers need to combine the characteristics of the product and consumer demand to create appropriate advertising scenes. For example, for fabrics (clothing, sofas, etc.), the texture of different fabrics needs to be emphasized, whereas for products with complex functions (e.g., automobiles, home appliances, etc.), the regulation of force feedback should be emphasized and combined with the perception of temperature as well as size and shape. Our findings also provide a direction for future efforts in the development of tactile interactive advertising. For the technology company, it is necessary to enhance the render effect of the sense of touch, while emphasizing the consistency between the haptic sense and the other senses, which will bring better and more realistic haptic experiences for consumers and enhance their telepresence. In terms of the perceived fee, a more feasible leasing model of haptic systems should be considered to reduce the device costs. In addition, to make it accessible to more consumers, the e-commerce companies need to develop suitable tactile interfaces to show the features of products and accelerate the popularization of tactile devices. Undoubtedly, the recovery of haptics restored in the virtual consumption scenario should also be realistic, i.e., close to the touch of real products, which may be the key to make sure that people accept tactile interactive advertising.
7. Conclusions
In this paper, we investigated the perceived value and acceptance to use tactile interactive advertising among consumers with different needs for touch (NFT). On the one hand, we can see that NFT has direct effects on perceived enjoyment (PE), perceived usefulness (PU), and perceived fee (PF) in the benefit and sacrifice dimension as well as the intention to use (IU). The results show that consumers with higher NFT positively impact the PE, PU, and PF of tactile interactive advertising and have a stronger usage intention, which confirms that the consumers’ NFT actually affects their perception and intention to use tactile interactive advertising. Research question 1 can be answered. On the other hand, this study has revealed that the influence of PE, telepresence (TEL), and PF on perceived value (PV), which has no significant relationship with perceived usefulness, physical risk, and complexity. The perception of enjoyment and telepresence can drive the perceived value of tactile interactive advertising, but the high price can dissipate the adoption. PV and attitudes towards tactile interactive advertising significantly impact IU. In this way, the perceived characteristics of tactile interactive advertising that affect consumers’ PV and IU have been revealed. Research question 2 can be answered.
The limitations of this research can be summarized as follows: First, the participants in this survey were mainly from China and the results are not certain to be generalizable to other countries. Second, this study was based on past literature and did not correlate NFT with TEL and PR, and subsequent studies may consider examining the relationships of TEL and PR. Third, the majority of participants were young.
In future work, first, a follow-up study could be conducted to make a side-by-side comparison among different countries, which will reveal the consumers’ adoption intention of tactile interactive advertising from a cross-cultural perspective. Concrete marketing planning will be designed by multinational brands or their advertisers in marketing campaigns. Second, considering the operational complexity of this emerging form of advertising, the middle-aged and elderly groups should be further explored. Compared with the younger generation, the digital divide affects their perceived value and acceptance of tactile interactive advertising. Third, the concrete brand or advertising of products should be focused on. Then, we can design inter-group or intra-group experiments to evaluate the advertising effect. In this way, some practical advice for the niche market will be obtained through the advertising cases.
Author Contributions
Conceptualization, Z.Y.; methodology, Z.Y.; validation, X.Z. and Z.Y.; formal analysis, X.Z.; investigation, X.Z. and Z.Y.; data curation, X.Z. and Z.Y.; Visualization, X.Z. and Z.Y.; writing—original draft preparation, X.Z. and Z.Y.; writing—review and editing, Z.Y.; supervision, Z.Y.; funding acquisition, Z.Y. All authors have read and agreed to the published version of the manuscript.
Funding
This research is part of the Social Science Planning Research Project of Shandong Province, grant number 25CLJJ09.
Institutional Review Board Statement
All the procedures performed in this study involving human participants were in accordance with the ethical standards of the institutional and/or national research committee and in line with the principles of the Declaration of Helsinki and the Ethical Principles of Psychologists & Code of Conduct put forth by the American Psychological Association.
Informed Consent Statement
Informed consent was obtained from all subjects involved in the study.
Data Availability Statement
The online survey data have been presented in this paper and the others are securely protected by the researchers.
Acknowledgments
The APC was funded by Future Plan for Young Scholars of Shandong University.
Conflicts of Interest
The authors declare no conflicts of interest.
Appendix A
Table A1.
Measurement items and their sources.
Table A1.
Measurement items and their sources.
| Constructs | NO. | Item | Source |
|---|---|---|---|
| aNFT | aNFT_1 | When walking through stores, I can’t help touching all kinds of products. | [15] |
| aNFT_2 | Touching products can be fun. | ||
| aNFT_3 | I like to touch products even if I have no intention of buying them. | ||
| aNFT_4 | When browsing in stores, I like to touch lots of products. | ||
| iNFT | iNFT_1 | I place more trust in products that can be touched before purchase. | [15] |
| iNFT_2 | I feel more comfortable purchasing a product after physically examining it. | ||
| iNFT_3 | If I can’t touch a product in the store, I am reluctant to purchase the product. | ||
| iNFT_4 | I feel more confident making a purchase after touching a product. | ||
| PE | PE_1 | Applying tactile interaction into advertisement will be fun. | [22] |
| PE_2 | Applying tactile interaction into advertisement will make life enjoyable. | ||
| PE_3 | Applying tactile interaction into advertisement will improve my happiness. | ||
| PE_4 | Applying tactile advertisement will be enjoyable and satisfying. | [27] | |
| PU | PU_1 | Tactile interactive advertisement makes it easier for me to access product information. | [89] |
| PU_2 | Using tactile interactive advertisement would enhance my understanding of product. | ||
| PU_3 | Using tactile interactive advertisement would enhance my effectiveness. | [135] | |
| PU_4 | I find tactile advertisement is useful. | ||
| TEL | TEL_1 | I like I was in the world the tactile interactive advertisement created. | [90] |
| TEL_2 | I will forget about my immediate surroundings when I watch the tactile interactive advertisement. | ||
| TEL_3 | After watching the tactile interactive advertisement, I felt like I came back to the real world after a journey. | ||
| TEL_4 | If I were actually using tactile interactive advertisement, I would easily visualize what the actual production is like | [136] | |
| COMP | COMP_1 | I feel the procedure of using tactile interaction devices may not be intuitive to me. | [81] |
| COMP_2 | Learning to use tactile interaction devices would be difficult for me. | [89] | |
| COMP_3 | I would find tactile interactive advertisement difficult to use. | ||
| COMP_4 | It would be difficult for me to become skillful at using tactile interaction devices to experience tactile interactive advertisement. | ||
| PF | PF_1 | The price threshold required to experience tactile interactive advertisement is too high for me. | [104] |
| PF_2 | Compared to other existing advertisements, tactile interactive advertisement can bring me financial burden. | ||
| PF_3 | I am not satisfied with the cost of using tactile interactive advertisement. | ||
| PR | PR_1 | I am concerned that using tactile interactive advertisement may cause nausea. | [137] |
| PR_2 | I am concerned that using tactile interactive advertisement may cause dizzy. | ||
| PR_3 | I am concerned that using the tactile interactive advertisement may lead to other uncomfortable physical side effects. | ||
| PR_4 | I am concerned that the use of tactile interactive advertisement may bring long-term chronic health risks. | ||
| PV | PV_1 | Compared to the fee I need to pay, the use of tactile interactive advertisement is worthwhile to me. | [28] |
| PV_2 | Compared to the time I need to spend, the use of tactile interactive advertisement is worthwhile to me. | ||
| PV_3 | Overall, the use of tactile advertisement is worthwhile to me. | ||
| ATT | ATT_1 | It make sense to use tactile interaction into advertising. | [138] |
| ATT_2 | The thought of using tactile interaction is appealing to me. | ||
| ATT_3 | I think the use of tactile interaction for advertisement is a wise choice. | [88] | |
| ATT_4 | I will be satisfied with the application of tactile interaction in advertising. | ||
| IU | IU_1 | I plan to use tactile interactive advertisement in the future. | [28] |
| IU_2 | I intend to use tactile interactive advertisement in the future. | ||
| IU_3 | I predict I would use tactile interactive advertisement in the future. | [89] | |
| IU_4 | I intend to recommend the enjoyable tactile interactive advertisements I think to people around me. |
Table A2.
Cross-factor loading.
Table A2.
Cross-factor loading.
| ATT | COMP | IU | PE | PF | PR | PU | PV | TEL | aNFT | iNFT | |
|---|---|---|---|---|---|---|---|---|---|---|---|
| ATT_1 | 0.856 | −0.094 | 0.740 | 0.649 | −0.055 | −0.057 | 0.635 | 0.645 | 0.576 | 0.438 | 0.505 |
| ATT_2 | 0.868 | −0.096 | 0.778 | 0.682 | −0.039 | −0.069 | 0.593 | 0.656 | 0.598 | 0.418 | 0.464 |
| ATT_3 | 0.885 | −0.169 | 0.700 | 0.617 | −0.205 | −0.171 | 0.490 | 0.689 | 0.553 | 0.446 | 0.390 |
| ATT_4 | 0.886 | −0.182 | 0.728 | 0.634 | −0.130 | −0.131 | 0.563 | 0.681 | 0.602 | 0.445 | 0.429 |
| COMP_1 | −0.093 | 0.893 | −0.075 | −0.066 | 0.531 | 0.505 | −0.036 | −0.112 | −0.081 | −0.006 | 0.095 |
| COMP_2 | −0.076 | 0.643 | −0.034 | −0.028 | 0.374 | 0.448 | −0.081 | 0.017 | 0.060 | 0.047 | 0.049 |
| COMP_3 | −0.181 | 0.915 | −0.165 | −0.110 | 0.577 | 0.564 | −0.075 | −0.148 | −0.195 | −0.051 | 0.027 |
| COMP_4 | −0.127 | 0.771 | −0.094 | −0.099 | 0.454 | 0.527 | −0.097 | −0.065 | −0.021 | 0.009 | 0.013 |
| IU_1 | 0.743 | −0.117 | 0.855 | 0.603 | −0.174 | −0.085 | 0.512 | 0.684 | 0.656 | 0.361 | 0.385 |
| IU_2 | 0.734 | −0.177 | 0.879 | 0.593 | −0.126 | −0.105 | 0.539 | 0.655 | 0.657 | 0.376 | 0.431 |
| IU_3 | 0.686 | −0.084 | 0.833 | 0.602 | −0.041 | −0.047 | 0.623 | 0.559 | 0.561 | 0.420 | 0.494 |
| IU_4 | 0.694 | −0.072 | 0.822 | 0.617 | 0.004 | −0.088 | 0.579 | 0.570 | 0.555 | 0.405 | 0.461 |
| PE_1 | 0.560 | −0.071 | 0.538 | 0.764 | 0.088 | −0.003 | 0.708 | 0.390 | 0.474 | 0.339 | 0.481 |
| PE_2 | 0.581 | −0.046 | 0.604 | 0.865 | −0.013 | −0.048 | 0.604 | 0.503 | 0.561 | 0.325 | 0.421 |
| PE_3 | 0.660 | −0.093 | 0.612 | 0.857 | −0.087 | −0.116 | 0.554 | 0.571 | 0.595 | 0.385 | 0.424 |
| PE_4 | 0.670 | −0.127 | 0.630 | 0.867 | −0.027 | −0.140 | 0.678 | 0.553 | 0.591 | 0.414 | 0.480 |
| PF_1 | −0.028 | 0.569 | −0.006 | 0.067 | 0.885 | 0.569 | 0.151 | −0.115 | −0.085 | 0.034 | 0.183 |
| PF_2 | −0.066 | 0.531 | −0.061 | 0.005 | 0.894 | 0.552 | 0.091 | −0.172 | −0.129 | 0.016 | 0.160 |
| PF_3 | −0.203 | 0.519 | −0.179 | −0.094 | 0.864 | 0.598 | −0.007 | −0.263 | −0.137 | −0.011 | 0.114 |
| PR_1 | −0.112 | 0.556 | −0.071 | −0.111 | 0.586 | 0.856 | −0.038 | −0.106 | −0.032 | −0.051 | 0.057 |
| PR_2 | −0.136 | 0.548 | −0.090 | −0.104 | 0.585 | 0.923 | −0.020 | −0.150 | −0.061 | −0.044 | 0.090 |
| PR_3 | −0.078 | 0.503 | −0.093 | −0.062 | 0.571 | 0.883 | −0.009 | −0.097 | −0.024 | −0.053 | 0.078 |
| PR_4 | −0.090 | 0.505 | −0.084 | −0.052 | 0.552 | 0.842 | −0.031 | −0.104 | −0.020 | −0.063 | 0.041 |
| PU_1 | 0.592 | −0.072 | 0.582 | 0.642 | 0.026 | −0.053 | 0.867 | 0.457 | 0.550 | 0.389 | 0.542 |
| PU_2 | 0.538 | −0.067 | 0.575 | 0.654 | 0.058 | −0.038 | 0.874 | 0.439 | 0.509 | 0.349 | 0.511 |
| PU_3 | 0.564 | −0.062 | 0.548 | 0.674 | 0.067 | −0.011 | 0.842 | 0.408 | 0.528 | 0.386 | 0.523 |
| PU_4 | 0.532 | −0.034 | 0.553 | 0.601 | 0.128 | 0.010 | 0.825 | 0.388 | 0.457 | 0.359 | 0.511 |
| PV_1 | 0.589 | −0.088 | 0.580 | 0.455 | −0.237 | −0.113 | 0.330 | 0.860 | 0.535 | 0.301 | 0.307 |
| PV_2 | 0.673 | −0.146 | 0.628 | 0.524 | −0.188 | −0.129 | 0.424 | 0.883 | 0.525 | 0.368 | 0.404 |
| PV_3 | 0.729 | −0.127 | 0.697 | 0.598 | −0.149 | −0.110 | 0.531 | 0.878 | 0.591 | 0.419 | 0.417 |
| TEL_1 | 0.636 | −0.106 | 0.684 | 0.690 | −0.030 | −0.010 | 0.643 | 0.541 | 0.835 | 0.390 | 0.446 |
| TEL_2 | 0.519 | −0.088 | 0.575 | 0.519 | −0.083 | 0.026 | 0.496 | 0.477 | 0.863 | 0.335 | 0.387 |
| TEL_3 | 0.558 | −0.140 | 0.597 | 0.543 | −0.123 | −0.021 | 0.479 | 0.540 | 0.889 | 0.338 | 0.343 |
| TEL_4 | 0.559 | −0.142 | 0.592 | 0.516 | −0.215 | −0.124 | 0.438 | 0.586 | 0.831 | 0.352 | 0.319 |
| aNFT_1 | 0.439 | −0.006 | 0.420 | 0.390 | 0.012 | −0.062 | 0.372 | 0.402 | 0.400 | 0.909 | 0.528 |
| aNFT_2 | 0.481 | −0.032 | 0.447 | 0.431 | 0.041 | −0.047 | 0.430 | 0.387 | 0.376 | 0.914 | 0.571 |
| aNFT_3 | 0.440 | 0.012 | 0.387 | 0.366 | 0.010 | −0.014 | 0.370 | 0.383 | 0.347 | 0.911 | 0.500 |
| aNFT_4 | 0.451 | −0.072 | 0.409 | 0.399 | −0.020 | −0.088 | 0.402 | 0.350 | 0.382 | 0.897 | 0.538 |
| iNFT_1 | 0.451 | 0.004 | 0.447 | 0.453 | 0.125 | 0.007 | 0.533 | 0.399 | 0.376 | 0.547 | 0.850 |
| iNFT_2 | 0.449 | 0.045 | 0.466 | 0.496 | 0.198 | 0.101 | 0.556 | 0.340 | 0.366 | 0.524 | 0.881 |
| iNFT_3 | 0.295 | 0.116 | 0.266 | 0.239 | 0.028 | 0.099 | 0.228 | 0.288 | 0.317 | 0.346 | 0.515 |
| iNFT_4 | 0.419 | 0.063 | 0.444 | 0.467 | 0.146 | 0.062 | 0.550 | 0.362 | 0.351 | 0.447 | 0.874 |
References
- Jiang, K.; Luo, S.; Zheng, J. Seeing as Feeling? The Impact of Tactile Compensation Videos on Consumer Purchase Intention. Behav. Sci. 2024, 14, 50. [Google Scholar] [CrossRef]
- Sreelakshmi, M.; Subash, T.D. Haptic Technology: A comprehensive review on its applications and future prospects. Mater. Today: Proc. 2017, 4, 4182–4187. [Google Scholar] [CrossRef]
- Sehad, N.; Cherif, B.; Khadraoui, I.; Hamidouche, W.; Bader, F.; Jantti, R.; Debbah, M. Locomotion-Based UAV Control Toward the Internet of Senses. IEEE Trans. Circuits Syst. II Express Briefs 2023, 70, 1804–1808. [Google Scholar] [CrossRef]
- Aijaz, A.; Sooriyabandara, M. The tactile internet for industries: A review. Proc. IEEE 2019, 107, 414–435. [Google Scholar] [CrossRef]
- Rakkolainen, I.; Freeman, E.; Sand, A.; Raisamo, R.; Brewster, S. A Survey of Mid-Air Ultrasound Haptics and Its Applications. IEEE Trans. Haptics 2021, 14, 2–19. [Google Scholar] [CrossRef] [PubMed]
- van Wegen, M.; Herder, J.L.; Adelsberger, R.; Pastore-Wapp, M.; van Wegen, E.E.; Bohlhalter, S.; Nef, T.; Krack, P.; Vanbellingen, T. An Overview of Wearable Haptic Technologies and Their Performance in Virtual Object Exploration. Sensors 2023, 23, 1563. [Google Scholar] [CrossRef] [PubMed]
- MMR, Haptic Technology Market- Industry Analysis and Forecast 2030; MMR: Durban, South Africa, 2024; Available online: https://www.maximizemarketresearch.com/market-report/global-haptic-technology-market/29944/ (accessed on 5 January 2025).
- Innocenti, M.; Bruno, W.; Merighi, S.; Parkula, V.; Jeanneau, F. The Science of Touch in Electronics Haptics, It Used to Be All about Resonant. 2021. Available online: https://epci.eu/wp-content/uploads/2021/10/4_2-PCNS21-KEMET-Film-Haptic-Actuator.pdf (accessed on 10 January 2023).
- Petit, O.; Velasco, C.; Spence, C. Digital Sensory Marketing: Integrating New Technologies Into Multisensory Online Experience. J. Interact. Mark. 2019, 45, 42–61. [Google Scholar] [CrossRef]
- PrintSimple. What Is Haptic Advertising and How Does It Work? Endowment. 2023. Available online: https://www.printsimple.eu/en/hot-off-the-press/what-is-haptic-advertising-and-how-does-it-work (accessed on 11 January 2024).
- Trukhan, T. Exploring the Impact of Haptic Feedback in Phygital Marketing: Enhancing Customer Experiences with Tactile Sensations. 2023. Available online: https://phygitalnew.com/marketing-ideas/haptic-feedback-in-phygital-marketing/#:~:text=Discover%20the%20profound%20impact%20of%20haptic%20feedback%20in,and%20benefits%20of%20haptic%20technology%20in%20this%20article (accessed on 11 January 2024).
- Popovic, N. Tactile Internet in Future Industrial Automation Applications. In Proceedings of the 2022 21st International Symposium Infoteh-Jahorina, Infoteh 2022—Proceedings, East Sarajevo, Bosnia and Herzegovina, 16–18 March 2022; pp. 16–18. [Google Scholar] [CrossRef]
- Mulcahy, R.F.; Riedel, A.S. ‘Touch it, swipe it, shake it’: Does the emergence of haptic touch in mobile retailing advertising improve its effectiveness? J. Retail. Consum. Serv. 2020, 54, 101613. [Google Scholar] [CrossRef]
- Immersion. Study Unveils That TouchSense Ads Lead to 50 Lift in Brand Favorability. 2017. Available online: https://www.immersion.com/study-unveils-touchsense-ads-lead-to-brand-lift/ (accessed on 11 December 2022).
- Peck, J.; Childers, T.L. Individual Differences in Haptic Information Processing: The “Need for Touch” Scale. J. Consum. Res. 2003, 30, 430–442. [Google Scholar] [CrossRef]
- Klatzky, R.L.; Peck, J. Please touch: Object properties that invite touch. IEEE Trans. Haptics 2012, 5, 139–147. [Google Scholar] [CrossRef]
- FasterCapital. Haptic Technology: Tactile Marketing: Strategies for Incorporating Haptic Elements in Campaigns Haptic Technology: Tactile Marketing: Strategies for Incorporating Haptic Elements in Campaigns 1. Introduction to Haptic Technology in Marketing. 2025. Available online: https://fastercapital.com/content/Haptic-technology–Tactile-Marketing–Strategies-for-Incorporating-Haptic-Elements-in-Campaigns.html (accessed on 11 June 2025).
- Anwar, A.; Shi, T.; Schneider, O. Factors of Haptic Experience across Multiple Haptic Modalities. In Proceedings of the Conference on Human Factors in Computing Systems—Proceedings, Hamburg Germany, 23–28 April 2023. [Google Scholar] [CrossRef]
- Lee, H.K.; Choi, D. Can I touch the clothes on the screen? The mental simulation for touch in online fashion shopping. J. Fash. Mark. Manag. 2022, 27, 1–18. [Google Scholar] [CrossRef]
- Wedel, M.; Bigné, E.; Zhang, J. Virtual and augmented reality: Advancing research in consumer marketing. Int. J. Res. Mark. 2020, 37, 443–465. [Google Scholar] [CrossRef]
- Wang, C.L. The Palgrave Handbook of Interactive Marketing; Springer International Publishing: Berlin/Heidelberg, Germany, 2023; pp. 867–891. [Google Scholar] [CrossRef]
- Oh, J.; Yoon, S.J. Validation of Haptic Enabling Technology Acceptance Model (HE-TAM): Integration of IDT and TAM. Telemat. Inform. 2014, 31, 585–596. [Google Scholar] [CrossRef]
- VanKerrebroeck, H.; Willems, K.; Brengman, M. Touching the void: Exploring consumer perspectives on touch-enabling technologies in online retailing. Int. J. Retail Distrib. Manag. 2017, 45, 892–909. [Google Scholar] [CrossRef]
- Limerick, H.; Hayden, R.; Beattie, D.; Georgiou, O.; Müller, J. User engagement for mid-air haptic interactions with digital signage. In Proceedings of the 8th ACM International Symposium on Pervasive Displays, Palermo, Italy, 12–14 June 2019. [Google Scholar] [CrossRef]
- Gatter, S.; Hüttl-Maack, V.; Rauschnabel, P.A. Can augmented reality satisfy consumers’ need for touch? Psychol. Mark. 2022, 39, 508–523. [Google Scholar] [CrossRef]
- Zeithaml., V.A. Consumer Perceptions A Means-End Value: Quality, and Model Synthesis of Evidence. J. Mark. 1988, 52, 2–22. [Google Scholar] [CrossRef]
- Kim, E.; Kyung, Y. Factors Affecting the Adoption Intention of New Electronic Authentication Services: A Convergent Model Approach of VAM, PMT, and TPB. IEEE Access 2023, 11, 13859–13876. [Google Scholar] [CrossRef]
- Kim, H.W.; Chan, H.C.; Gupta, S. Value-based Adoption of Mobile Internet: An empirical investigation. Decis. Support Syst. 2007, 43, 111–126. [Google Scholar] [CrossRef]
- Lee, Y.J.; Yang, S.; Johnson, Z. Need for touch and two-way communication in e-commerce. J. Res. Interact. Mark. 2017, 11, 341–360. [Google Scholar] [CrossRef]
- De Canio, F.; Fuentes-Blasco, M. I need to touch it to buy it! How haptic information influences consumer shopping behavior across channels. J. Retail. Consum. Serv. 2021, 61, 102569. [Google Scholar] [CrossRef]
- Racat, M.; Capelli, S.; Lichy, J. New insights into ‘technologies of touch’: Information processing in product evaluation and purchase intention. Technol. Forecast. Soc. Change 2021, 170, 120900. [Google Scholar] [CrossRef]
- Pino, G.; Amatulli, C.; Nataraajan, R.; De Angelis, M.; Peluso, A.M.; Guido, G. Product touch in the real and digital world: How do consumers react? J. Bus. Res. 2020, 112, 492–501. [Google Scholar] [CrossRef]
- Lee, H.K.; Yoon, N.; Choi, D. The effect of touch simulation in virtual reality shopping. Fash. Text. 2022, 9, 34. [Google Scholar] [CrossRef]
- Chen, C.; Zhang, K.Z.; Chu, Z.; Lee, M. Augmented reality in the metaverse market: The role of multimodal sensory interaction. Internet Res. 2023, 34, 9–38. [Google Scholar] [CrossRef]
- Aijaz, A.; Dohler, M.; Hamid Aghvami, A.; Friderikos, V.; Frodigh, M. Realizing the Tactile Internet: Haptic Communications over Next Generation 5G Cellular Networks. IEEE Wirel. Commun. 2017, 24, 82–89. [Google Scholar] [CrossRef]
- Mercado, V.R.; Marchal, M.; Lecuyer, A. ’Haptics On-Demand’: A Survey on Encountered-Type Haptic Displays. IEEE Trans. Haptics 2021, 14, 449–464. [Google Scholar] [CrossRef]
- Kourtesis, P.; Argelaguet, F.; Vizcay, S.; Marchal, M.; Pacchierotti, C. Electrotactile Feedback Applications for Hand and Arm Interactions: A Systematic Review, Meta-Analysis, and Future Directions. IEEE Trans. Haptics 2022, 15, 479–496. [Google Scholar] [CrossRef]
- Holland, O.; Steinbach, E.; Prasad, R.V.; Liu, Q.; Dawy, Z.; Aijaz, A.; Pappas, N.; Chandra, K.; Rao, V.S.; Oteafy, S.; et al. The IEEE 1918.1 “tactile Internet” standards working group and its standards. Proc. IEEE 2019, 107, 256–279. [Google Scholar] [CrossRef]
- Sharma, S.K.; Woungang, I.; Anpalagan, A.; Chatzinotas, S. Toward Tactile Internet in beyond 5G Era: Recent Advances, Current Issues, and Future Directions. IEEE Access 2020, 8, 56948–56991. [Google Scholar] [CrossRef]
- Li, C.; Li, C.P.; Hosseini, K.; Lee, S.B.; Jiang, J.; Chen, W.; Horn, G.; Ji, T.; Smee, J.E.; Li, J. 5G-Based systems design for tactile internet. Proc. IEEE 2019, 107, 307–324. [Google Scholar] [CrossRef]
- Seeling, P.; Fitzek, F.H. Anticipatory networking: Negative latency for ubiquitous computing. In Proceedings of the 2021 IEEE 18th Annual Consumer Communications and Networking Conference, CCNC 2021, Las Vegas, NV, USA, 9–12 January 2021; pp. 2021–2024. [Google Scholar] [CrossRef]
- Yang, T.H.; Kim, J.R.; Jin, H.; Gil, H.; Koo, J.H.; Kim, H.J. Recent Advances and Opportunities of Active Materials for Haptic Technologies in Virtual and Augmented Reality. Adv. Funct. Mater. 2021, 31, 2008831. [Google Scholar] [CrossRef]
- Huang, Y.; Zhou, J.; Ke, P.; Guo, X.; Yiu, C.K.; Yao, K.; Cai, S.; Li, D.; Zhou, Y.; Li, J.; et al. A skin-integrated multimodal haptic interface for immersive tactile feedback. Nat. Electron. 2023, 6, 1020–1031. [Google Scholar] [CrossRef]
- Noman, M.T.B.; Ahad, M.A.R. Mobile-based eye-blink detection performance analysis on android platform. Front. ICT 2018, 5, 1–11. [Google Scholar] [CrossRef]
- Song, J.; Lim, J.H.; Yun, M.H. Finding the Latent Semantics of Haptic Interaction Research: A Systematic Literature Review of Haptic Interaction Using Content Analysis and Network Analysis. Hum. Factors Ergon. Manuf. 2016, 26, 577–594. [Google Scholar] [CrossRef]
- Felip, F.; Galán, J.; Contero, M.; García-García, C. Touch Matters: The Impact of Physical Contact on Haptic Product Perception in Virtual Reality. Appl. Sci. 2023, 13, 2649. [Google Scholar] [CrossRef]
- Lacki, M.; Rossa, C. Design and Control of a 3 Degree-of-Freedom Parallel Passive Haptic Device. IEEE Trans. Haptics 2020, 13, 720–732. [Google Scholar] [CrossRef]
- Turkseven, M.; De, S.; Jackson, C.D.; Sawhney, M.S. Modeling Haptic Interactions in Endoscopic Submucosal Dissection (ESD). IEEE Trans. Haptics 2022, 15, 603–612. [Google Scholar] [CrossRef]
- Dai, Y.; Xue, Y.; Zhang, J. Human-inspired haptic perception and control in robot-assisted milling surgery. IEEE Trans. Haptics 2021, 14, 359–370. [Google Scholar] [CrossRef]
- Doria, D.; Fani, S.; Giannini, A.; Simoncini, T.; Bianchi, M. Enhancing the Localization of Uterine Leiomyomas through Cutaneous Softness Rendering for Robot-Assisted Surgical Palpation Applications. IEEE Trans. Haptics 2021, 14, 503–512. [Google Scholar] [CrossRef]
- Barontini, F.; Catalano, M.G.; Pallottino, L.; Leporini, B.; Bianchi, M. Integrating Wearable Haptics and Obstacle Avoidance for the Visually Impaired in Indoor Navigation: A User-Centered Approach. IEEE Trans. Haptics 2021, 14, 109–122. [Google Scholar] [CrossRef]
- Espinosa-casta, R.; Medell, H.I. Virtual Haptic Perception as an Educational Assistive Technology: A Case Study in Inclusive Education. IEEE Trans. Haptics 2021, 14, 152–160. [Google Scholar] [CrossRef]
- Abi-Farraj, F.; Pacchierotti, C.; Arenz, O.; Neumann, G.; Giordano, P.R. A Haptic Shared-Control Architecture for Guided Multi-Target Robotic Grasping. IEEE Trans. Haptics 2020, 13, 270–285. [Google Scholar] [CrossRef] [PubMed]
- Senseglove. Procter and Gamble Overview. 2021. Available online: https://www.senseglove.com/cases/procter-and-gamble-health/ (accessed on 11 March 2022).
- Distribution, A.M. Haptic Marketing. 2023. Available online: https://www.adogy.com/terms/haptic-marketing/ (accessed on 11 January 2024).
- MarketScreener. Immersion:Launches Haptic Ad Service Enabling “Touch Effects” in Mobile Video Ads. 2016. Available online: https://in.marketscreener.com/quote/stock/IMMERSION-CORPORATION-9670/news/Immersion-Launches-Haptic-Ad-Service-Enabling-Touch-Effects-in-Mobile-Video-Ads-23322938/ (accessed on 11 October 2022).
- Sweeney, E. Porsche Delivers Car Customization Through New Haptic AD Format. 2018. Available online: https://www.marketingdive.com/news/porsche-delivers-car-customization-through-new-haptic-ad-format/520239/ (accessed on 10 October 2022).
- Senseglove. Driving Car Assembly Line Training Efficiency Using SenseGlove Nova. 2021. Available online: https://www.senseglove.com/cases/volkswagen-commercial-vehicles/ (accessed on 11 October 2022).
- Haptx. Nissan Partners With HaptX To Bring Realistic Touch To Vehicle Design. 2019. Available online: https://haptx.com/nissan-collaboration/ (accessed on 11 October 2022).
- Mulcahy, R.F.; Riedel, A. “Going on a sensory adventure, a touchy subject?”: Investigating haptic technology and consumer adventure orientation. J. Serv. Theory Pract. 2022, 32, 5–29. [Google Scholar] [CrossRef]
- Kim, J.R.; Huang, X.; Fu, L.P.; Chan, S.; Ng, K.; Zhao, C. Demonstration of refinity: An interactive holographic signage for new retail shopping experience. In Proceedings of the CHI Conference on Human Factors in Computing Systems, Glasgow Scotland, UK, 4–9 May 2019; pp. 7–10. [Google Scholar] [CrossRef]
- Shankar, V.; Venkatesh, A.; Hofacker, C.; Naik, P. Mobile marketing in the retailing environment: Current insights and future research avenues. J. Interact. Mark. 2010, 24, 111–120. [Google Scholar] [CrossRef]
- Bolognesi, M.; Strik Lievers, F. How language and image construct synaesthetic metaphors in print advertising. Vis. Commun. 2020, 19, 431–457. [Google Scholar] [CrossRef]
- Cornelio, P.; Velasco, C.; Obrist, M. Multisensory Integration as per Technological Advances: A Review. Front. Neurosci. 2021, 15, 652611. [Google Scholar] [CrossRef]
- Yim, M.; Cicchirillo, V.; Drumwright, M. The impact of stereoscopic three-dimensional (3-D) advertising. J. Advert. 2012, 41, 113–128. [Google Scholar] [CrossRef]
- Zhu, W.; Owen, C.; Li, H.; Lee, J. Personalized in-store e-commerce with the promopad: An augmented reality shopping assistant. Electron. J. -E-Commer. Tools 2004, 1, 1–19. [Google Scholar]
- Li, H.; Daugherty, T.; Biocca, F. The Role of Virtual Experience in Consumer Learning. J. Consum. Psychol. 2003, 13, 395–407. [Google Scholar] [CrossRef]
- Cowan, K.; Spielmann, N.; Horn, E.; Griffart, C. Perception is reality… How digital retail environments influence brand perceptions through presence. J. Bus. Res. 2021, 123, 86–96. [Google Scholar] [CrossRef]
- Steuer, J. Defining Virtual Reality: Dimensions Determining Telepresence. J. Commun. 1992, 42, 73–93. [Google Scholar] [CrossRef]
- De Gauquier, L.; Brengman, M.; Willems, K.; Van Kerrebroeck, H. Leveraging advertising to a higher dimension: Experimental research on the impact of virtual reality on brand personality impressions. Virtual Real. 2019, 23, 235–253. [Google Scholar] [CrossRef]
- Grudzewski, F.; Awdziej, M.; Mazurek, G.; Piotrowska, K. Virtual reality in marketing communication – the impact on the message, technology and offer perception – empirical study. Econ. Bus. Rev. 2018, 4, 36–50. [Google Scholar] [CrossRef]
- Van Kerrebroeck, H.; Brengman, M.; Willems, K. When brands come to life: Experimental research on the vividness effect of Virtual Reality in transformational marketing communications. Virtual Real. 2017, 21, 177–191. [Google Scholar] [CrossRef]
- Wang, M.; Liu, Q.; Zhou, C. Research on interactive advertisement user experience based on VR technology. In Proceedings of the 2021 16th International Conference on Computer Science & Education (ICCSE), Lancaster, UK, 17–21 August 2021; pp. 560–565. [Google Scholar] [CrossRef]
- Kilic, K.; Saygi, M.G.; Sezer, S.O. Exact and heuristic methods for personalized display advertising in virtual reality platforms. J. Ind. Manag. Optim. 2019, 15, 833–854. [Google Scholar] [CrossRef]
- Lin, H.F.; Chen, C.H. Design and application of augmented reality query-answering system in mobile phone information navigation. Expert Syst. Appl. 2015, 42, 810–820. [Google Scholar] [CrossRef]
- Gervautz, M.; Schmalstieg, D. Anywhere Interfaces Using Handheld AR. IEEE Comput. Soc. 2012, 45, 26–31. [Google Scholar] [CrossRef]
- Du, Z.; Liu, J.; Wang, T. Augmented Reality Marketing: A Systematic Literature Review and an Agenda for Future Inquiry. Front. Psychol. 2022, 13, 1–18. [Google Scholar] [CrossRef]
- Rese, A.; Baier, D.; Geyer-Schulz, A.; Schreiber, S. How augmented reality apps are accepted by consumers: A comparative analysis using scales and opinions. Technol. Forecast. Soc. Chang. 2017, 124, 306–319. [Google Scholar] [CrossRef]
- Park, M.; Yoo, J. Effects of perceived interactivity of augmented reality on consumer responses: A mental imagery perspective. J. Retail. Consum. Serv. 2020, 52, 101912. [Google Scholar] [CrossRef]
- Chiu, C.L.; Ho, H.C.; Yu, T.; Liu, Y.; Mo, Y. Exploring information technology success of Augmented Reality Retail Applications in retail food chain. J. Retail. Consum. Serv. 2021, 61, 102561. [Google Scholar] [CrossRef]
- Pantano, E.; Rese, A.; Baier, D. Enhancing the online decision-making process by using augmented reality: A two country comparison of youth markets. J. Retail. Consum. Serv. 2017, 38, 81–95. [Google Scholar] [CrossRef]
- Biswas, D. Sensory Aspects of Retailing: Theoretical and Practical Implications. J. Retail. 2019, 95, 111–115. [Google Scholar] [CrossRef]
- Zhu, Y.; Zhen, T. 3D multi-view autostereoscopic display and its key technologie. In Proceedings of the 2009 Asia-Pacific Conference on Information Processing, Shenzhen, China, 18–19 July 2009; Volume 2, pp. 31–35. [Google Scholar] [CrossRef]
- Tong, G. Holographic Technology Applied in Modern Advertising Design Innovative Thinking. In Proceedings of the 2018 4th International Conference on Education, Management and Information Technology, Changchun, China, 6–7 July 2018; pp. 238–242. [Google Scholar] [CrossRef]
- Lau, C.K.H.; Fai, C.; Chui, R.; Au, N.; Lau, C.K.H. Examination of the adoption of augmented reality: A VAM approach Examination of the adoption of augmented reality: A VAM approach. Asia Pac. J. Tour. Res. 2019, 24, 1005–1020. [Google Scholar] [CrossRef]
- Sathiyamurthy, S.; Lui, M.; Kim, E.; Schneider, O. Measuring Haptic Experience: Elaborating the HX model with scale development. In Proceedings of the 2021 IEEE World Haptics Conference (WHC), Montreal, QC, Canada, 6–9 July 2021. [Google Scholar] [CrossRef]
- Zeithaml, V.A. Antithymocyte globulin reacts with many normal human cell types. Blood 1983, 62, 1047–1054. [Google Scholar] [CrossRef]
- Zhang, M.; Shu, L.; Luo, X.; Yuan, M.; Zheng, X. Virtual reality technology in construction safety training: Extended technology acceptance model. Autom. Constr. 2022, 135, 104113. [Google Scholar] [CrossRef]
- Davis, F.D. Perceived usefulness, perceived ease of use, and user acceptance of information technology. MIS Q. Manag. Inf. Syst. 1989, 13, 319–339. [Google Scholar] [CrossRef]
- Klein, L.R. Creating virtual product experiences: The role of telepresence. J. Interact. Mark. 2003, 17, 41–55. [Google Scholar] [CrossRef]
- Vishwakarma, P.; Mukherjee, S.; Datta, B. Travelers’ intention to adopt virtual reality: A consumer value perspective. J. Destin. Mark. Manag. 2020, 17, 100456. [Google Scholar] [CrossRef]
- Liu, W.; Wu, F.; Awan, T.M. Does product touch affect consumer attitude toward a product? Meta-analysis of effect sizes, moderators, and mediators. Psychol. Mark. 2023, 40, 674–689. [Google Scholar] [CrossRef]
- Vo, K.N.; Le, A.N.H.; Thanh Tam, L.; Ho Xuan, H. Immersive experience and customer responses towards mobile augmented reality applications: The moderating role of technology anxiety. Cogent Bus. Manag. 2022, 9, 2063778. [Google Scholar] [CrossRef]
- Seong, B.H.; Hong, C.Y. Decision-Making in Virtual Reality Sports Games Explained via the Lens of Extended Planned Behavior Theory. Int. J. Environ. Res. Public Health 2023, 20, 592. [Google Scholar] [CrossRef]
- Peck, J.; Childers, T.L. To have and to hold: The influence of haptic information on product judgments. J. Mark. 2003, 67, 35–48. [Google Scholar] [CrossRef]
- Hagger, M.S.; Chatzisarantis, N.L. First- and higher-order models of attitudes, normative influence, and perceived behavioural control in the theory of planned behaviour. Br. J. Soc. Psychol. 2005, 44, 513–535. [Google Scholar] [CrossRef]
- Kühn, F.; Lichters, M.; Krey, N. The touchy issue of produce: Need for touch in online grocery retailing. J. Bus. Res. 2020, 117, 244–255. [Google Scholar] [CrossRef]
- Citrin, A.V.; Stem, D.E.; Spangenberg, E.R.; Clark, M.J. Consumer need for tactile input: An internet retailing challenge. J. Bus. Res. 2003, 56, 915–922. [Google Scholar] [CrossRef]
- Rodrigues, T.; Silva, S.C.; Duarte, P. The value of textual haptic information in online clothing shopping. J. Fash. Mark. Manag. 2017, 21, 88–102. [Google Scholar] [CrossRef]
- Zheng, L.; Bensebaa, F. Need for touch and online consumer decision making: The moderating role of emotional states. Int. J. Retail Distrib. Manag. 2022, 50, 55–75. [Google Scholar] [CrossRef]
- Woodruff, R.B. Customer value: The next source for competitive advantage. J. Acad. Mark. Sci. 1997, 25, 139–153. [Google Scholar] [CrossRef]
- Xia, D.; Yu, L.; Zhang, M.; Zhang, X. Influence of Online Interaction on Consumers’ willingness to the Consumption of Green Products. IOP Conf. Ser. Earth Environ. Sci. 2019, 233, 052032. [Google Scholar] [CrossRef]
- Kim, Y.; Park, Y.; Choi, J. A study on the adoption of IoT smart home service: Using Value-based Adoption Model. Total Qual. Manag. Bus. Excell. 2017, 28, 1149–1165. [Google Scholar] [CrossRef]
- Mathavan, B.; Vafaei-Zadeh, A.; Hanifah, H.; Ramayah, T.; Kurnia, S. Understanding the purchase intention of fitness wearables: Using value-based adoption model. Asia-Pac. J. Bus. Adm. 2022, 16, 101–126. [Google Scholar] [CrossRef]
- Lin, H.F. Influence of Virtual Experience Immersion, Product Control, and Stimulation on Advertising Effects. J. Glob. Inf. Manag. 2021, 30, 1–19. [Google Scholar] [CrossRef]
- Maier, M.; Ebrahimzadeh, A.; Chowdhury, M. The Tactile Internet: Automation or Augmentation of the Human? IEEE Access 2018, 6, 41607–41618. [Google Scholar] [CrossRef]
- Yoon, S.; Oh, J. A theory-based approach to the usability of augmented reality technology: A cost-benefit perspective. Technol. Soc. 2022, 68, 101860. [Google Scholar] [CrossRef]
- Shih, Y.Y.; Fang, K. The use of a decomposed theory of planned behavior to study Internet banking in Taiwan. Internet Res. 2004, 14, 213–223. [Google Scholar] [CrossRef]
- The effect of product touch information and sale proneness on consumers’ responses to price discounts. Psychol. Mark. 2023, 40, 146–168. [CrossRef]
- Lee, S.H.; Workman, J.E. Online Shopping Attitudes, Need for Touch, and Interdependent Self-Construal among Korean College Students. Korea Obs. 2023, 54, 295–320. [Google Scholar] [CrossRef]
- Promwongsa, N.; Ebrahimzadeh, A.; Naboulsi, D.; Kianpisheh, S.; Belqasmi, F.; Glitho, R.; Crespi, N.; Alfandi, O. A Comprehensive Survey of the Tactile Internet: State-of-the-Art and Research Directions. IEEE Commun. Surv. Tutor. 2021, 23, 472–523. [Google Scholar] [CrossRef]
- Herz, M.; Rauschnabel, P.A. Understanding the diffusion of virtual reality glasses: The role of media, fashion and technology. Technol. Forecast. Soc. Chang. 2019, 138, 228–242. [Google Scholar] [CrossRef]
- Breves, P.; Dodel, N. The influence of cybersickness and the media devices’ mobility on the persuasive effects of 360° commercials. Multimed. Tools Appl. 2021, 80, 27299–27322. [Google Scholar] [CrossRef]
- Li, B.; Chen, S.; Zhou, Q. Empathy with influencers? The impact of the sensory advertising experience on user behavioral responses. J. Retail. Consum. Serv. 2023, 72, 103286. [Google Scholar] [CrossRef]
- Halmdienst, N.; Radhuber, M.; Winter-Ebmer, R. Attitudes of elderly Austrians towards new technologies: Communication and entertainment versus health and support use. Eur. J. Ageing 2019, 16, 513–523. [Google Scholar] [CrossRef]
- Joseph, F. Hair, J.; Hult, G.T.M.; Ringle, C.M.; Sage, M.S. A Primer on Partial Least Squares Structural Equation Modeling. Long Range Plan. 2013, 46, 184–185. [Google Scholar] [CrossRef]
- Hair, J.F.; Sarstedt, M.; Hopkins, L.; Kuppelwieser, V.G. Partial least squares structural equation modeling (PLS-SEM): An emerging tool in business research. Eur. Bus. Rev. 2014, 26, 106–121. [Google Scholar] [CrossRef]
- Stacie Petter, D.S.; Rai, A. Specifying Formative Constructs in Information Systems Research. MIS Q. 2007, 31, 623–656. [Google Scholar] [CrossRef]
- Becker, J.M.; Klein, K.; Wetzels, M. Hierarchical Latent Variable Models in PLS-SEM: Guidelines for Using Reflective-Formative Type Models. Long Range Plan. 2012, 45, 359–394. [Google Scholar] [CrossRef]
- Cheah, J.H.; Ting, H.; Ramayah, T.; Memon, M.A.; Cham, T.H.; Ciavolino, E. A Comparison of Five Reflective–Formative Estimation Approaches: Reconsideration and Recommendations for Tourism Research; Springer: Berlin/Heidelberg, Germany, 2019; Volume 53, pp. 1421–1458. [Google Scholar] [CrossRef]
- Ringle, C.M.; Sarstedt, M.; Straub, D.W. A critical look at the use of PLS-SEM in MIS quarterly. MIS Q. Manag. Inf. Syst. 2012, 36, iii. [Google Scholar] [CrossRef]
- Henseler, J.; Ringle, C.M.; Sarstedt, M. A new criterion for assessing discriminant validity in variance-based structural equation modeling. J. Acad. Mark. Sci. 2015, 43, 115–135. [Google Scholar] [CrossRef]
- Kock, N.; Lynn, G.S. Lateral collinearity and misleading results in variance-based SEM: An illustration and recommendations. J. Assoc. Inf. Syst. 2012, 13, 546–580. [Google Scholar] [CrossRef]
- Hair, J.F.; Ringle, C.M.; Sarstedt, M. PLS-SEM: Indeed a silver bullet. J. Mark. Theory Pract. 2011, 19, 139–152. [Google Scholar] [CrossRef]
- Shmueli, G.; Sarstedt, M.; Hair, J.F.; Cheah, J.H.; Ting, H.; Vaithilingam, S.; Ringle, C.M. Predictive model assessment in PLS-SEM: Guidelines for using PLSpredict. Eur. J. Mark. 2019, 53, 2322–2347. [Google Scholar] [CrossRef]
- Geng, Y. Virtual Reality (VR) Advertising Communication Design Based on 3D Wireless Active Visual Sensing. J. Sens. 2022, 2022, 1–9. [Google Scholar] [CrossRef]
- Bian, Y.; Lin, Y. Cognitive Bias Model of High-tech Product Value on Heterogeneous Perception of Innovation Risk by the Public. Procedia Comput. Sci. 2022, 202, 228–243. [Google Scholar] [CrossRef]
- Yersüren, S.; Özel, Ç.H. The effect of virtual reality experience quality on destination visit intention and virtual reality travel intention. J. Hosp. Tour. Technol. 2024, 15, 70–103. [Google Scholar] [CrossRef]
- Liang, C.C. Moderating Effect of Country of Origin to the Evaluation of Cellphones. In HCI in Business, Government and Organizations. eCommerce and Consumer Behavior; Nah, F.F.H., Siau, K., Eds.; Springer: Cham, Switzerland, 2019; Volume 11588, pp. 288–297. [Google Scholar] [CrossRef]
- Zhu, Y.; Li, J.; Han, X.; Wang, R.; Wang, C.; Pu, C. Embracing the Future: Perceived Value, Technology Optimism and VR Tourism Behavioral Outcomes Among Generation Z. Int. J. Hum.-Comput. Interact. 2024, 41, 2337–2351. [Google Scholar] [CrossRef]
- Rafdinal, W.; Wibisono, N.; Setiawati, L. Customer-centric virtual reality applications adoption in the hospitality industry: Adoption model. J. Hosp. Tour. Insights 2024, 7, 1594–1614. [Google Scholar] [CrossRef]
- de Ruyter, K.; Heller, J.; Hilken, T.; Chylinski, M.; Keeling, D.I.; Mahr, D. Seeing with the Customer’s Eye: Exploring the Challenges and Opportunities of AR Advertising. J. Advert. 2020, 49, 109–124. [Google Scholar] [CrossRef]
- Pozharliev, R.; De Angelis, M.; Rossi, D. The effect of augmented reality versus traditional advertising: A comparison between neurophysiological and self-reported measures. Mark. Lett. 2022, 33, 113–128. [Google Scholar] [CrossRef]
- Kim, E.; Schneider, O. Defining Haptic Experience: Foundations for Understanding, Communicating, and Evaluating HX. In Proceedings of the CHI Conference on Human Factors in Computing Systems, Honolulu, HI, USA, 25–30 April 2020; pp. 1–13. [Google Scholar] [CrossRef]
- Sagnier, C.; Loup-Escande, E.; Lourdeaux, D.; Thouvenin, I.; Valléry, G. User Acceptance of Virtual Reality: An Extended Technology Acceptance Model. Int. J. Hum.-Comput. Interact. 2020, 36, 993–1007. [Google Scholar] [CrossRef]
- Fiore, A.M.; Kim, J.; Lee, H.H. Effect of image interactivity technology on consumer responses toward the online retailer. J. Interact. Mark. 2005, 19, 38–53. [Google Scholar] [CrossRef]
- Stone, R.N.; Gronhaug, K. Perceived Risk: Further Considerations for the Marketing Discipline. Eur J Mark. 1993, 27, 39–50. [Google Scholar] [CrossRef]
- Kim, J.H.; Kim, M.; Park, M.; Yoo, J. How interactivity and vividness influence consumer virtual reality shopping experience: The mediating role of telepresence. J. Res. Interact. Mark. 2021, 15, 502–525. [Google Scholar] [CrossRef]


Disclaimer/Publisher’s Note: The statements, opinions and data contained in all publications are solely those of the individual author(s) and contributor(s) and not of MDPI and/or the editor(s). MDPI and/or the editor(s) disclaim responsibility for any injury to people or property resulting from any ideas, methods, instructions or products referred to in the content. |
© 2025 by the authors. Licensee MDPI, Basel, Switzerland. This article is an open access article distributed under the terms and conditions of the Creative Commons Attribution (CC BY) license (https://creativecommons.org/licenses/by/4.0/).