Article

Optimizing Innovation Decisions with Deep Learning: An Attention–Utility Enhanced IPA–Kano Framework for Customer-Centric Product Development

1
Business School, University of Shanghai for Science and Technology, Shanghai 200093, China
2
Higher Vocational and Technical College, Shanghai University of Engineering Science, Shanghai 201620, China
*
Author to whom correspondence should be addressed.
Systems 2025, 13(8), 684; https://doi.org/10.3390/systems13080684
Submission received: 27 March 2025 / Revised: 5 May 2025 / Accepted: 22 May 2025 / Published: 12 August 2025
(This article belongs to the Special Issue Data-Driven Methods in Business Process Management)

Abstract

This study employs deep learning techniques, specifically BERT and Latent Dirichlet Allocation (LDA), to analyze customer satisfaction and attribute-level attention from user-generated content. By integrating these insights with Kano model surveys, we systematically rank attribute preferences and enhance decision-making accuracy. Addressing the explicit attention–implicit utility discrepancy, we extend the traditional IPA–Kano model by incorporating an attention dimension, thereby constructing a three-dimensional optimization framework with eight decision spaces. This enhanced framework enables the following: (1) fine-grained classification of customer requirements by distinguishing between an attribute’s perceived salience and its actual impact on satisfaction; (2) strategic resource allocation, differentiating between quality enhancement priorities and cognitive expectation management to maximize innovation impact under resource constraints. To validate the model, we conducted a case study on wearable watches for the elderly, analyzing 12,527 online reviews to extract 41 functional attributes. Among these, 14 were identified as improvement priorities, 9 as maintenance attributes, and 7 as low-priority features. Additionally, six cognitive management strategies were formulated to address attention–utility mismatches. Comparative validation involving domain experts and consumer interviews confirmed that the proposed IPAA–Kano model, leveraging deep learning, outperforms the traditional IPA–Kano model in classification accuracy and decision relevance. By integrating deep learning with optimization-based decision models, this research offers a practical and systematic methodology for translating customer attention and satisfaction data into actionable innovation strategies, thus providing a robust, data-driven approach to resource-efficient product development and technological innovation.

1. Introduction

Value co-creation, as proposed in service-oriented logic [1], is an open innovation process that integrates knowledge, information, and skills through multi-agent participation, enabling entities to achieve sustainable competitive advantages [2]. Among these actors, customers play a dual role, as a key driver of innovation and a source of competitive advantage for enterprises [3]. The concept of user-centered design (UCD) [4] and participatory design across fields, including gerontechnology [5,6], exemplifies this trend by focusing on users’ needs.
With the increasing pace of global aging, elderly care has become both essential and increasingly important. Gerontechnology plays a critical role in improving the quality of life for older adults and their caregivers. However, older adults are generally perceived as less inclined to adopt new technologies compared to younger populations [7,8,9], and barriers to gerontechnology acceptance among this demographic remain persistent [10]. Research has highlighted that technology usability, user-friendliness, and social influences are significant predictors of gerontechnology acceptance [11]. Additionally, product and technical attributes are key determinants of adoption among elderly users [12]. Effective systems for promoting gerontechnology adoption should integrate both products and services to facilitate acceptance [13]. These factors are essential for advancing gerontechnology innovations aimed at improving acceptance and enhancing the quality of life for the elderly.
However, which technical characteristics should be improved, and how can innovation opportunities in gerontechnology be effectively identified? Few studies focus on identifying innovation opportunities and decision-making for attribute-level improvements from the perspective of user needs and market characteristics. Therefore, it is essential to adopt the philosophy of value co-creation for technological innovation by leveraging user-generated content (UGC), particularly electronic word-of-mouth (e-WOM), which reflects customer needs and satisfaction.
Researchers have analyzed user satisfaction through online reviews, with positive reviews reflecting customer satisfaction and negative reviews indicating dissatisfaction [14,15]. Aspect-based sentiment analysis (ABSA) is a crucial task in this domain, focusing on identifying user sentiment regarding specific aspects of an entity in text, where the aspect represents any characteristic or attribute of that entity [16]. Attribute extraction and attribute sentiment computation are the two subtasks involved in attribute-level sentiment analysis [17]. As for the attribute extraction task, research indicates that LDA [18] is widely recognized as an effective method for identifying product and service attributes from online reviews [19,20].
The task of sentiment computing can be handled by traditional methods, such as dictionary-based methods [21,22] and rule-based methods [23]. Machine learning methods [24], including deep learning methods [25,26], are developed with the tendency to use a convolutional neural network. With the advent of large models, pre-trained language models such as BERT [27] perform particularly well on ABSA tasks. These models are pre-trained on large-scale corpora and can then be fine-tuned to specific ABSA tasks.
For analyzing customer needs, the Kano model has been extensively adopted across industries as a reliable tool for understanding customer preferences [28,29,30]. Additionally, Kuo et al. [31] introduced the IPA–Kano model [32,33], which combines Importance–Performance Analysis and the Kano model to categorize service quality attributes and prioritize strategies accordingly.
While analyzing user-generated content in the context of technology products, we observe that attributes frequently discussed by consumers (e.g., exterior design) often have limited actual influence on user satisfaction. This reveals a misalignment between explicit attention and implicit utility, an inconsistency largely overlooked by traditional evaluation models such as IPA or Kano.
Drawing on the service gap theory [34], such mismatches can be attributed to cognitive distortions or incomplete market feedback mechanisms, which prevent decision-makers from accurately interpreting what truly drives satisfaction. This phenomenon becomes especially critical in resource-constrained decision contexts such as aging services, where misallocating effort to low-utility but high-attention attributes may hinder well-being outcomes.
To address this issue, we propose the IPAA–Kano model, an extension of IPA–Kano, which integrates an attention dimension to explicitly capture the perceptual salience of attributes. This three-dimensional framework enable the following: (1) fine-grained classification of attributes by aligning perceived attention with actual satisfaction impact; (2) dual-pathway decision strategies—either improving attribute quality or managing user perception—to resolve the attention–utility paradox.
To implement this model effectively, we employ a hybrid NLP pipeline leveraging LDA topic modeling, expert review, API-based sentiment labeling, and BERT-based sentiment evaluation—balancing automation with interpretability to support objective, scalable decision-making.
The contributions of this study are threefold: (1) Extension of the IPA–Kano framework. This study extends the traditional IPA–Kano model by introducing an attention dimension, enabling a three-dimensional framework that distinguishes between perceived salience and the actual utility of product attributes. This addresses the previously overlooked explicit attention–implicit utility inconsistency, resulting in a more nuanced, real-world-aligned decision-making model across eight defined decision spaces. (2) A practical analytical pipeline for attention-aware evaluation. By combining topic modeling (LDA), transformer-based sentiment evaluation (BERT), and expert validation, we introduce a semi-automated process to identify and label product attributes for fine-grained analysis. (3) Real-world application to wearable technology for the elderly. Applying the framework to 41 product attributes of elderly smartwatches, we demonstrate its effectiveness in prioritizing improvement strategies and uncovering overlooked but valuable features. This offers practical guidance for resource-optimized innovation design.

2. Methodology

2.1. Proposal of an Enhanced IPA–Kano Model

2.1.1. Challenges Brought by the “Explicit Attention–Implicit Utility Misalignment” Phenomenon to the IPA–Kano Model

The service gap theory [34] states that a perception gap—where firms fail to accurately identify customer needs due to inadequate market research or distorted information transfer—can lead to lower service quality and satisfaction.
With the increasing availability of online review data, we observe that the frequency of discussion or attention given to a product attribute does not always align with its actual impact on satisfaction—a phenomenon we term “explicit attention–implicit utility misalignment”. For example, the design aesthetics of a technology product may receive frequent mentions in reviews, yet its actual contribution to user satisfaction may be minimal.
This misalignment poses a critical challenge in customer needs classification: should firms improve the attribute’s quality or manage customer perception more effectively? Traditional IPA–Kano models neither account for nor address this issue. Given limited resources, precisely identifying the demand categories of different product attributes and implementing targeted response strategies is essential for effective decision-making.

2.1.2. Differentiating Attention and Importance

In previous IPA studies, “attention” has been used to reflect the relative “importance” of attributes based on how frequently they are mentioned in customer narratives, particularly in critical incident surveys [35]. These studies typically equate higher mention rates with greater importance.
However, in our study, which integrates IPA with the Kano model, we argue that such an equivalence between attention and importance can be misleading. Specifically, we distinguish between importance, derived from structured Kano surveys with a representative sample, capturing the psychological weight of attributes in shaping customer satisfaction, and attention, extracted from unstructured user-generated content (UGC), reflecting the public salience or visibility of an attribute based on mention frequency—but not necessarily its functional or psychological contribution to customer satisfaction.
This distinction is critical: users may devote high attention to certain attributes (e.g., because they are novel or controversial) even if those attributes do not significantly affect their overall satisfaction. Conversely, they may overlook attributes that are in fact essential drivers of satisfaction. This phenomenon, stated in Section 2.1.1 as “explicit attention–implicit utility misalignment”, illustrates the misalignment between what consumers focus on and what truly drives their satisfaction.
To operationalize this distinction in our model, attention is measured as the proportion of reviews mentioning a given attribute [14], as shown in Formula (1).   A i represents the attention of the attribute i , n i represents the number of reviews containing the attribute i , and M represents the total number of reviews. A higher value of A i indicates that the attribute is more frequently mentioned by customers.
A i = n i M
Importance is calculated from the Kano model based on satisfaction-related evaluations [36], as shown in Formula (2). The meaning of M, O, A, I, R, and Q represents the proportions of “Must-be”, “One-dimensional”, “Attractive”, “Indifferent”, “Reverse”, and “Doubtful” responses, respectively, in the Kano questionnaire.
I m p o r t a n c e = 5 M + 3 O + 1 A + 0 I A + O + M + I + R + Q
This dual-dimensional approach enables us to identify hidden or misaligned attributes—such as those with high attention but low satisfaction impact, or vice versa—thus enhancing the explanatory power of the traditional IPA–Kano framework and enabling the discovery of latent consumer priorities that might otherwise remain concealed.

2.1.3. Redefining Need Categories Based on the “Explicit Attention–Implicit Utility Misalignment”

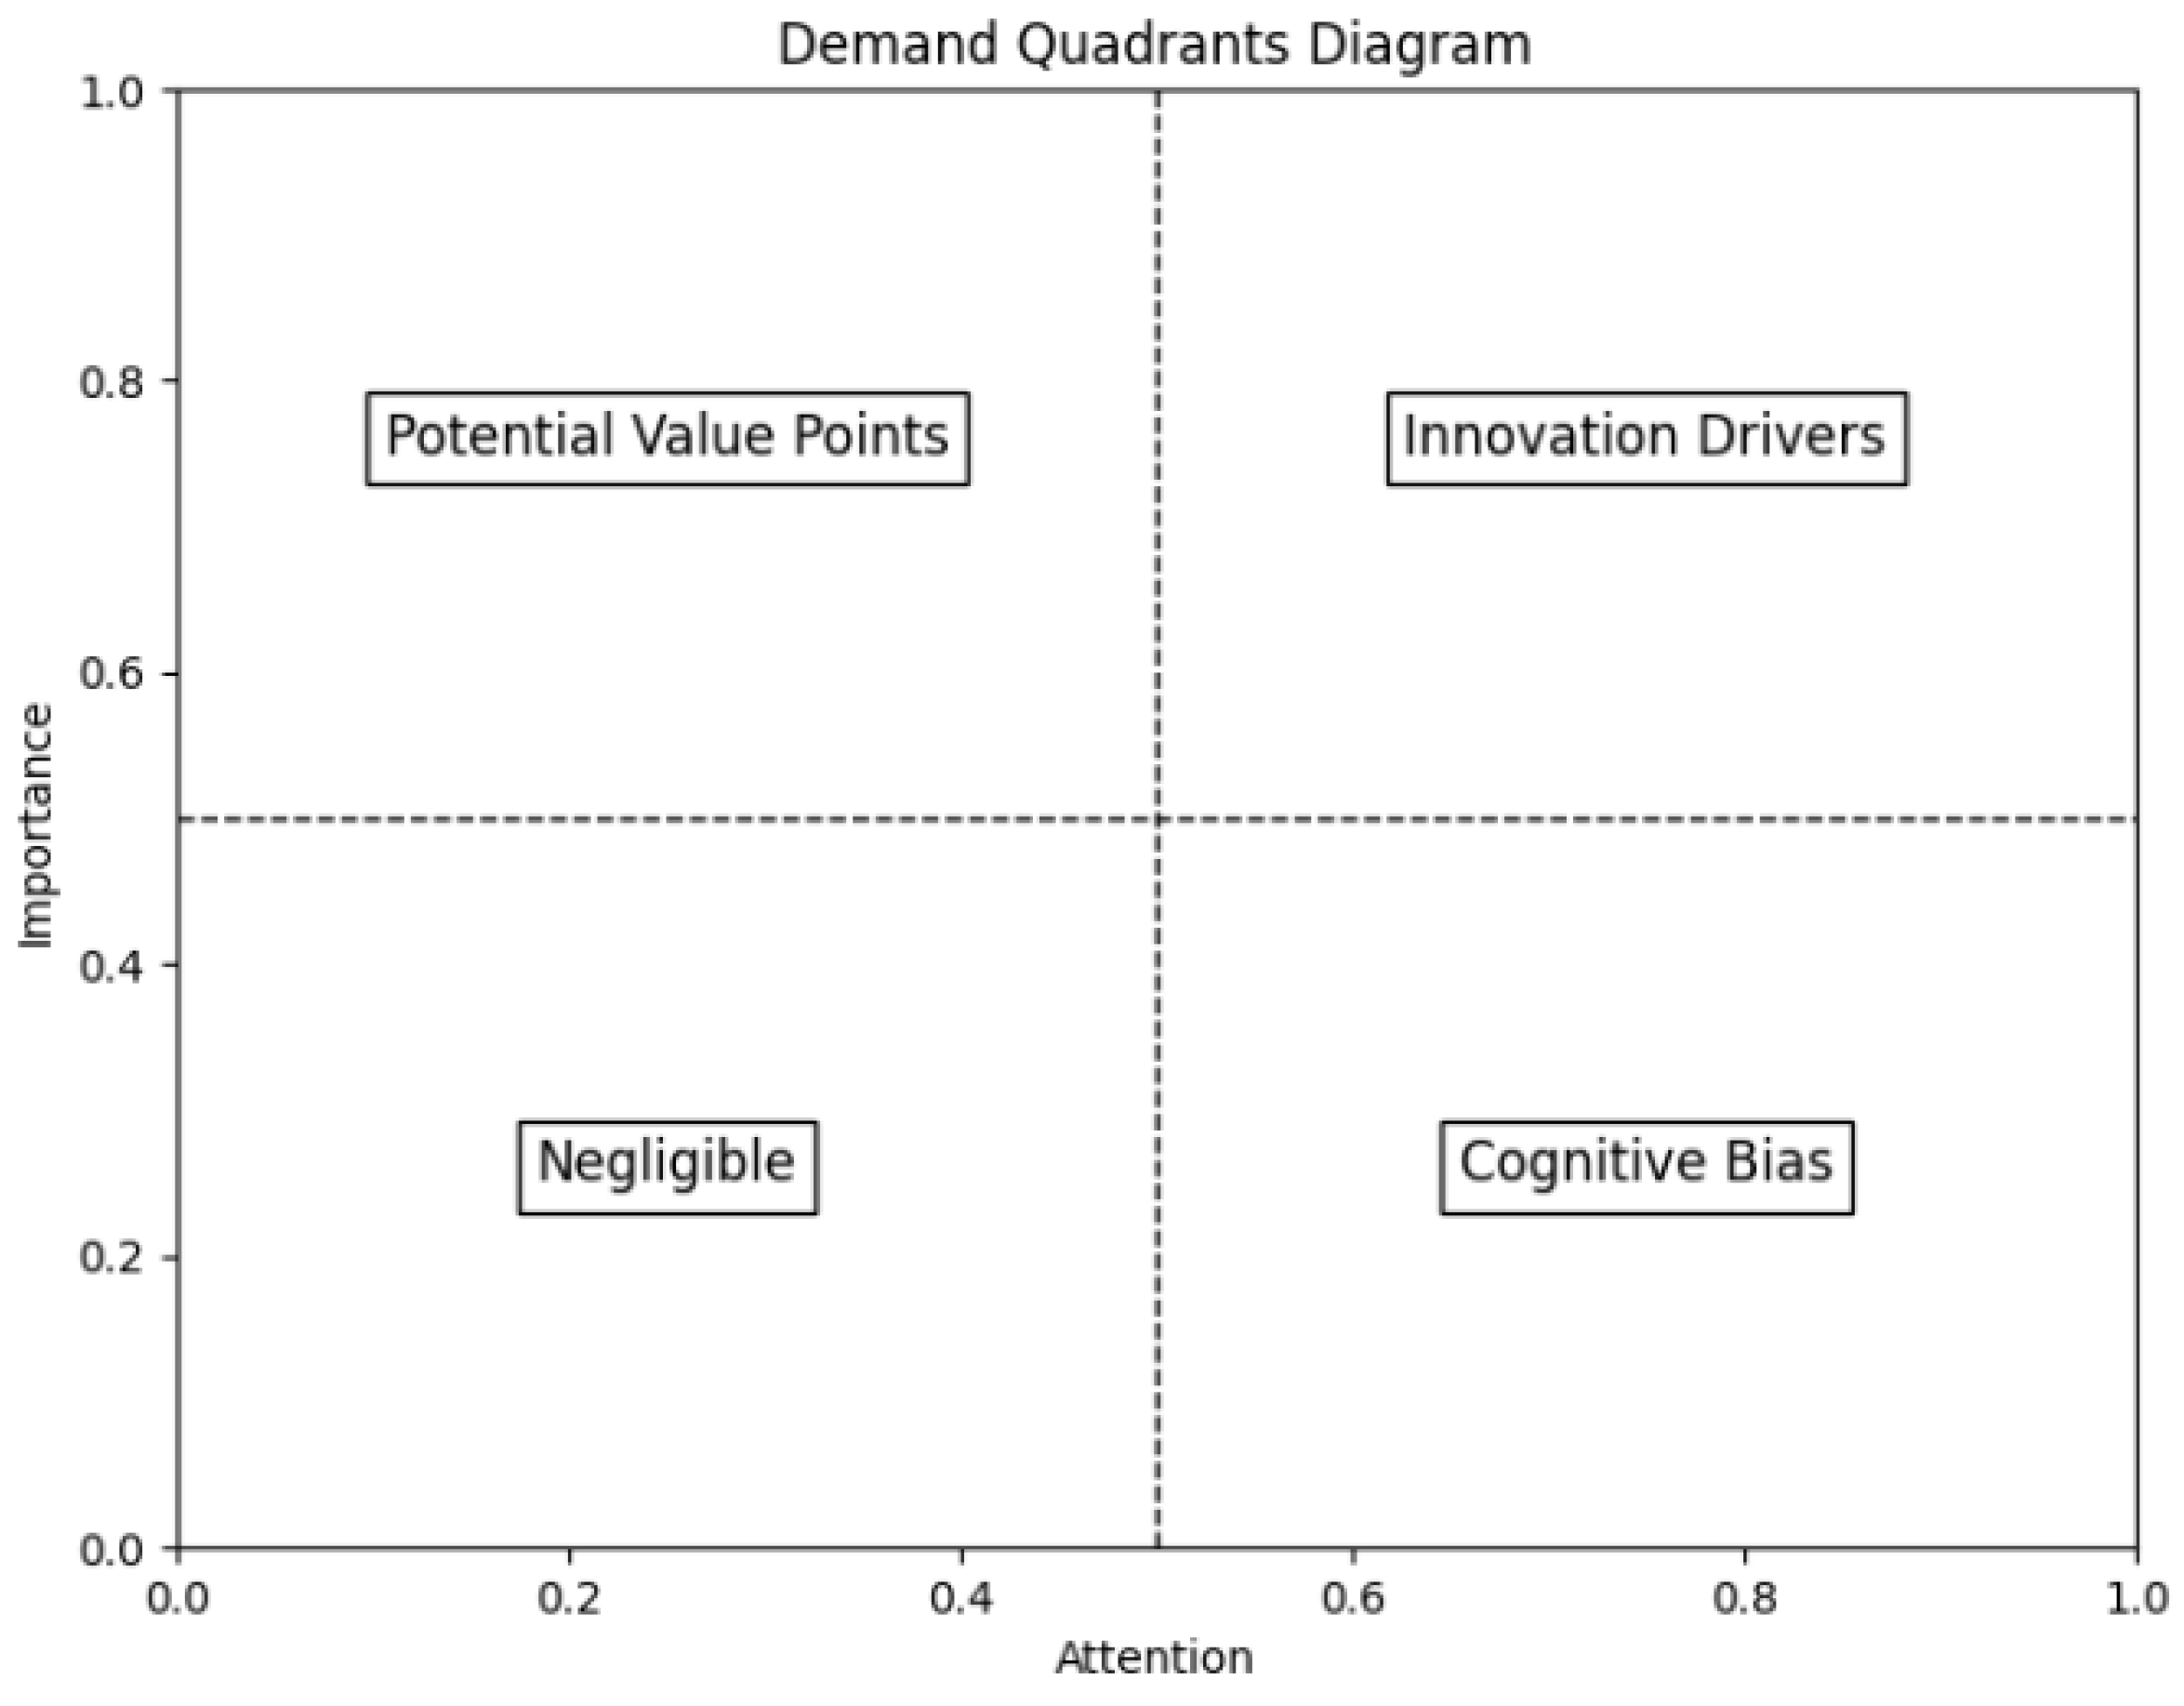
To identify such misalignments, we propose a more precise classification of customer needs. Attributes with high attention but low contribution to satisfaction are defined as “Cognitive Bias” which require cognitive management. Attributes with low attention but high contribution to satisfaction are defined as “Potential Value Points” which are marketing optimization targets. Attributes with high attention and high contribution to satisfaction are classified as “Innovation Drivers”, which act as key breakthrough features. Attributes with low attention and low contribution to satisfaction are categorized as “Negligible” which need resource optimization. This classification framework is illustrated in Figure 1.
At the operational level, we adopt a two-dimensional quadrant-based classification using the median values of attention and satisfaction scores across all attributes as the splitting thresholds. Among the methods used to determine value points for constructing the two-dimensional grid that divides the matrix into four quadrants, the data-centered quadrant approach [37] is the most frequently applied [38,39,40,41] approach. We choose the medians of the values as the dividing lines for their high discriminative power and generalizability.
Building on the IPA–Kano model, we introduce the attention dimension to construct the three-dimensional IPAA–Kano decision model, forming eight decision spaces, as shown in the Table 1. The abbreviations HP, HI, and HA represent high performance, high importance, and high attention, respectively, while LP, LI, and LA refer to low performance, low importance, and low attention, respectively.
Accordingly, three corresponding strategies were developed for the identified attribute demand classifications: 1. Enhancing product quality. Strengthen market education to increase user awareness of high-utility, low-attention features. 2. Cognitive management. Mitigate cognitive bias in high-attention, low-utility features through UI design and marketing guidance. 3. Smart selection. Simplify or optimize low-attention, low-utility features to reduce unnecessary product complexity.
Particularly, beyond identifying improvement and maintenance priorities, as addressed by the IPA–Kano model, this study proposes cognitive management strategies for different types of attention–utility misalignment: 1. High perceived importance, low attention, high satisfaction—enhance attribute exposure and consumer education to align perception with actual satisfaction. 2. High perceived importance, low attention, low satisfaction—avoid premature exposure until significant improvements are made; then, increase visibility and guide consumer attention. 3. Low perceived importance, high attention, high satisfaction—leverage early-stage exposure to attract attention, followed by consumer education to shift focus toward core needs. 4. Low perceived importance, low attention, low satisfaction—prioritize omission, as these attributes offer limited value.

2.1.4. Definition of the Improvement Coefficient

To dynamically assess the degree of attribute satisfaction and the fulfillment of technology products from a market perspective, we define the improvement coefficient as follows, where w i and w j represent the decision weight according to a specific standard. Both the importance and attention variables are normalized using the min–max normalization method.
P = w i × I m p o r t a n c e _ n o r m a l i z e d S a t i s f a c t i o n + w j × A t t e n t i o n _ n o r m a l i z e d S a t i s f a c t i o n
First, assess customer demand preference using the Kano model. Next, evaluate market entities’ judgment on importance, satisfaction, and attention. Then, create the IPA quadrant analysis for each P-dimension. Finally, prioritize improvements or maintenance for each quadrant based on the improvement coefficient (P).

2.2. Clarifying the Remaining Variables in the Enhanced IPA–Kano Model

2.2.1. Definition of Preference Dimensions

The Kano model is widely used for classifying and prioritizing user needs, capturing the nonlinear relationship between product performance and user satisfaction. It categorizes product or service quality into five types: necessary attributes, desired attributes, attractive attributes, indifferent attributes, and reverse attributes [29]. The Kano model questionnaire consists of two pairs of questions: positive (functional, when the attribute is present) and negative (dysfunctional, when the attribute is absent). Each question is rated on a five-point scale: like very much, must-be, neutral, live-with, and dislike very much, abbreviated as like, necessary, neutral, unnecessary, and dislike. Attribute preferences are categorized based on the Kano survey, as summarized in Table 2.

2.2.2. Definition of Satisfaction Dimensions

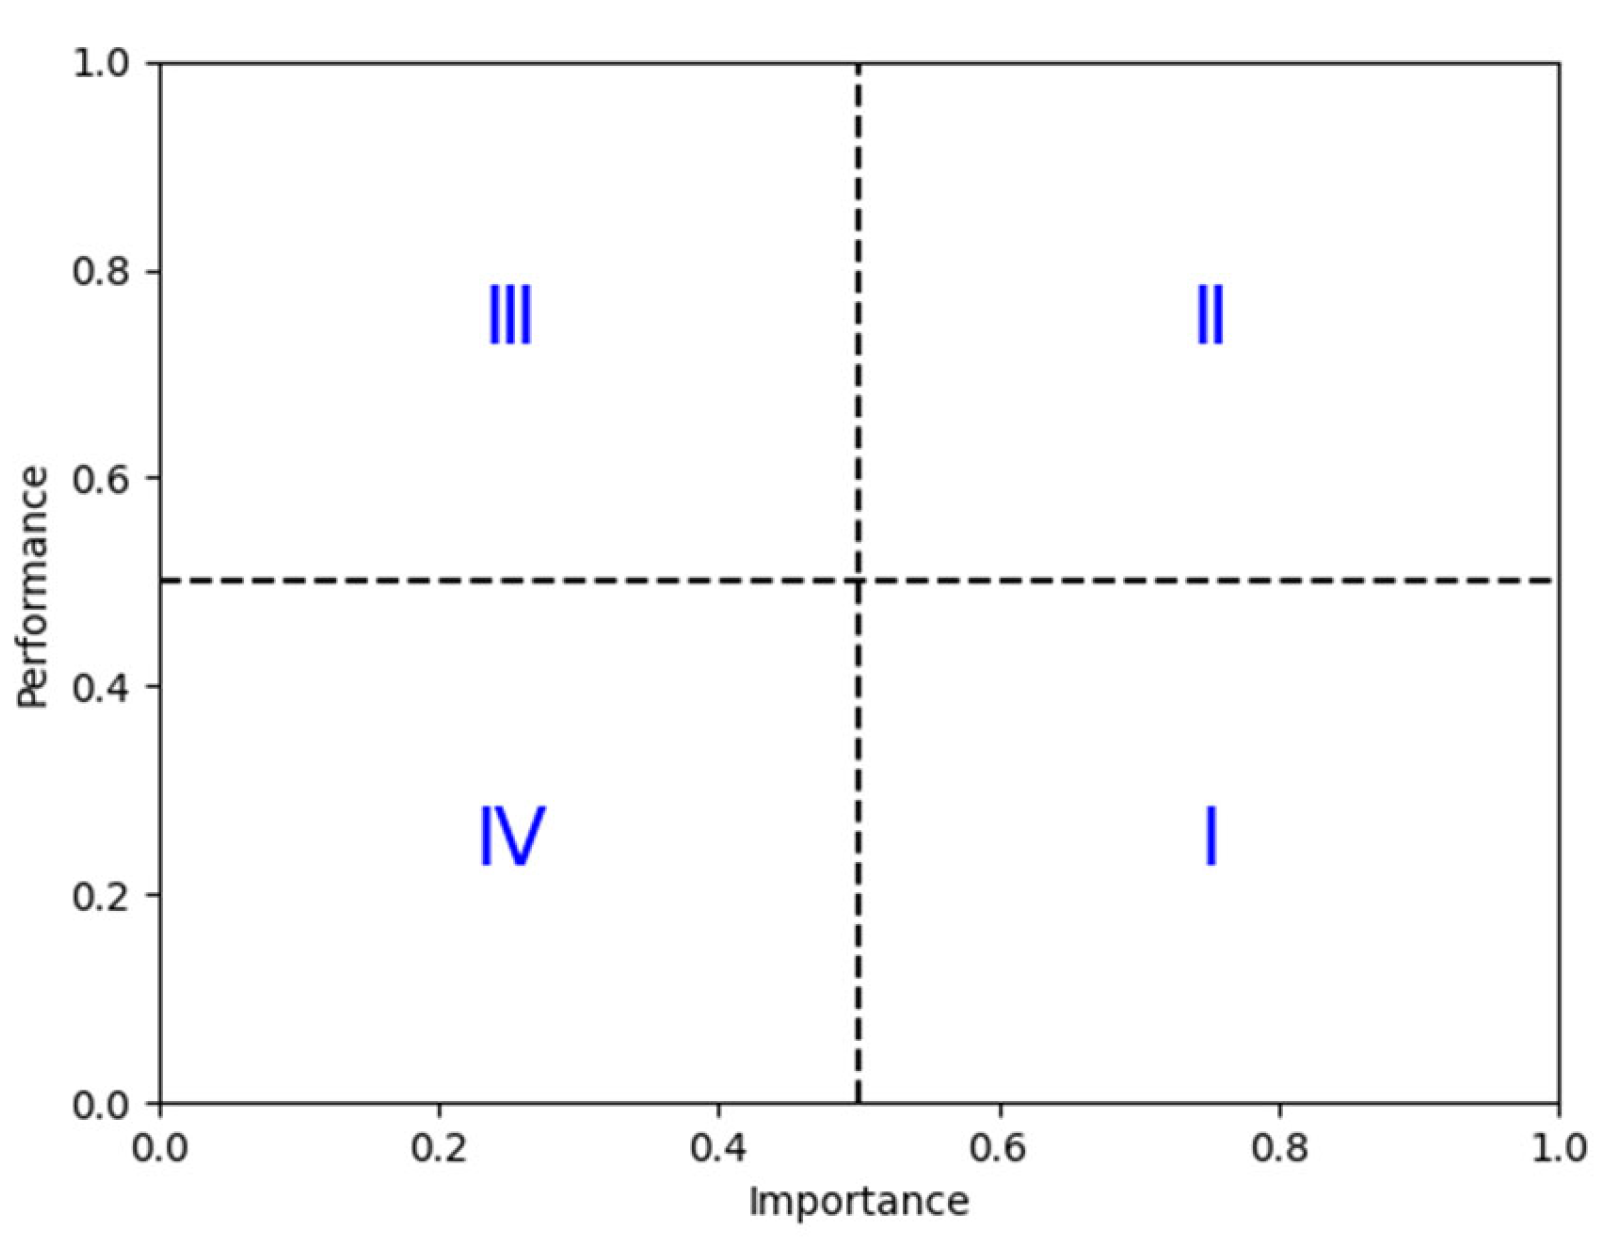
IPA (Importance–Performance Analysis), introduced by Martilla et al. (1977) [42], utilizes a two-dimensional matrix of importance and performance to identify areas for improvement that can enhance productivity or increase customer satisfaction, as shown in Figure 2.
In this study, the average proportion of positive sentiment in each review mentioning a specific attribute is used to measure satisfaction (i.e., attribute performance), as shown in Formula (4) [15]. Specifically, for attribute i , let n i denote the number of online reviews that mention it. S i represents the satisfaction of the attribute i . In the j -th review containing the attribute i , F j _ p o s ,   F j _ n e g , and F j _ n e u , respectively, represent the positive, negative, and neutral sentiment scores associated with attribute i . These scores are normalized by the total sentiment strength in the review. The larger the value of S i , the more positive the consumer sentiment toward attribute i , indicating a higher level of satisfaction.
S i = 1 n i j = 1 n i F j _ p o s F j _ p o s + F j _ n e g + F j _ n e u

2.3. Methodological Pipeline of the Enhanced IPA–Kano Model

2.3.1. Data Sources: A Decoupled, Yet Complementary Integration of Surveys and UGC

In the Kano model, the importance derived from survey data is based on subjective ratings. In contrast, UGC data reflects customer behavior, offering greater objectivity and real-time dynamics. However, scholars have noted that UGC suffers from self-selection bias [43], which limits its representativeness and introduces potential sampling distortion. We explicitly acknowledge this representativeness gap and address it by integrating both data sources in a complementary and methodologically transparent manner.
Specifically, survey data—based on a representative sample—is used solely to calculate the “importance” variable in both the Kano and IPA models. UGC, in contrast, is used only to measure “attention” and “performance” (i.e., satisfaction), ensuring a clear separation between data sources across variables.
To enhance the breadth and relevance of UGC, we collected review data from multiple platforms, product categories, and time periods. This diversified sampling strategy increases the representativeness of UGC.
Accordingly, the Kano-based attribute classification provides a population-representative foundation, upon which UGC-based measurements of attribute satisfaction and attention are used for real-time dynamic monitoring. The two data types are used in a decoupled, yet complementary manner, enabling UGC to serve as a rapid exploratory layer in a convenience sampling manner within a representativeness-aware framework. The limited representativeness of UGC is inherently a trade-off for its strengths in efficiency, timeliness, and content richness. By explicitly acknowledging the representativeness gap and integrating survey data as a corrective baseline, this trade-off is managed in a scientifically controlled and transparent manner.

2.3.2. Modular Method Integration: Hybrid Attribute-Based Sentiment Evaluation Framework

To perform attribute-level sentiment evaluation, we first employed Latent Dirichlet Allocation (LDA) as an unsupervised topic modeling technique to extract latent attributes from user-generated reviews. This approach enables the automatic discovery of high-frequency and semantically coherent attribute candidates without relying on predefined keywords or subjective assumptions.
Firstly, following the LDA-based extraction, we invited domain experts to conduct a qualitative review and validation of the LDA output, including both topic terms and their representative review samples. Through expert evaluation, we refined and finalized a set of interpretable and representative product attributes.
Next, based on the validated attribute set, we retrieved corresponding review segments that mentioned each attribute and conducted sentiment annotation for these segments. Instead of relying solely on manual labeling or sentiment lexicons, we utilized the DeepSeek API—a large language model with strong contextual comprehension capabilities—to semi-automatically label the sentiment polarity (positive, neutral, negative) of the attribute-related reviews. This semi-automatic annotation approach provided a balanced trade-off between efficiency and consistency, especially in handling the large-scale and context-rich nature of user reviews.
Subsequently, we fine-tuned a pre-trained BERT model using the annotated dataset, enabling it to perform sentiment evaluation with attribute-level granularity. The BERT model captured nuanced expressions and contextual cues, which traditional rule-based or shallow machine learning models often fail to address. Finally, we applied the fine-tuned BERT model to the full review corpus to obtain sentiment distributions for each attribute, offering a detailed and robust basis for downstream analysis.
This hybrid framework—combining unsupervised attribute discovery, expert validation, semi-automatic labeling via a generative language model, and deep contextual sentiment classification—offers both interpretability and scalability. Compared to conventional sentiment analysis pipelines that rely solely on pre-defined attributes or sentence-level classification, our approach achieves more fine-grained and data-driven insights while maintaining robustness and generalizability across domains.

2.3.3. Outcome Integration: Strategic Fusion of Attribute Sentiment and Kano Classification

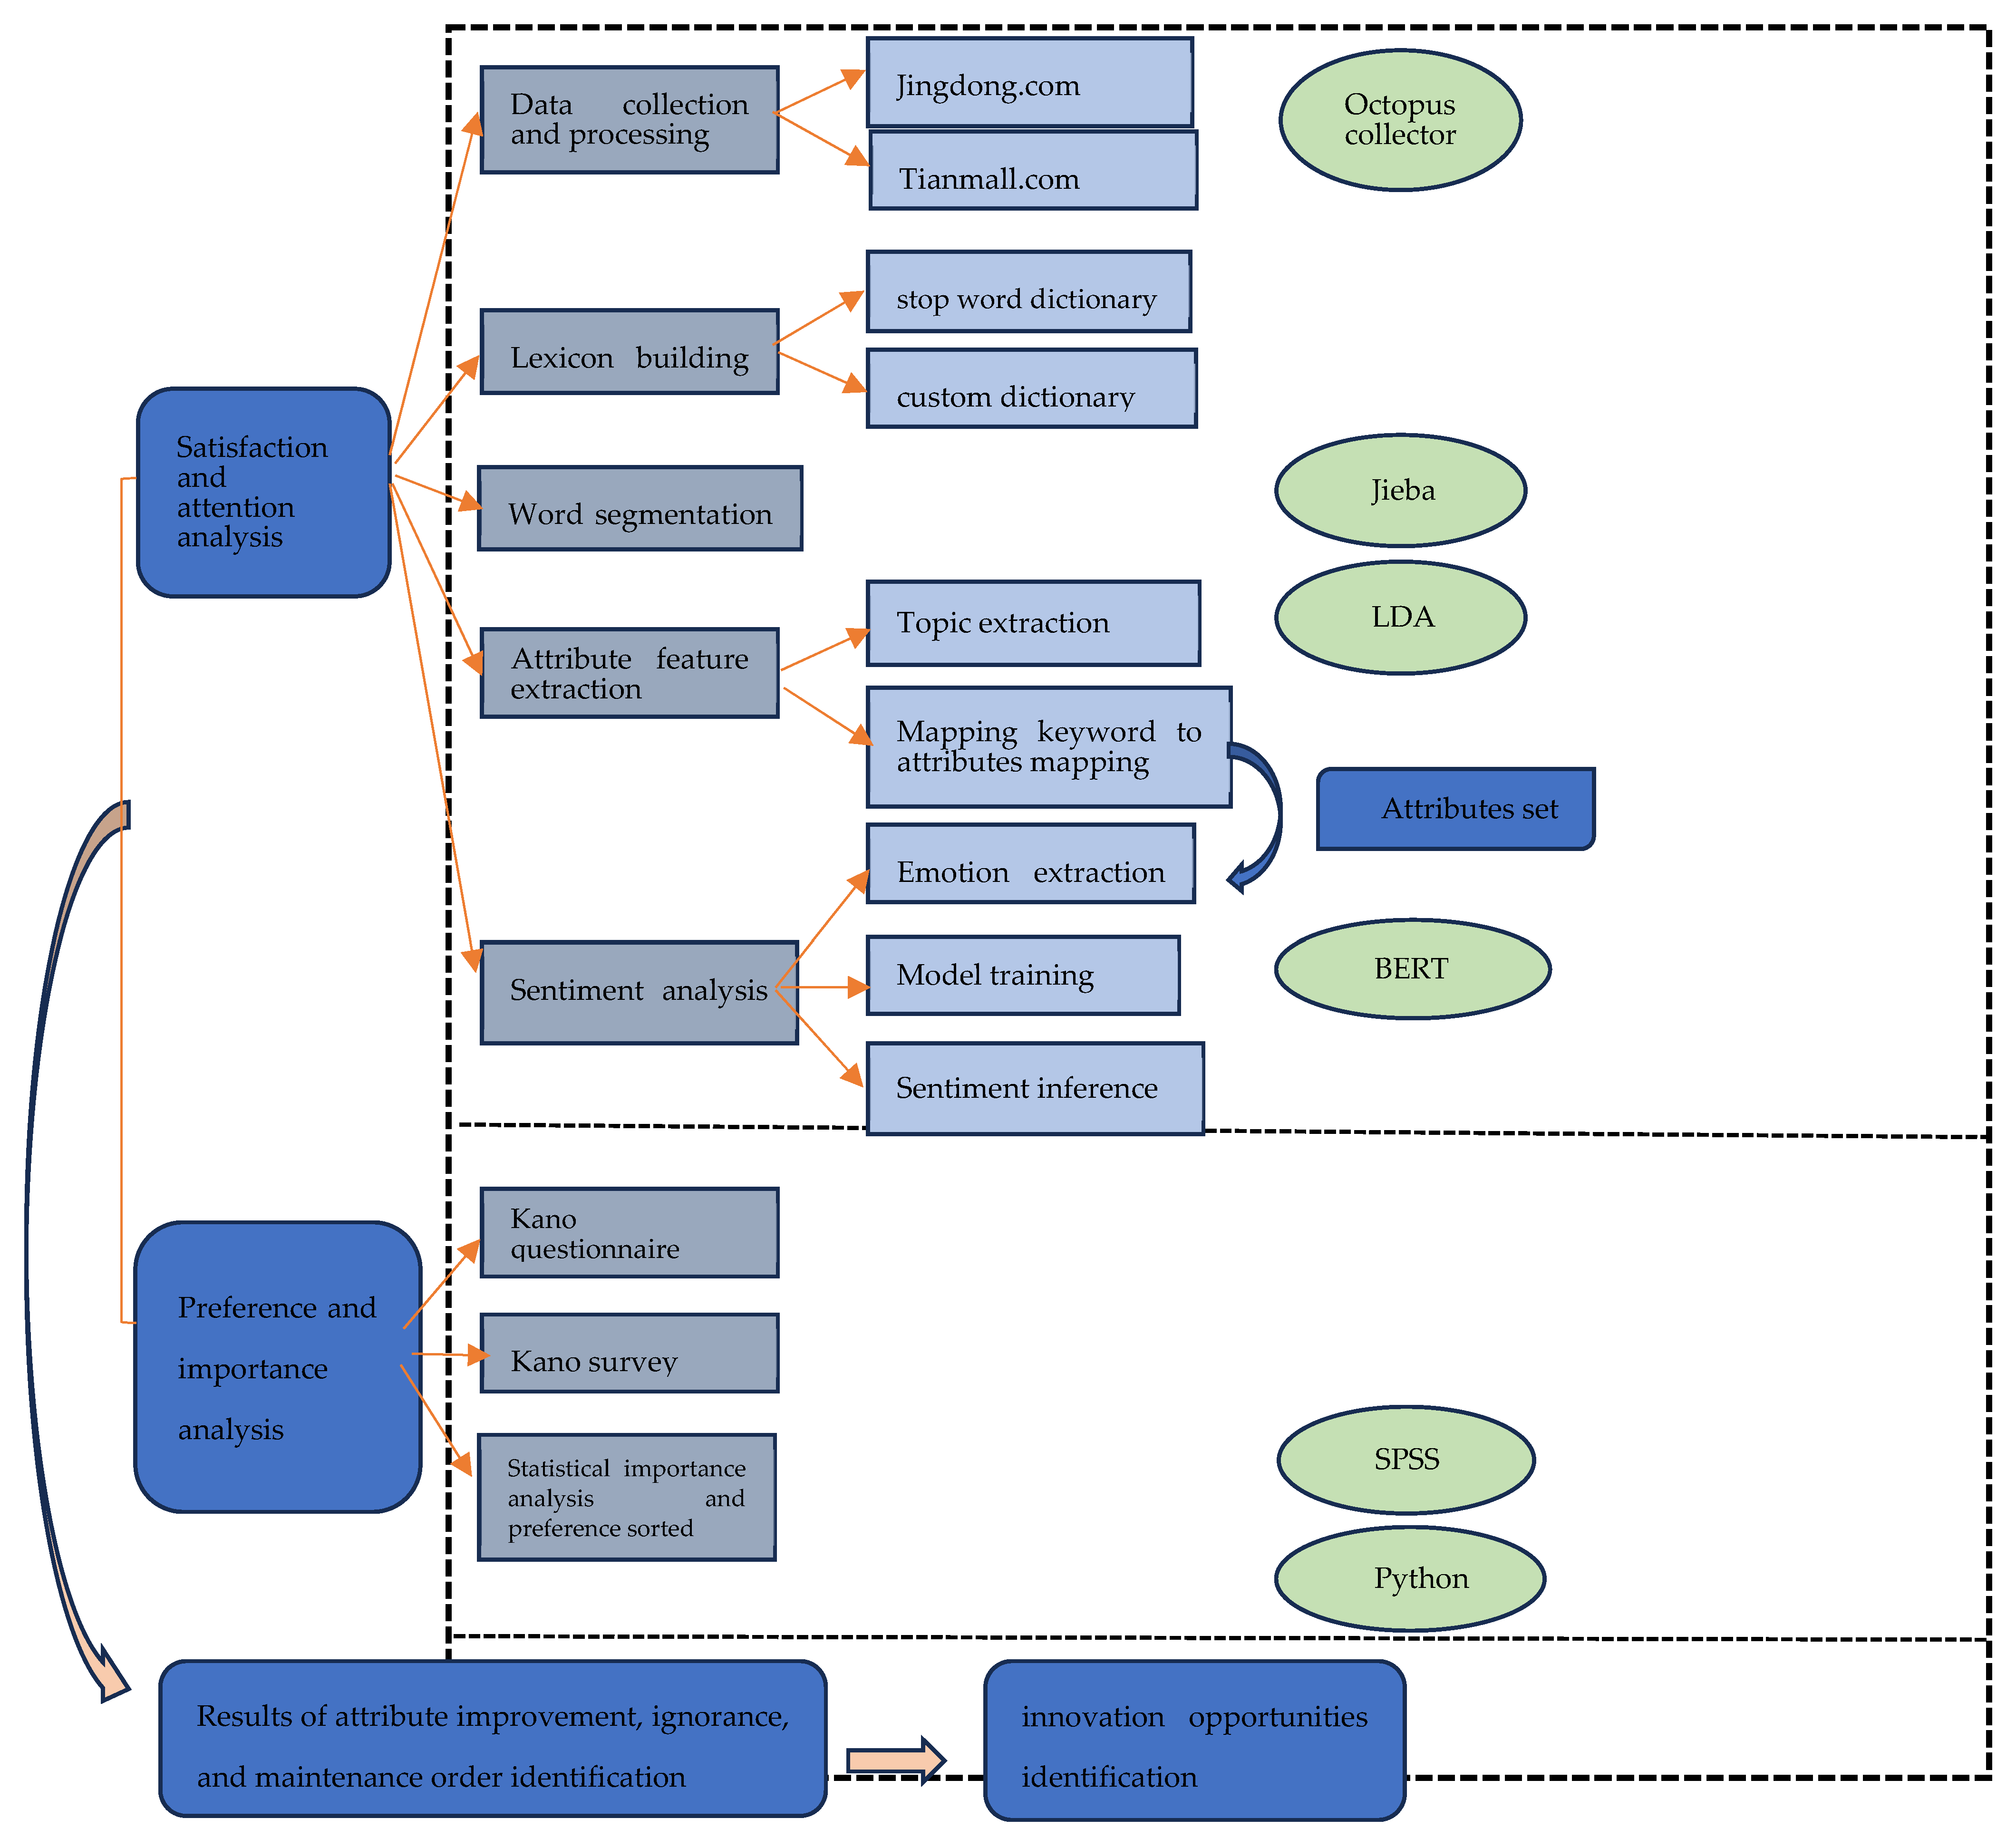
The resulting sentiment scores (attribute-level satisfaction) and frequency metrics (attention) were then combined with Kano-based importance categories to construct the results of attribute improvement, ignorance, and maintenance order dentification, which supports cognitive strategy development for design prioritization. This modular and adaptable pipeline ensures the interpretability and scalability of the IPAA–Kano framework, as illustrated in Figure 3.
This pipeline serves as the backbone of the IPAA–Kano framework, translating unstructured data into structured inputs for downstream strategic decision-making. Each module of the pipeline is interchangeable and adaptable, allowing for flexible adaptation to different product domains and data scales.

3. Case Study: Evaluating Elderly Smartwatch Attributes Through the Enhanced IPA–Kano Model

3.1. Data Collecting and Processing

To validate the model’s practical application, we used wearable watches for the elderly as a case study. Online reviews were collected from JD.com and Tmall, two major digital marketplaces in China, using Octopus Collector, a specialized data collection tool. A total of 12,527 reviews were gathered, with follow-up comments merged into single reviews. Python 3.8.0 was employed to remove duplicate comments and irrelevant characters during data cleaning.

3.2. Identifying Innovation Needs in Gerontechnology via Text Mining

3.2.1. Attribute Keyword Extraction Based on LDA Topic Model

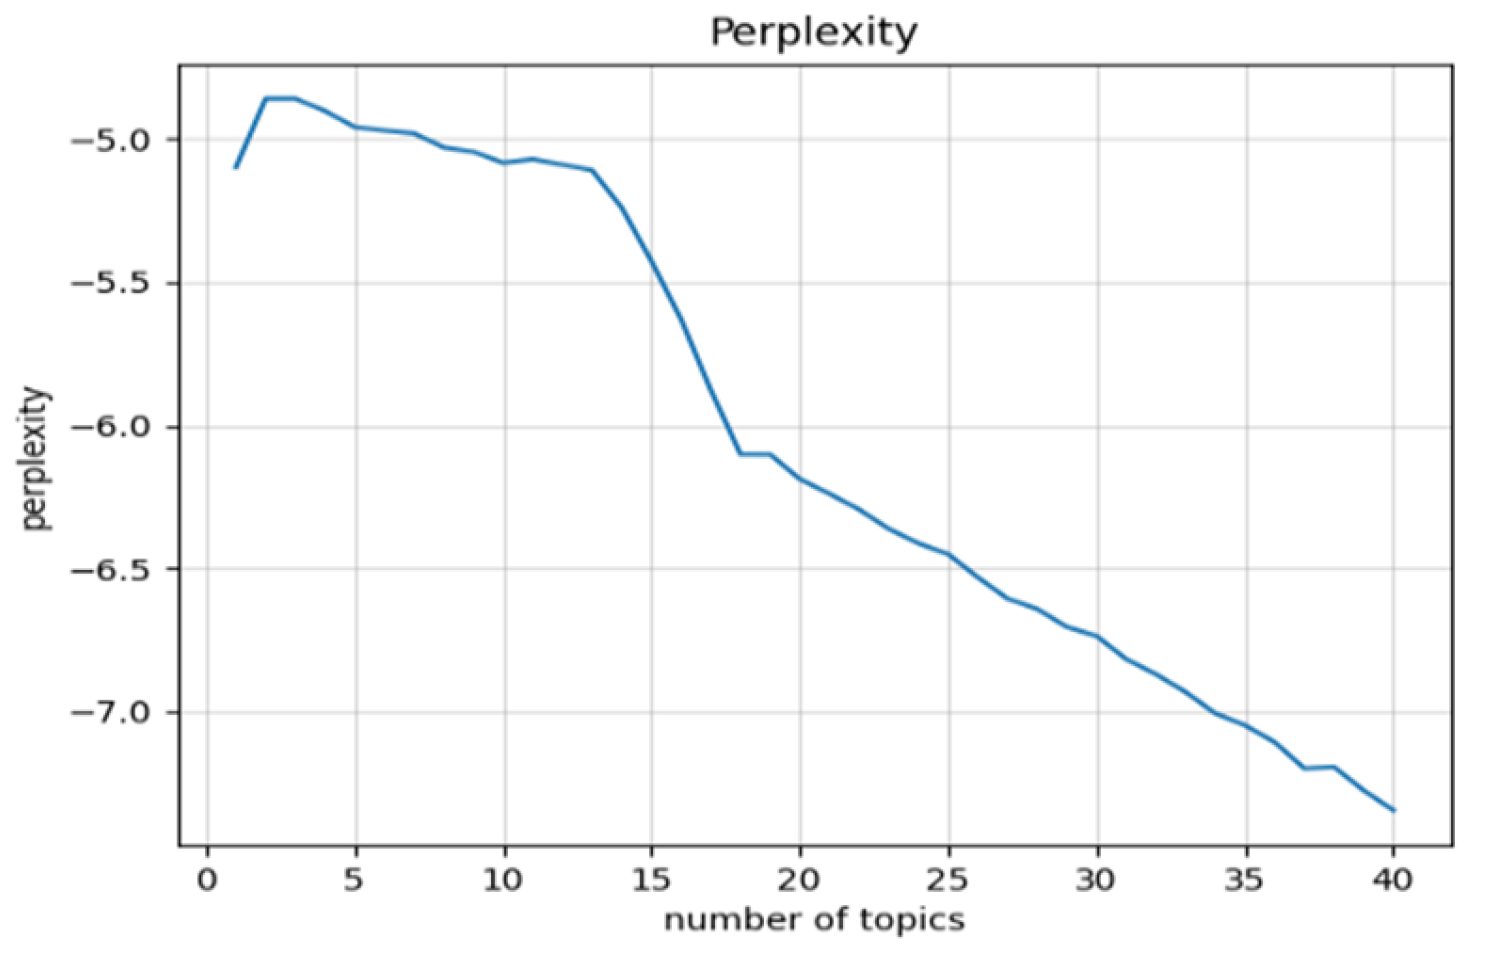
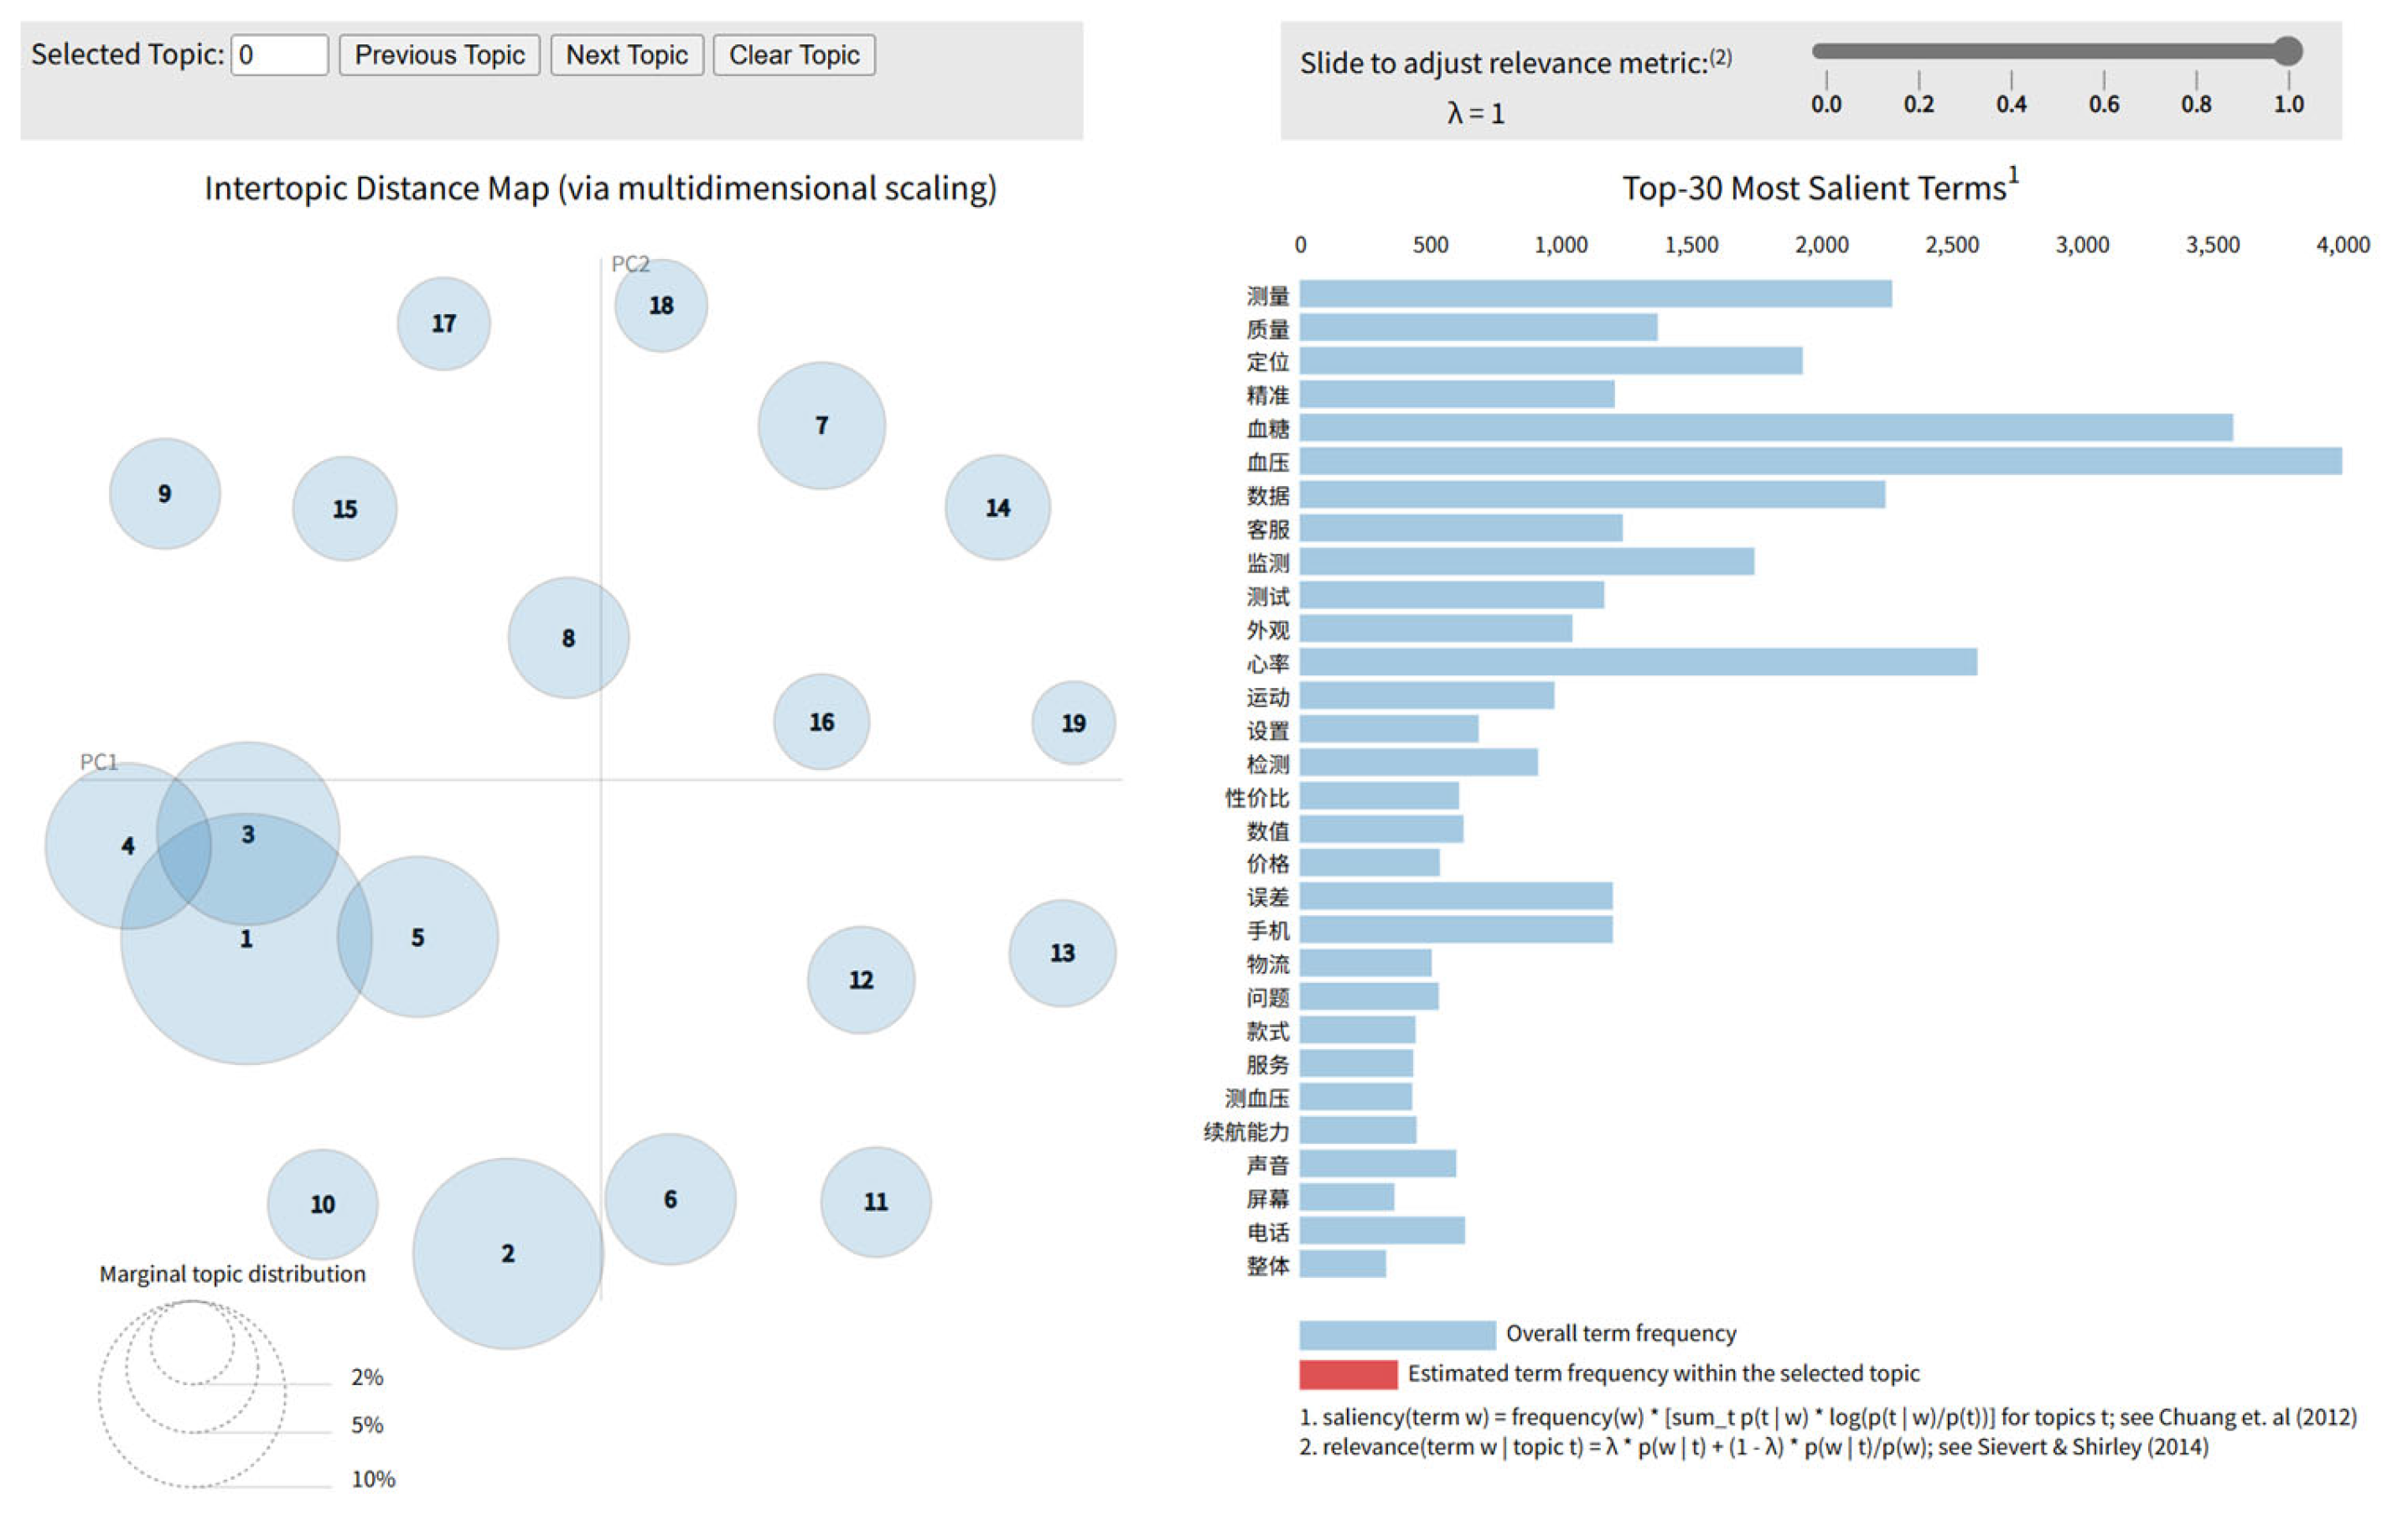
LDA (Latent Dirichlet Allocation) is an unsupervised machine learning technique used for identifying latent topics in large document collections [18]. After constructing stop-word and custom dictionaries and performing word segmentation, we trained the LDA model using Gensim. The optimal number of topics was determined through both quantitative and qualitative methods. Perplexity, a widely used metric, was selected for its interpretability and applicability [44], while manual evaluation ensured topic interpretability [45]. Consistent with prior studies, we employed both perplexity and manual checks for validation. When the number of topics reached 18 or 19, the curve slope decreased sharply and leveled off (Figure 4). Keywords from 19 topics were chosen as the candidate pool for extracting attribute features of wearable watches for the elderly. The training results are shown in Figure 5 using pyLDAvis.

3.2.2. Mapping of Topic Keywords to Requirement Attribute Features by Human Interpretation

Following the methodology of Guo et al. (2017) [20] and Tirunillai et al. [19], each identified topic label was treated as an attribute of the product or service. This process yields a set of labeled topics (attributes) and their associated keywords. We mapped these keywords to the product attribute features, developing the attribute characteristics and evaluation indices for wearable watches for the elderly.
After LDA modeling, we extracted the top 30 keywords from each topic. Three trained annotators (with backgrounds in consumer behavior and product design) independently interpreted each topic by reviewing the keywords and a random sample of topic-representative documents. They then assigned a representative attribute label to each topic (e.g., “Battery”, “Appearance Design”, “Anti-loss”), which was later discussed and finalized in a consensus meeting. To ensure reliability, the attribute labels were independently assigned by three coders. Inter-rater agreement was measured using Cohen’s Kappa, which yielded a score of 0.78, indicating substantial agreement. Discrepancies were discussed and resolved by consensus in a follow-up meeting, resulting in a finalized list of 21 first-level functional attribute features and evaluation indicators, 41 s-level attribute indicators (34 functional and 7 evaluative). A total of 120 keywords are extracted, including sub-attributes or synonyms for the same attribute, as shown in Table 3.
Overall, the use of LDA helped guide the identification of high-frequency themes in user reviews. However, to ensure interpretability and contextual relevance, human judgment was applied for attribute mapping. The inclusion of multiple coders and inter-rater agreement assessment strengthened the reliability and reproducibility of this process.

3.3. Analysis of Attribute Feature Satisfaction and Attention Using BERT

3.3.1. Selection of Pre-Trained Models, Data Annotation, and Preprocessing

We employed an attribute-level sentiment analysis approach, a sub-form of Aspect-Based Sentiment Analysis (ABSA), to assess user sentiment toward specific product features. This method enables a fine-grained understanding of user preferences and dissatisfaction points.
BERT (Bidirectional Encoder Representations from Transformers) is a bidirectional transformer-based pre-trained model introduced by Google in 2018 [27]. It demonstrates superior performance in natural language tasks, including information retrieval, question answering, sentiment analysis, sequence labeling, and natural language inference.
Fine-tuning pre-trained BERT enhances performance and generalization across tasks while maintaining robustness against overfitting. Following prior research [46], we used a pre-trained BERT-based Chinese model. Emotional labeling was performed using the Deep Seek API, which annotates texts with negative, neutral, and positive sentiments. A systematic sampling method was applied, extracting 30% of the texts for each attribute. Following annotation, the dataset was partitioned into 80% training data, 10% validation data (for model tuning), and 10% test data (for final evaluation). To address class imbalance, data augmentation techniques such as oversampling [47] were applied. The final dataset included 17,188 training samples, 2149 validation samples, and 2149 test samples. The AdamW optimizer [48] and a learning rate scheduler were employed during training.

3.3.2. Selection of Model Performance Metrics

Consistent with previous studies [49,50,51], we used the weighted F1-score and the weighted ROC-AUC to evaluate model performance on imbalanced datasets, as it is a harmonic mean of precision and recall. For multi-class classification with imbalanced data, we employed weighted categorical cross-entropy loss [48] to compute the loss.

3.3.3. Fine-Tune Experimental Training and Sentiment Inference Results

Following the methods of Sun et al. (2019) [52] and Souza et al. (2022) [53], we first conducted single-parameter tuning—holding other parameters constant—to assess individual impacts on model performance. This helped define reasonable parameter ranges and narrow the search space. Text length analysis showed that 75% of the texts were under 115 characters, mostly between 50 and 120, so the maximum sequence length was set to 128. A grid search was then applied to optimize learning rate, batch size, and training epochs. Detailed settings and results are presented in Table 4 and Table 5. In this paper, lowercase letters in scientific notation represent parameter settings, while uppercase letters indicate computed results.
Using 10 randomly generated seeds [780, 2429, 2588, 5067, 5675, 6308, 7252, 7504, 7926, 9880], along with seed 42, we conducted 11 training runs per hyperparameter setting, totaling 66 experiments. The mean and variance of the weighted avg F1 and ROC-AUC scores were calculated to evaluate performance and stability. The global mean score was 0.9772, indicating high effectiveness, and the low variance (3.56E−07) demonstrated strong stability and robustness.
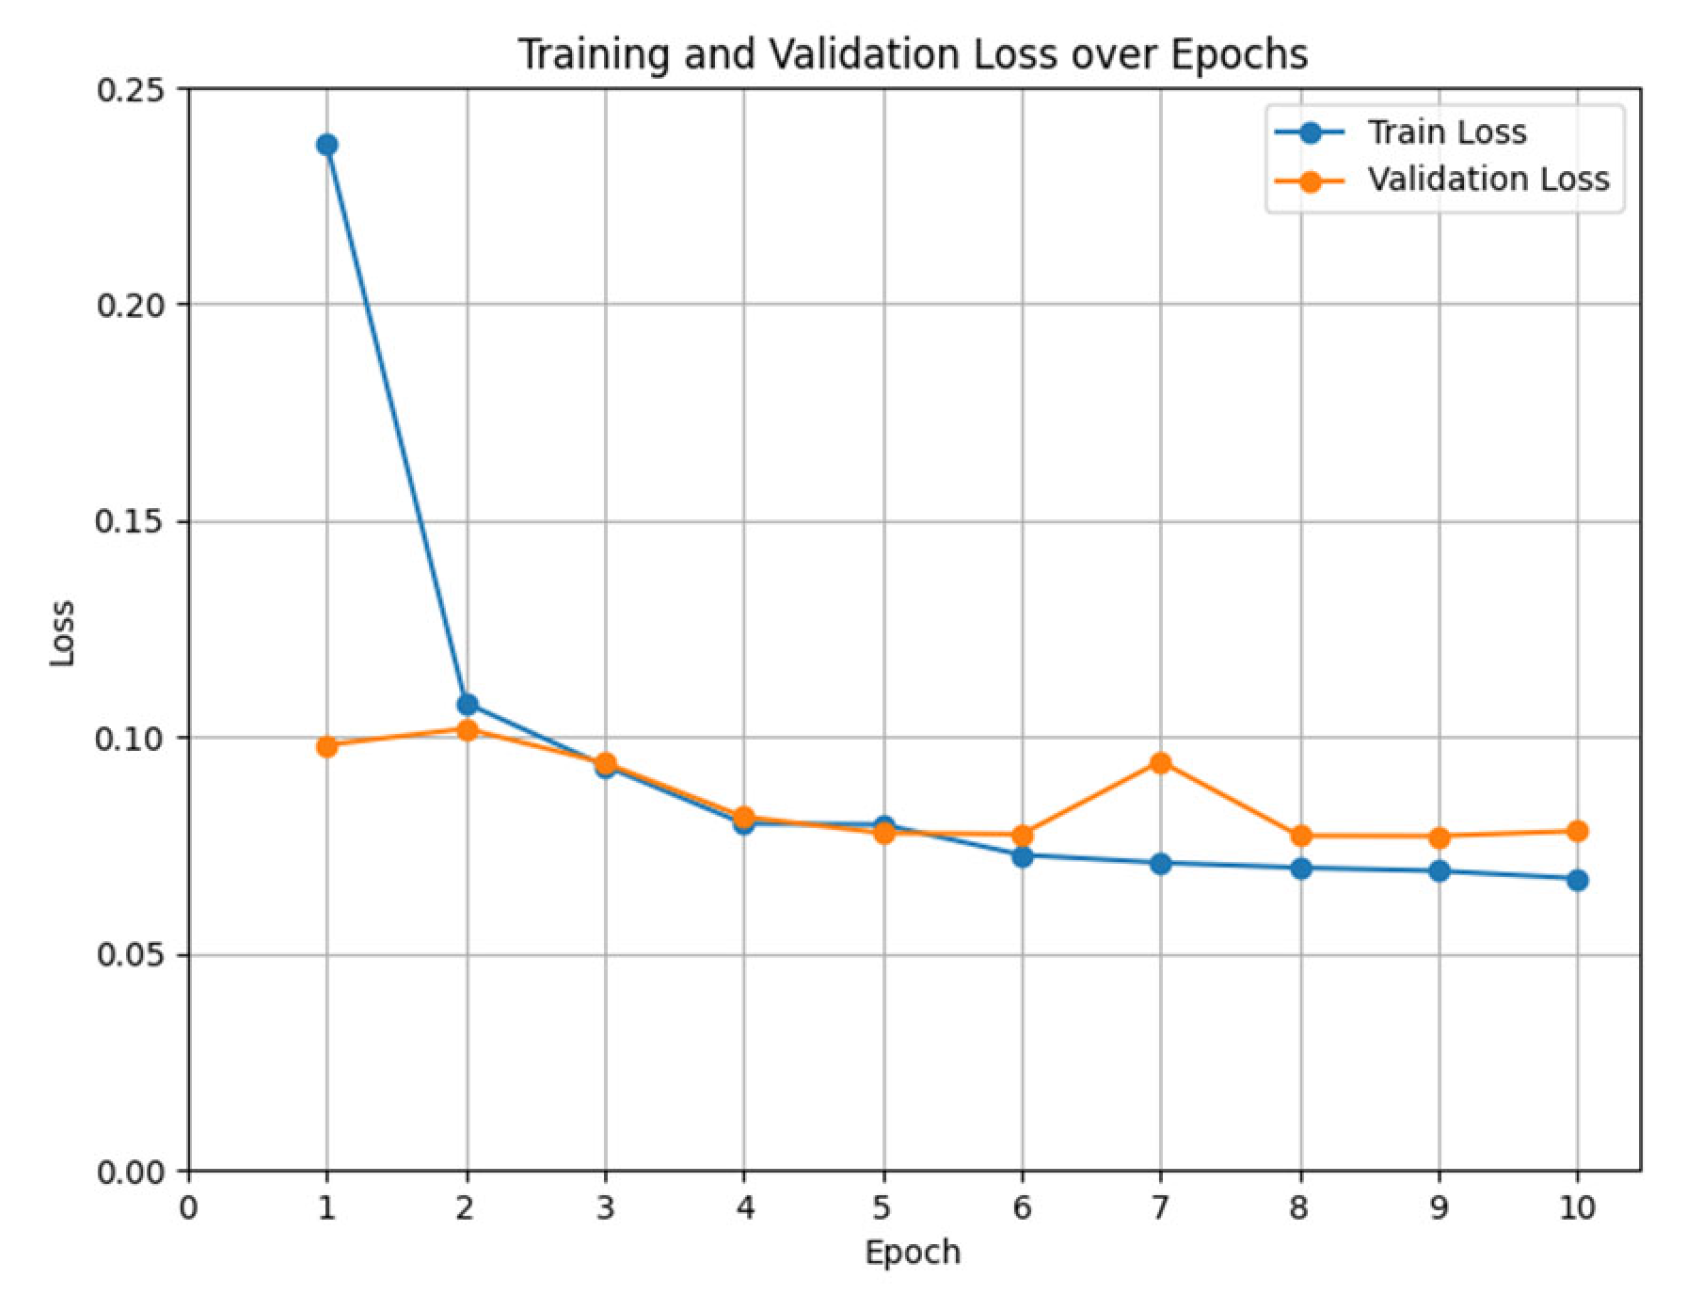
We selected the trained model with the hyperparameter combination [maximum sequence length: 128, learning rate: 5e−5, batch size: 32] due to its optimal comprehensive performance and low variance. Specifically, the model from the eighth epoch with a random seed of 780 was chosen, as shown in Figure 6, achieving the following performance metrics: a weighted F1-score of 0.9754 and a weighted ROC-AUC of 0.9815. On the test set, the model achieved a weighted F1-score of 0.9791 and a weighted ROC-AUC of 0.9982, comparable to its validation performance, demonstrating strong generalization ability.
Finally, the selected model was used to predict sentiment evaluations for the entire comment dataset on attribute features. Considering the existence of fake reviews [54,55,56], we assume real review data with a 60% ratio, and that fake reviews are mainly positive comments. The satisfaction and attention inference results are presented in Table 6.
The Pearson correlation coefficient between satisfaction and attention was 0.1117, with a p-value of 0.4651, indicating no significant correlation. This suggests that the frequency of mentions or attention given to an attribute is unrelated to actual satisfaction with that attribute.

3.4. Analysis of Satisfaction Importance and Preferences Based on Kano

3.4.1. Kano Questionnaire Design and Basic Analysis

Based on the attribute features outlined in Section 3.2, a Kano questionnaire was designed to assess the attributes. The survey targeted elderly individuals or their guardians with experience using or purchasing wearable watches for the elderly, as well as industry professionals. A total of 157 questionnaires were collected, including eight invalid and 149 valid responses, resulting in an effective response rate of 94.9%. The reliability and validity of the questionnaire, tested for both positive and negative questions using SPSS 22.0, are shown in Table 7 and Table 8.

3.4.2. Categorization of Attribute Demand Preferences

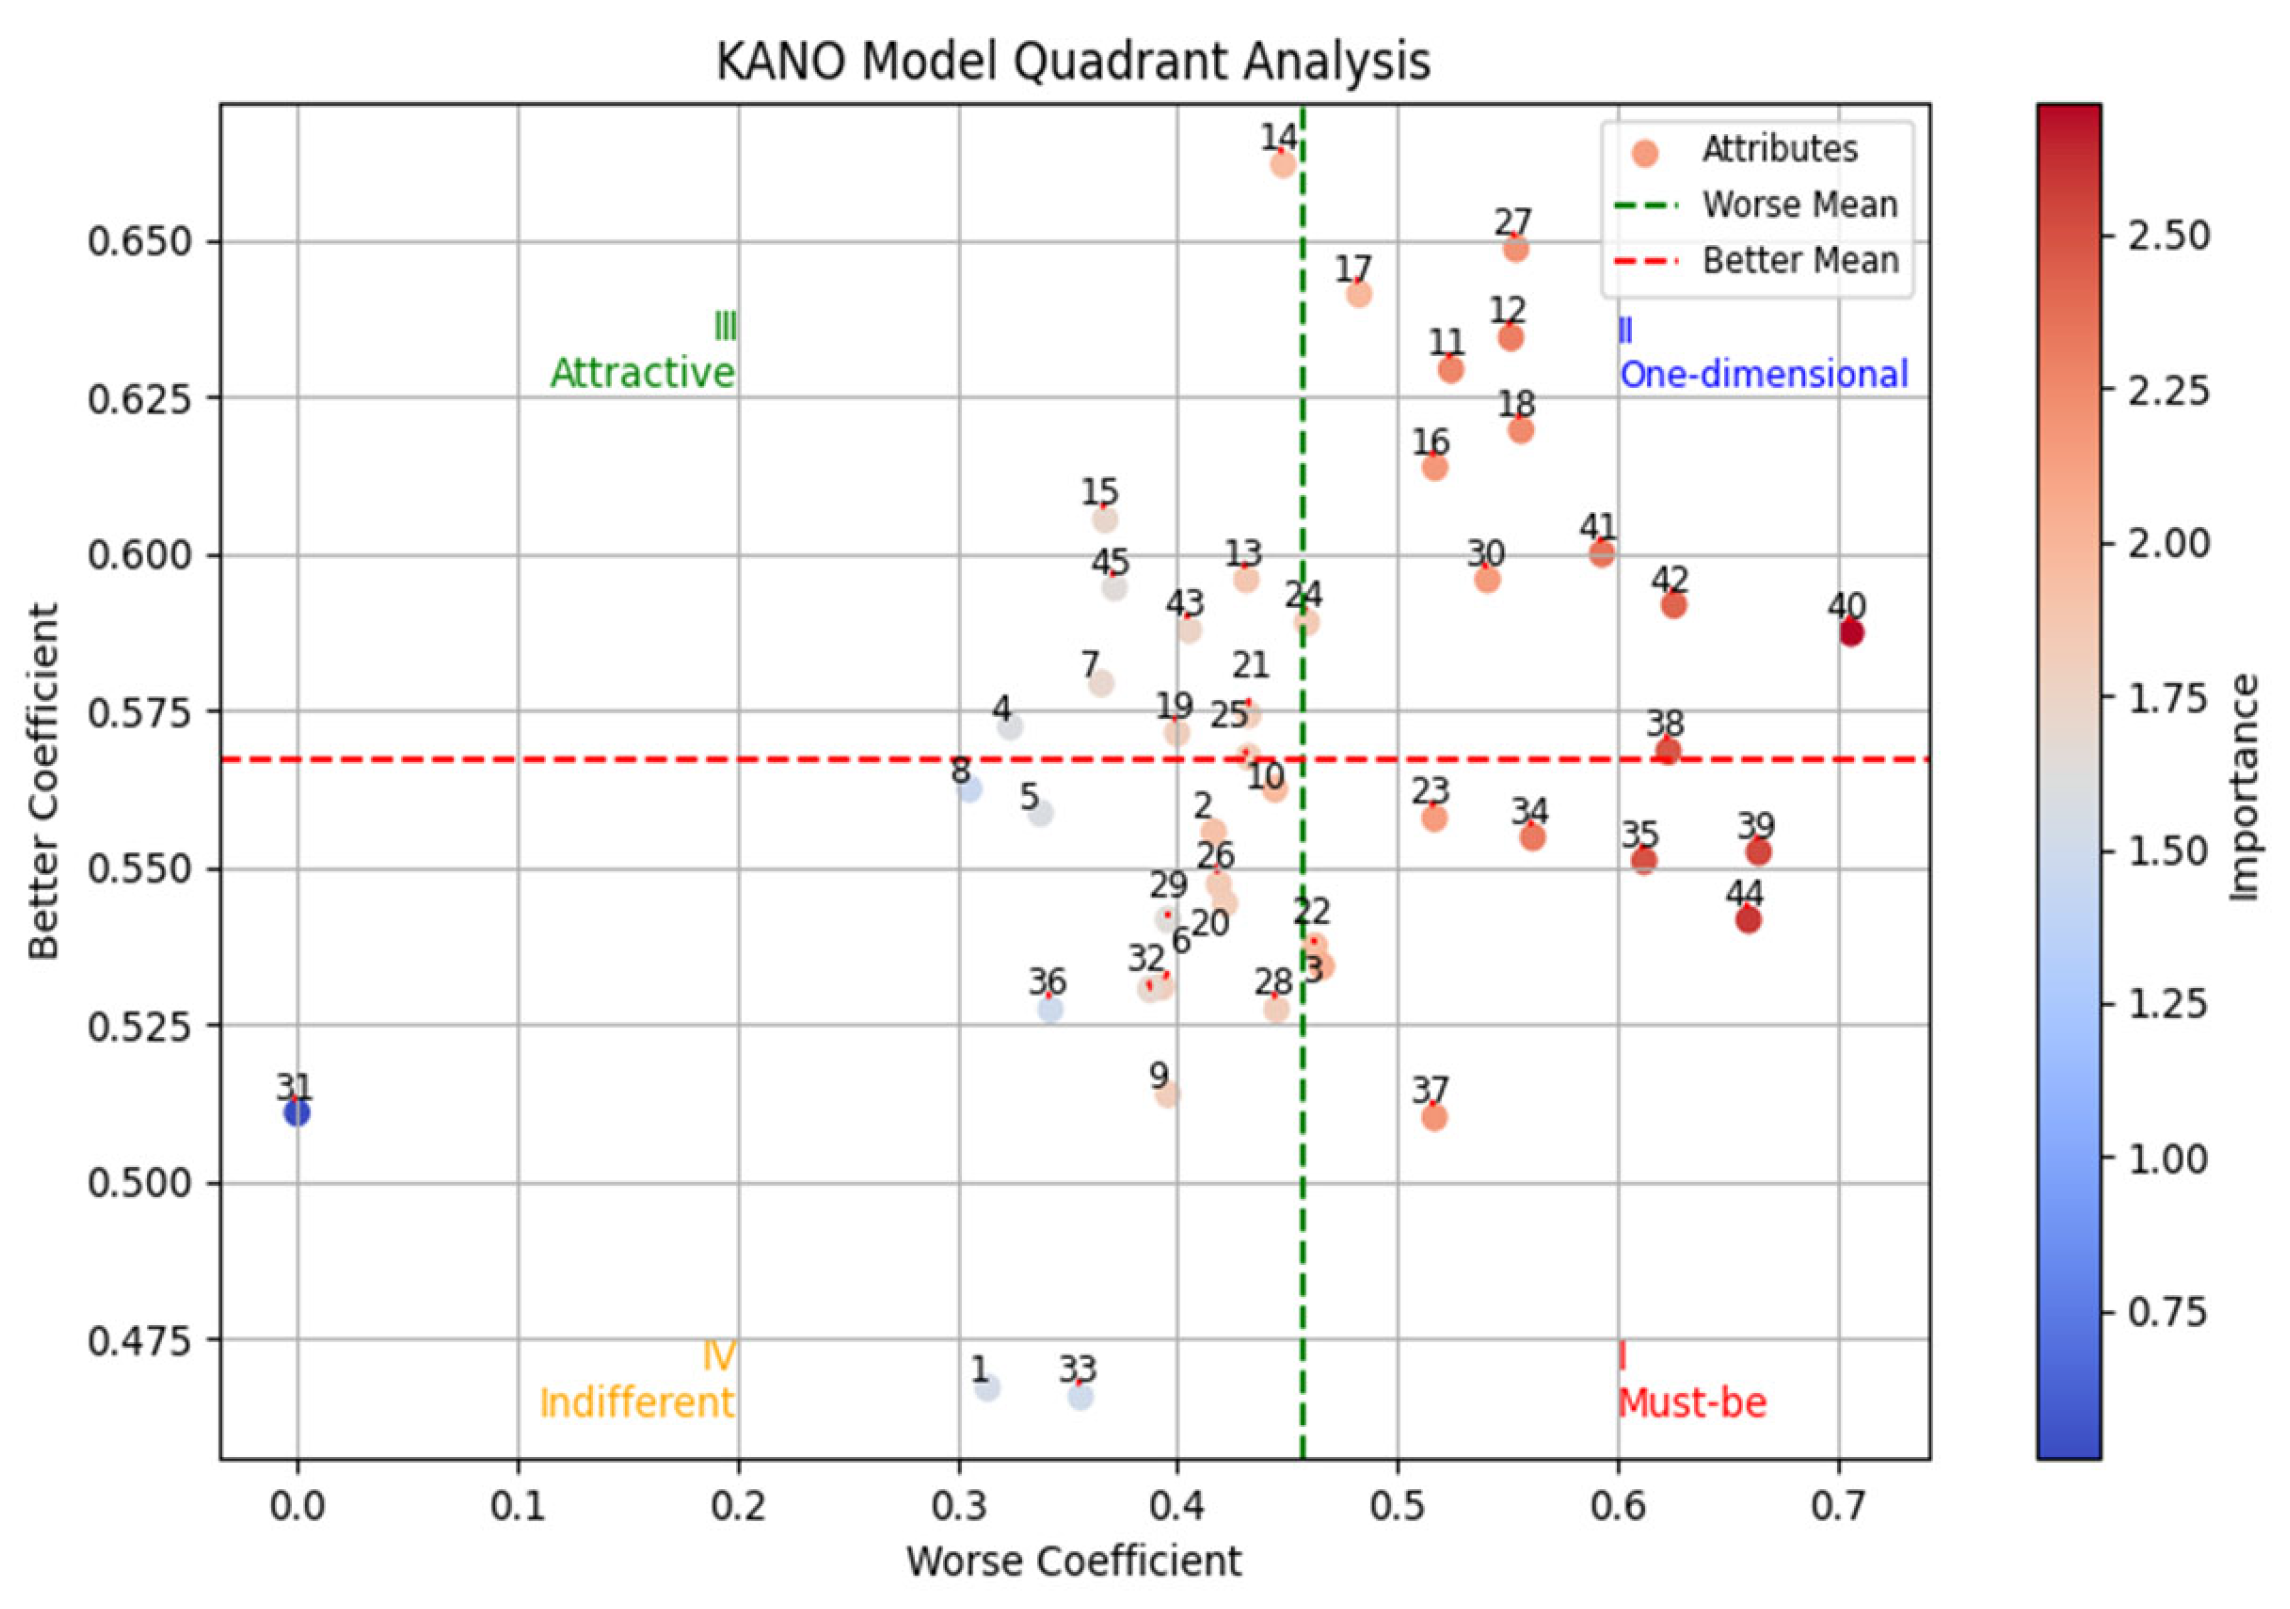
Using Python 3.8, we counted the total occurrences of each of the six Kano attribute types for each attribute and selected the type with the highest count. We then applied the relevant formulas to calculate the better, worse, and importance values for each attribute and generated a quadrant diagram. The results are presented in Table 9 and Figure 7.
The Pearson correlation coefficient between importance and attention was 0.3784, with a p-value of 0.0104, showing a significant but moderately weak positive correlation. This indicates that importance and attention reflect different aspects of user needs.
As shown in the table and figure above, eight attributes—call, waterproof, durability, wearing comfort, touchscreen, service, data sync to phone, and heart rate monitoring—are classified as must-be attributes.
Twelve attributes, including screen display clarity, accuracy, sensitivity, abnormal reminder to the guardian, signal, battery, positioning, fall alarm, one-click alarm, video, ease of operation, and abnormal alert, are identified as one-dimensional attributes.
Ten attributes—warning, voice assistant, price, remote operation, electronic fence, sedentary reminder, atrial fibrillation monitoring, medication reminder, blood lipid monitoring, and exercise data record—are categorized as attractive (delighter) attributes. The remaining attributes, classified as indifferent, will be excluded from further analyses.
In summary, the Kano model has effectively filtered and categorized the diverse set of features found in wearable smartwatches for the elderly. This provides a solid foundation for subsequent product development and functional enhancement.

3.5. Integration of Sentiment and Kano Results

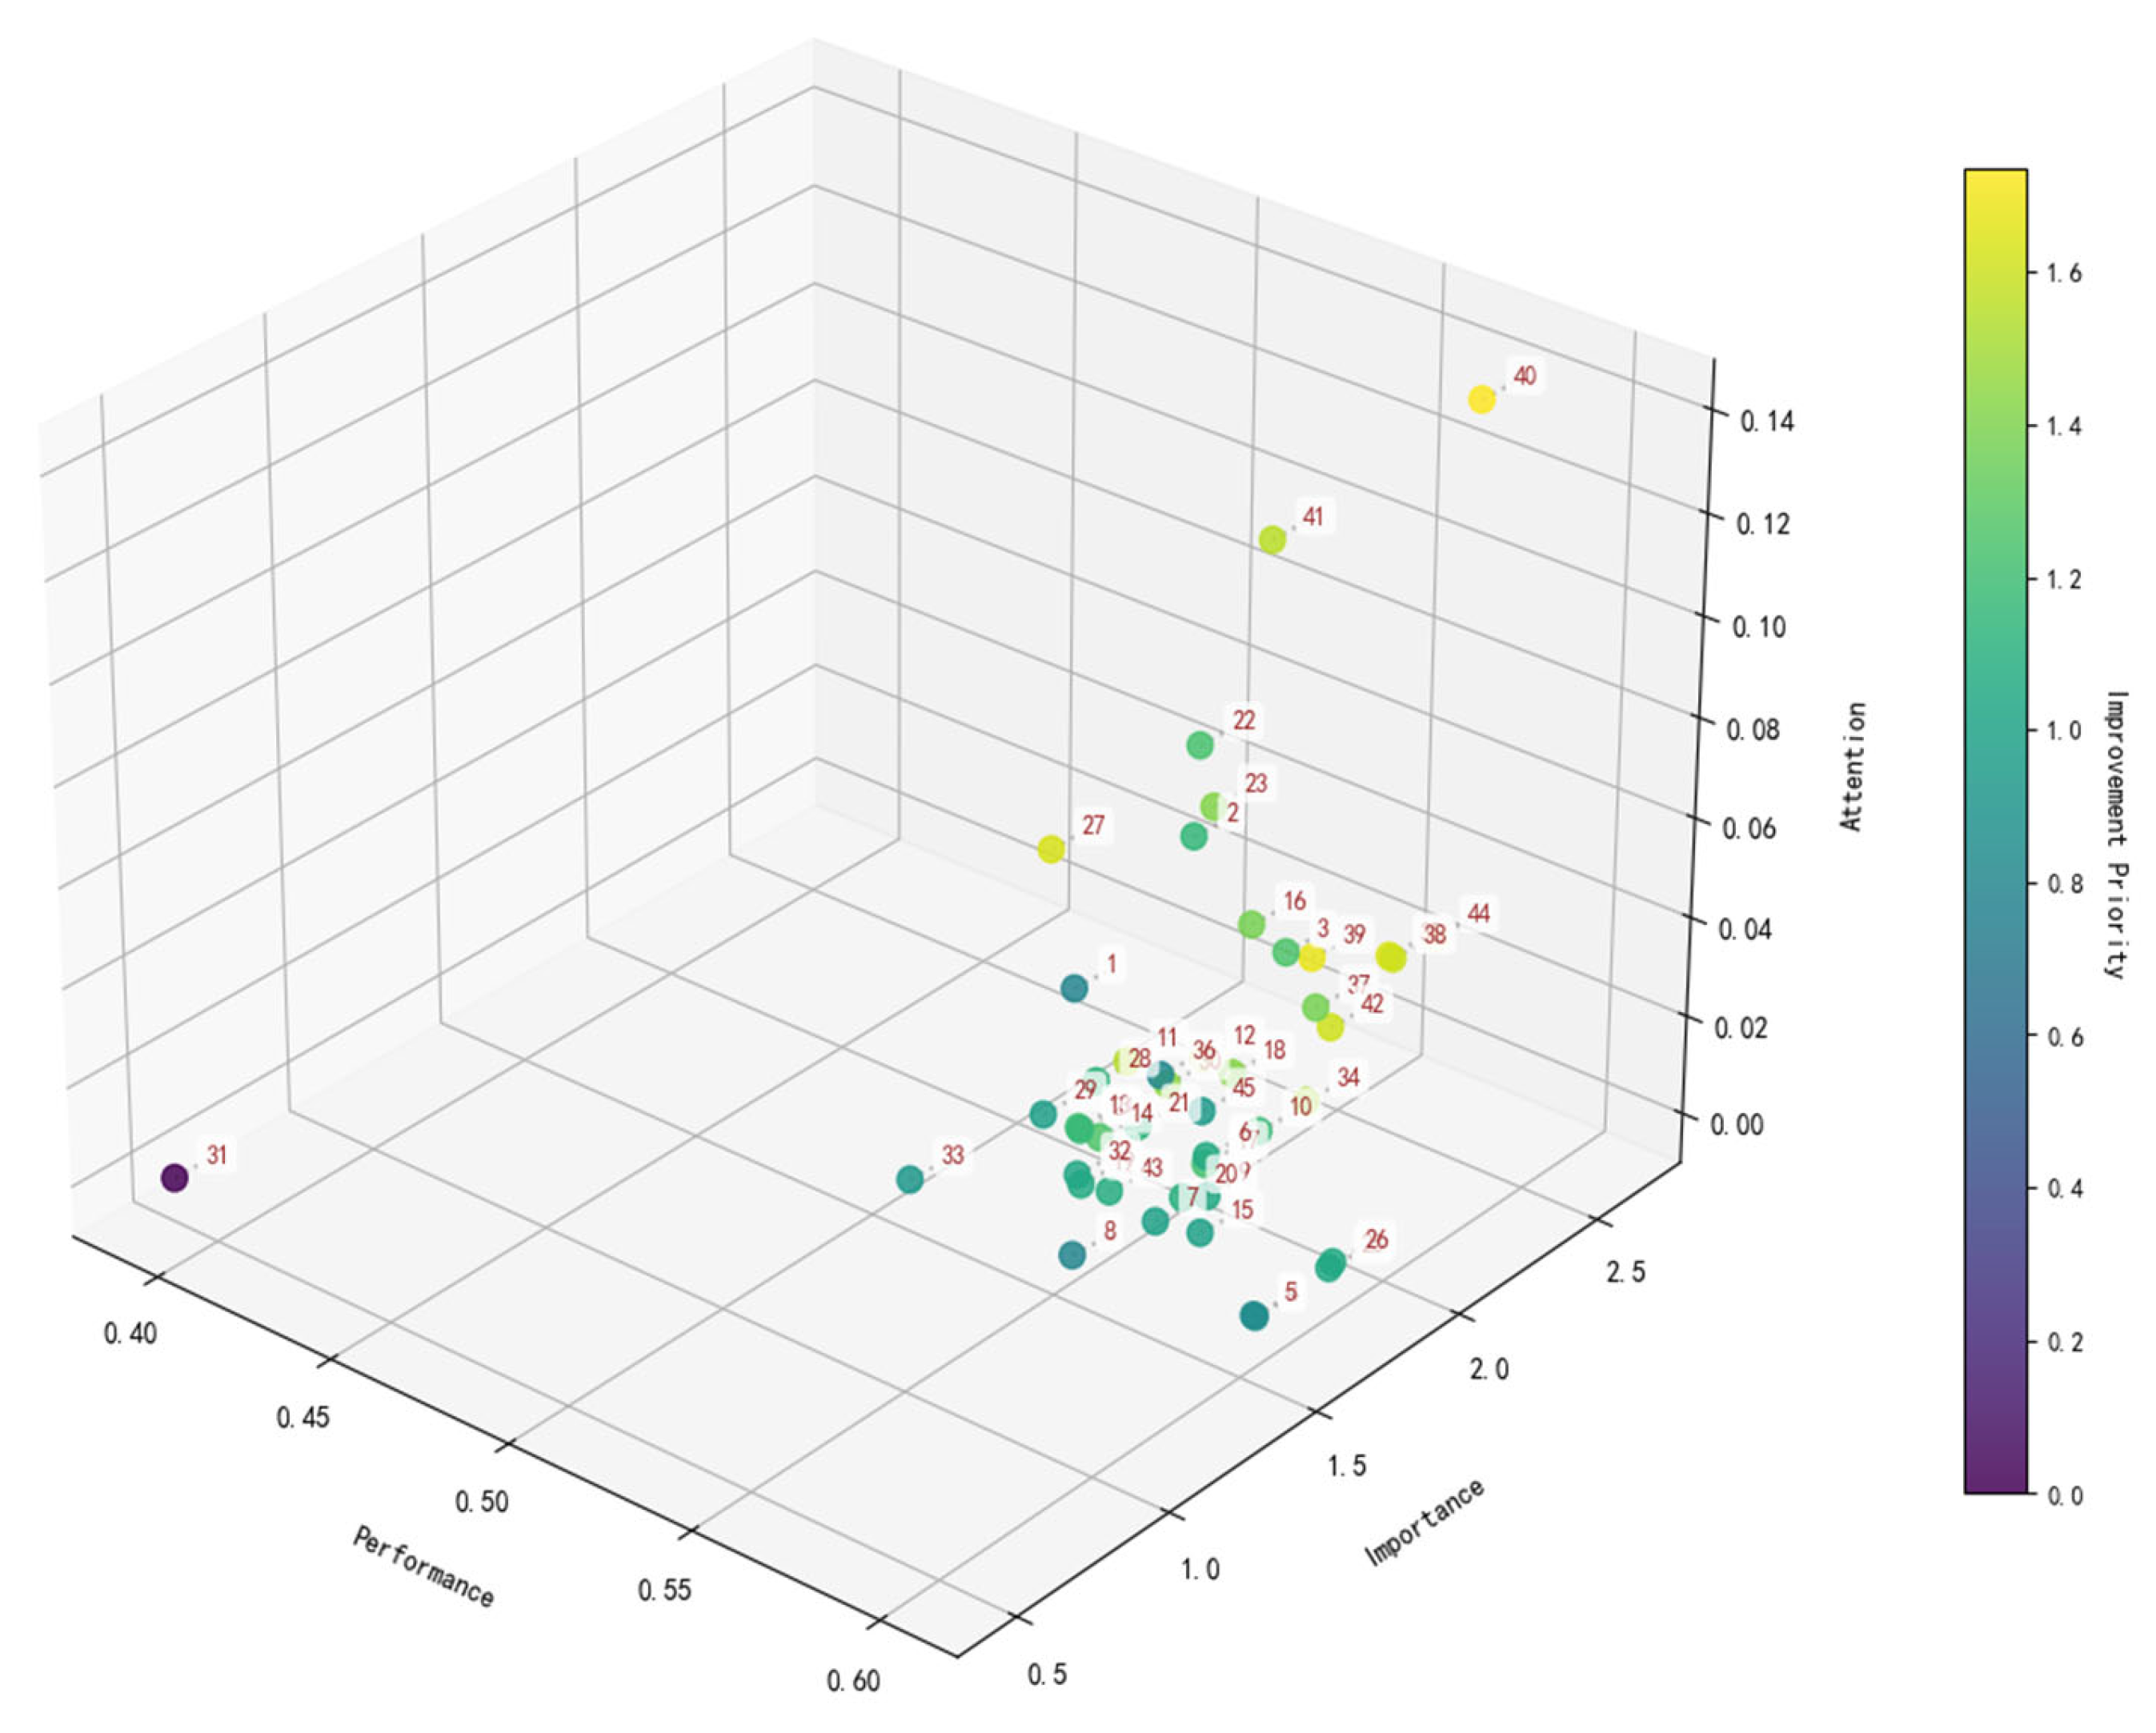
Building on the analysis above, the three-dimensional decision model IPAA–Kano was developed by integrating the Kano and IPA models with attention. A total of 14 attributes were identified as needing improvement, nine as maintenance attributes, and seven as attributes that can be deprioritized. Six cognitive management strategies were proposed for attributes with attention–utility discrepancies. The results are shown in Figure 8 and Table 10.
Among the improvement attributes, service ranks as the top dimension, requiring enhancement for elderly-focused technology products, followed by call, data sync to phone, battery, sensitivity, accuracy, one-click alarm, positioning, abnormal alert, abnormal reminder to the guardian, remote operation, medication reminder, and exercise data record. This indicates that for wearable smartwatches for the elderly, apart from service, core health alert functionalities related to the device itself—including sensitivity, accuracy, and alarms/reminders in different scenarios—are the most urgently needed improvements.
For the maintenance attributes, essential functions such as durability and water resistance rank at the top, followed by ease of use, screen, and price. It is worth noting that fall alarm, due to its high satisfaction, importance, and performance but low attention, is also categorized as a maintenance attribute. In terms of cognitive management, it is recommended to enhance market communication to raise consumer awareness and perceived value of this feature.
In contrast, attributes such as abnormal alert, which are highly important and contribute significantly to satisfaction, but perform poorly and currently receive little attention, should first undergo functionality improvements before cognitive marketing efforts are introduced to raise consumer awareness.
For the exercise data record attribute, both satisfaction and importance scores are low, but it receives relatively high consumer attention. This type of attribute can be considered a pseudo-demand—a function that attracts consumer interest yet contributes little actual utility. As such, it should be temporarily categorized as an improvement attribute, with targeted cognitive management interventions warranted due to its high attention level.

3.6. Strategic Implications and Practical Interpretation

Except for the one-dimensional attribute video, all deprioritized attributes fall under the attractive (delighter) category, including atrial fibrillation monitoring, sedentary reminder, blood lipid monitoring, voice assistant, warning, and electronic fence. This suggests that current consumers are more focused on the core functionalities of wearable smartwatches for the elderly, while additional attractive features—originally intended by manufacturers to appeal to consumers—are rated relatively low in satisfaction, importance, and attention. This may be related to consumers’ needs or their cognitive understanding of the product.
These findings align with the fact that elderly individuals’ acceptance of technology is affected by cognitive and technological barriers. The implications for the development and innovation of gerontechnology products are that elderly individuals’ cognitive and acceptance barriers to technology suggest that the design of elderly-focused technology products, such as wearable watches, should prioritize core functionalities, consolidate similar functions, and ensure ease of operation.
At the same time, aligning with the conclusion that service improvement is the top priority, social support factors during the technology adoption process for elderly individuals are also crucial. Therefore, the design of gerontechnology products must pay special attention to enhancing accompanying services, while also emphasizing the importance of cognitive management and education for elderly users regarding technology products.
Overall, improvement attributes are concentrated in the one-dimensional category, along with a few must-be attributes; maintenance attributes are primarily in the must-be category (8), with a few in the one-dimensional (3) and attractive (3) categories; most deprioritized attributes fall under the attractive category (6). These evaluation results demonstrate that, when compared against the mature Kano model classifications, the IPPA–Kano model’s identification of improvement, maintenance, and low-priority attributes shows high alignment with the Kano model’s structure. This aligns well with general factual knowledge and consumer intuition, indirectly validating the model’s effectiveness and reliability. Moreover, the model demonstrates strong practical interpretability and support, confirming its applicability and operational value. The next section will further strengthen the model’s validation from a quantitative empirical perspective.

4. Model Comparison and Validation Discussion

4.1. Comparison Results Between the IPAA–Kano Model and the IPA–Kano Model

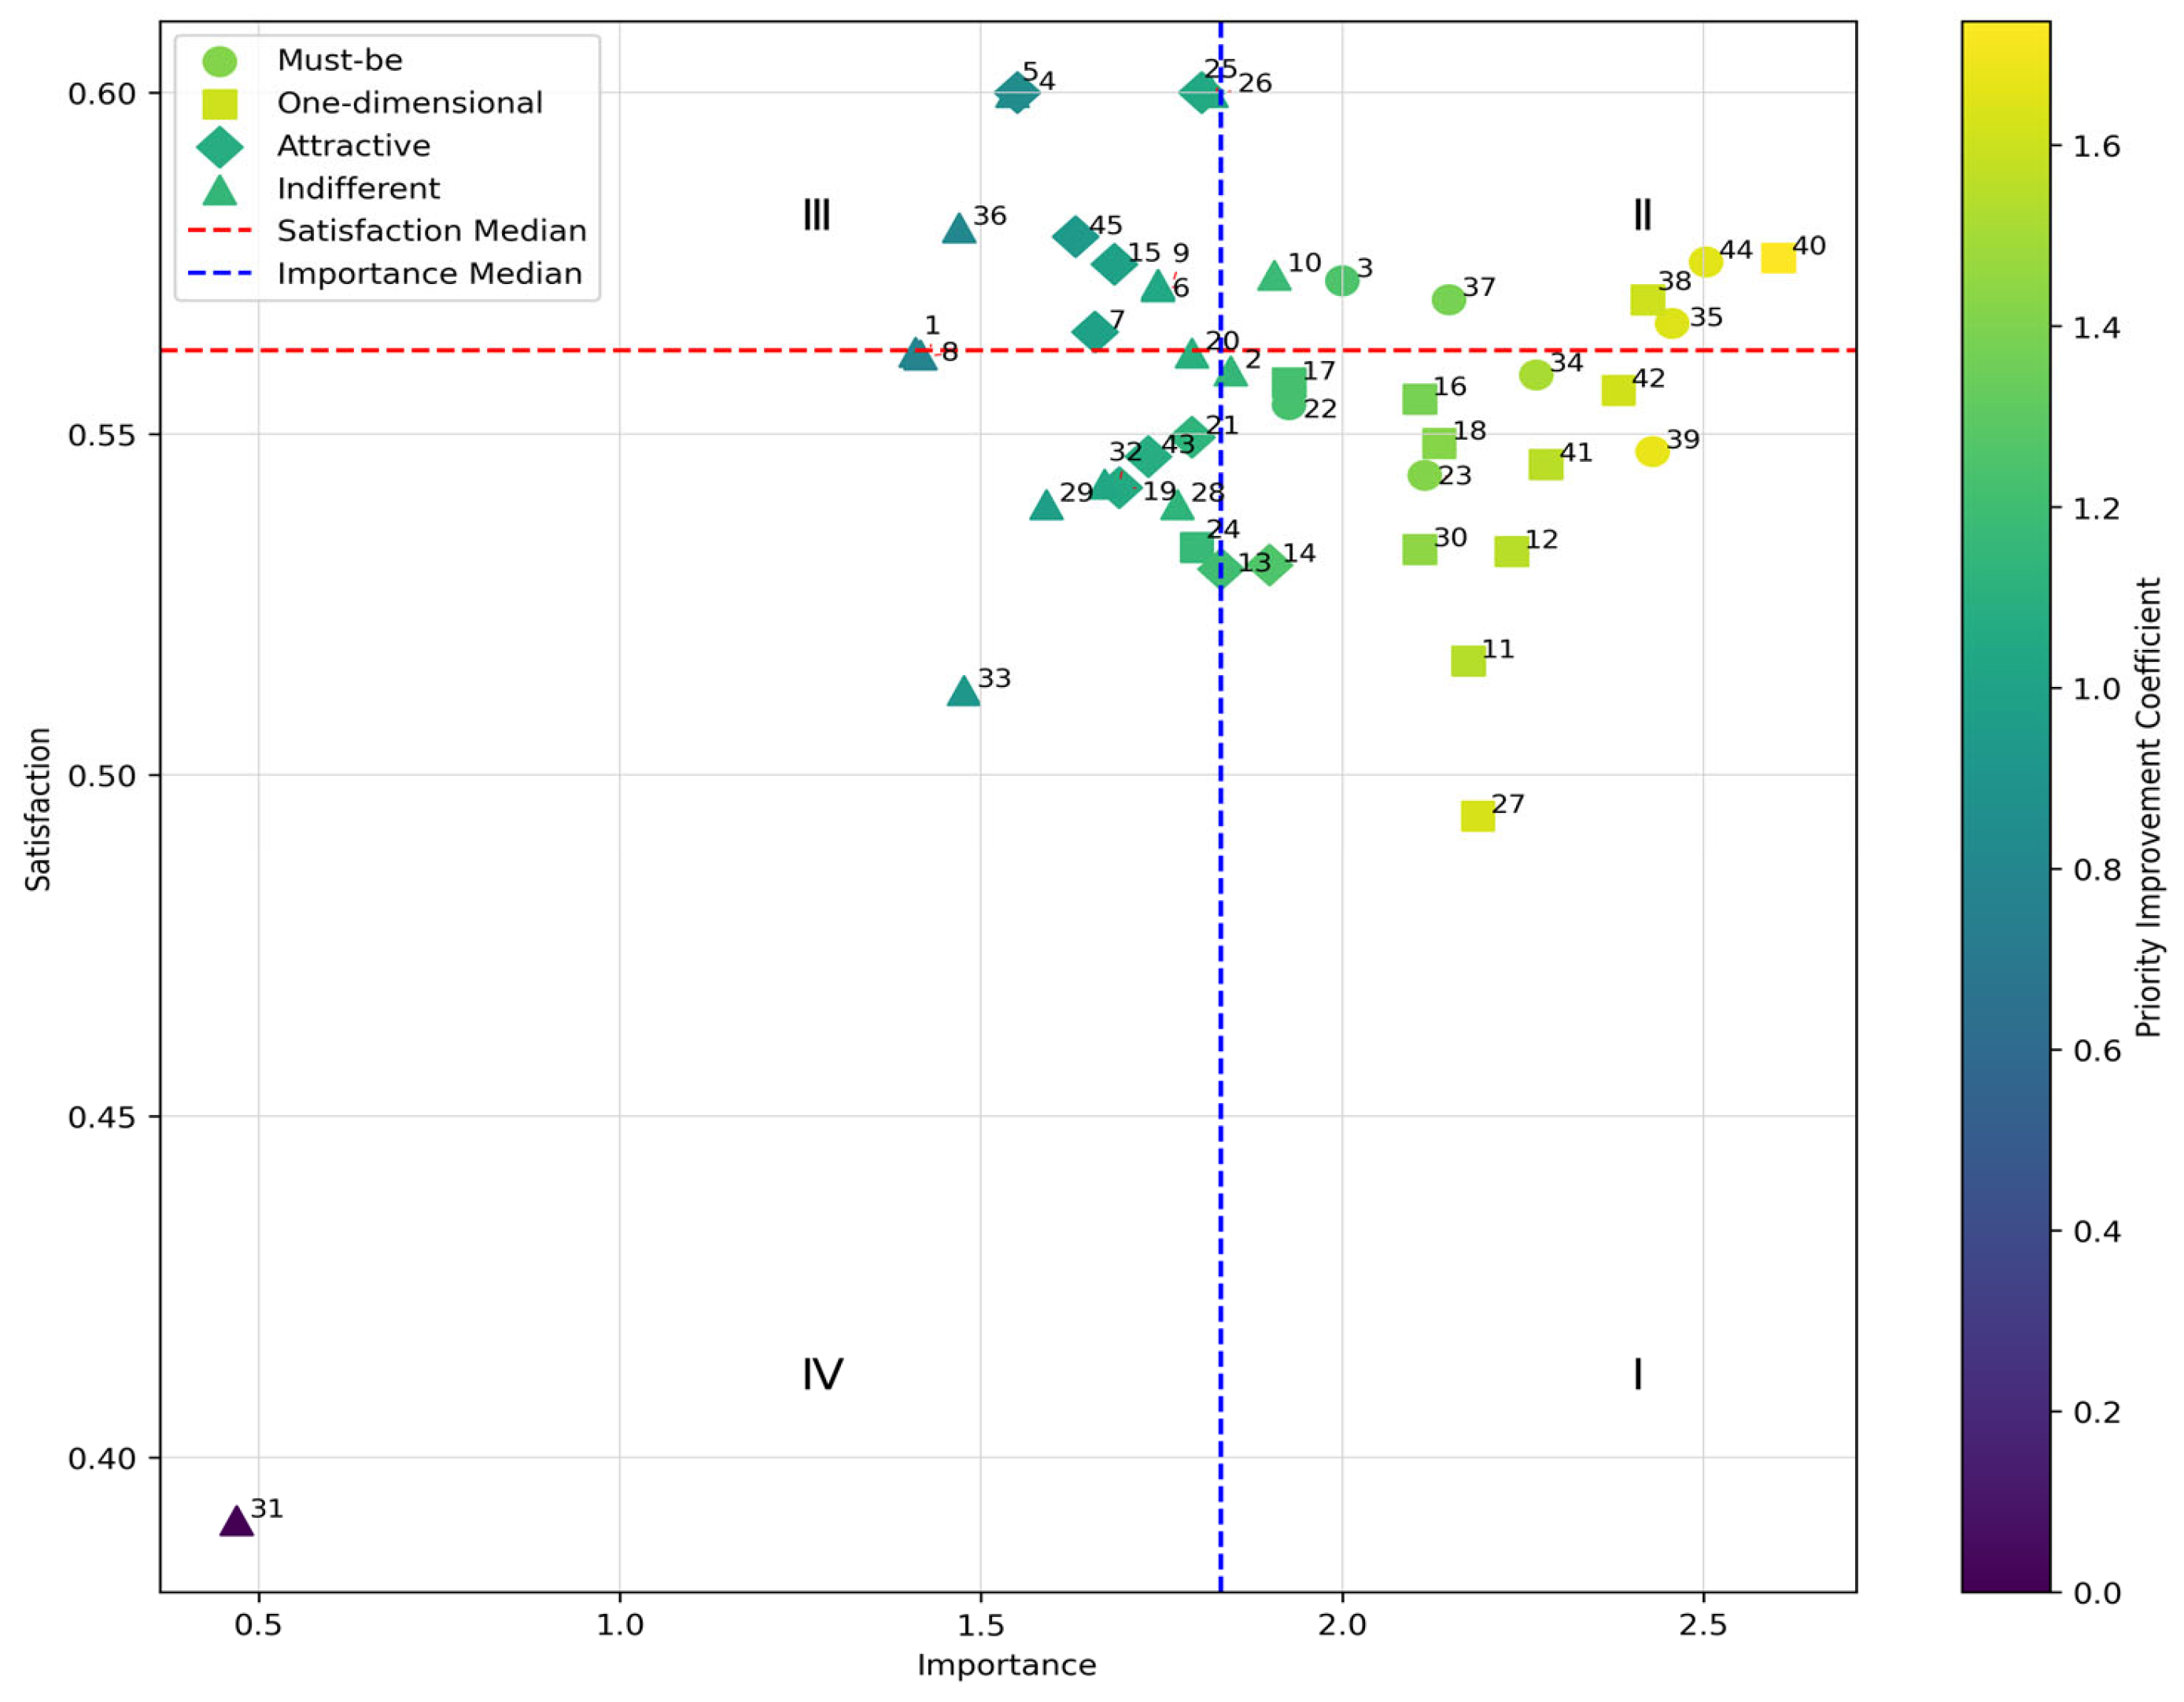
To compare the IPA–Kano and IPAA–Kano models in supporting real-world decision-making, the IPA–Kano model was applied, identifying 17 improvement and 13 maintenance attributes, shown in Table 11. And the attributes scatters are showed respectively in Figure 9 and Figure 10. While both models showed overlapping results—confirming the stability of the enhancement framework—the IPAA–Kano model, by incorporating the attention dimension, offered more nuanced insights. It could identify attributes that should be initially overlooked and those requiring cognitive management—capabilities absent in the IPA–Kano model. This comparative analysis highlights the IPAA–Kano model’s advantage in evaluation precision and strategic decision-making.
Specifically, the IPAA–Kano model identified seven dimensions as prioritized-to-be-neglected attributes, which intuitively aligns with our understanding and will be further validated through empirical studies. The number of improvement attributes decreased from 17 to 14, and maintenance attributes decreased from 13 to 9. These changes demonstrate that the inclusion of the attention dimension allowed the model to uncover previously hidden attributes under the attention–utility inconsistency condition and provided corresponding cognitive strategies for such dimensions. This improvement is meaningful not only in terms of decision-making granularity but also in enabling more efficient resource allocation under resource constraints.
Furthermore, unlike the weighted IPA–Kano and MCDA approaches (e.g., AHP, TOPSIS), which emphasize the assignment of weights—often based on expert judgment—the key innovation of the IPAA–Kano model lies in introducing attention as a new, independently derived metric. This allows for the identification of hidden attributes overlooked by traditional models and the development of cognitive strategies without relying on subjective assessments. Crucially, the attention metric is extracted from user-generated behavioral data, offering a more objective, behavior-driven basis for fine-grained attribute prioritization and decision support.

4.2. Validation of the IPPA–Kano Model’s Effectiveness

To evaluate the practical value of the proposed IPAA–Kano model, we conducted a stakeholder survey involving ten industry experts and forty end users. Participants assessed the outputs of both the traditional IPA–Kano model and the proposed IPAA–Kano model on three key dimensions using a five-point Likert scale: (1) practical relevance and consistency with real-world experience, (2) usefulness for decision-making, and (3) ease of use and acceptability. The evaluation results and paired t-test statistics are presented in Table 12.
Statistical analysis confirms that the IPAA–Kano model significantly outperforms the traditional IPA–Kano across all evaluation dimensions (p < 0.001). Notably, the greatest improvement was observed in the “decision-making support” dimension, where the IPAA–Kano model achieved a mean score of 4.06, compared to 3.16 for IPA–Kano. These results provide robust evidence of the enhanced practical value, decision relevance, and stakeholder acceptability of the proposed model.

4.3. Stakeholder Feedback on Practical Use

Beyond statistical validation, we collected qualitative feedback from five stake holders (e.g., product managers and UX designers in the elderly smart device sector). Using a five-point Likert scale, they rated the model’s clarity, decision-making value, and relevance. Scores averaged 4.2 for decision support and 4.0 for clarity. Notably, stakeholders emphasized the model’s ability to reveal high-attention but low-utility attributes as crucial for guiding feature prioritization and resource allocation under budget constraints.

4.4. Sensitivity and Robustness Analysis of Misalignment Classification

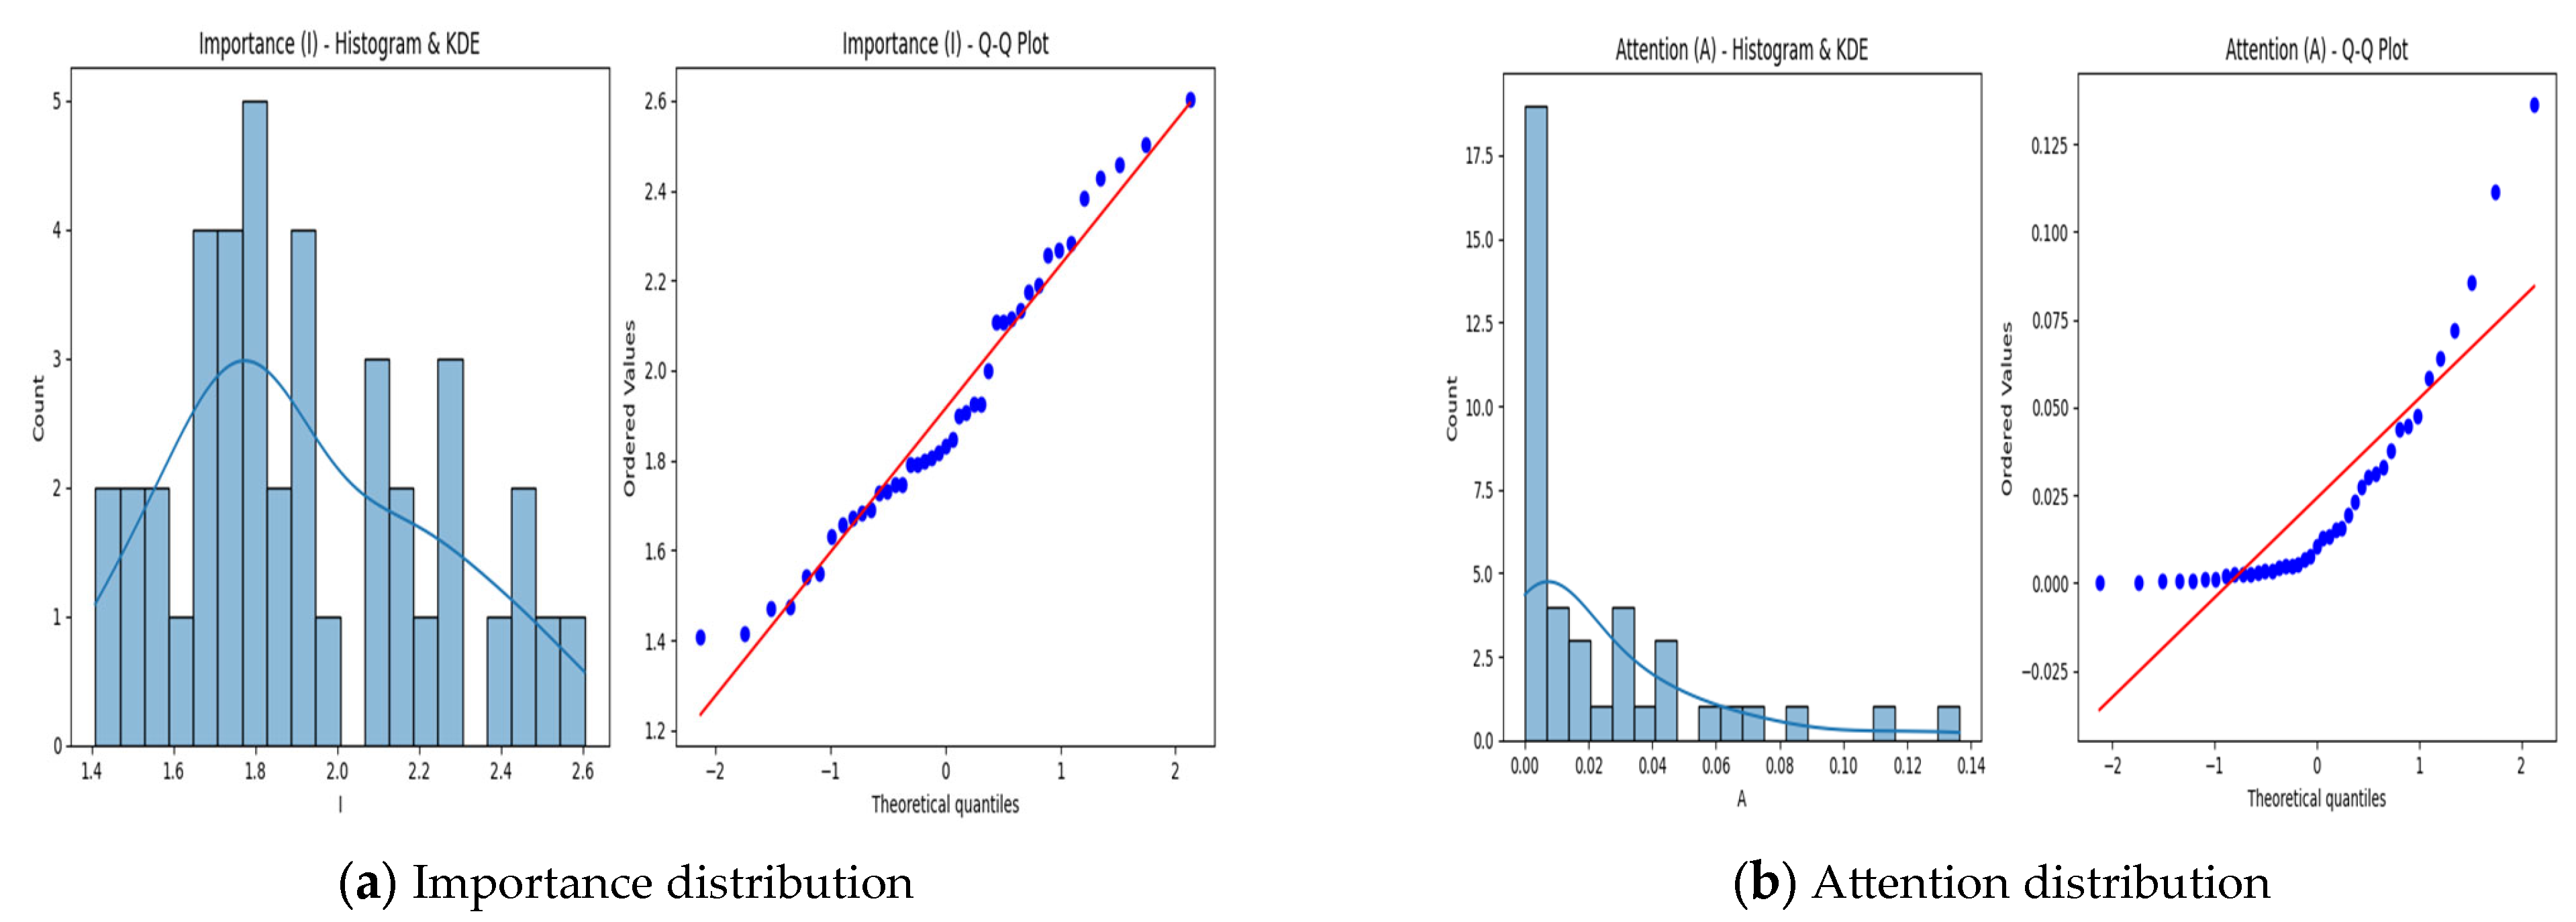
The results of the sensitivity analysis indicate that using the median as the threshold for quadrant classification demonstrates strong stability under small fluctuations of ±3% and ±5%, with classification consistency maintained within the range of 70.73% to 82.93%, as shown in Table 13. This suggests that the threshold-setting method based on the median possesses good structural robustness and practical applicability. Even under more extreme fluctuations of ±10%, the classification consistency, though slightly reduced, remains within a reasonable range, further highlighting the resilience of the median approach when applied to real-world survey data, which may present skewed distributions (see Figure 11).
To further evaluate the robustness of the median-based threshold across different data distribution scenarios, we conducted a simulation-based sensitivity test using synthetically generated datasets following normal, lognormal, uniform, and bimodal distributions. The results revealed that, when a consistency rate of 60% is used as the baseline, the median threshold exhibits relatively high stability across lognormal and uniform distributions, with fluctuations ranging from ±3% to ±10%. In contrast, for normal and bimodal distributions—where data concentration is more pronounced—stability is observed only within a narrower fluctuation range of ±3% to ±5%. Among these, the uniform distribution exhibits the highest consistency levels under small threshold variations, indicating that in datasets without a clear central tendency, slight shifts in the classification boundary exert minimal impact on the outcome. These results are presented in Table 14, Table 15, Table 16 and Table 17.
However, when the fluctuation exceeds ±15%, all distribution types experience a sharp decline in classification consistency, underscoring the high sensitivity of the method to threshold variation. This effect is particularly evident in distributions with strong central tendencies—such as normal and bimodal—where the method shows structural dependence on boundary positioning and is affected by the nonlinear response induced by data concentration patterns. These findings suggest that in practical applications, the range of boundary adjustments should be carefully constrained to avoid structural misclassifications, thereby ensuring the reliability of quadrant-based decision frameworks.

4.5. Comparison of Characteristics Between the IPP–Kano Model and the IPAA–Kano Model

We compared the characteristics of the models based on decision variables, importance calculation methods, data sources, attribute ranking results, and the specific contributions of the IPAA–Kano model, as shown in Table 18.

5. Conclusions and Future Work

Building on value co-creation and leveraging deep learning-based natural language processing (NLP), this study employs BERT and Latent Dirichlet Allocation (LDA) for a data-driven, fine-grained analysis of user demands and attribute preferences. By integrating these insights with the Kano–IPA framework, we introduce attention and priority improvement coefficients, forming the IPAA–Kano model to optimize decision-making in customer-centric innovation.
Addressing the misalignment between explicit attention and implicit utility, the model extends the traditional IPA–Kano framework into a three-dimensional structure with eight decision spaces, enhancing its ability to (1) accurately classify product attributes based on their impact on satisfaction and user attention; (2) optimize resource allocation by distinguishing between quality improvement priorities and cognitive expectation management; (3) systematically deprioritize low-value attributes, increasing decision efficiency under resource constraints.
The empirical validation of wearable devices for the elderly, using 12,527 user-generated reviews, confirms the superior accuracy and decision relevance of the deep learning-enhanced IPAA–Kano model compared to traditional approaches. Additionally, domain expert validation and consumer feedback further support its practical effectiveness in guiding technology product development and optimization strategies.
However, this study has several limitations, which present opportunities for future research: (1) Data dependence: The satisfaction analysis primarily relies on user-generated content, which may introduce bias and limit the generalizability of attribute analysis. (2) Generalization constraints: The case study focuses on wearable devices for the elderly; further validation across diverse industries and product categories is necessary to broaden applicability. (3) Market dynamics: The model’s effectiveness may be affected by rapid market shifts, necessitating continuous model updates to capture emerging trends and evolving customer preferences. (4) Deep learning enhancements: While this study utilizes BERT and LDA, future research could explore the integration of advanced deep learning techniques, such as hybrid models, reinforcement learning, or neural network-based attention mechanisms, to further enhance classification accuracy and decision depth.
This study contributes to both methodological advancements in deep learning-assisted decision modeling and practical strategies for optimizing innovation under resource constraints, providing a scalable, intelligent framework for guiding technology-driven product development and strategic innovation.
Author Contributions

Conceptualization, Z.W.; methodology, X.W.; formal analysis, X.W.; writing—original draft preparation, X.W.; writing—review and editing, X.W.; supervision, Z.W. All authors have read and agreed to the published version of the manuscript.

Funding

This research received no external funding.

Data Availability Statement

The datasets presented in this article are not readily available because they are part of an ongoing research project and contain partially unpublished content. Requests to access the datasets should be directed to Xuehui Wu.

Conflicts of Interest

The authors declare no conflict of interest.

References

  1. Vargo, S.L.; Maglio, P.P.; Akaka, M.A. On value and value co-creation: A service systems and service logic perspective. Eur. Manag. J. 2008, 26, 145–152. [Google Scholar] [CrossRef]
  2. Ramirez, M.S.; Garcia-Peñalvo, F.J. Co-creation and open innovation: Systematic literature review. Comunicar 2018, 54, 9–18. [Google Scholar] [CrossRef]
  3. Fan, X.; Luo, Y. Value co-creation: A literature review. Open J. Soc. Sci. 2020, 8, 89–98. [Google Scholar] [CrossRef]
  4. Alaoui, M.; Lewkowicz, M. Struggling against social isolation of the elderly—The design of Smart TV applications. In From Research to Practice in the Design of Cooperative Systems: Results and Open Challenges; Dugdale, J., Masclet, C., Grasso, M.A., Boujut, J.-F., Hassanaly, P., Eds.; Springer: London, UK, 2012; pp. 261–275. [Google Scholar] [CrossRef]
  5. Aner, K. Discussion paper on participation and participatory methods in gerontology. Z. Gerontol. Geriat. 2016, 49 (Suppl. S2), 153–157. [Google Scholar] [CrossRef]
  6. Beimborn, M.; Kadi, S.; Köberer, N.; Mühleck, M.; Spindler, M. Focusing on the Human: Interdisciplinary Reflections on Ageing and Technology. In Ageing and Technology: Perspectives from the Social Sciences; Domínguez-Rué, E., Nierling, L., Eds.; transcript Verlag: Bielefeld, Germany, 2016; pp. 311–334. [Google Scholar]
  7. Gullà, F.; Ceccacci, S.; Germani, M.; Cavalieri, L. Design adaptable and adaptive user interfaces: A method to manage the information. In Ambient Assisted Living; Andò, B., Siciliano, P., Marletta, V., Monteriù, A., Eds.; Springer: Cham, Switzerland, 2015; Volume 11, pp. 47–58. [Google Scholar] [CrossRef]
  8. Wu, Y.H.; Damnée, S.; Kerhervé, H.; Ware, C.; Rigaud, A.S. Bridging the digital divide in older adults: A study from an initiative to inform older adults about new technologies. Clin. Interv. Aging 2015, 10, 193–200. [Google Scholar] [CrossRef]
  9. Yusif, S.; Soar, J.; Hafeez-Baig, A. Older people, assistive technologies, and the barriers to adoption: A systematic review. Int. J. Med. Inform. 2016, 94, 112–116. [Google Scholar] [CrossRef]
  10. Lee, D.; Tak, S.H. Barriers and facilitators of older adults’ usage of mobility devices: A scoping review. Educ. Gerontol. 2022, 49, 96–108. [Google Scholar] [CrossRef]
  11. Huang, G.; Oteng, S.A. Gerontechnology for better elderly care and life quality: A systematic literature review. Eur. J. Ageing 2023, 20, 27. [Google Scholar] [CrossRef]
  12. Zhou, J.; Zhang, B.; Tan, R.; Tseng, M.L.; Zhang, Y. Exploring the Systematic Attributes Influencing Gerontechnology Adoption for Elderly Users Using a Meta-Analysis. Sustainability 2020, 12, 2864. [Google Scholar] [CrossRef]
  13. Cheng, M.; An, S.; Cheung, C.F.; Leung, Z.; Chun, T.K. Gerontechnology acceptance by older adults and their satisfaction on its servitization in Hong Kong. Behav. Inf. Technol. 2022, 42, 2932–2951. [Google Scholar] [CrossRef]
  14. Xu, X. Does traveler satisfaction differ in various travel group compositions? Evidence from online reviews. Int. J. Contemp. Hosp. Manag. 2018, 30, 1663–1685. [Google Scholar] [CrossRef]
  15. Xu, X.; Li, Y. The antecedents of customer satisfaction and dissatisfaction toward various types of hotels: A text mining approach. Int. J. Hosp. Manag. 2016, 55, 57–69. [Google Scholar] [CrossRef]
  16. Lin, Y.; Fu, Y.; Li, Y.; Cai, G.; Zhou, A. Aspect-based sentiment analysis for online reviews with hybrid attention networks. World Wide Web 2021, 24, 1215–1233. [Google Scholar] [CrossRef]
  17. Qin, C.; Zhang, C.; Bu, Y. Exploring the distribution regularities of user attention and sentiment toward product aspects in online reviews. Electron. Libr. 2021, 39, 615–638. [Google Scholar] [CrossRef]
  18. Blei, D.M.; Ng, A.Y.; Jordan, M.I. Latent Dirichlet Allocation. J. Mach. Learn. Res. 2003, 3, 993–1022. Available online: https://dl.acm.org/doi/abs/10.5555/944919.944937 (accessed on 4 May 2025).
  19. Tirunillai, S.; Tellis, G.J. Mining marketing meaning from online chatter: Strategic brand analysis of big data using latent Dirichlet allocation. J. Mark. Res. 2014, 51, 463–479. [Google Scholar] [CrossRef]
  20. Guo, Y.; Barnes, S.J.; Jia, Q. Mining meaning from online ratings and reviews: Tourist satisfaction analysis using latent Dirichlet allocation. Tour. Manag. 2017, 59, 467–483. [Google Scholar] [CrossRef]
  21. Cho, H.; Kim, S.; Lee, J.; Lee, J. Data-driven integration of multiple sentiment dictionaries for lexicon-based sentiment classification of product reviews. Knowl.-Based Syst. 2014, 71, 61–71. [Google Scholar] [CrossRef]
  22. Rao, Y.; Lei, J.; Wenyin, L.; Li, Q.; Chen, M. Building emotional dictionary for sentiment analysis of online news. World Wide Web 2014, 17, 723–742. [Google Scholar] [CrossRef]
  23. Yuan, M.; Ouyang, Y.; Sheng, H. Investigating association rules for sentiment classification of web reviews. J. Intell. Fuzzy Syst. 2014, 27, 2055–2065. [Google Scholar] [CrossRef]
  24. Manek, A.S.; Shenoy, P.D.; Mohan, M.C.; Venugopal, K.R. Aspect term extraction for sentiment analysis in large movie reviews using Gini index feature selection method and SVM classifier. World Wide Web 2017, 20, 135–154. [Google Scholar] [CrossRef]
  25. Do, H.H.; Prasad, P.W.C.; Maag, A.; Alsadoon, A. Deep learning for aspect-based sentiment analysis: A comparative review. Expert Syst. Appl. 2019, 118, 272–299. [Google Scholar] [CrossRef]
  26. Shuang, K.; Ren, X.; Yang, Q.; Li, R.; Loo, J. AELA-DLSTMs: Attention-enabled and location-aware double LSTMs for aspect-level sentiment classification. Neurocomputing 2019, 334, 25–34. [Google Scholar] [CrossRef]
  27. Devlin, J.; Chang, M.-W.; Lee, K.; Toutanova, K. BERT: Pre-training of Deep Bidirectional Transformers for Language Understanding. In Proceedings of the 2019 Conference of the North American Chapter of the Association for Computational Linguistics: Human Language Technologies, Minneapolis, MN, USA, 2–7 June 2019. [Google Scholar]
  28. Kano, N.; Seraku, N.; Takahashi, F.; Tsuji, S. Attractive Quality and Must-Be Quality. J. Japanese Soc. Qual. Control 1984, 31, 147–156. [Google Scholar] [CrossRef]
  29. Matzler, K.; Hinterhuber, H.H. How to Make Product Development Projects More Successful by Integrating Kano’s Model of Customer Satisfaction into Quality Function Deployment. Technovation 1998, 8, 25–38. [Google Scholar] [CrossRef]
  30. Xu, Q.; Jiao, R.J.; Yang, X.; Helander, M.; Khalid, H.M.; Opperud, A. An Analytical Kano Model for Customer Need Analysis. Des. Stud. 2009, 30, 87–110. [Google Scholar] [CrossRef]
  31. Kuo, Y.-F.; Chen, J.-I.; Cheng, S.-H. IPA–Kano Model: A New Tool for Categorizing and Diagnosing Service Quality Attributes. Total Qual. Manag. Bus. Excell. 2012, 23, 731–748. [Google Scholar] [CrossRef]
  32. Tseng, C.C. An IPA–Kano Model for Classifying and Diagnosing Airport Service Attributes. Res. Transp. Bus. Manag. 2020, 37, 100499. [Google Scholar] [CrossRef]
  33. Ismianti, I.; Mastrisiswadi, H.; Wibowo, A.W.A. Evaluation of Online Learning Satisfaction During Pandemic Using the IPA–Kano Model. J. Syst. Tek. Ind. 2023, 25, 126–135. [Google Scholar] [CrossRef]
  34. Parasuraman, A.; Zeithaml, V.A.; Berry, L.L. A Conceptual Model of Service Quality and Its Implications for Future Research. J. Mark. 1985, 49, 41–50. [Google Scholar] [CrossRef]
  35. Löffler, S.; Baier, D. Using Critical Incidents to Validate the Direct Measurement of Attribute Importance and Performance When Analyzing Services. J. Serv. Sci. Manag. 2013, 6, 1–11. [Google Scholar] [CrossRef]
  36. Xu, Z.; Zhang, L.; Xie, W.; Dang, T. A Study on User Demand Mining of Online Courses Integrating BERTopic and KANO Model: A Case of Python Online Courses. Inform. Sci. 2024, 42, 126–135. [Google Scholar] [CrossRef]
  37. Eskildsen, J.; Kristensen, K. Enhancing Importance-Performance Analysis. Int. J. Product. Perform. Manag. 2006, 55, 40–60. [Google Scholar] [CrossRef]
  38. Beldona, S.; Cobanoglu, C. Importance–Performance Analysis of Guest Technologies in the Lodging Industry. Cornell Hosp. Q. 2007, 48, 299–312. [Google Scholar] [CrossRef]
  39. Deng, W. Using a Revised Importance–Performance Analysis Approach: The Case of Taiwanese Hot Springs Tourism. Tour. Manag. 2007, 28, 1274–1284. [Google Scholar] [CrossRef]
  40. Azzopardi, E.; Nash, R. A Critical Evaluation of Importance–Performance Analysis. Tour. Manag. 2013, 35, 222–233. [Google Scholar] [CrossRef]
  41. Du, L.; Chen, H.; Fang, Y.; Liang, X.; Zhang, Y.; Qiao, Y.; Guo, Z. Research on the method of acquiring customer individual demand based on the quantitative Kano model. Comput. Intell. Neurosci. 2022, 2022, 5052711. [Google Scholar] [CrossRef]
  42. Martilla, J.A.; James, J.C. Importance-Performance Analysis. J. Mark. 1977, 41, 15. [Google Scholar] [CrossRef]
  43. Tata, S.V.; Prashar, S.; Parsad, C. Intention to Write Reviews: Influence of Personality Traits, Attitude, and Motivational Factors. J. Syst. Inf. Technol. 2021, 23, 218–242. [Google Scholar] [CrossRef]
  44. Lin, L.; Chen, Y. Evolution of Chinese Original-Innovation Talent Policies: A Topic Modelling Approach. Technol. Anal. Strateg. Manag. 2023, 36, 4128–4143. [Google Scholar] [CrossRef]
  45. Han, M.; Lee, S.; Kim, J. A Hybrid Approach to Discern Customer Experience for Facilitating the Adoption of Smartwatches. Technol. Anal. Strateg. Manag. 2021, 34, 535–549. [Google Scholar] [CrossRef]
  46. Tang, T.; Tang, X.; Yuan, T. Fine-Tuning BERT for Multi-Label Sentiment Analysis in Unbalanced Code-Switching Text. IEEE Access 2020, 8, 193248–193256. [Google Scholar] [CrossRef]
  47. Chawla, N.V.; Bowyer, K.W.; Hall, L.O.; Kegelmeyer, W.P. SMOTE: Synthetic Minority Over-Sampling Technique. J. Artif. Intell. Res. 2002, 16, 321–357. [Google Scholar] [CrossRef]
  48. Geetha, M.P.; Renuka Dhanaraj, K. Improving the performance of aspect-based sentiment analysis using fine-tuned BERT Base Uncased model. Int. J. Intell. Networks 2021, 2, 64–69. [Google Scholar] [CrossRef]
  49. Hu, L.; Li, C.; Wang, W.; Pang, B.; Shang, Y. Performance Evaluation of Text Augmentation Methods with BERT on Small-sized, Imbalanced Datasets. In Proceedings of the 2022 IEEE 4th International Conference on Cognitive Machine Intelligence (CogMI), Atlanta, GA, USA, 14–17 December 2022. [Google Scholar] [CrossRef]
  50. Ibrahim, M.; Torki, M.; El-Makky, N. Imbalanced Toxic Comments Classification Using Data Augmentation and Deep Learning. In Proceedings of the 17th IEEE International Conference on Machine Learning and Applications (ICMLA), Orlando, FL, USA, 17–20 December 2018; pp. 875–878. [Google Scholar] [CrossRef]
  51. Li, K.; Yan, D.; Liu, Y.; Zhu, Q. A Network-Based Feature Extraction Model for Imbalanced Text Data. Expert Syst. Appl. 2022, 195, 116600. [Google Scholar] [CrossRef]
  52. Sun, C.; Qiu, X.; Xu, Y.; Huang, X. How to Fine-Tune BERT for Text Classification? In Proceedings of the 18th China National Conference on Chinese Computational Linguistics (CCL 2019), Kunming, China, 18–20 October 2019. [Google Scholar] [CrossRef]
  53. Souza, F.D.; Filho, J.B.d.O.e.S. BERT for Sentiment Analysis: Pre-trained and Fine-Tuned Alternatives. In Proceedings of the 15th International Conference on Computational Processing of the Portuguese Language (PROPOR 2022), Fortaleza, Brazil, 22–25 March 2022. [Google Scholar] [CrossRef]
  54. Luca, M.; Zervas, G. Fake it till you make it: Reputation, competition, and Yelp review fraud. Manag. Sci. 2016, 62, 3412–3427. [Google Scholar] [CrossRef]
  55. Amazon Fake Reviews Reach Holiday Season Levels During Pandemic. Available online: https://techxplore.com/news/2020-10-amazon-fake-holiday-season-pandemic.html (accessed on 19 October 2020).
  56. Fakespot Reveals the Product Categories with the Most and Least Reliable Product Reviews. Mozilla. 2024. Available online: https://blog.mozilla.org/en/mozilla/news/fakespot-reveals-the-product-categories-with-the-most-and-least-reliable-product-reviews-for-summer-and-back-to-school-shopping/ (accessed on 12 July 2024).
Figure 1. A-I demand quadrants diagram.
Systems 13 00684 g001
Figure 2. Schematic drawing of the IPA model.
Systems 13 00684 g002
Figure 3. Research framework.
Systems 13 00684 g003
Figure 4. Perplexity trend using Gensim training.
Systems 13 00684 g004
Figure 5. Visualization of the training results when the number of topics was 19.
Systems 13 00684 g005
Figure 6. Training and validation loss over epochs for the selected model.
Systems 13 00684 g006
Figure 7. Kano quadrant chart of attribute preferences.
Systems 13 00684 g007
Figure 8. Three-dimensional decision quadrant map based on the IPAA–Kano model.
Systems 13 00684 g008
Figure 9. Attributes scatter plot based on the IPA–Kano model.
Systems 13 00684 g009
Figure 10. Quadrant-based scatter plot of detailed attributes using the IPA–Kano model.
Systems 13 00684 g010
Figure 11. Importance and attention distribution of attributes in wearable watches for the elderly.
Systems 13 00684 g011
Table 1. Three-dimensional QUAD reference table.
Quad NumberDimension Combination
IHP + HI + HA
IIHP + HI + LA
IIIHP + LI + HA
IVHP + LI + LA
VLP + HI + HA
VILP + HI + LA
VIILP + LI + HA
VIIILP + LI + LA
Table 2. The standard Kano evaluation.
Product/ServiceDysfunctional
LikeNecNeuUnnecDis
FunctionalLikeQAAAO
NecRIIIM
NeuRIIIM
UnnecRIIIM
DisRRRRQ
Note: A: attractive attribute, O: desired attribute, M: necessary attribute, I: indifference attribute, R: reverse attribute, Q: doubtful result.
Table 3. Table showing attribute characteristics of wearable watches for the elderly and the extraction of evaluation indices.
No.First-Level Functional AttributesSecondary-Level Functional Attribute FeaturesThree-Level Extraction Keywords
1Body index monitoringBlood pressure monitoringBlood pressure
Heart rate monitoringHeart rate
Blood lipid monitoringBlood lipid
Blood sugar monitoringBlood sugar
Atrial fibrillation monitoringAtrial fibrillation
Respiratory rate monitoringRespiratory rate
Blood oxygen monitoringBlood oxygen
Uric acid monitoringUric acid
Body temperature monitoringBody temperature
Sleep quality monitoringSleep
2Anti-lossPositioningPositioning, GPS, Gps, gps
NavigationNavigation
Electronic fenceElectronic fence, fence
3AlarmFall alarmAnti-fall alarm, fall alarm, tumble alarm, auto dialing
One-click alarmAlarm, one-click alarm, SOS, sos, Sos, One-click help
4CallCallPhone, making a call, call, voice call
VideoVideo
SoundVolume, sound, sound quality, noise
SignalSignal
5Data recordExercise data recordTrajectory, exercise data, steps, step count
Data sync to phonePhone, data, APP, App, app, sync
6Abnormal alertAbnormal alert (heart rate, blood pressure, etc.)Abnormal, abnormal alert
Medication reminderMedication reminder
Sedentary reminderSedentary, sedentary reminder
Warning notificationWarning
7Remote operationGuardian remote measurement commandRemote guardian
Guardian phone alert for abnormal conditions
8Smart interactionVoice assistantVoice assistant
Message reminderMessage reminder
9BatteryBatteryBattery, endurance, power, charging, charge once
power-consuming
10ScreenScreenScreen, touch screen, display screen, touch screen, clear, font
11Wearing comfortWearing comfortWearing, strap, material, texture, hand feeling
12Appearance designAppearance designColor, style, design, pattern, facial attractiveness analysis, eye-catching, appearance
13Daily life functionsDaily life functionsPayment, weather, weather forecast, timekeeping, alarm reminder
14Entertainment functionsEntertainment functionsNews, music, games, photography
15AccuracyAccuracyAccuracy, error rate, precision, degree of precision, resolution, deviation, inaccuracy
16Ease of operationEase of operationoperation, simplicity, easy to learn, convenient, convenience
17SensitivitySensitivitySensitive, responsive
18DurabilityDurabilityWaterproof, sturdy, quality
19ServiceServiceCustomer service, logistics
20PricePricePrice, performance–cost ratio
21Negative reviewsNegative reviewsAds, trash, bad, wasteful, superfluous, flaw, poor, bad review, does not match
Table 4. Hyperparameter tuning and control strategies for BERT training experiments.
Control MethodsPerformance MetricsResults
Learning RateGrid search over initial settings [5e−5, 2e−5], learning rate scheduler (linear decay, adaptive adjustment)Adaptively adjusted based on validation loss, weighted F1-score and weighted ROC-AUC5e−5
Batch SizeGrid search over batch sizes [8, 16, 32, 64]Validation loss, weighted F1-score and weighted ROC-AUC16
Maximum Sequence LengthText length distribution calculationOverwrites the text categories with the largest distribution ratio128
EpochExperiments with epochs [1, 10], early stopping enabledValidation loss, weighted F1-score, weighted PR-AUC, and weighted ROC-AUC7
Table 5. Results of fine-tuning experiments on hyperparameter combinations using training datasets.
Maximum Sequence LengthHyperparameter CombinationsMean Weighted F1Mean Weighted ROC-AUCVariance of Weighted F1Variance of Weighted ROC-AUCOverall Variance
128Learning rate: 5e−5, batch size: 16, epoch: [1, 10]0.97410.98056.66E−073.85E−075.25E−07
Learning rate: 5e−5, batch size: 32, epoch: [1, 10]0.97440.98073.75E−072.15E−072.95E−07
Learning rate: 2e−5, batch size: 16, epoch: [1, 10]0.97440.98074.63E−072.70E−073.66E−07
Learning rate: 2e−5, batch size: 32, epoch: [1, 10]0.97400.98042.46E−071.42E−071.94E−07
Learning rate: 5e−5, batch size: 8, epoch: [1, 10]0.97300.97975.72E−073.43E−074.57E−07
Learning rate: 5e−5, batch size: 64, epoch: [1, 10]0.97400.98043.81E−072.15E−072.98E−07
Table 6. Satisfaction and attention toward attribute features.
LabelFeatureSatisfactionAttentionLabelFeatureSatisfactionAttention
1Ease of operation0.57570.136423Negative reviews0.31360.0074
2Accuracy0.54550.111224Video0.53330.0067
3Blood pressure monitoring0.55430.085425Daily life functions0.54260.0053
4Data sync to phone0.55920.071826Uric acid monitoring0.56150.0049
5call0.54390.063827Remote operation0.53010.0049
6Blood sugar monitoring0.56190.058328Signal0.5330.0044
7Heart rate monitoring0.57240.047429Blood lipid monitoring0.56490.0036
8Appearance design0.58020.044830Sedentary reminder0.57490.0035
9Positioning0.555090.043831Waterproof0.55860.0031
10Battery0.49390.037732Fall alarm0.55750.0027
11Durability0.57520.033233Navigation0.54210.0024
12Screen0.57890.031234Entertainment functions0.56180.0023
13Wearing comfort0.56960.030135Abnormal alert0.51240.0019
14Service0.55640.027436Ads0.51670.0015
15Price0.54740.023137Warning0.22040.001
16Sound0.53960.019538Payment0.54670.001
17Blood oxygen monitoring0.57150.015639Electronic fence0.39070.0009
18Sleep monitoring0.57320.015240Respiratory rate monitoring0.60.0007
19Sensitivity0.556350.013441Message reminder0.60.00068
20Exercise data record0.54950.012842Medication reminder0.53080.00055
21One-click alarm0.54860.010643Atrial fibrillation monitoring0.60.0001
22Body temperature monitoring0.57190.007744Voice assistant0.64.23E−05
Table 7. Reliability analysis.
Cronbach’s AlphaNumber of Items
0.9290
Table 8. Validity analysis.
positive itemsKMO0.911
Sig.0.000
negative itemsKMO0.914
Sig.0.000
Table 9. Quadrant classification based on attribute preference.
Attribute LabelNameQAOIRMTypeBetterWorseImportanceQUAD
23Call0334938227O0.55780.5172.1141I
34Waterproof1305134231O0.55480.56162.2685I
44Durability0186031535O0.54170.65972.5034I
35Wearing comfort0265531235O0.5510.61222.4564I
37Touchscreen1304541131O0.51020.5172.1477I
39Service1156433531O0.55240.66432.4295I
22Data sync to Phone1354444124O0.53740.46261.9262I
3Heart rate monitoring3384040028O0.53420.46582I
38Screen display clarity1245931232O0.56850.62332.4228II
41Accuracy1285931327O0.60.59312.2819II
42Sensitivity0236432228O0.59180.62592.3826II
12Abnormal reminder to the guardian2395326227O0.63450.55172.2349II
30Signal2315636123O0.59590.54112.1074II
27Battery0366030122O0.64860.55412.1879II
16Positioning3395031125O0.61380.51722.1074II
17Fall alarm3415234118O0.64140.48281.9262II
18One-click alarm6335530124O0.61970.55632.1342II
24Video1355144216O0.5890.45891.7987II
40Ease of operation2176725434O0.58740.70632.604II
11Abnormal alert4434725228O0.62940.52452.1745II
43Warning0444344117A0.58780.40541.7315III
25Voice assistant0394545119O0.56760.43241.8054III
45Price0484045115A0.59460.37161.6309III
13Remote operation2444339120A0.59590.43152.1141III
19Electronic fence5443640420A0.57140.41.8322III
15Sedentary reminder2533640018A0.60540.36731.6913III
4Atrial fibrillation monitoring4542944018A0.57240.32411.6846III
14Medication reminder2504630219A0.66210.44831.5503III
7Blood lipid monitoring3503442119A0.57930.36551.8993III
21Exercise data Record0394645118O0.57430.43241.6577III
2Blood pressure monitoring5453539025A0.55560.41671.7919IV
5Respiratory rate monitoring4493247017A0.55860.33791.8456IV
6Blood oxygen monitoring4433445023I0.5310.39311.5436IV
8Uric acid monitoring3513049214A0.56250.30561.745IV
9Body temperature monitoring3413346224I0.51390.39581.4161IV
20Navigation2394146021I0.54420.42181.745IV
10Sleep monitoring3423938225A0.56250.44441.7919IV
33Entertainment Functions0323662316I0.46580.35621.906IV
32Daily life functions1403850119I0.53060.38781.4765IV
31Payment170067110A0.510901.6711IV
29Sound loud3364251215I0.54170.39580.4698IV
28Sound clear1314650219I0.52740.44521.5906IV
26Message reminder1414045022I0.54730.41891.7718IV
36Appearance design1413655214I0.52740.34251.8188IV
1Blood sugar monitoring9412353320I0.46720.31391.4698IV
Table 10. Decision results for each P-dimension using the IPAA–Kano model with a weight configuration of (1, 0).
Attribute LabelAttribute NameP-DimensionQUADImprovement Priority CoefficientImprovement PriorityIgnorance PriorityCognitive ManagementMaintenance Priority
44DurabilityMust-beI1.6566///1
35Wearing comfortI1.644///2
37TouchscreenI1.3801///3
3Heart rate monitoringI1.2525///4
34WaterproofII1.5087//High performance, high importance, but low attention; because of the must-be attributes, it does not have the propagation valve5
39ServiceV1.67751///
23CallV1.41652///
22Data sync to phoneV1.23113///
40Ease of operationOne-dimensionalI1.7369///6
38Screen display clarityI1.6064///7
17Fall alarmII1.2240//Raise awareness8
27BatteryV1.62984///
42SensitivityV1.6115///
41AccuracyV1.55656///
18One-click alarmV1.42167///
16PositioningV1.38238///
12Abnormal reminder to the guardianVI1.55249/Reduce attention before improvement, raise awareness after improvement/
11Abnormal alert VI1.54610/Reduce attention before improvement, raise awareness after improvement/
30SignalVI1.439611/Reduce attention before improvement, raise awareness after improvement/
24VideoVIII1.1675/7//
45PriceAttractiveIII0.9398///9
25Voice assistant IV1.043/6//
15Sedentary reminder IV0.9901/5//
7Blood lipid monitoringIV0.9853/4//
4Atrial fibrillation monitoring IV0.8438/3//
14Medication reminderVI1.26212/Reduce attention before improvement, raise awareness after improvement/
13Remote operationVI1.204113/Reduce attention before improvement, raise awareness after improvement/
21Exercise data recordVII1.127414/Pseudo-demand, reduce attention/
19Warning VIII1.0815/2//
43Electronic fenceVIII1.0557/1//
Table 11. Decision results for each P-dimension using the IPA–Kano model.
Attribute NameP-DimensionQUADPriority Improvement CoefficientImprovement PriorityMaintenance Priority
ServiceMust-beI1.67751/
CallI1.41652/
Data sync to phoneI1.23113/
DurabilityII1.6566/1
Wearing comfortII1.644/2
WaterproofII1.5087/3
TouchscreenII1.3801/4
Heart rate monitoringII1.2525/5
BatteryOne-dimensionalI1.62984/
SensitivityI1.6115/
AccuracyI1.55656/
Abnormal reminder to the guardianI1.55247/
Abnormal alertI1.5468/
SignalI1.43969/
One-click alarmI1.421610/
PositioningI1.382311/
Ease of operationII1.7369/6
Screen display clarityII1.6064/7
Fall alarmII1.224/8
VideoIV1.167512/
Medication reminderAttractiveI1.26213/
Remote operationI1.204114/
Voice assistantIII1.043/9
Sedentary reminderIII0.9901/10
Blood lipid monitoringIII0.9853/11
PriceIII0.9398/12
Atrial fibrillation monitoringIII0.8438/13
Exercise data record IV1.127415/
WarningIV1.081516/
Electronic fenceIV1.055717/
Table 12. Evaluation of model effectiveness: paired t-test results.
Evaluation DimensionIPA–Kano Model Score (Mean ± Standard Deviation)IPAA–Kano Model Score (Mean ± Standard Deviation)t-Statisticp-ValueMean Difference
Practical relevance3.32 ± 0.594.02 ± 0.657.65<0.0010.7
Decision-making support3.16 ± 0.624.06 ± 0.689.84<0.0010.9
Ease and acceptability3.4 ± 0.573.92 ± 0.675<0.0010.52
Table 13. Sensitivity analysis showing consistency rates of attribute quadrant classification under different threshold perturbations (±3%, ±10%) from the median.
Compared withTotal AttributesConsistentInconsistentConsistency Rate (%)
plus_3%4133880.49
minus_3%4134782.93
plus_5%41291270.73
minus_5%4132978.05
plus_10%41202148.78
minus_10%41261563.41
Table 14. Sensitivity analysis of quadrant classification consistency for bimodal data.
Compared withTotal AttributesConsistentInconsistentConsistency Rate (%)
plus_3%4137490.24
minus_3%4139295.12
plus_5%41311075.61
minus_5%4139295.12
plus_10%41241758.54
minus_10%4139295.12
Table 15. Sensitivity analysis of quadrant classification consistency for lognormal data.
Compared withTotal AttributesConsistentInconsistentConsistency Rate (%)
plus_3%4135685.37
minus_3%4139295.12
plus_5%41311075.61
minus_5%4136587.8
plus_10%41271465.85
minus_10%4133880.49
Table 16. Sensitivity analysis of quadrant classification consistency for normal data.
Compared withTotal AttributesConsistentInconsistentConsistency Rate (%)
plus_3%4132978.05
minus_3%4135685.37
plus_5%41251660.98
minus_5%41301173.17
plus_10%41103124.39
minus_10%41221953.66
Table 17. Sensitivity analysis of quadrant classification consistency for uniform data.
Compared withTotal AttributesConsistentInconsistentConsistency Rate (%)
plus_3%4137490.24
minus_3%4139295.12
plus_5%4132978.05
minus_5%4136587.8
plus_10%41291270.73
minus_10%4134782.93
Table 18. Comparison of the IPA–Kano and IPPA–Kano models.
Comparison DimensionIPA–Kano ModelIPAA–Kano ModelContribution
Decision VariablesSatisfactionSatisfaction + AttentionSolution for “cognitive misalignment” between attention to attributes and satisfaction
Importance CalculationDerived from separate surveyDerived from Kano preferences (contribution-based)Ensures internal consistency
Data SourcesStructured survey onlySurvey + Online Reviews (UGC)Improves real-world relevance and dynamic reflection
Attribute Ranking ResultsUniform across weightsFlexibility under different decision-weight scenarios; identification and development of neglected priorities; and cognitive management strategiesSupports fine-grained contextual decision-making; cognitive management of “cognitive misalignment” attributes
Disclaimer/Publisher’s Note: The statements, opinions and data contained in all publications are solely those of the individual author(s) and contributor(s) and not of MDPI and/or the editor(s). MDPI and/or the editor(s) disclaim responsibility for any injury to people or property resulting from any ideas, methods, instructions or products referred to in the content.