1. Introduction
Value co-creation, as proposed in service-oriented logic [
1], is an open innovation process that integrates knowledge, information, and skills through multi-agent participation, enabling entities to achieve sustainable competitive advantages [
2]. Among these actors, customers play a dual role, as a key driver of innovation and a source of competitive advantage for enterprises [
3]. The concept of user-centered design (UCD) [
4] and participatory design across fields, including gerontechnology [
5,
6], exemplifies this trend by focusing on users’ needs.
With the increasing pace of global aging, elderly care has become both essential and increasingly important. Gerontechnology plays a critical role in improving the quality of life for older adults and their caregivers. However, older adults are generally perceived as less inclined to adopt new technologies compared to younger populations [
7,
8,
9], and barriers to gerontechnology acceptance among this demographic remain persistent [
10]. Research has highlighted that technology usability, user-friendliness, and social influences are significant predictors of gerontechnology acceptance [
11]. Additionally, product and technical attributes are key determinants of adoption among elderly users [
12]. Effective systems for promoting gerontechnology adoption should integrate both products and services to facilitate acceptance [
13]. These factors are essential for advancing gerontechnology innovations aimed at improving acceptance and enhancing the quality of life for the elderly.
However, which technical characteristics should be improved, and how can innovation opportunities in gerontechnology be effectively identified? Few studies focus on identifying innovation opportunities and decision-making for attribute-level improvements from the perspective of user needs and market characteristics. Therefore, it is essential to adopt the philosophy of value co-creation for technological innovation by leveraging user-generated content (UGC), particularly electronic word-of-mouth (e-WOM), which reflects customer needs and satisfaction.
Researchers have analyzed user satisfaction through online reviews, with positive reviews reflecting customer satisfaction and negative reviews indicating dissatisfaction [
14,
15]. Aspect-based sentiment analysis (ABSA) is a crucial task in this domain, focusing on identifying user sentiment regarding specific aspects of an entity in text, where the aspect represents any characteristic or attribute of that entity [
16]. Attribute extraction and attribute sentiment computation are the two subtasks involved in attribute-level sentiment analysis [
17]. As for the attribute extraction task, research indicates that LDA [
18] is widely recognized as an effective method for identifying product and service attributes from online reviews [
19,
20].
The task of sentiment computing can be handled by traditional methods, such as dictionary-based methods [
21,
22] and rule-based methods [
23]. Machine learning methods [
24], including deep learning methods [
25,
26], are developed with the tendency to use a convolutional neural network. With the advent of large models, pre-trained language models such as BERT [
27] perform particularly well on ABSA tasks. These models are pre-trained on large-scale corpora and can then be fine-tuned to specific ABSA tasks.
For analyzing customer needs, the Kano model has been extensively adopted across industries as a reliable tool for understanding customer preferences [
28,
29,
30]. Additionally, Kuo et al. [
31] introduced the IPA–Kano model [
32,
33], which combines Importance–Performance Analysis and the Kano model to categorize service quality attributes and prioritize strategies accordingly.
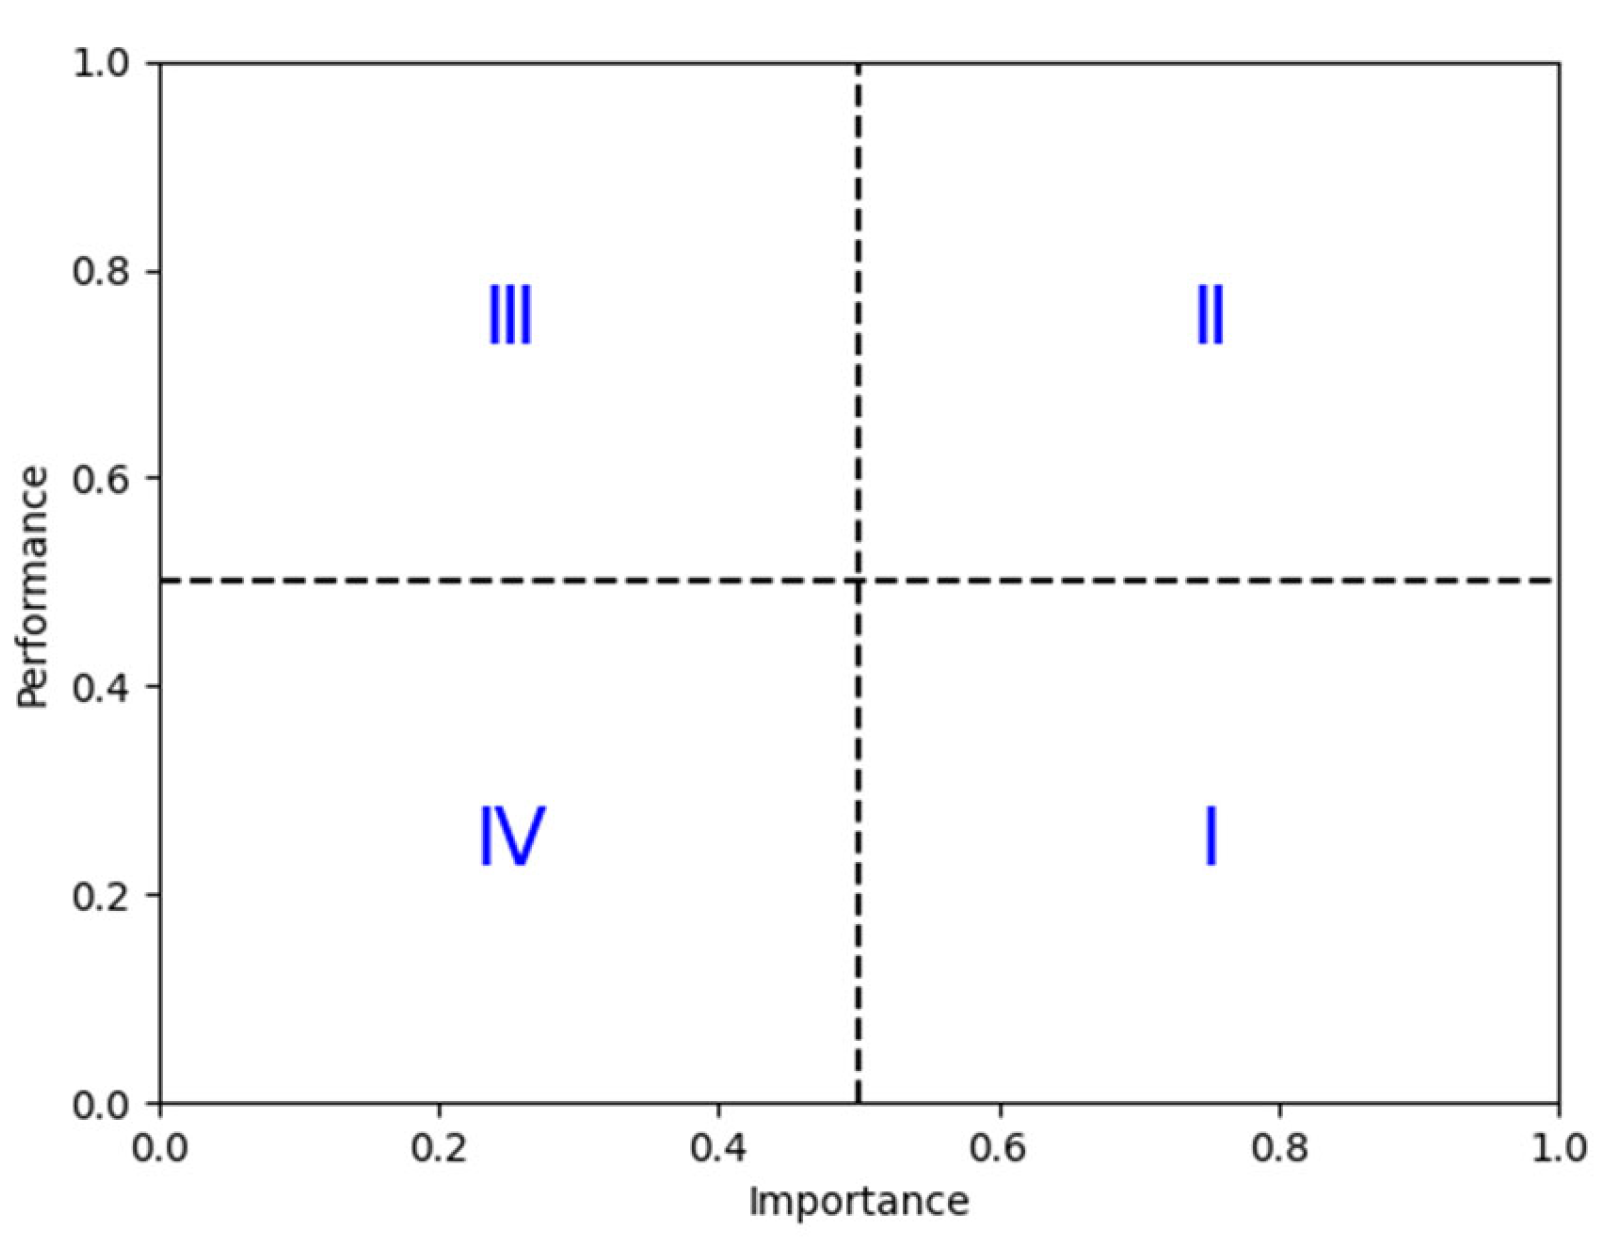
While analyzing user-generated content in the context of technology products, we observe that attributes frequently discussed by consumers (e.g., exterior design) often have limited actual influence on user satisfaction. This reveals a misalignment between explicit attention and implicit utility, an inconsistency largely overlooked by traditional evaluation models such as IPA or Kano.
Drawing on the service gap theory [
34], such mismatches can be attributed to cognitive distortions or incomplete market feedback mechanisms, which prevent decision-makers from accurately interpreting what truly drives satisfaction. This phenomenon becomes especially critical in resource-constrained decision contexts such as aging services, where misallocating effort to low-utility but high-attention attributes may hinder well-being outcomes.
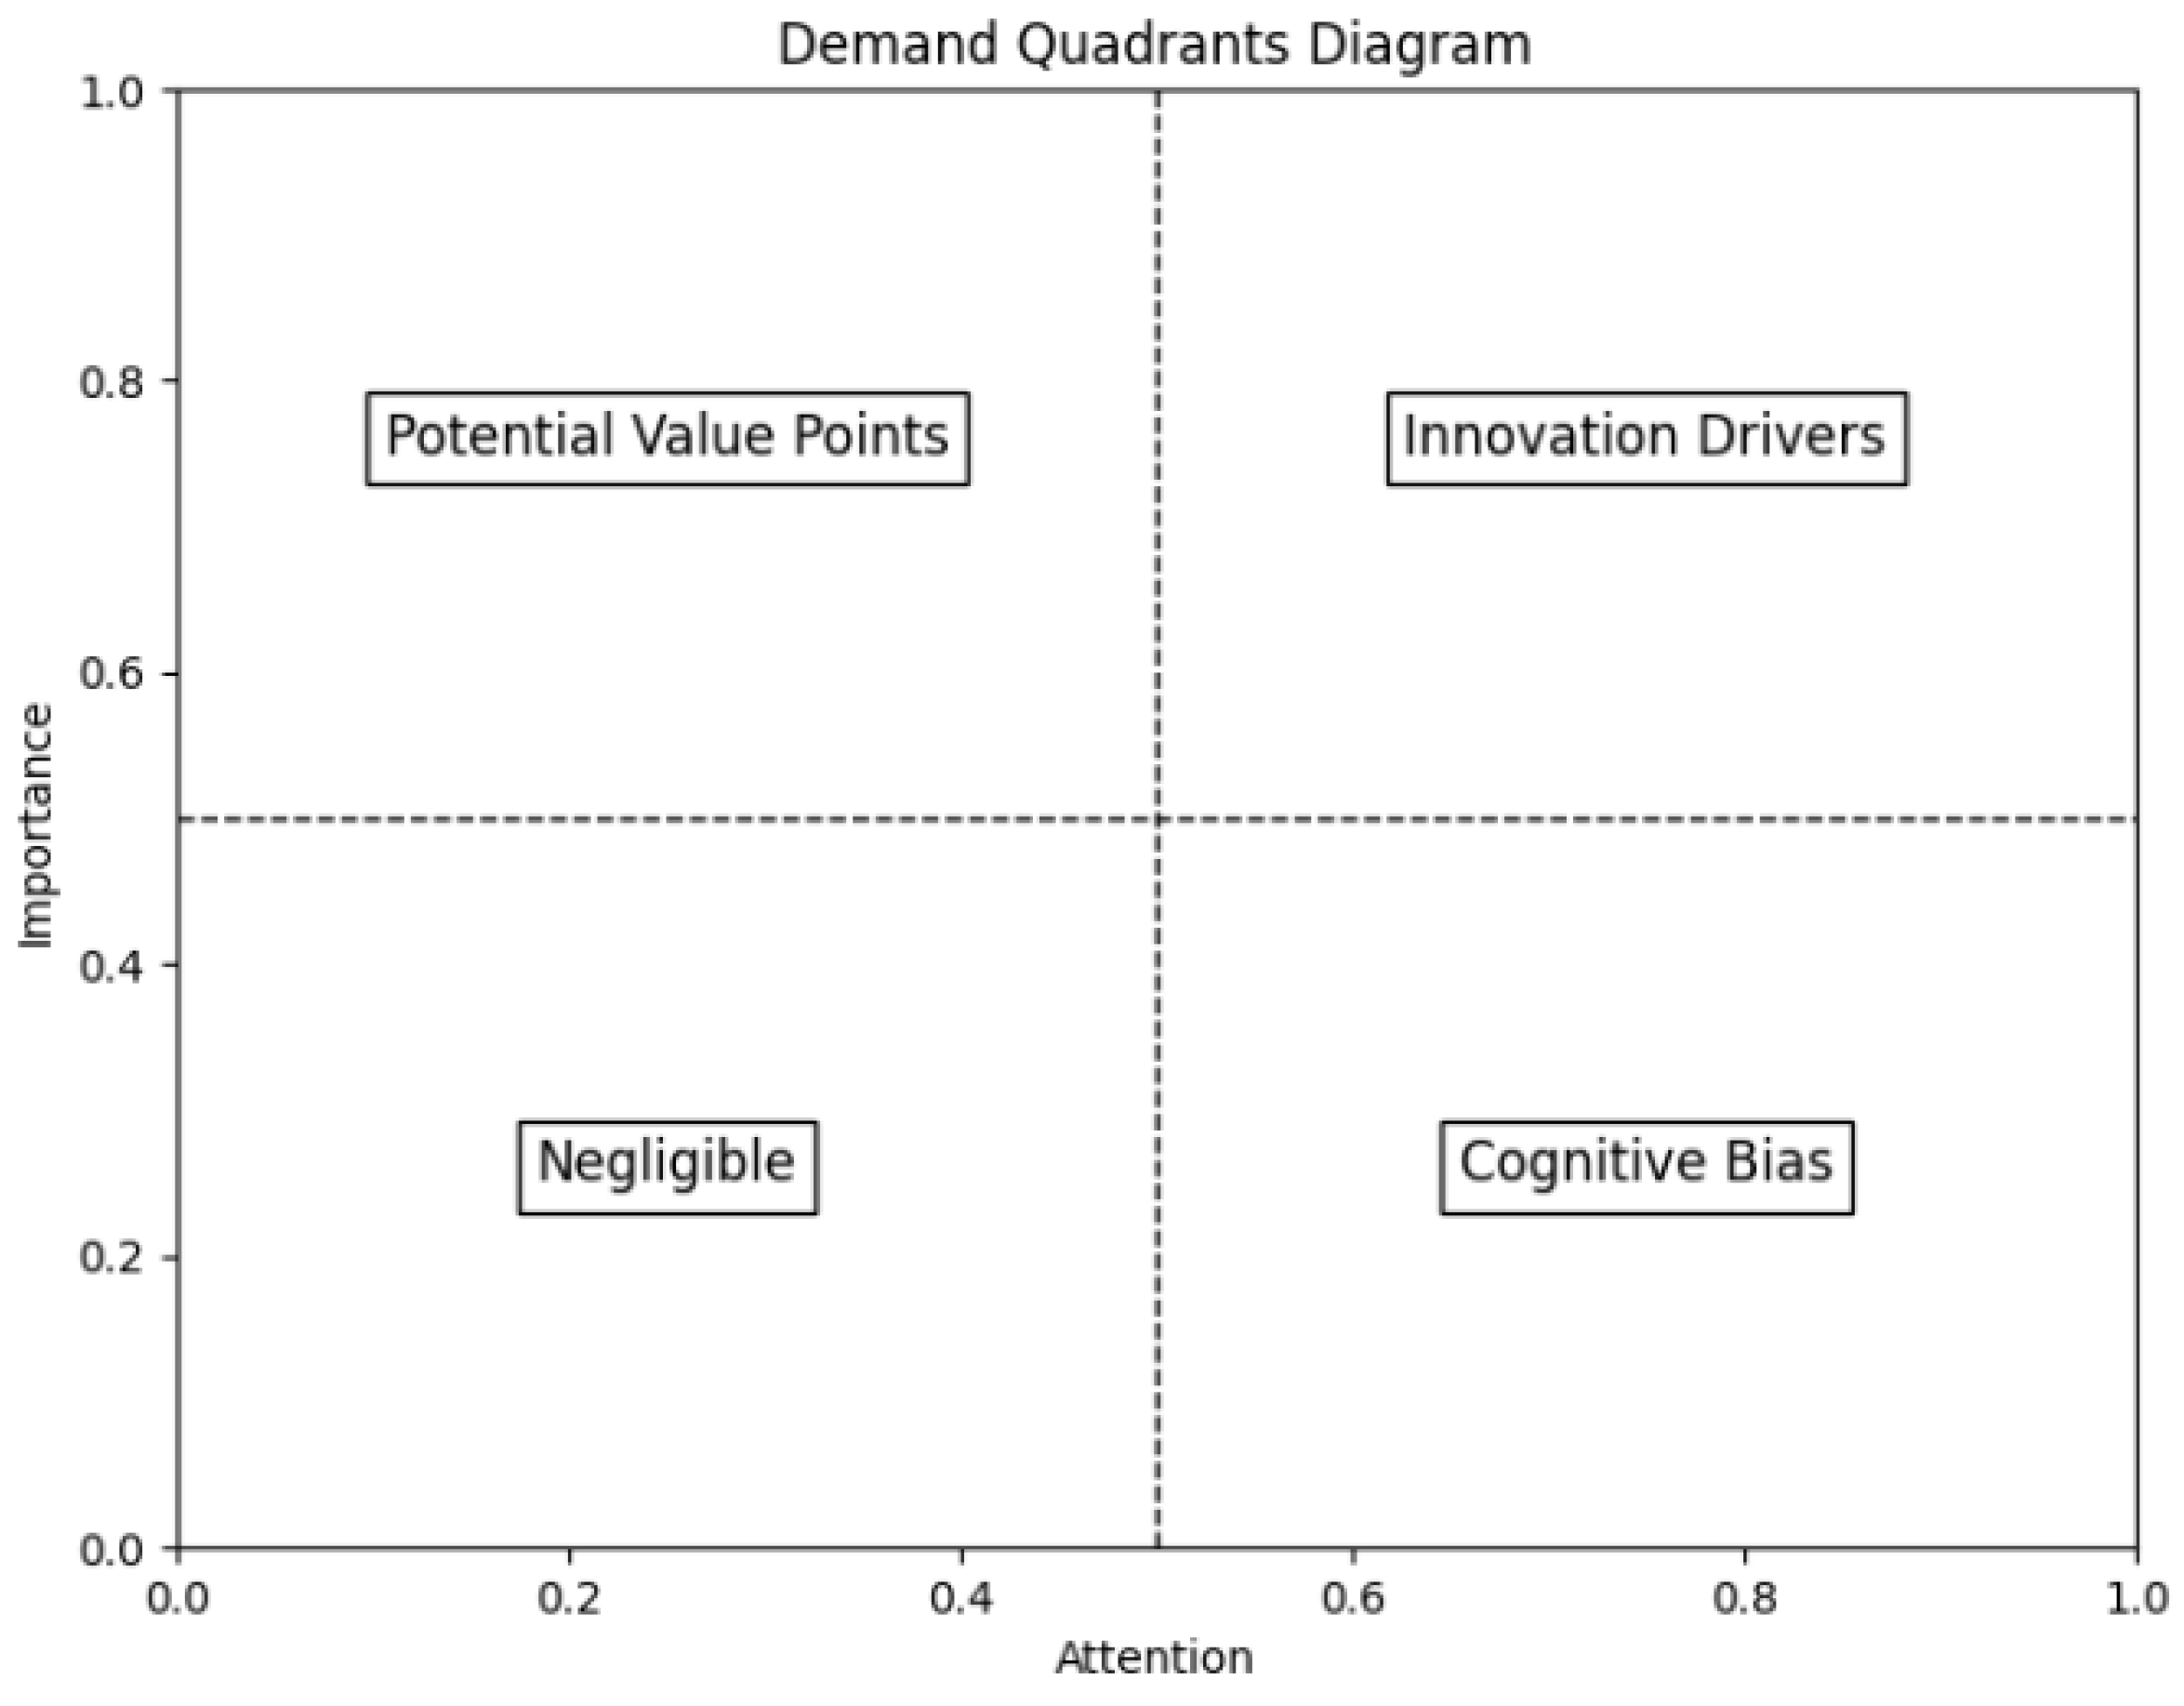
To address this issue, we propose the IPAA–Kano model, an extension of IPA–Kano, which integrates an attention dimension to explicitly capture the perceptual salience of attributes. This three-dimensional framework enable the following: (1) fine-grained classification of attributes by aligning perceived attention with actual satisfaction impact; (2) dual-pathway decision strategies—either improving attribute quality or managing user perception—to resolve the attention–utility paradox.
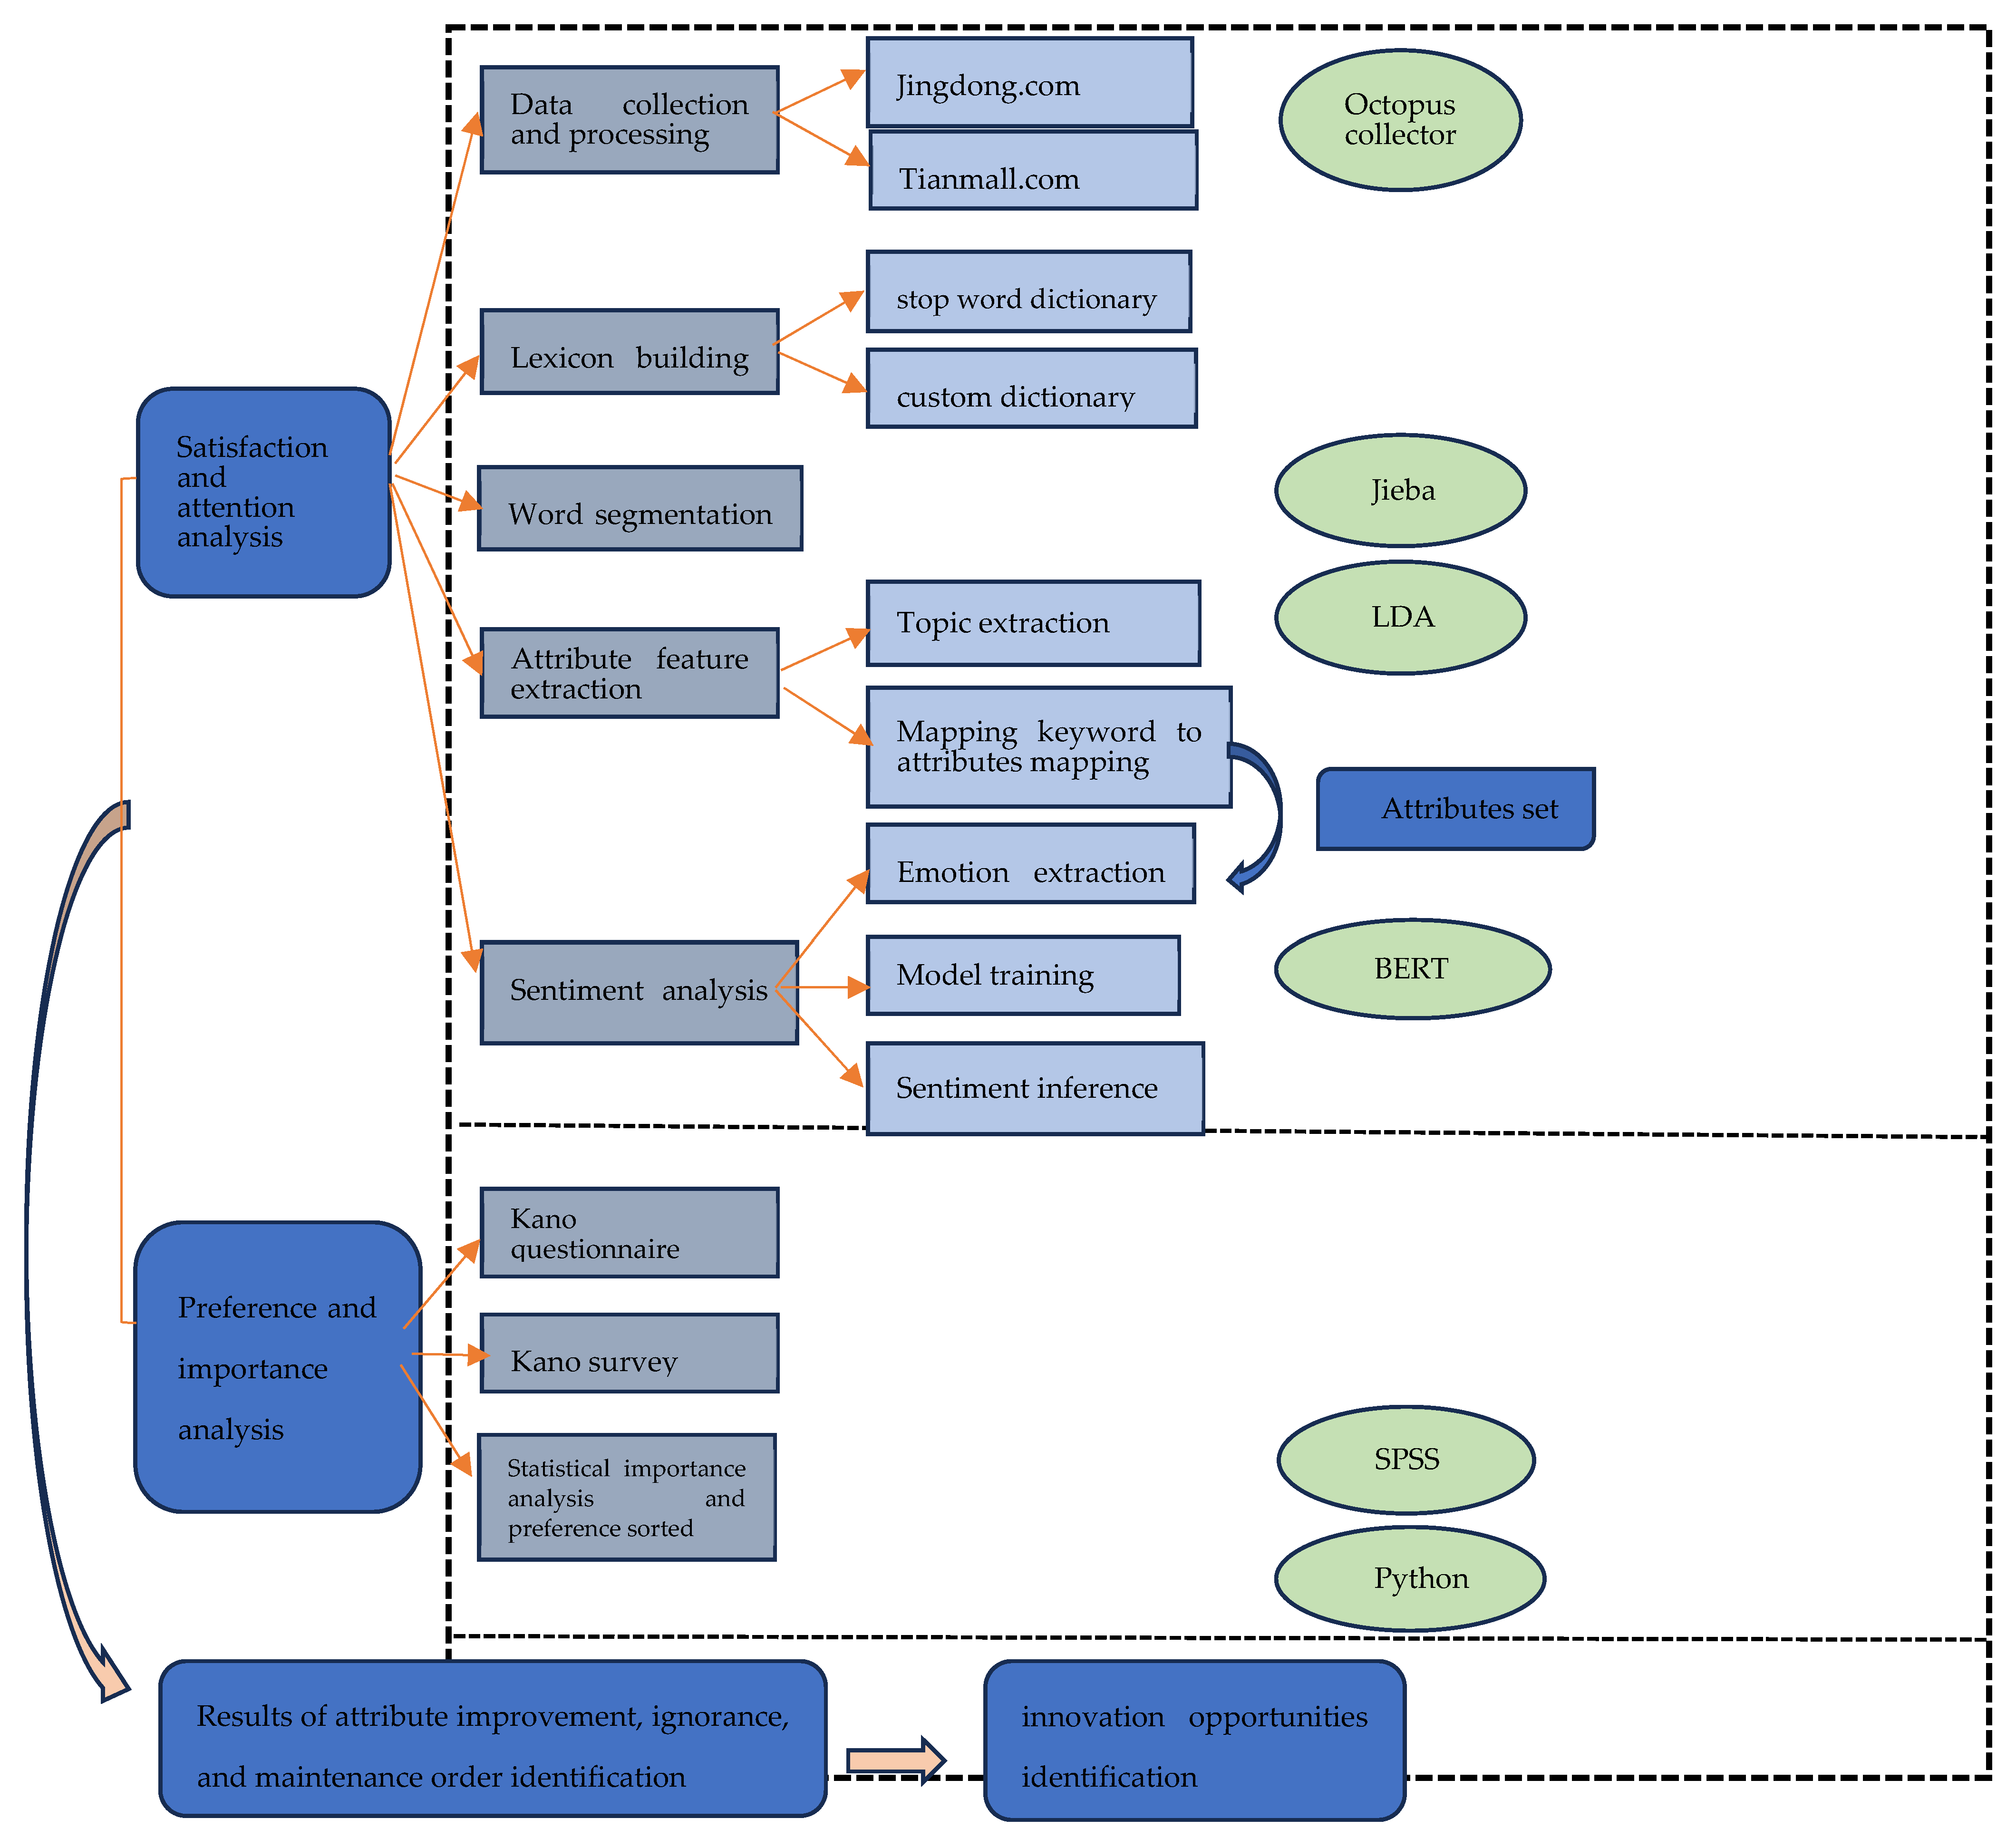
To implement this model effectively, we employ a hybrid NLP pipeline leveraging LDA topic modeling, expert review, API-based sentiment labeling, and BERT-based sentiment evaluation—balancing automation with interpretability to support objective, scalable decision-making.
The contributions of this study are threefold: (1) Extension of the IPA–Kano framework. This study extends the traditional IPA–Kano model by introducing an attention dimension, enabling a three-dimensional framework that distinguishes between perceived salience and the actual utility of product attributes. This addresses the previously overlooked explicit attention–implicit utility inconsistency, resulting in a more nuanced, real-world-aligned decision-making model across eight defined decision spaces. (2) A practical analytical pipeline for attention-aware evaluation. By combining topic modeling (LDA), transformer-based sentiment evaluation (BERT), and expert validation, we introduce a semi-automated process to identify and label product attributes for fine-grained analysis. (3) Real-world application to wearable technology for the elderly. Applying the framework to 41 product attributes of elderly smartwatches, we demonstrate its effectiveness in prioritizing improvement strategies and uncovering overlooked but valuable features. This offers practical guidance for resource-optimized innovation design.
3. Case Study: Evaluating Elderly Smartwatch Attributes Through the Enhanced IPA–Kano Model
3.1. Data Collecting and Processing
To validate the model’s practical application, we used wearable watches for the elderly as a case study. Online reviews were collected from JD.com and Tmall, two major digital marketplaces in China, using Octopus Collector, a specialized data collection tool. A total of 12,527 reviews were gathered, with follow-up comments merged into single reviews. Python 3.8.0 was employed to remove duplicate comments and irrelevant characters during data cleaning.
3.2. Identifying Innovation Needs in Gerontechnology via Text Mining
3.2.1. Attribute Keyword Extraction Based on LDA Topic Model
LDA (Latent Dirichlet Allocation) is an unsupervised machine learning technique used for identifying latent topics in large document collections [
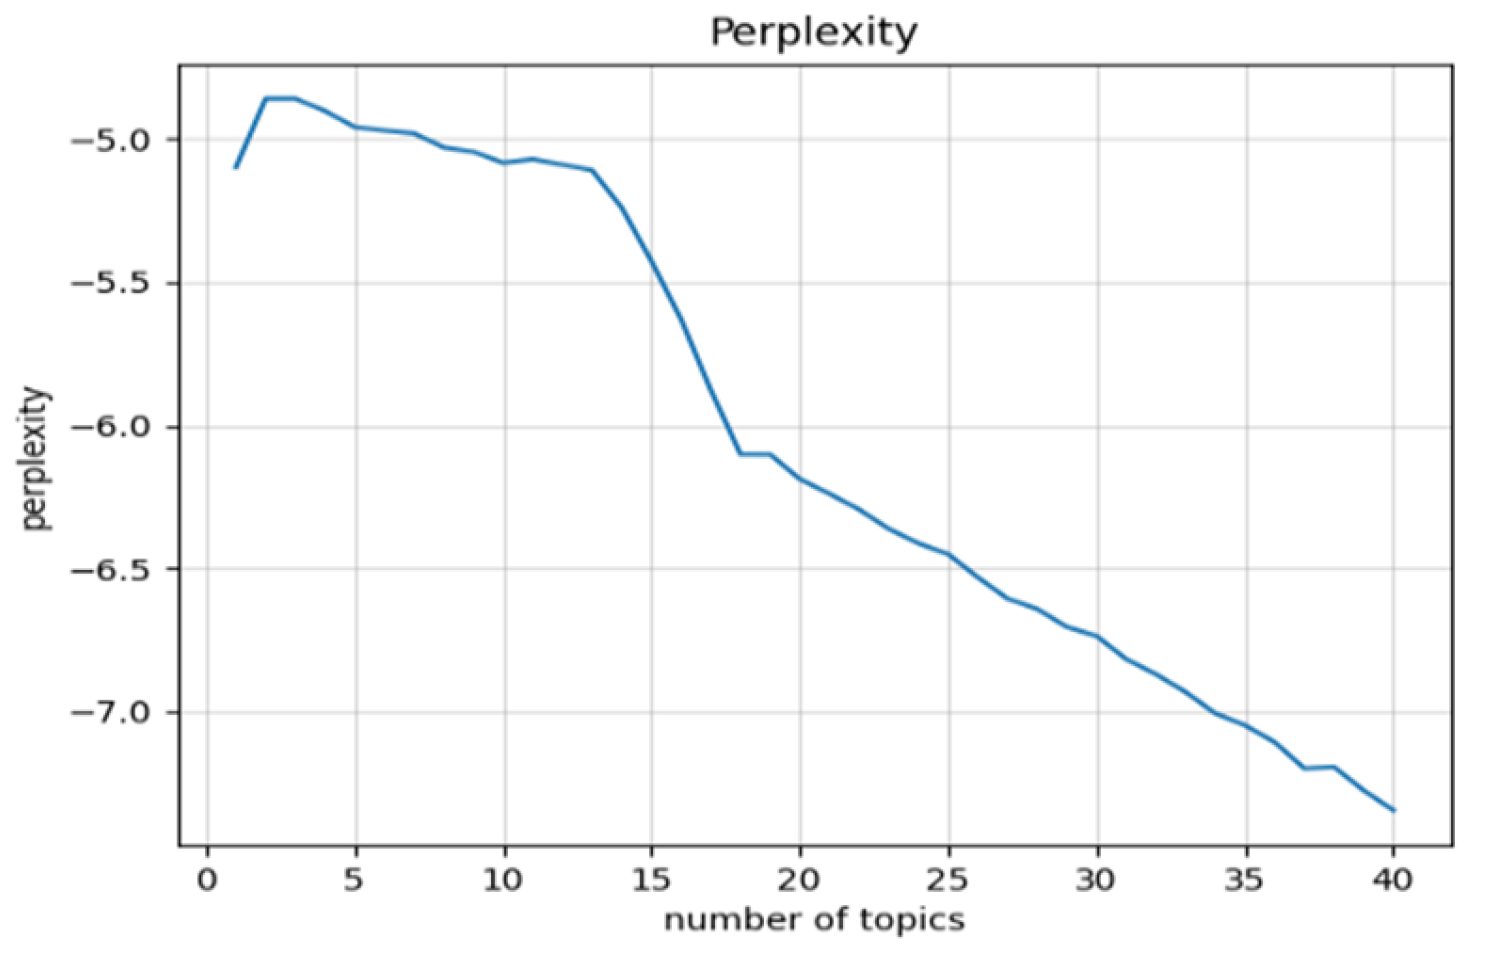
18]. After constructing stop-word and custom dictionaries and performing word segmentation, we trained the LDA model using Gensim. The optimal number of topics was determined through both quantitative and qualitative methods. Perplexity, a widely used metric, was selected for its interpretability and applicability [
44], while manual evaluation ensured topic interpretability [
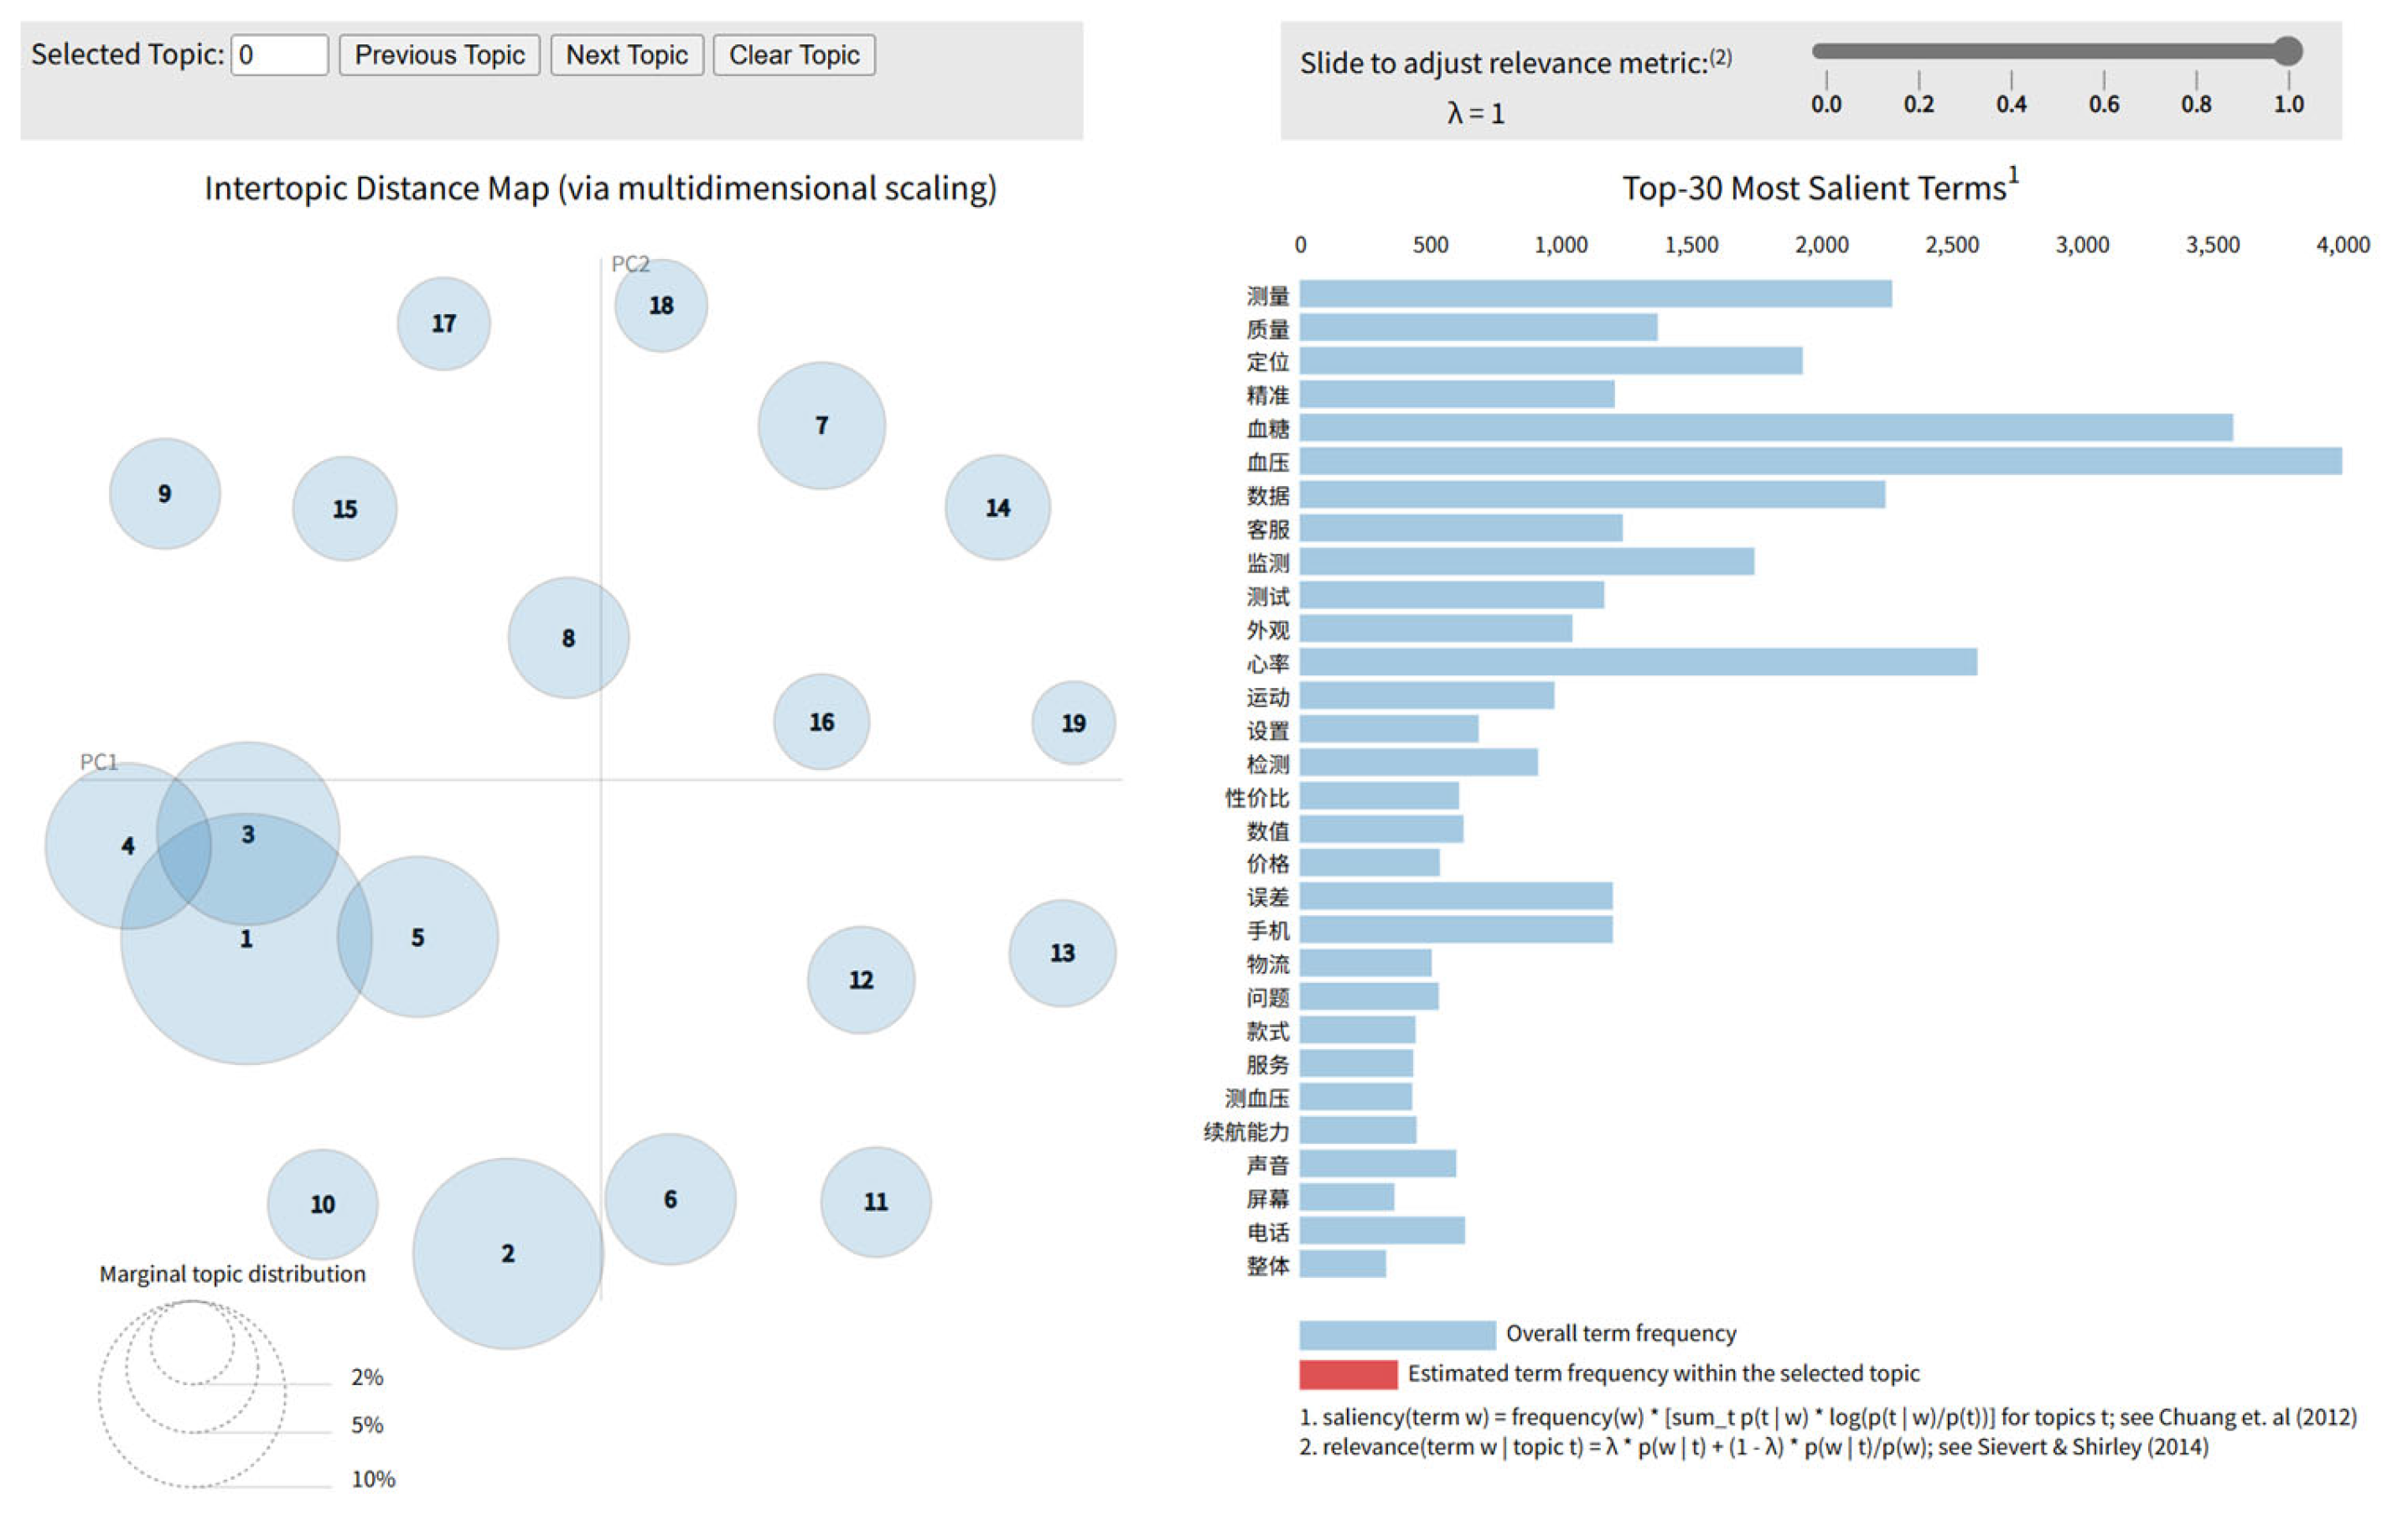
45]. Consistent with prior studies, we employed both perplexity and manual checks for validation. When the number of topics reached 18 or 19, the curve slope decreased sharply and leveled off (
Figure 4). Keywords from 19 topics were chosen as the candidate pool for extracting attribute features of wearable watches for the elderly. The training results are shown in
Figure 5 using pyLDAvis.
3.2.2. Mapping of Topic Keywords to Requirement Attribute Features by Human Interpretation
Following the methodology of Guo et al. (2017) [
20] and Tirunillai et al. [
19], each identified topic label was treated as an attribute of the product or service. This process yields a set of labeled topics (attributes) and their associated keywords. We mapped these keywords to the product attribute features, developing the attribute characteristics and evaluation indices for wearable watches for the elderly.
After LDA modeling, we extracted the top 30 keywords from each topic. Three trained annotators (with backgrounds in consumer behavior and product design) independently interpreted each topic by reviewing the keywords and a random sample of topic-representative documents. They then assigned a representative attribute label to each topic (e.g., “Battery”, “Appearance Design”, “Anti-loss”), which was later discussed and finalized in a consensus meeting. To ensure reliability, the attribute labels were independently assigned by three coders. Inter-rater agreement was measured using Cohen’s Kappa, which yielded a score of 0.78, indicating substantial agreement. Discrepancies were discussed and resolved by consensus in a follow-up meeting, resulting in a finalized list of 21 first-level functional attribute features and evaluation indicators, 41 s-level attribute indicators (34 functional and 7 evaluative). A total of 120 keywords are extracted, including sub-attributes or synonyms for the same attribute, as shown in
Table 3.
Overall, the use of LDA helped guide the identification of high-frequency themes in user reviews. However, to ensure interpretability and contextual relevance, human judgment was applied for attribute mapping. The inclusion of multiple coders and inter-rater agreement assessment strengthened the reliability and reproducibility of this process.
3.3. Analysis of Attribute Feature Satisfaction and Attention Using BERT
3.3.1. Selection of Pre-Trained Models, Data Annotation, and Preprocessing
We employed an attribute-level sentiment analysis approach, a sub-form of Aspect-Based Sentiment Analysis (ABSA), to assess user sentiment toward specific product features. This method enables a fine-grained understanding of user preferences and dissatisfaction points.
BERT (Bidirectional Encoder Representations from Transformers) is a bidirectional transformer-based pre-trained model introduced by Google in 2018 [
27]. It demonstrates superior performance in natural language tasks, including information retrieval, question answering, sentiment analysis, sequence labeling, and natural language inference.
Fine-tuning pre-trained BERT enhances performance and generalization across tasks while maintaining robustness against overfitting. Following prior research [
46], we used a pre-trained BERT-based Chinese model. Emotional labeling was performed using the Deep Seek API, which annotates texts with negative, neutral, and positive sentiments. A systematic sampling method was applied, extracting 30% of the texts for each attribute. Following annotation, the dataset was partitioned into 80% training data, 10% validation data (for model tuning), and 10% test data (for final evaluation). To address class imbalance, data augmentation techniques such as oversampling [
47] were applied. The final dataset included 17,188 training samples, 2149 validation samples, and 2149 test samples. The AdamW optimizer [
48] and a learning rate scheduler were employed during training.
3.3.2. Selection of Model Performance Metrics
Consistent with previous studies [
49,
50,
51], we used the weighted F1-score and the weighted ROC-AUC to evaluate model performance on imbalanced datasets, as it is a harmonic mean of precision and recall. For multi-class classification with imbalanced data, we employed weighted categorical cross-entropy loss [
48] to compute the loss.
3.3.3. Fine-Tune Experimental Training and Sentiment Inference Results
Following the methods of Sun et al. (2019) [
52] and Souza et al. (2022) [
53], we first conducted single-parameter tuning—holding other parameters constant—to assess individual impacts on model performance. This helped define reasonable parameter ranges and narrow the search space. Text length analysis showed that 75% of the texts were under 115 characters, mostly between 50 and 120, so the maximum sequence length was set to 128. A grid search was then applied to optimize learning rate, batch size, and training epochs. Detailed settings and results are presented in
Table 4 and
Table 5. In this paper, lowercase letters in scientific notation represent parameter settings, while uppercase letters indicate computed results.
Using 10 randomly generated seeds [780, 2429, 2588, 5067, 5675, 6308, 7252, 7504, 7926, 9880], along with seed 42, we conducted 11 training runs per hyperparameter setting, totaling 66 experiments. The mean and variance of the weighted avg F1 and ROC-AUC scores were calculated to evaluate performance and stability. The global mean score was 0.9772, indicating high effectiveness, and the low variance (3.56E−07) demonstrated strong stability and robustness.
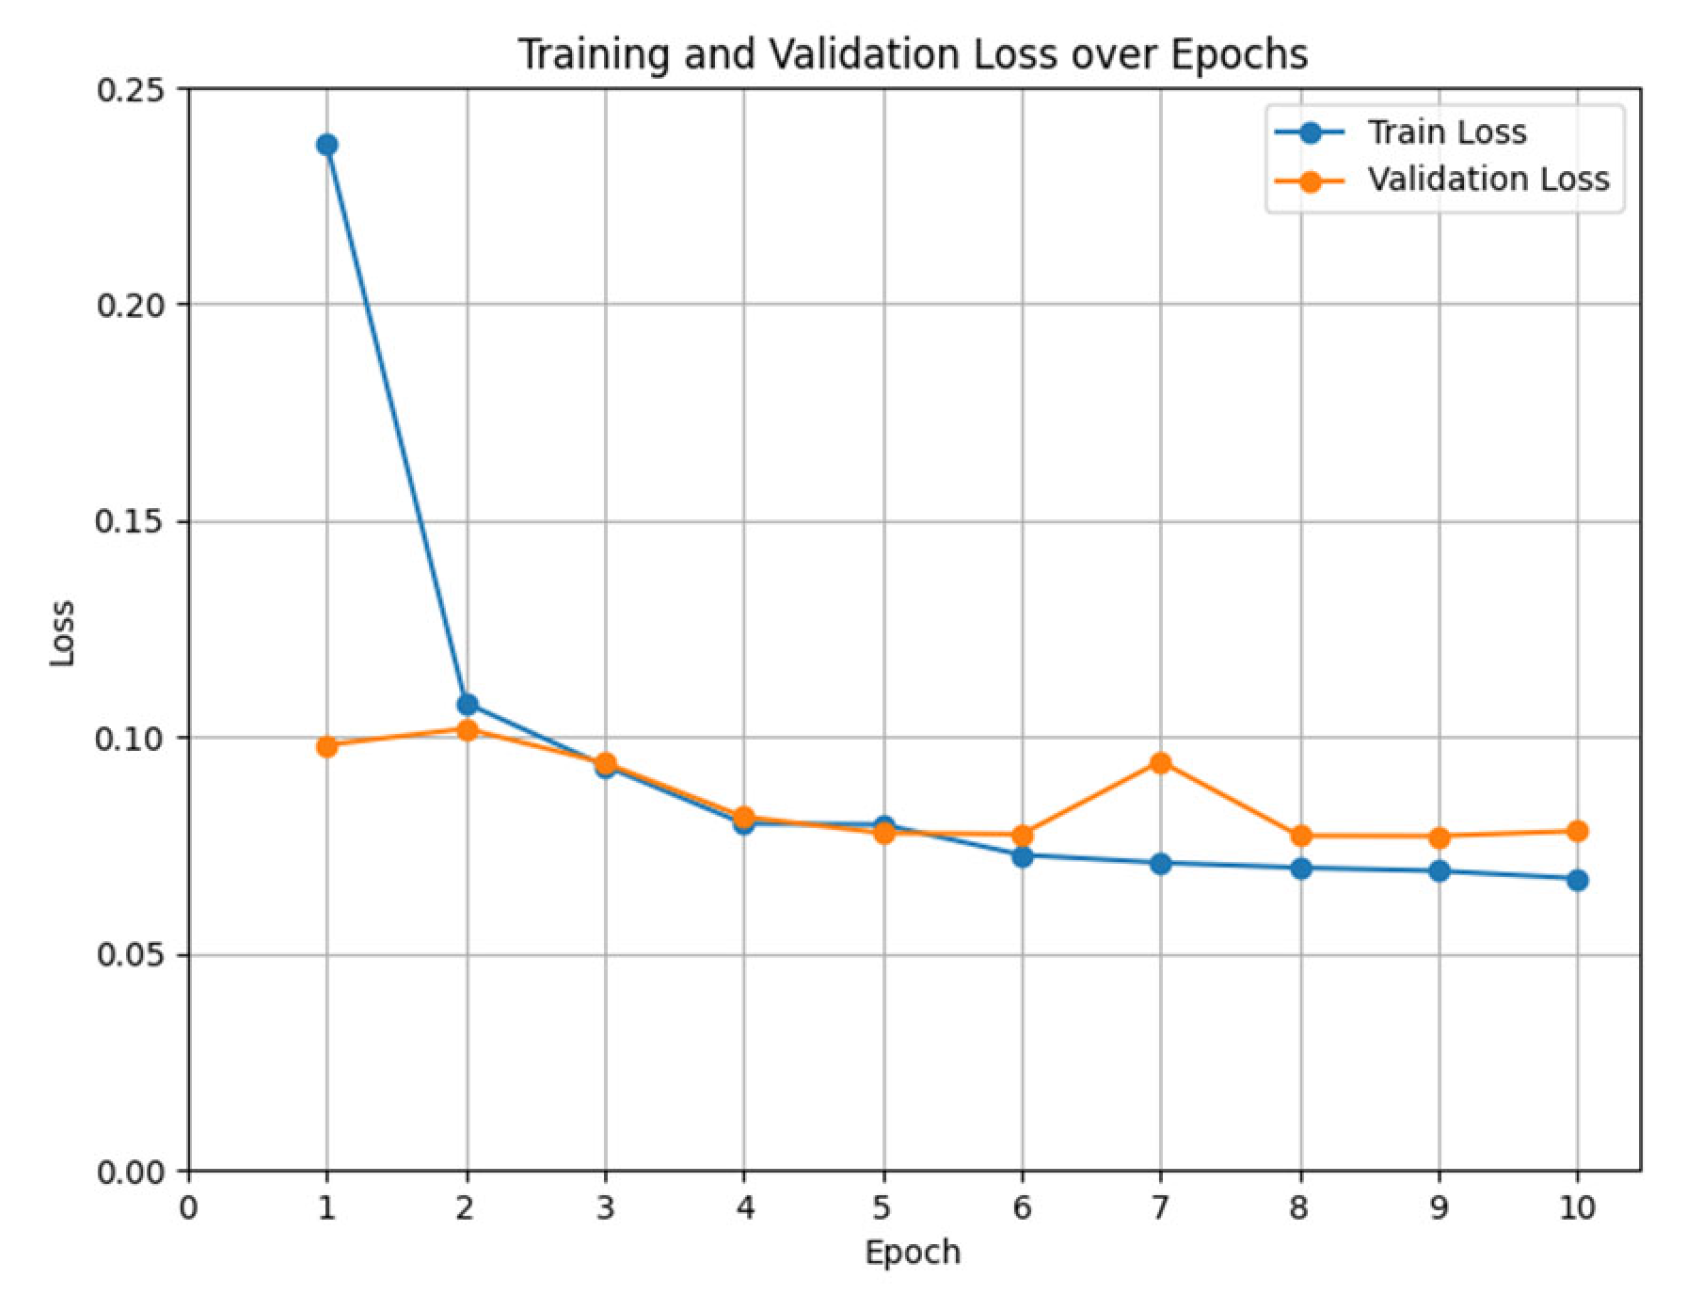
We selected the trained model with the hyperparameter combination [maximum sequence length: 128, learning rate: 5e
−5, batch size: 32] due to its optimal comprehensive performance and low variance. Specifically, the model from the eighth epoch with a random seed of 780 was chosen, as shown in
Figure 6, achieving the following performance metrics: a weighted F1-score of 0.9754 and a weighted ROC-AUC of 0.9815. On the test set, the model achieved a weighted F1-score of 0.9791 and a weighted ROC-AUC of 0.9982, comparable to its validation performance, demonstrating strong generalization ability.
Finally, the selected model was used to predict sentiment evaluations for the entire comment dataset on attribute features. Considering the existence of fake reviews [
54,
55,
56], we assume real review data with a 60% ratio, and that fake reviews are mainly positive comments. The satisfaction and attention inference results are presented in
Table 6.
The Pearson correlation coefficient between satisfaction and attention was 0.1117, with a p-value of 0.4651, indicating no significant correlation. This suggests that the frequency of mentions or attention given to an attribute is unrelated to actual satisfaction with that attribute.
3.4. Analysis of Satisfaction Importance and Preferences Based on Kano
3.4.1. Kano Questionnaire Design and Basic Analysis
Based on the attribute features outlined in
Section 3.2, a Kano questionnaire was designed to assess the attributes. The survey targeted elderly individuals or their guardians with experience using or purchasing wearable watches for the elderly, as well as industry professionals. A total of 157 questionnaires were collected, including eight invalid and 149 valid responses, resulting in an effective response rate of 94.9%. The reliability and validity of the questionnaire, tested for both positive and negative questions using SPSS 22.0, are shown in
Table 7 and
Table 8.
3.4.2. Categorization of Attribute Demand Preferences
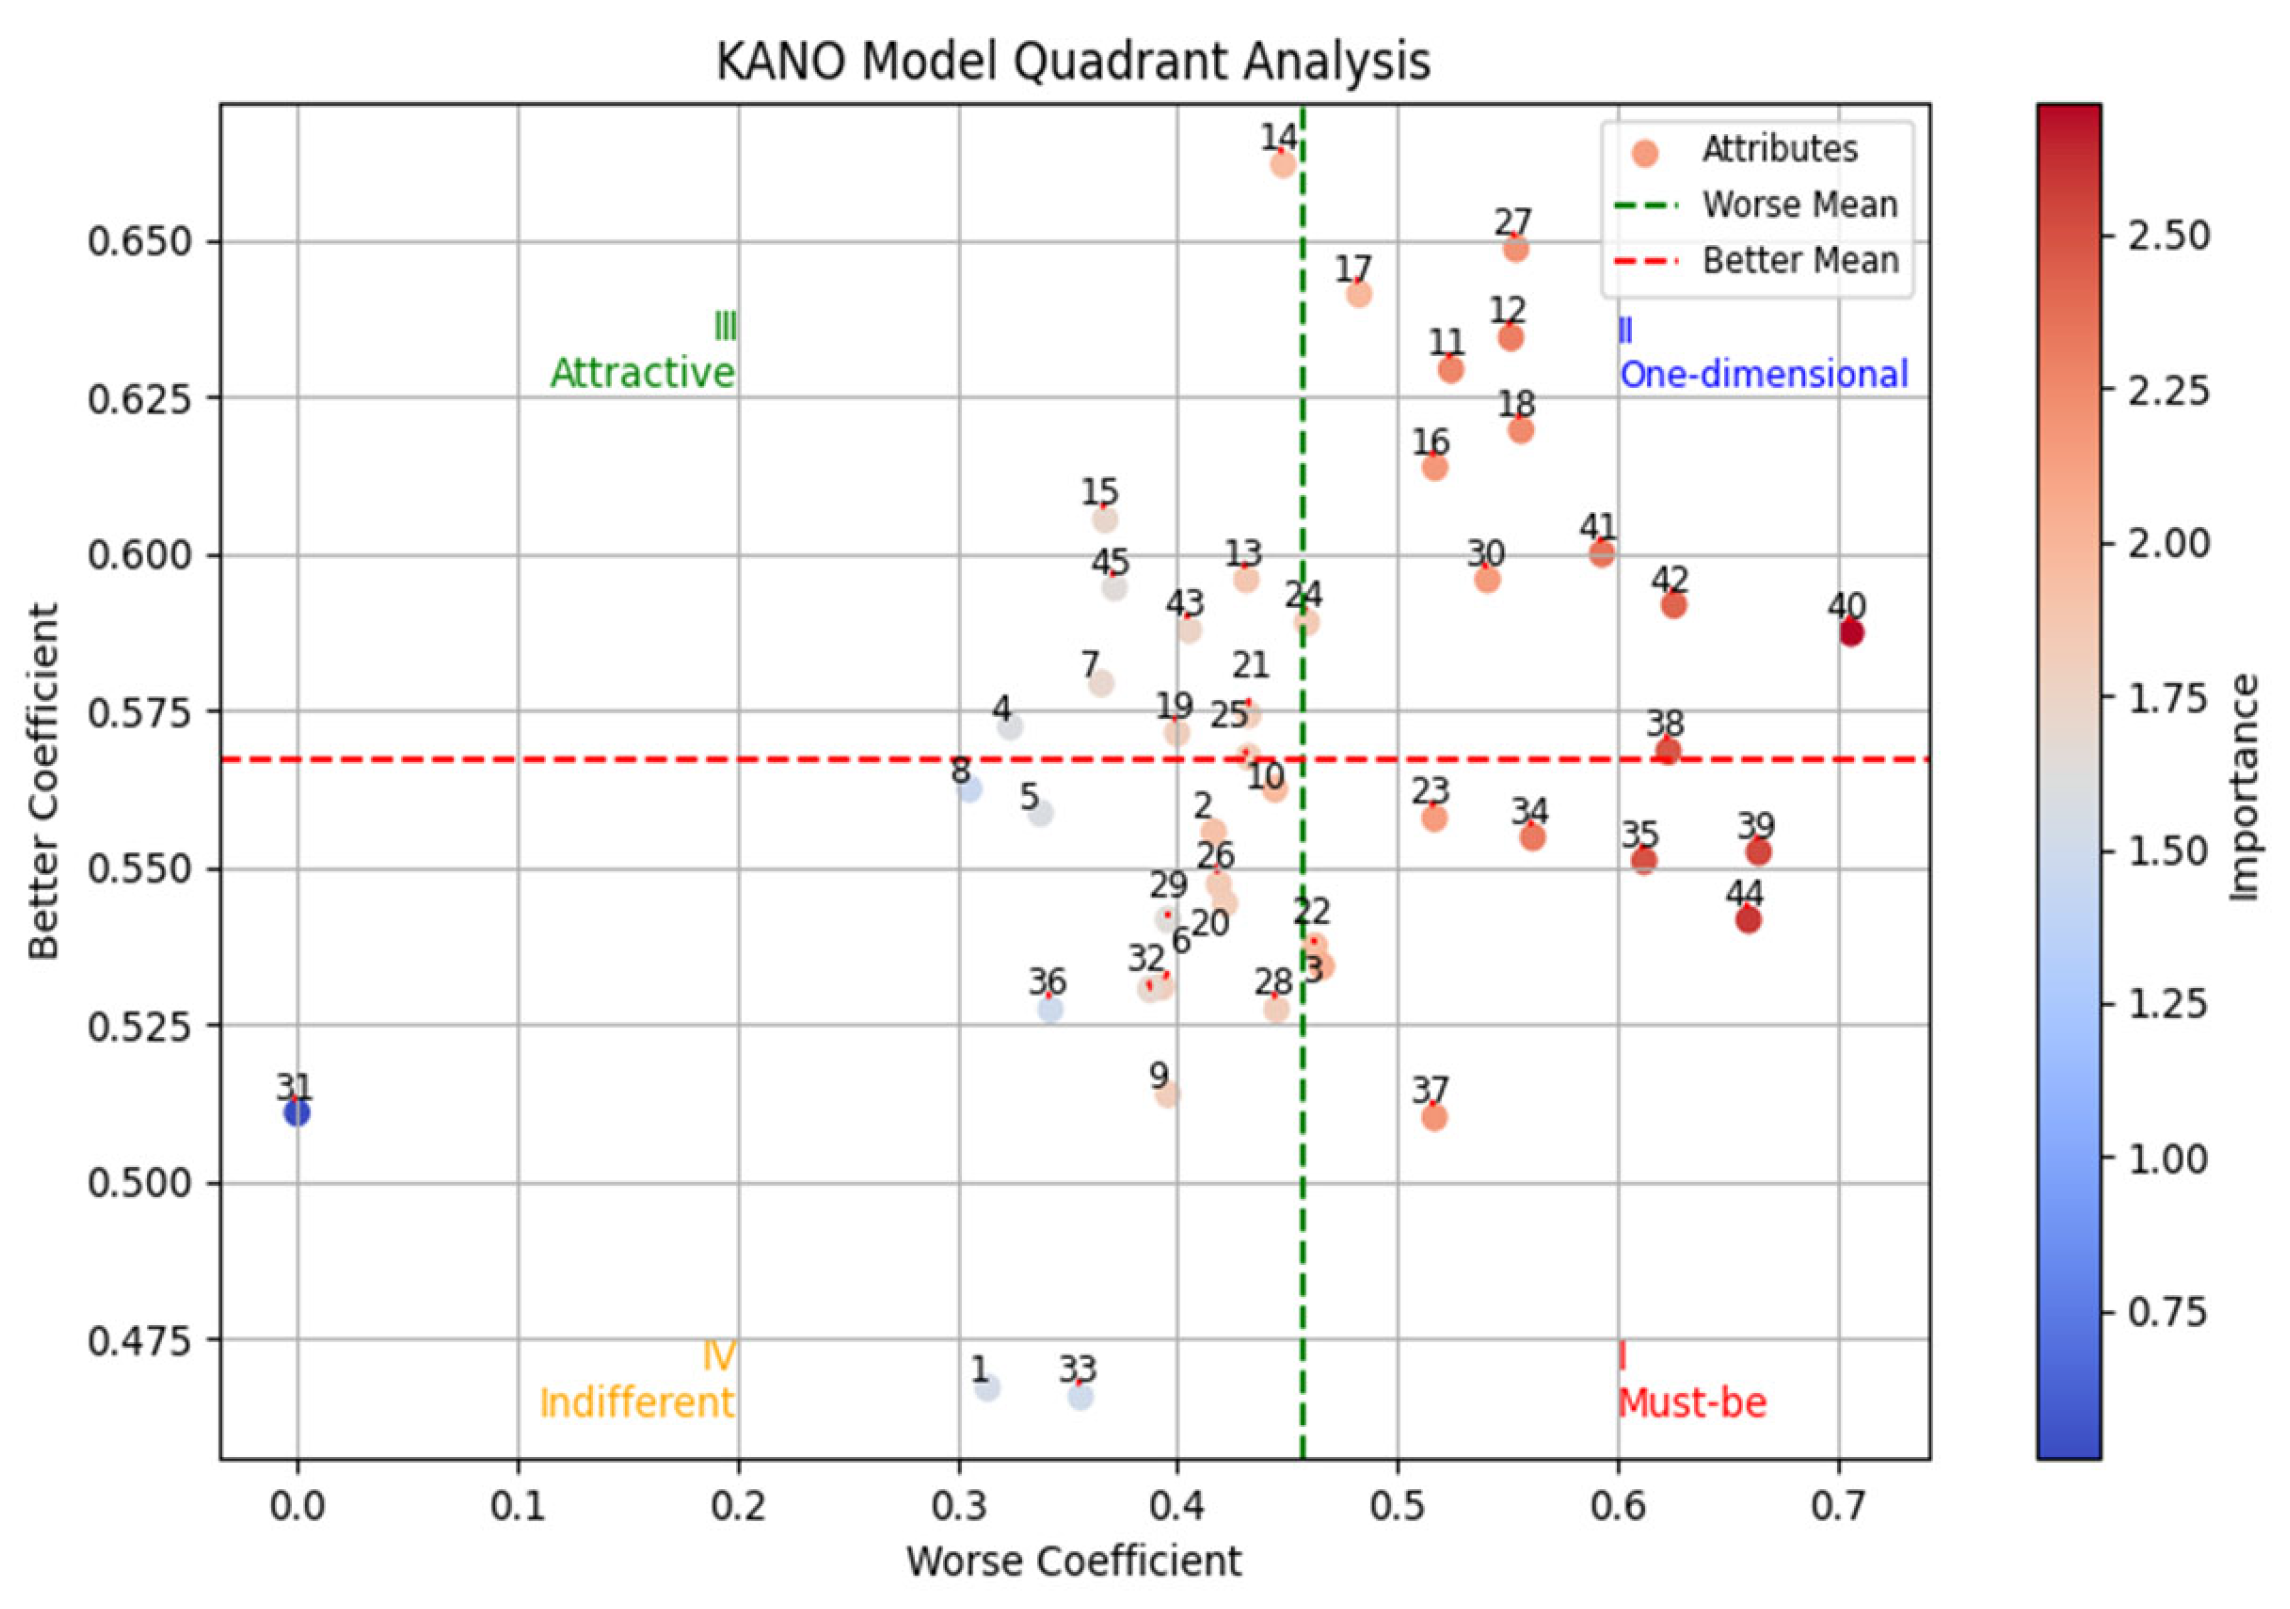
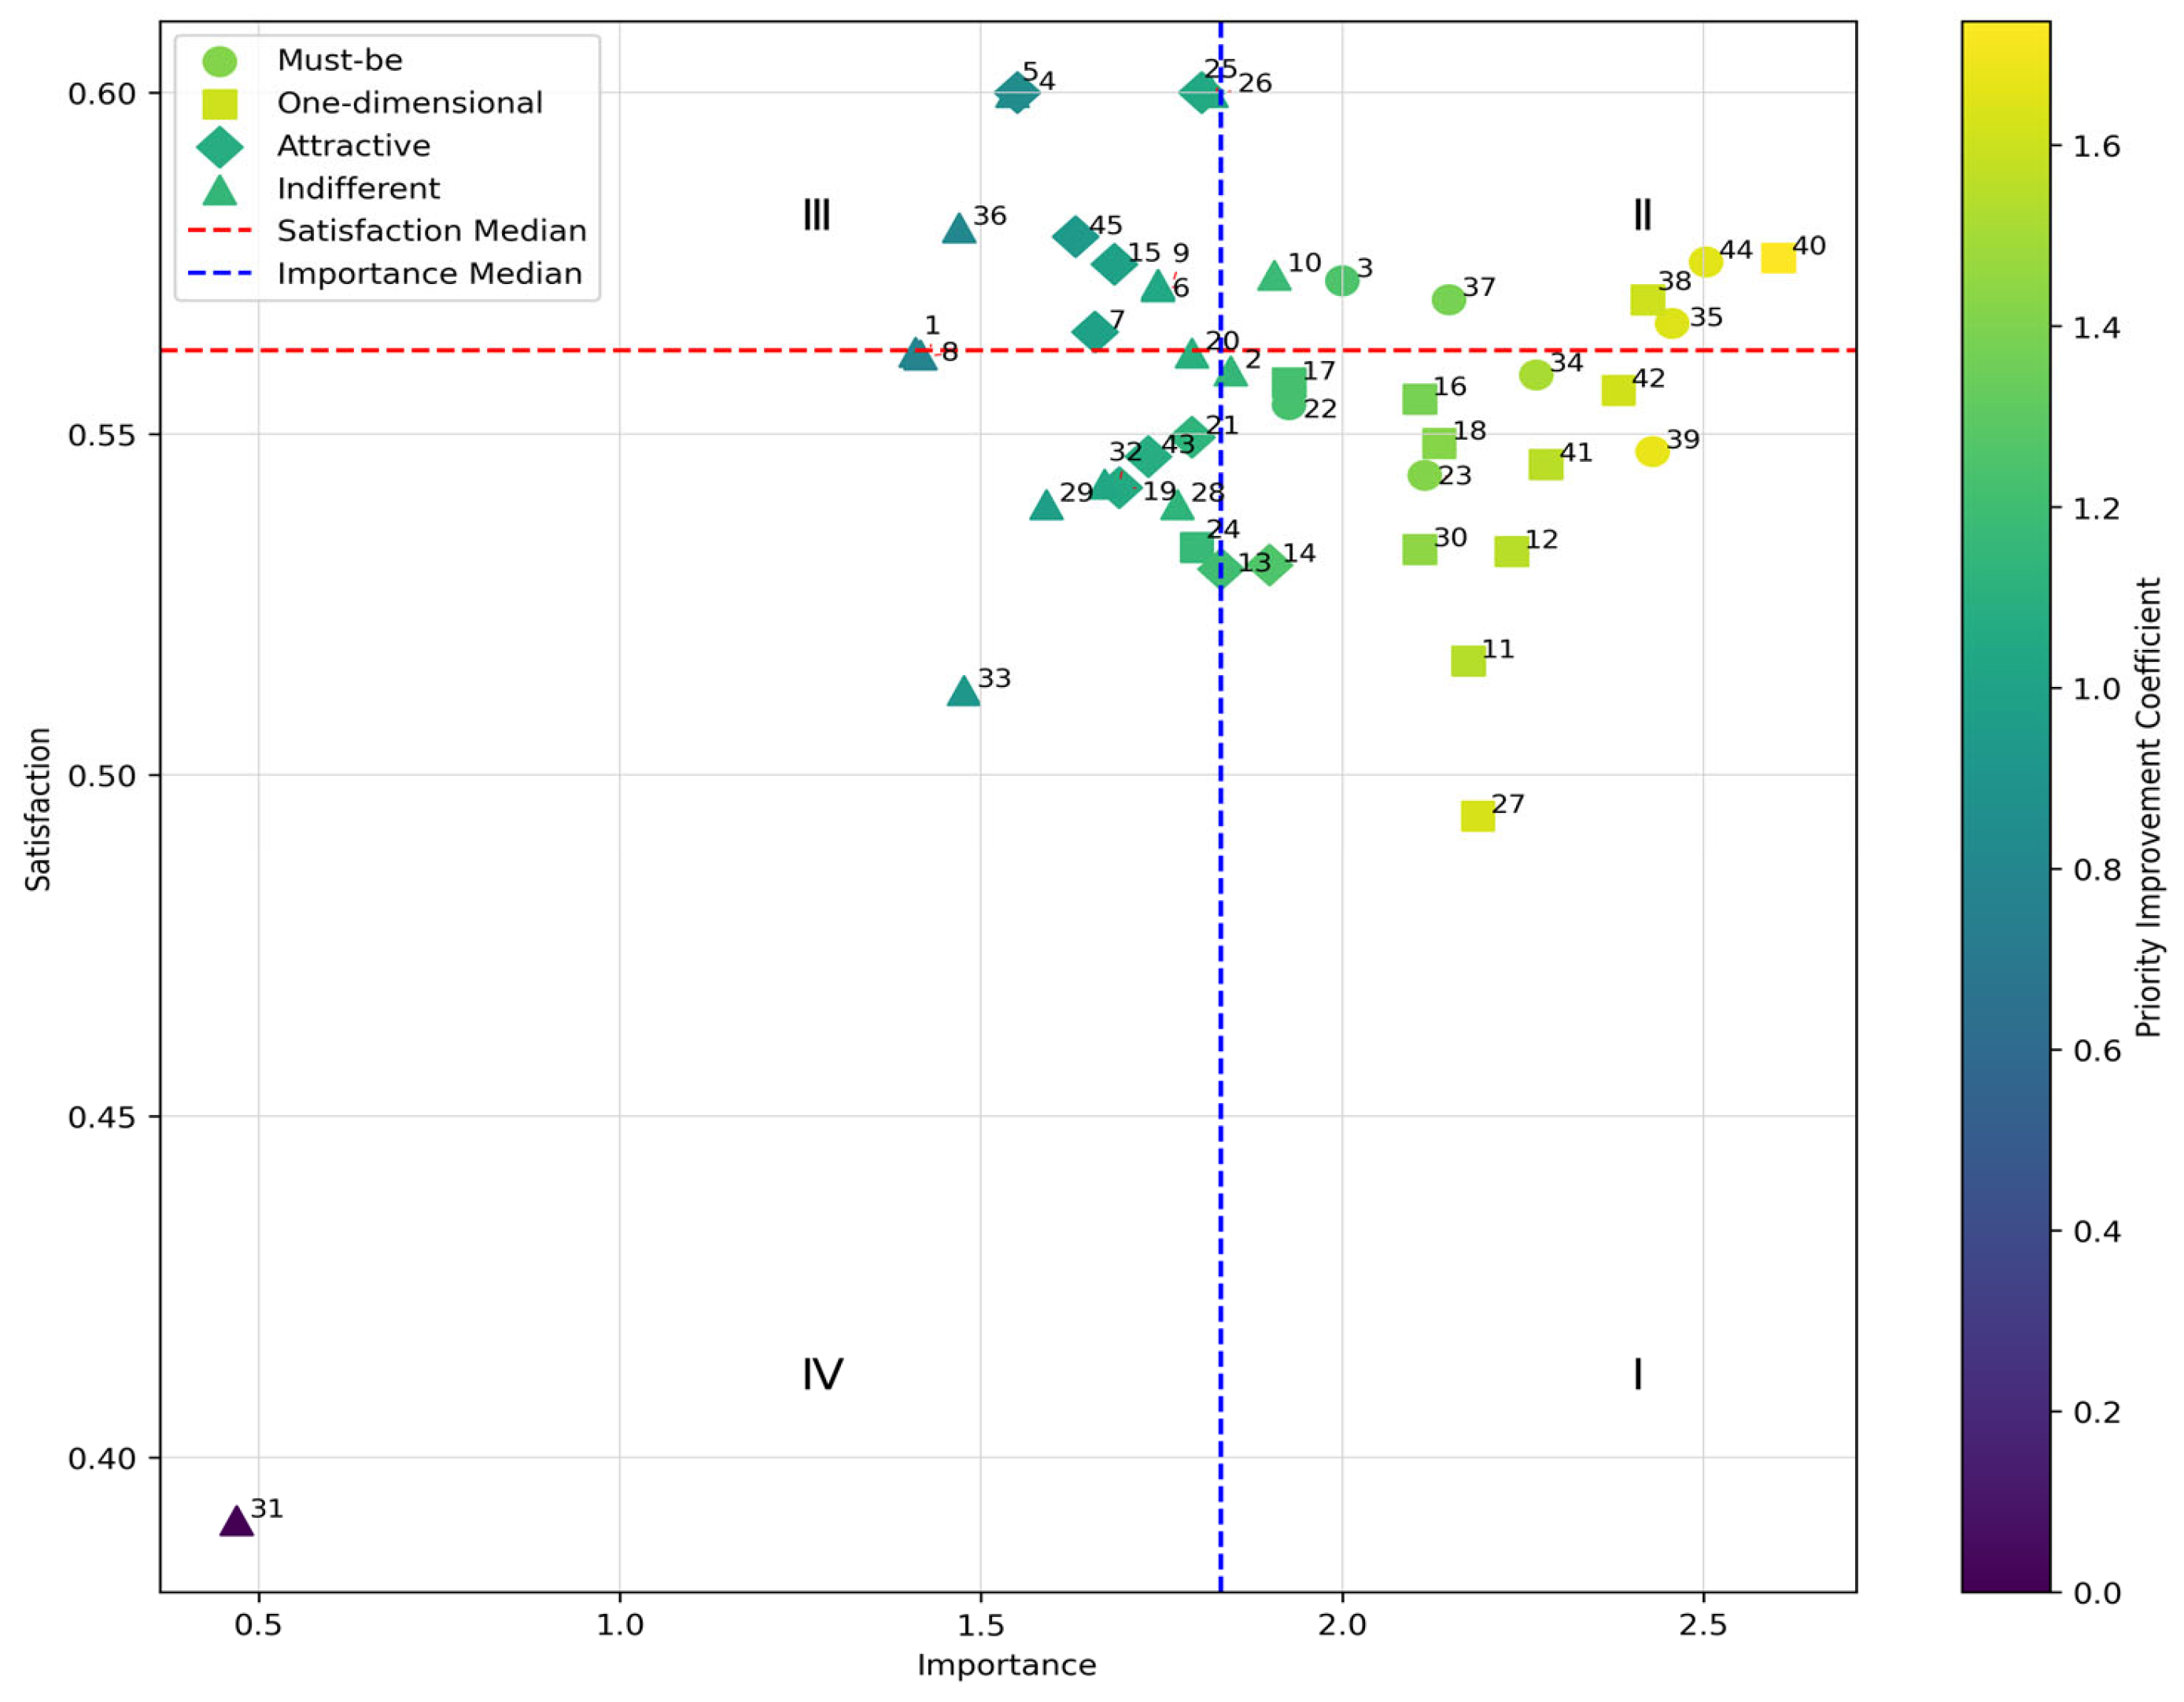
Using Python 3.8, we counted the total occurrences of each of the six Kano attribute types for each attribute and selected the type with the highest count. We then applied the relevant formulas to calculate the better, worse, and importance values for each attribute and generated a quadrant diagram. The results are presented in
Table 9 and
Figure 7.
The Pearson correlation coefficient between importance and attention was 0.3784, with a p-value of 0.0104, showing a significant but moderately weak positive correlation. This indicates that importance and attention reflect different aspects of user needs.
As shown in the table and figure above, eight attributes—call, waterproof, durability, wearing comfort, touchscreen, service, data sync to phone, and heart rate monitoring—are classified as must-be attributes.
Twelve attributes, including screen display clarity, accuracy, sensitivity, abnormal reminder to the guardian, signal, battery, positioning, fall alarm, one-click alarm, video, ease of operation, and abnormal alert, are identified as one-dimensional attributes.
Ten attributes—warning, voice assistant, price, remote operation, electronic fence, sedentary reminder, atrial fibrillation monitoring, medication reminder, blood lipid monitoring, and exercise data record—are categorized as attractive (delighter) attributes. The remaining attributes, classified as indifferent, will be excluded from further analyses.
In summary, the Kano model has effectively filtered and categorized the diverse set of features found in wearable smartwatches for the elderly. This provides a solid foundation for subsequent product development and functional enhancement.
3.5. Integration of Sentiment and Kano Results
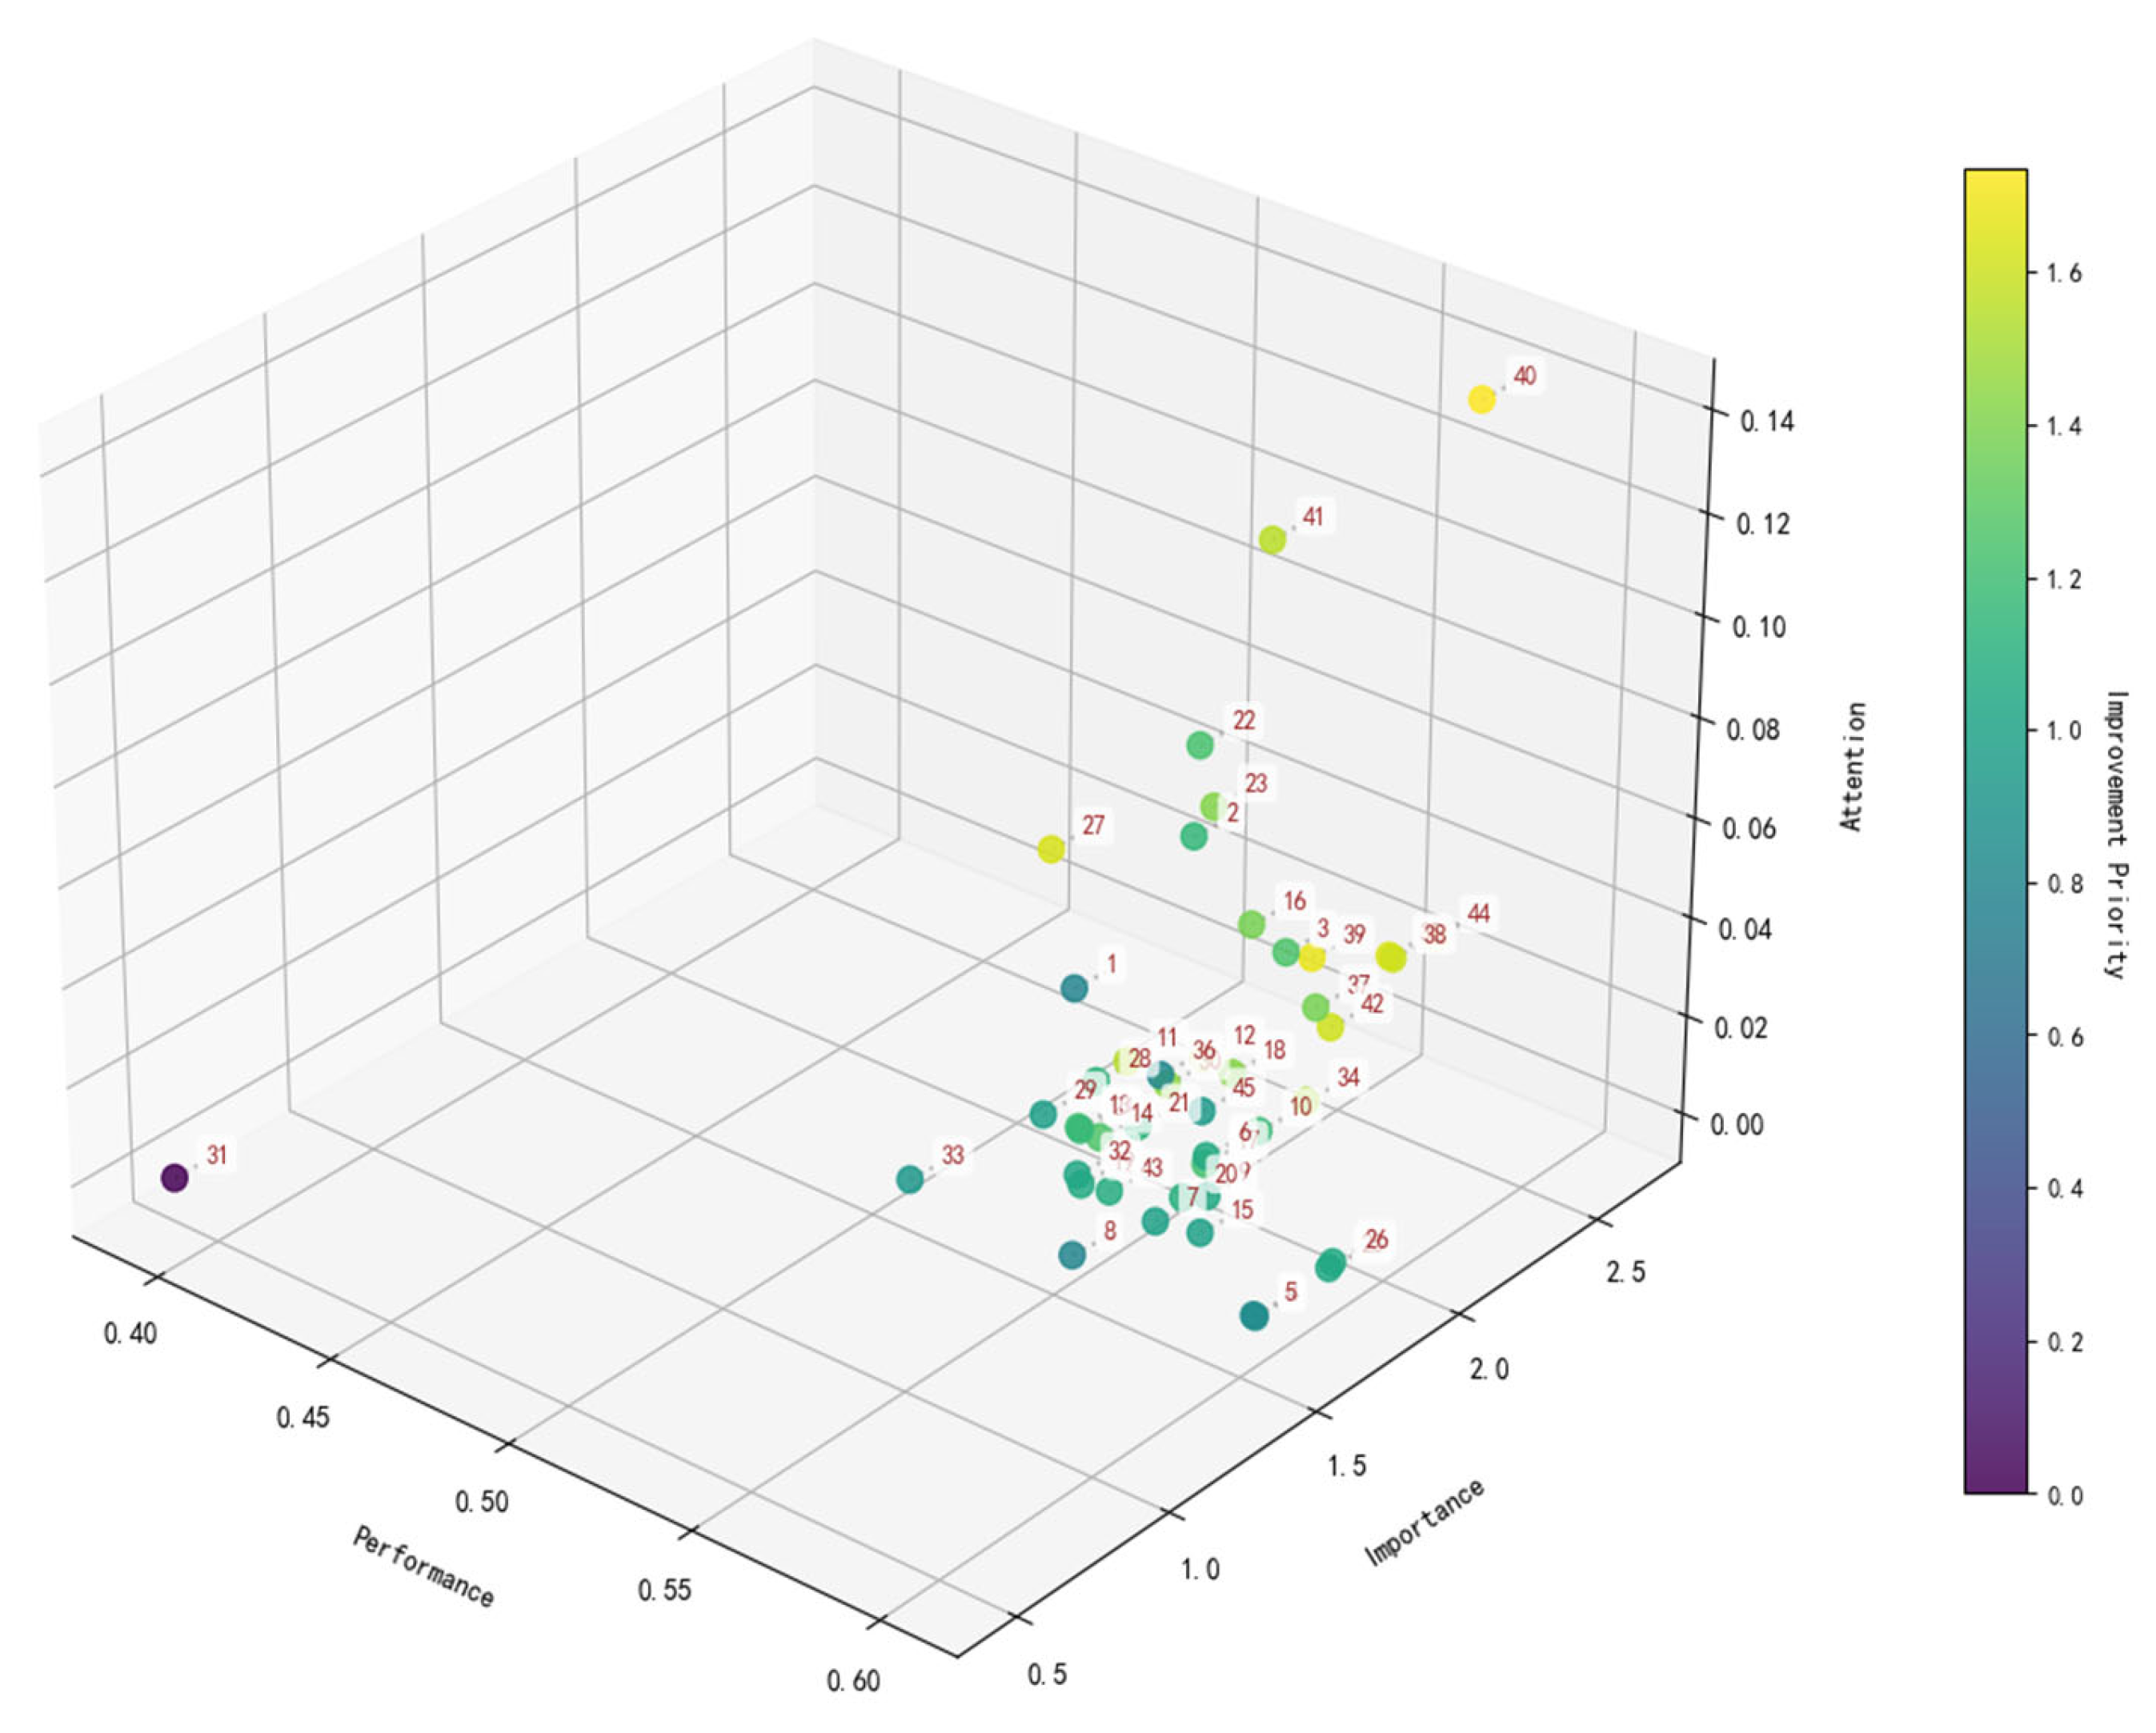
Building on the analysis above, the three-dimensional decision model IPAA–Kano was developed by integrating the Kano and IPA models with attention. A total of 14 attributes were identified as needing improvement, nine as maintenance attributes, and seven as attributes that can be deprioritized. Six cognitive management strategies were proposed for attributes with attention–utility discrepancies. The results are shown in
Figure 8 and
Table 10.
Among the improvement attributes, service ranks as the top dimension, requiring enhancement for elderly-focused technology products, followed by call, data sync to phone, battery, sensitivity, accuracy, one-click alarm, positioning, abnormal alert, abnormal reminder to the guardian, remote operation, medication reminder, and exercise data record. This indicates that for wearable smartwatches for the elderly, apart from service, core health alert functionalities related to the device itself—including sensitivity, accuracy, and alarms/reminders in different scenarios—are the most urgently needed improvements.
For the maintenance attributes, essential functions such as durability and water resistance rank at the top, followed by ease of use, screen, and price. It is worth noting that fall alarm, due to its high satisfaction, importance, and performance but low attention, is also categorized as a maintenance attribute. In terms of cognitive management, it is recommended to enhance market communication to raise consumer awareness and perceived value of this feature.
In contrast, attributes such as abnormal alert, which are highly important and contribute significantly to satisfaction, but perform poorly and currently receive little attention, should first undergo functionality improvements before cognitive marketing efforts are introduced to raise consumer awareness.
For the exercise data record attribute, both satisfaction and importance scores are low, but it receives relatively high consumer attention. This type of attribute can be considered a pseudo-demand—a function that attracts consumer interest yet contributes little actual utility. As such, it should be temporarily categorized as an improvement attribute, with targeted cognitive management interventions warranted due to its high attention level.
3.6. Strategic Implications and Practical Interpretation
Except for the one-dimensional attribute video, all deprioritized attributes fall under the attractive (delighter) category, including atrial fibrillation monitoring, sedentary reminder, blood lipid monitoring, voice assistant, warning, and electronic fence. This suggests that current consumers are more focused on the core functionalities of wearable smartwatches for the elderly, while additional attractive features—originally intended by manufacturers to appeal to consumers—are rated relatively low in satisfaction, importance, and attention. This may be related to consumers’ needs or their cognitive understanding of the product.
These findings align with the fact that elderly individuals’ acceptance of technology is affected by cognitive and technological barriers. The implications for the development and innovation of gerontechnology products are that elderly individuals’ cognitive and acceptance barriers to technology suggest that the design of elderly-focused technology products, such as wearable watches, should prioritize core functionalities, consolidate similar functions, and ensure ease of operation.
At the same time, aligning with the conclusion that service improvement is the top priority, social support factors during the technology adoption process for elderly individuals are also crucial. Therefore, the design of gerontechnology products must pay special attention to enhancing accompanying services, while also emphasizing the importance of cognitive management and education for elderly users regarding technology products.
Overall, improvement attributes are concentrated in the one-dimensional category, along with a few must-be attributes; maintenance attributes are primarily in the must-be category (8), with a few in the one-dimensional (3) and attractive (3) categories; most deprioritized attributes fall under the attractive category (6). These evaluation results demonstrate that, when compared against the mature Kano model classifications, the IPPA–Kano model’s identification of improvement, maintenance, and low-priority attributes shows high alignment with the Kano model’s structure. This aligns well with general factual knowledge and consumer intuition, indirectly validating the model’s effectiveness and reliability. Moreover, the model demonstrates strong practical interpretability and support, confirming its applicability and operational value. The next section will further strengthen the model’s validation from a quantitative empirical perspective.
4. Model Comparison and Validation Discussion
4.1. Comparison Results Between the IPAA–Kano Model and the IPA–Kano Model
To compare the IPA–Kano and IPAA–Kano models in supporting real-world decision-making, the IPA–Kano model was applied, identifying 17 improvement and 13 maintenance attributes, shown in
Table 11. And the attributes scatters are showed respectively in
Figure 9 and
Figure 10. While both models showed overlapping results—confirming the stability of the enhancement framework—the IPAA–Kano model, by incorporating the attention dimension, offered more nuanced insights. It could identify attributes that should be initially overlooked and those requiring cognitive management—capabilities absent in the IPA–Kano model. This comparative analysis highlights the IPAA–Kano model’s advantage in evaluation precision and strategic decision-making.
Specifically, the IPAA–Kano model identified seven dimensions as prioritized-to-be-neglected attributes, which intuitively aligns with our understanding and will be further validated through empirical studies. The number of improvement attributes decreased from 17 to 14, and maintenance attributes decreased from 13 to 9. These changes demonstrate that the inclusion of the attention dimension allowed the model to uncover previously hidden attributes under the attention–utility inconsistency condition and provided corresponding cognitive strategies for such dimensions. This improvement is meaningful not only in terms of decision-making granularity but also in enabling more efficient resource allocation under resource constraints.
Furthermore, unlike the weighted IPA–Kano and MCDA approaches (e.g., AHP, TOPSIS), which emphasize the assignment of weights—often based on expert judgment—the key innovation of the IPAA–Kano model lies in introducing attention as a new, independently derived metric. This allows for the identification of hidden attributes overlooked by traditional models and the development of cognitive strategies without relying on subjective assessments. Crucially, the attention metric is extracted from user-generated behavioral data, offering a more objective, behavior-driven basis for fine-grained attribute prioritization and decision support.
4.2. Validation of the IPPA–Kano Model’s Effectiveness
To evaluate the practical value of the proposed IPAA–Kano model, we conducted a stakeholder survey involving ten industry experts and forty end users. Participants assessed the outputs of both the traditional IPA–Kano model and the proposed IPAA–Kano model on three key dimensions using a five-point Likert scale: (1) practical relevance and consistency with real-world experience, (2) usefulness for decision-making, and (3) ease of use and acceptability. The evaluation results and paired
t-test statistics are presented in
Table 12.
Statistical analysis confirms that the IPAA–Kano model significantly outperforms the traditional IPA–Kano across all evaluation dimensions (p < 0.001). Notably, the greatest improvement was observed in the “decision-making support” dimension, where the IPAA–Kano model achieved a mean score of 4.06, compared to 3.16 for IPA–Kano. These results provide robust evidence of the enhanced practical value, decision relevance, and stakeholder acceptability of the proposed model.
4.3. Stakeholder Feedback on Practical Use
Beyond statistical validation, we collected qualitative feedback from five stake holders (e.g., product managers and UX designers in the elderly smart device sector). Using a five-point Likert scale, they rated the model’s clarity, decision-making value, and relevance. Scores averaged 4.2 for decision support and 4.0 for clarity. Notably, stakeholders emphasized the model’s ability to reveal high-attention but low-utility attributes as crucial for guiding feature prioritization and resource allocation under budget constraints.
4.4. Sensitivity and Robustness Analysis of Misalignment Classification
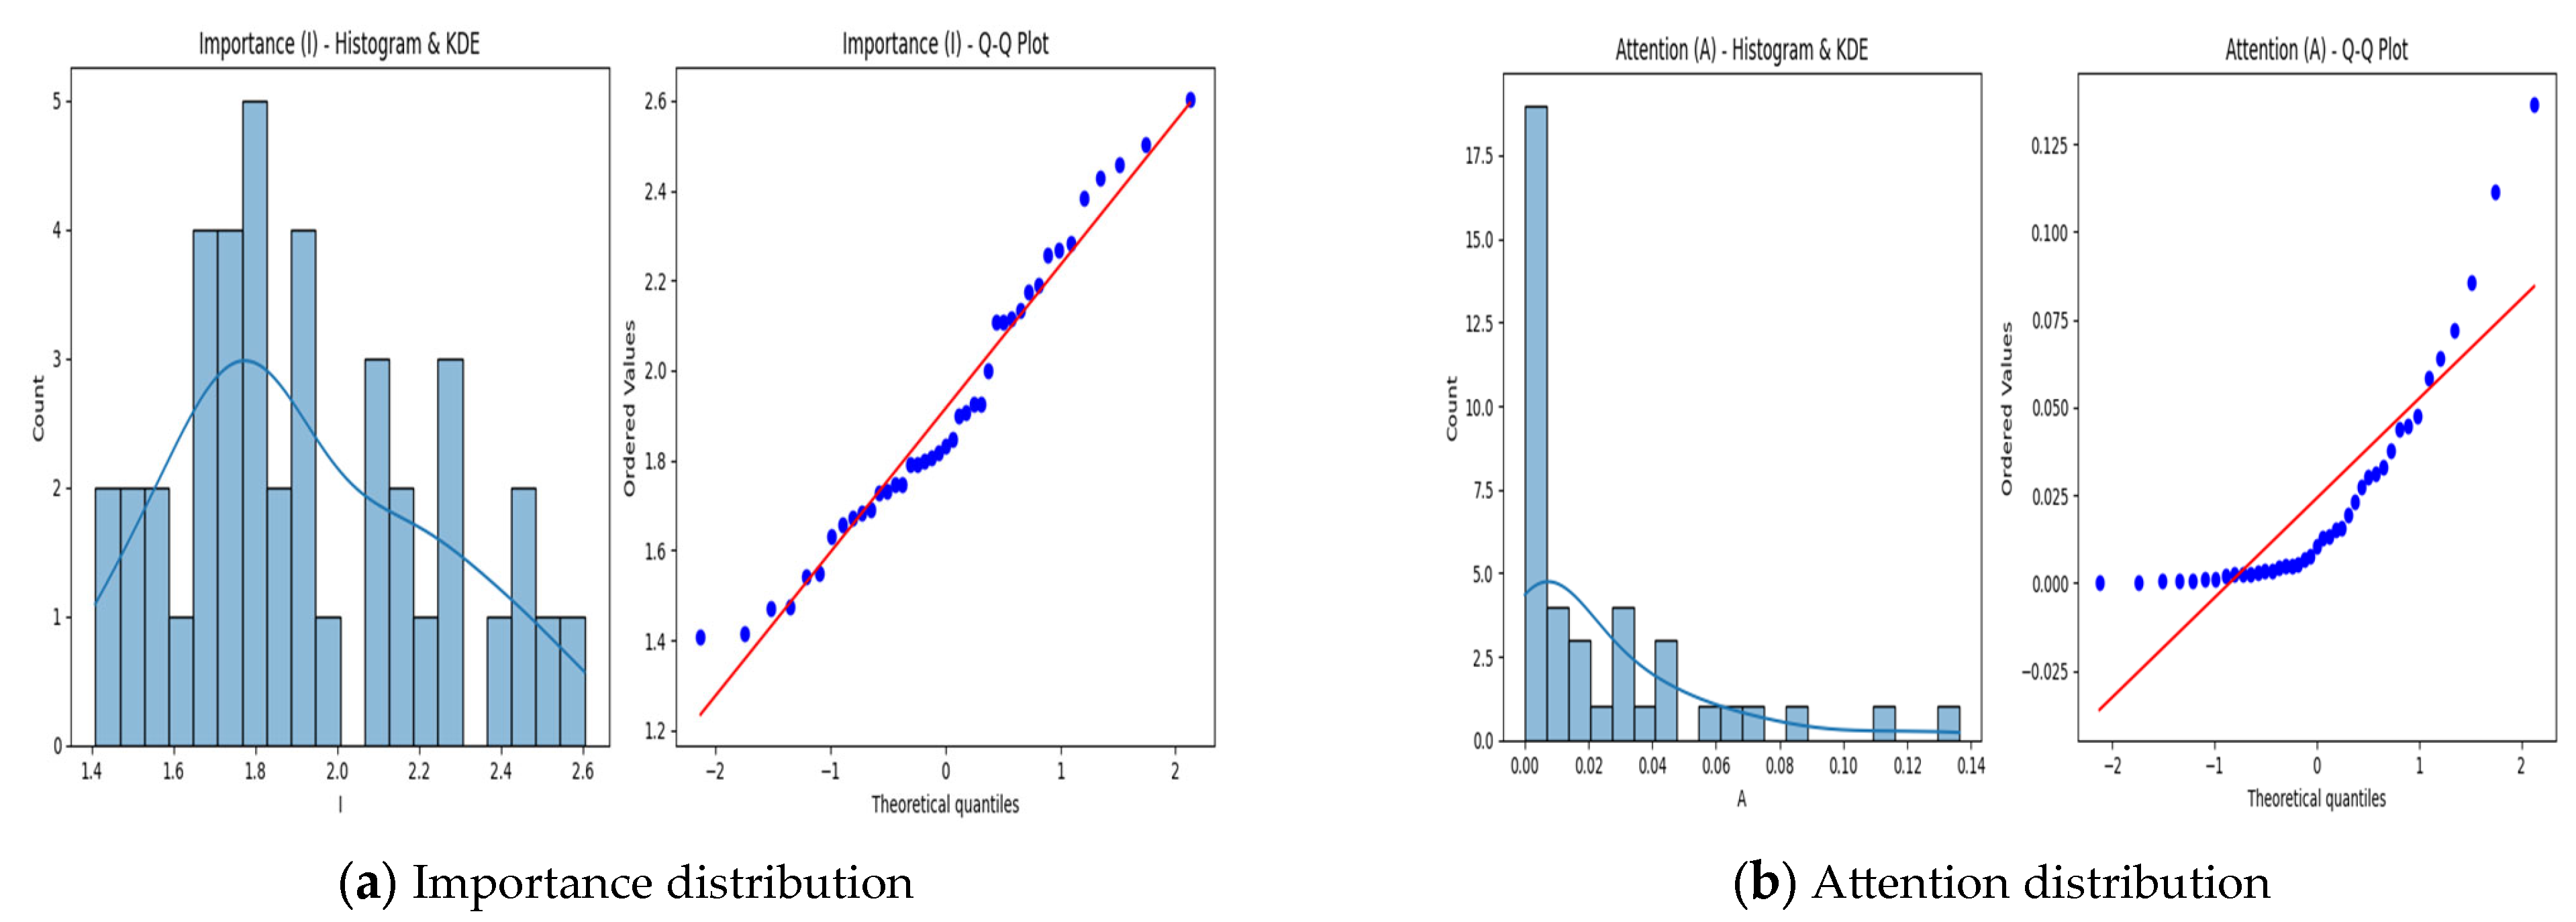
The results of the sensitivity analysis indicate that using the median as the threshold for quadrant classification demonstrates strong stability under small fluctuations of ±3% and ±5%, with classification consistency maintained within the range of 70.73% to 82.93%, as shown in
Table 13. This suggests that the threshold-setting method based on the median possesses good structural robustness and practical applicability. Even under more extreme fluctuations of ±10%, the classification consistency, though slightly reduced, remains within a reasonable range, further highlighting the resilience of the median approach when applied to real-world survey data, which may present skewed distributions (see
Figure 11).
To further evaluate the robustness of the median-based threshold across different data distribution scenarios, we conducted a simulation-based sensitivity test using synthetically generated datasets following normal, lognormal, uniform, and bimodal distributions. The results revealed that, when a consistency rate of 60% is used as the baseline, the median threshold exhibits relatively high stability across lognormal and uniform distributions, with fluctuations ranging from ±3% to ±10%. In contrast, for normal and bimodal distributions—where data concentration is more pronounced—stability is observed only within a narrower fluctuation range of ±3% to ±5%. Among these, the uniform distribution exhibits the highest consistency levels under small threshold variations, indicating that in datasets without a clear central tendency, slight shifts in the classification boundary exert minimal impact on the outcome. These results are presented in
Table 14,
Table 15,
Table 16 and
Table 17.
However, when the fluctuation exceeds ±15%, all distribution types experience a sharp decline in classification consistency, underscoring the high sensitivity of the method to threshold variation. This effect is particularly evident in distributions with strong central tendencies—such as normal and bimodal—where the method shows structural dependence on boundary positioning and is affected by the nonlinear response induced by data concentration patterns. These findings suggest that in practical applications, the range of boundary adjustments should be carefully constrained to avoid structural misclassifications, thereby ensuring the reliability of quadrant-based decision frameworks.
4.5. Comparison of Characteristics Between the IPP–Kano Model and the IPAA–Kano Model
We compared the characteristics of the models based on decision variables, importance calculation methods, data sources, attribute ranking results, and the specific contributions of the IPAA–Kano model, as shown in
Table 18.
5. Conclusions and Future Work
Building on value co-creation and leveraging deep learning-based natural language processing (NLP), this study employs BERT and Latent Dirichlet Allocation (LDA) for a data-driven, fine-grained analysis of user demands and attribute preferences. By integrating these insights with the Kano–IPA framework, we introduce attention and priority improvement coefficients, forming the IPAA–Kano model to optimize decision-making in customer-centric innovation.
Addressing the misalignment between explicit attention and implicit utility, the model extends the traditional IPA–Kano framework into a three-dimensional structure with eight decision spaces, enhancing its ability to (1) accurately classify product attributes based on their impact on satisfaction and user attention; (2) optimize resource allocation by distinguishing between quality improvement priorities and cognitive expectation management; (3) systematically deprioritize low-value attributes, increasing decision efficiency under resource constraints.
The empirical validation of wearable devices for the elderly, using 12,527 user-generated reviews, confirms the superior accuracy and decision relevance of the deep learning-enhanced IPAA–Kano model compared to traditional approaches. Additionally, domain expert validation and consumer feedback further support its practical effectiveness in guiding technology product development and optimization strategies.
However, this study has several limitations, which present opportunities for future research: (1) Data dependence: The satisfaction analysis primarily relies on user-generated content, which may introduce bias and limit the generalizability of attribute analysis. (2) Generalization constraints: The case study focuses on wearable devices for the elderly; further validation across diverse industries and product categories is necessary to broaden applicability. (3) Market dynamics: The model’s effectiveness may be affected by rapid market shifts, necessitating continuous model updates to capture emerging trends and evolving customer preferences. (4) Deep learning enhancements: While this study utilizes BERT and LDA, future research could explore the integration of advanced deep learning techniques, such as hybrid models, reinforcement learning, or neural network-based attention mechanisms, to further enhance classification accuracy and decision depth.
This study contributes to both methodological advancements in deep learning-assisted decision modeling and practical strategies for optimizing innovation under resource constraints, providing a scalable, intelligent framework for guiding technology-driven product development and strategic innovation.
