
Achieving Optimal Distinctiveness in Green Innovation: The Role of Pressure Congruence


Abstract
1. Introduction
2. Literature Review and Research Hypothesis
2.1. Green Innovation
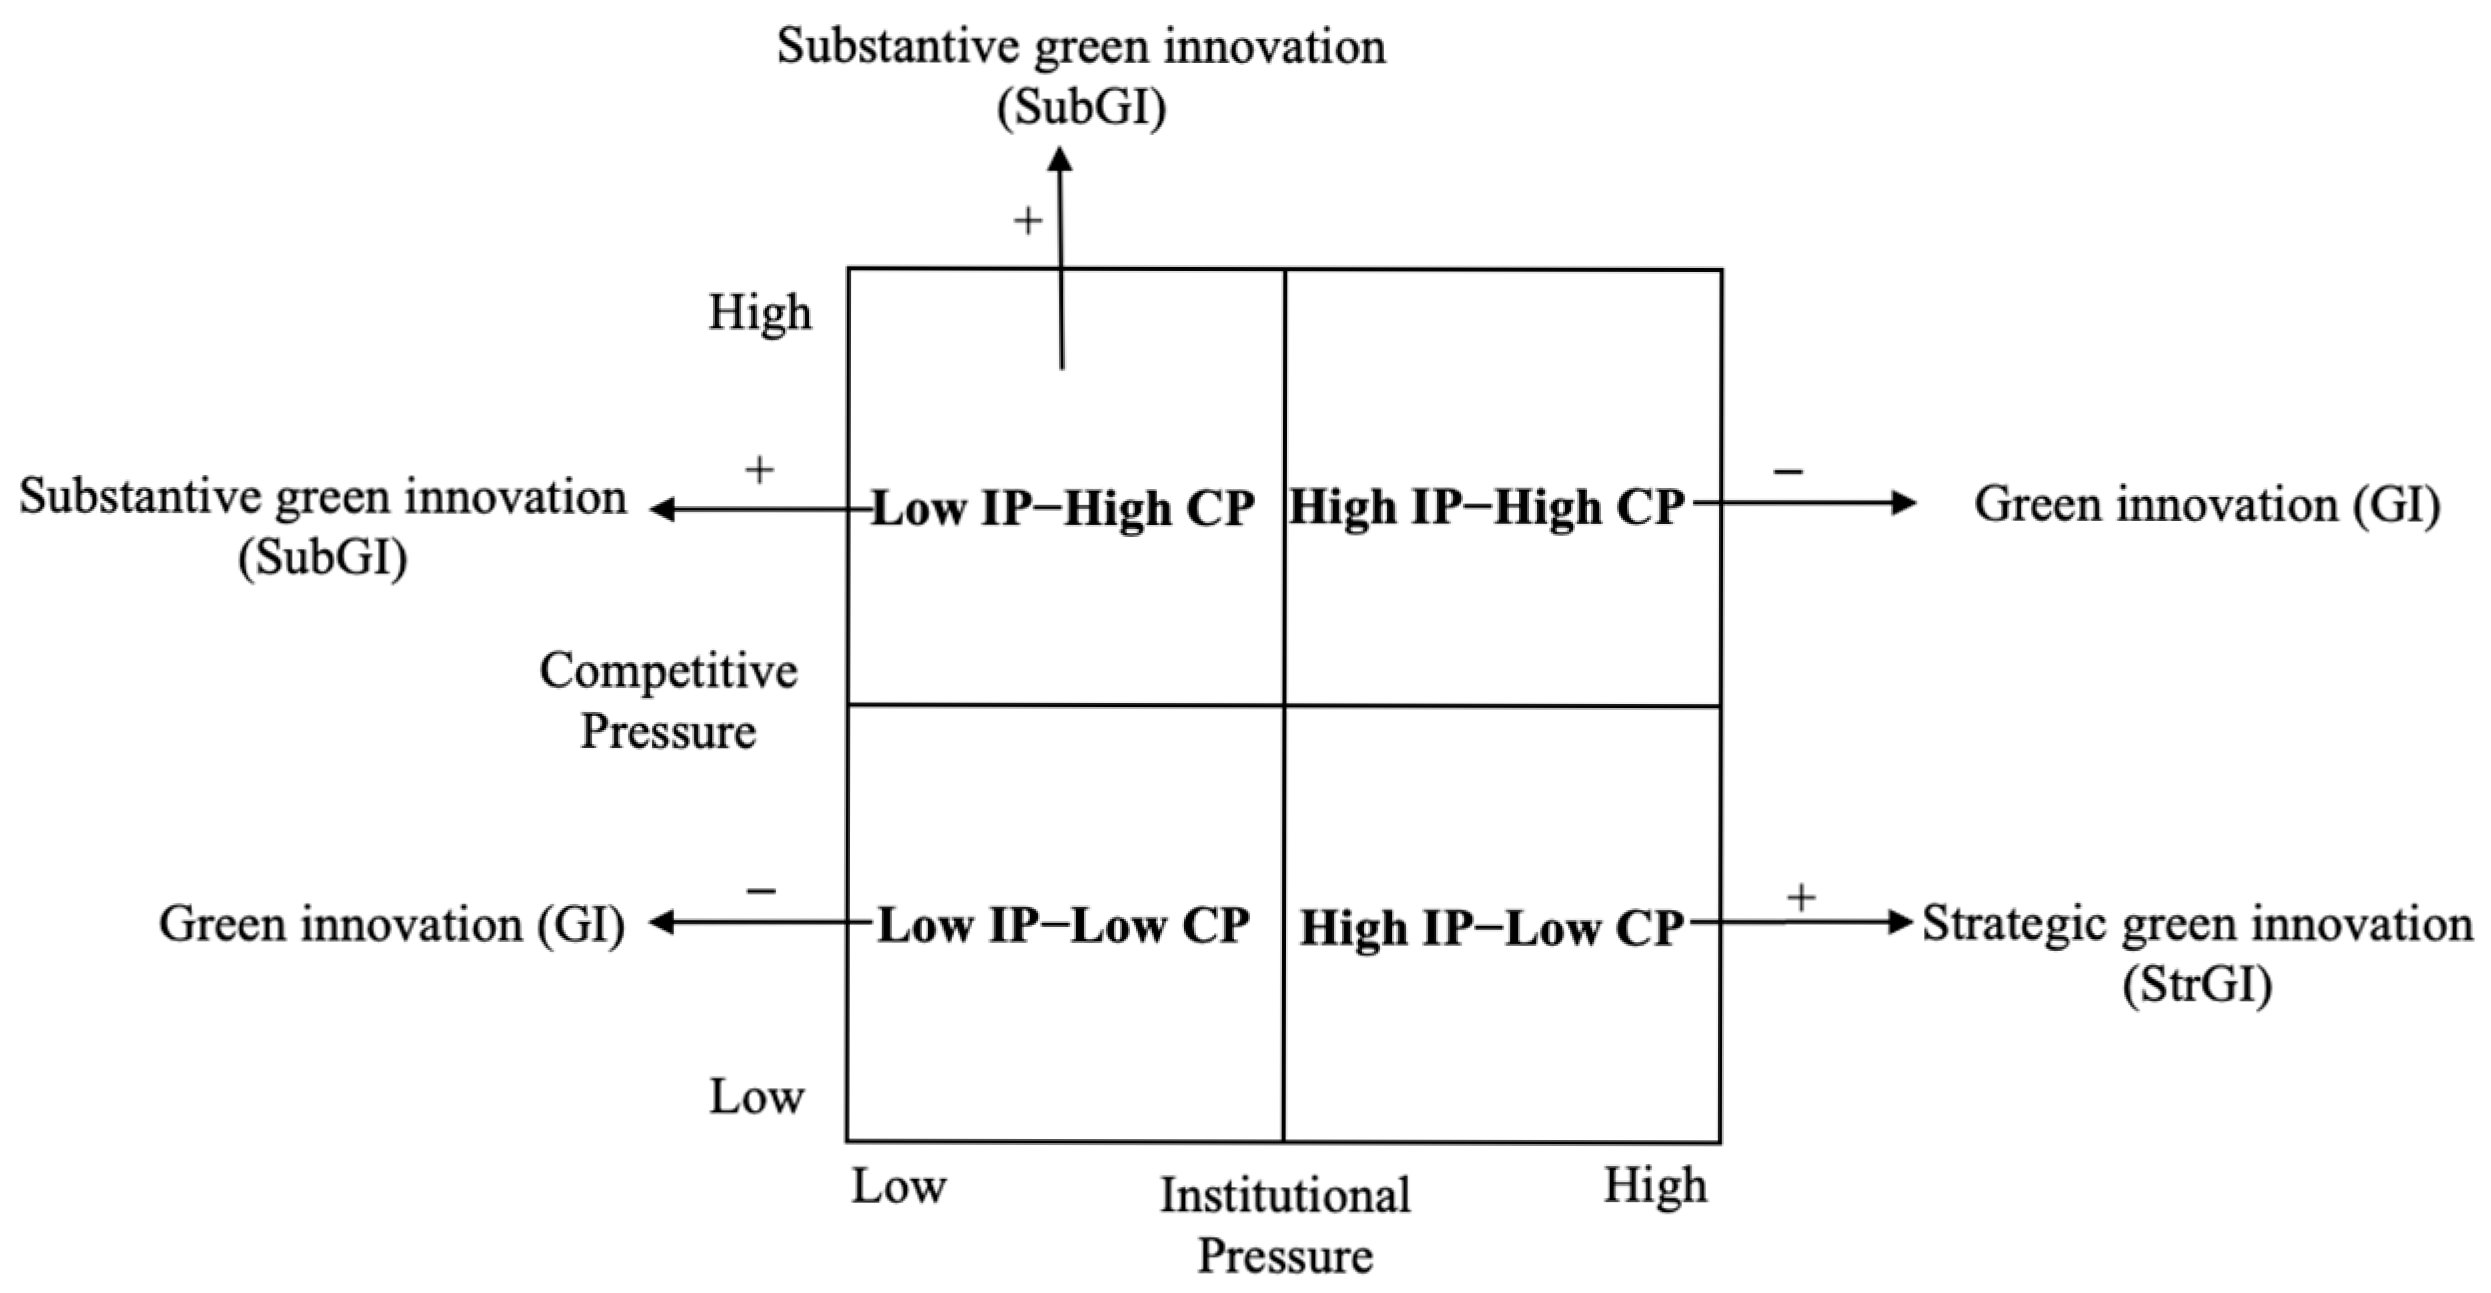
2.2. Model Framework Based on the Optimal Distinctiveness Theory
2.3. Pressure Combination and Green Innovation
3. Research Design
3.1. Sample Selection
3.2. Variable Design
3.2.1. Dependent Variable: Green Innovation
3.2.2. Independent Variable: Pressure Environment
3.2.3. Control Variables
3.3. Model Building
4. Empirical Results
4.1. Descriptive Statistics
4.2. Correlation Analysis
4.3. Hypothesis Testing Results
4.4. Robustness Test
4.4.1. Deal with Endogeneity Issues
4.4.2. Change the Sample Size
4.4.3. Long-Term Effect Robustness Check
4.5. Extended Analysis
5. Discussion and Implications
5.1. Conclusions
5.2. Theoretical Implications
5.3. Managerial Implications
5.4. Limitations and Future Research Directions
Author Contributions
Funding
Institutional Review Board Statement
Informed Consent Statement
Data Availability Statement
Acknowledgments
Conflicts of Interest
Abbreviations
| GI | Green Innovation |
| StrGI | Strategic Green Innovation |
| SubGI | Substantive Green Innovation |
| IP | Institutional Pressure |
| CP | Competitive Pressure |
Appendix A

| Variables | High IP–High CP | High IP–Low CP | Low IP–High CP | Low IP–Low CP | ||||||||
|---|---|---|---|---|---|---|---|---|---|---|---|---|
| First | Second | First | Second | First | Second | First | Second | |||||
| IPCP | StrGI | SubGI | IPCP | StrGI | SubGI | IPCP | StrGI | SubGI | IPCP | StrGI | SubGI | |
| IPCP-iv | 0.156 *** (22.96) | −1.263 *** (−3.31) | −1.360 *** (−3.50) | 0.505 *** (44.89) | 0.175 *** (7.33) | 0.107 *** (4.18) | 0.034 *** (6.77) | 1.108 ** (2.29) | 1.259 ** (2.34) | 0.363 *** (34.59) | −0.047 * (−1.90) | 0.015 (0.61) |
| Controls | Yes | Yes | Yes | Yes | Yes | Yes | Yes | Yes | Yes | Yes | Yes | Yes |
| Constant | 0.213 (1.53) | 1.019 (1.22) | 1.808 ** (2.00) | 0.074 (0.10) | −1.996 ** (−2.35) | −0.922 (−1.15) | −1.029 *** (−38.74) | 0.784 (1.48) | 1.013 * (1.73) | 0.650 *** (5.74) | −0.148 (−1.43) | −1.182 * (−1.83) |
| Year | Yes | Yes | Yes | Yes | Yes | Yes | Yes | Yes | Yes | Yes | Yes | Yes |
| Province | Yes | Yes | Yes | Yes | Yes | Yes | Yes | Yes | Yes | Yes | Yes | Yes |
| N | 5016 | 5016 | 5016 | 5152 | 5152 | 5152 | 4886 | 4886 | 4886 | 4879 | 4879 | 4879 |
| F | 147.90 | 30.10 | 23.68 | 74.89 | 29.61 | 30.35 | 150.54 | 16.33 | 14.24 | 42.99 | 27.36 | 25.75 |
| R2 | 0.479 | 0.181 | 0.164 | 0.312 | 0.202 | 0.230 | 0.594 | 0.129 | 0.103 | 0.295 | 0.262 | 0.274 |
| Kleibergen-Paaprk LM statistic | 319.25 *** | 243.18 *** | 9.88 *** | 102.061 *** | ||||||||
| Wald F statistic | 527.10 | 2015.04 | 45.84 | 1196.25 | ||||||||
| Stock-Yogo 10% maximal IV size critical value | 16.38 | |||||||||||
| Variables | High IP–High CP | High IP–Low CP | Low IP–High CP | Low IP–Low CP | ||||
|---|---|---|---|---|---|---|---|---|
| (1) | (2) | (3) | (4) | (5) | (6) | (7) | (8) | |
| StrGI | SubGI | StrGI | SubGI | StrGI | SubGI | StrGI | SubGI | |
| IPCP | −0.361 *** (−4.03) | −0.279 *** (−2.99) | 0.117 *** (7.13) | 0.063 *** (3.96) | 0.225 *** (5.26) | 0.229 *** (5.25) | −0.287 *** (−3.75) | −0.250 *** (−3.15) |
| Controls | Yes | Yes | Yes | Yes | Yes | Yes | Yes | Yes |
| Constant | −0.840 (−1.10) | 0.009 (0.01) | −0.871 (−1.20) | −0.505 (−0.71) | −0.230 *** (−3.99) | −0.227 *** (−3.85) | −0.058 (−0.73) | −0.076 (−0.91) |
| Year | Yes | Yes | Yes | Yes | Yes | Yes | Yes | Yes |
| Province | Yes | Yes | Yes | Yes | Yes | Yes | Yes | Yes |
| N | 3397 | 3397 | 3526 | 3526 | 3449 | 3449 | 3397 | 3397 |
| F | 23.99 | 21.77 | 24.89 | 30.08 | 27.23 | 21.44 | 37.71 | 34.53 |
| R2 | 0.204 | 0.189 | 0.204 | 0.237 | 0.149 | 0.121 | 0.197 | 0.184 |
| Variables | Two-Period Lagged Green Innovation | Three-Period Lagged Green Innovation | ||||||||||||||
|---|---|---|---|---|---|---|---|---|---|---|---|---|---|---|---|---|
| High IP–High CP | High IP–Low CP | Low IP–High CP | Low IP–Low CP | High IP–High CP | High IP–Low CP | Low IP–High CP | Low IP–Low CP | |||||||||
| (1) | (2) | (3) | (4) | (5) | (6) | (7) | (8) | (9) | (10) | (11) | (12) | (13) | (14) | (15) | (16) | |
| StrGI | SubGI | StrGI | SubGI | StrGI | SubGI | StrGI | SubGI | StrGI | SubGI | StrGI | SubGI | StrGI | SubGI | StrGI | SubGI | |
| IPCP | −0.224 *** (−5.90) | −0.226 *** (−5.83) | 0.091 *** (7.64) | 0.054 *** (4.73) | 0.098 *** (4.75) | 0.099 *** (4.65) | −0.019 ** (−2.00) | 0.000 (0.05) | −0.178 *** (−4.46) | −0.196 *** (−4.81) | 0.096 *** (7.42) | 0.061 *** (4.92) | 0.059 *** (3.39) | 0.060 *** (3.29) | −0.020 * (−1.95) | 0.004 (0.41) |
| Controls | Yes | Yes | Yes | Yes | Yes | Yes | Yes | Yes | Yes | Yes | Yes | Yes | Yes | Yes | Yes | Yes |
| Constant | 0.964 (1.28) | 1.516 ** (1.98) | −1.772 ** (−2.40) | −0.648 (−0.91) | −0.231 *** (−4.76) | −0.219 *** (−4.36) | −0.264 *** (−3.68) | −0.239 *** (−3.40) | 0.912 (1.14) | 1.574 * (1.92) | −2.072 *** (−2.59) | −0.843 (−1.10) | −0.350 *** (−7.70) | −0.268 *** (−5.64) | −0.210 ** (−2.37) | −0.205 ** (−2.36) |
| Year | Yes | Yes | Yes | Yes | Yes | Yes | Yes | Yes | Yes | Yes | Yes | Yes | Yes | Yes | Yes | Yes |
| Province | Yes | Yes | Yes | Yes | Yes | Yes | Yes | Yes | Yes | Yes | Yes | Yes | Yes | Yes | Yes | Yes |
| N | 5721 | 5721 | 6188 | 6188 | 5522 | 5522 | 5745 | 5745 | 4755 | 4755 | 5571 | 5571 | 4568 | 4568 | 5039 | 5039 |
| F | 40.42 | 37.03 | 44.19 | 52.91 | 50.12 | 44.23 | 38.20 | 41.31 | 34.60 | 31.03 | 41.49 | 50.94 | 44.26 | 39.45 | 34.57 | 36.97 |
| R2 | 0.190 | 0.177 | 0.192 | 0.221 | 0.161 | 0.145 | 0.244 | 0.258 | 0.190 | 0.174 | 0.193 | 0.227 | 0.163 | 0.148 | 0.246 | 0.258 |
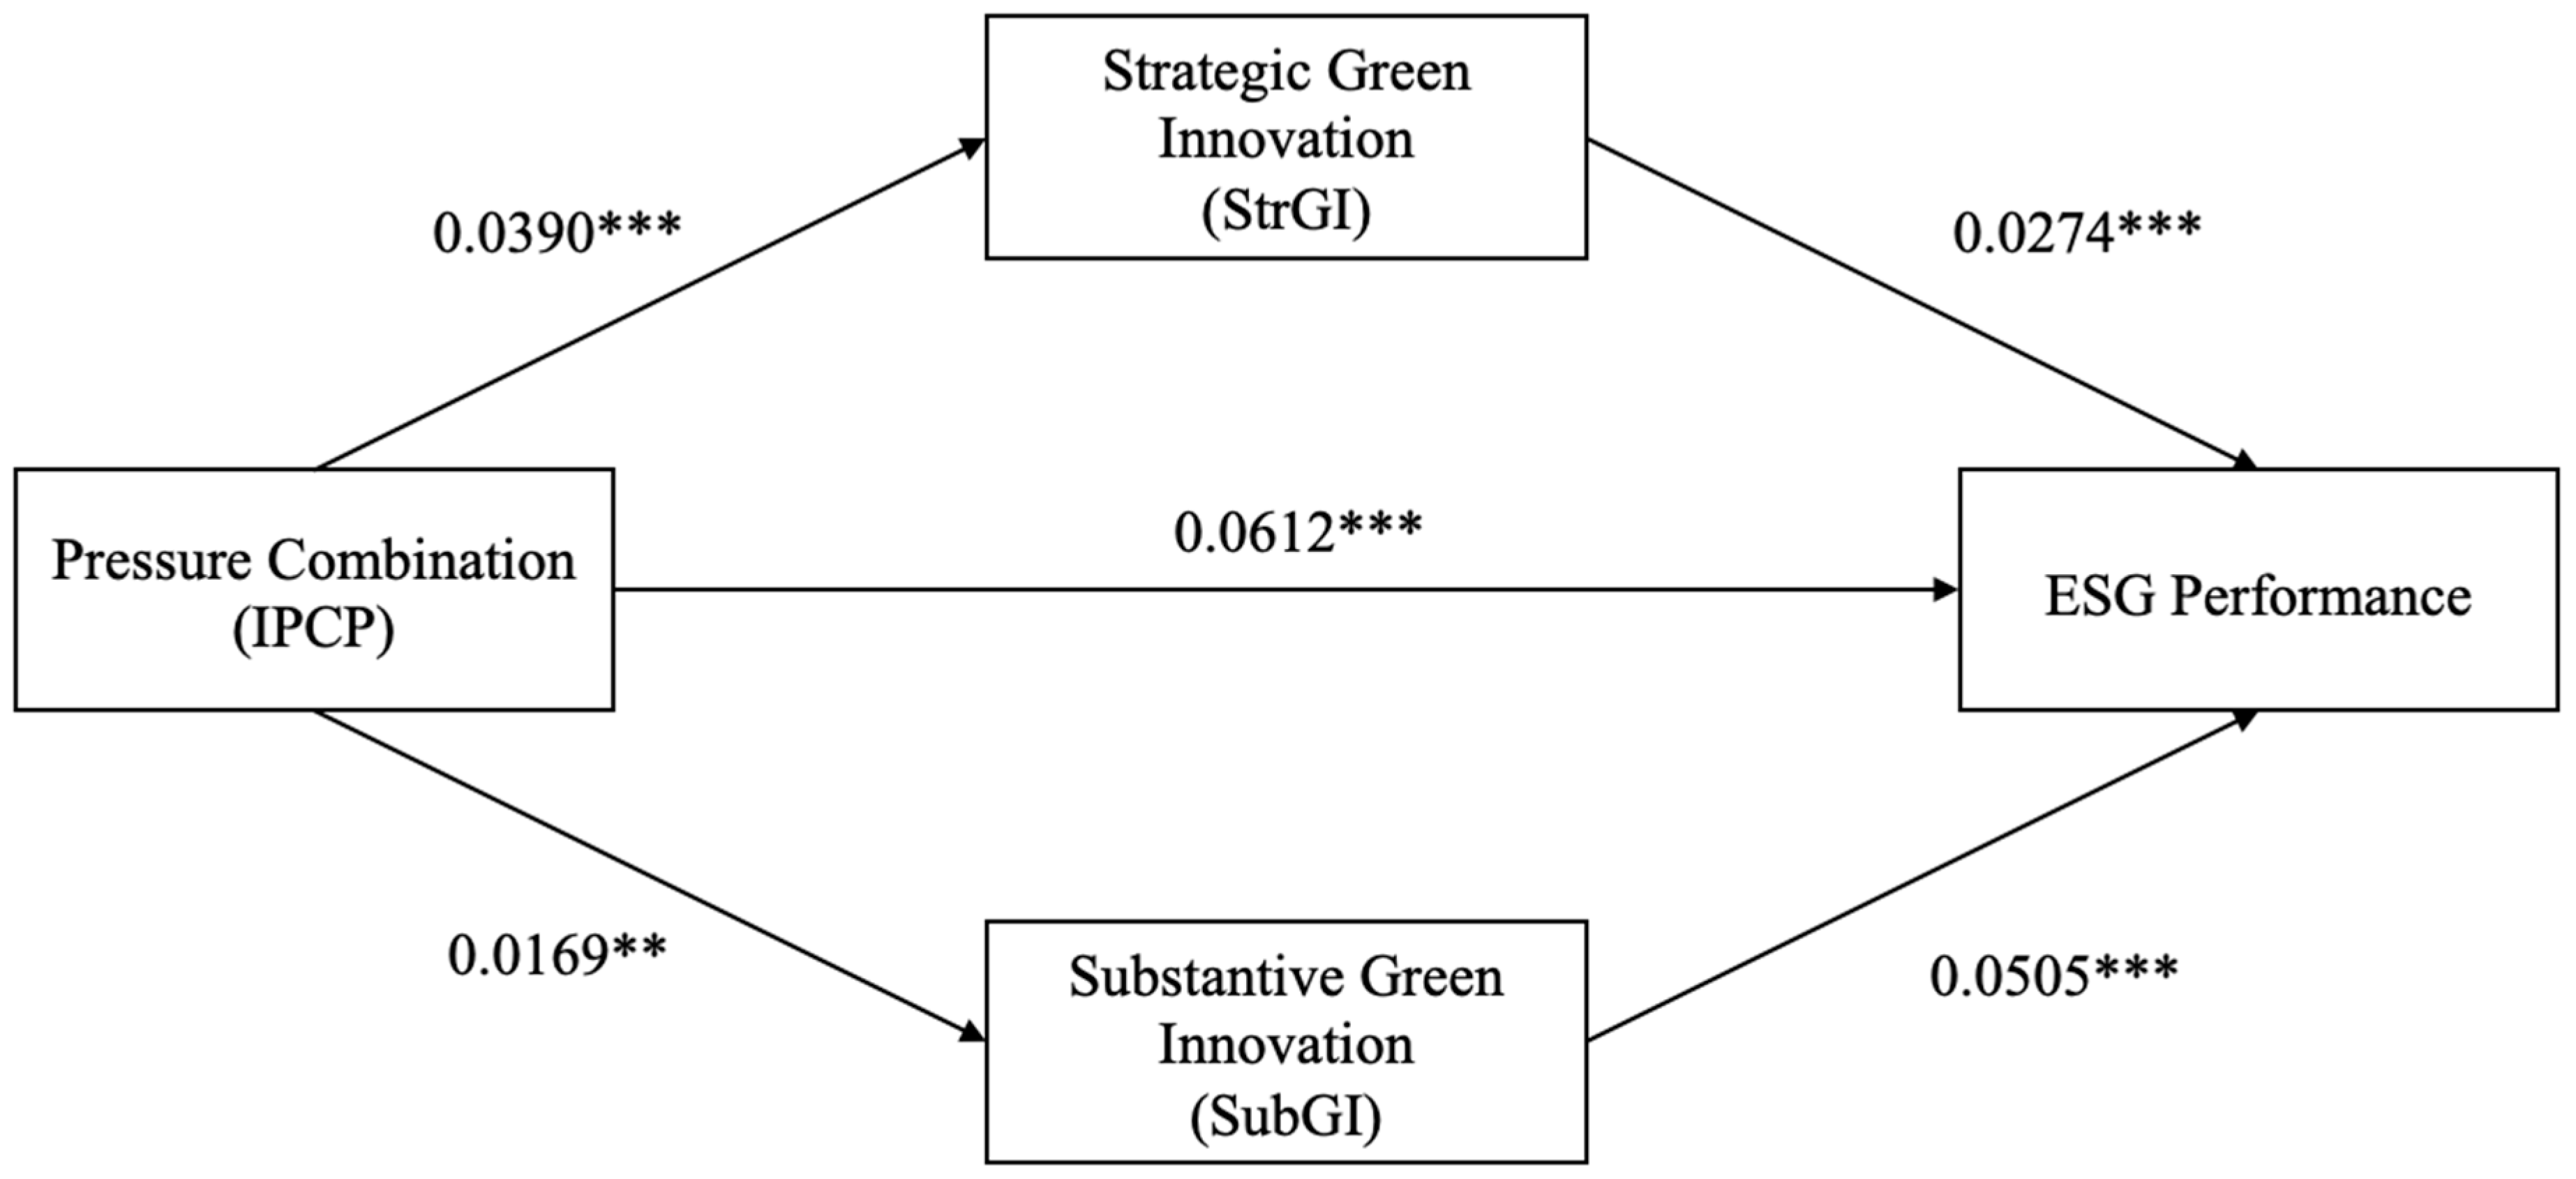
| Path | Estimate | S.E. | Est./S.E. | p-Value | Std. Coef. |
|---|---|---|---|---|---|
| IPCP → StrGI | 0.039 | 0.0076 | 5.14 | 0 | 0.039 |
| IPCP → SubGI | 0.0169 | 0.0076 | 2.24 | 0.025 | 0.0169 |
| StrGI → ESG | 0.0274 | 0.0082 | 3.33 | 0.001 | 0.0274 |
| SubGI → ESG | 0.0505 | 0.0083 | 6.12 | 0 | 0.0505 |
| IPCP → ESG | 0.0612 | 0.0079 | 7.74 | 0 | 0.0612 |
| Indirect Path | Estimate | p-Value | 95% Confidence Interval (Normal) |
|---|---|---|---|
| SIPCP → StrGI → ESG | 0.00107 | 0.008 | [0.00028, 0.00186] |
| SIPCP → SubGI → ESG | 0.00086 | 0.038 | [0.00005, 0.00166] |
References
- Nguyen, N.T.T.; Nguyen, P.V.; Vrontis, D.; Vo, N.T.T. Enhancing organizational sustainable performance through green innovation: The roles of knowledge application, government policy, and green market orientation. J. Knowl. Manag. 2025, 29, 870–890. [Google Scholar] [CrossRef]
- Obuobi, B.; Awuah, F.; Nketiah, E.; Adu-Gyamfi, G.; Shi, V.; Hu, G. The dynamics of green innovation, environmental policy and energy structure for environmental sustainability; Evidence from AfCFTA countries. Renew. Sustain. Energy Rev. 2024, 197, 114409. [Google Scholar] [CrossRef]
- Contreras, S.; Ghosh, A.; Kong, J.H. Financial crisis, Bank failures and corporate innovation. J. Bank. Financ. 2021, 129, 106161. [Google Scholar] [CrossRef]
- Farooq, U.; Wen, J.; Tabash, M.I.; Fadoul, M. Environmental regulations and capital investment: Does green innovation allow to grow? Int. Rev. Econ. Financ. 2024, 89, 878–893. [Google Scholar] [CrossRef]
- Wolf, A. City power in the age of Silicon Valley: Evaluating municipal regulatory response to the entry of Uber to the American city. City Community 2022, 21, 290–313. [Google Scholar] [CrossRef]
- Su, J.; Gao, X.; Tan, J. Positioning for optimal distinctiveness: How firms manage competitive and institutional pressures under dynamic and complex environment. Strateg. Manag. J. 2024, 45, 333–361. [Google Scholar] [CrossRef]
- Aragòn-Correa, J.A.; Marcus, A.A.; Vogel, D. The effects of mandatory and voluntary regulatory pressures on firms’ environmental strategies: A review and recommendations for future research. Acad. Manag. Ann. 2020, 14, 339–365. [Google Scholar] [CrossRef]
- Qi, G.; Zou, H.; Xie, X. Governmental inspection and green innovation: Examining the role of environmental capability and institutional development. Corp. Soc. Responsib. Environ. Manag. 2020, 27, 1774–1785. [Google Scholar] [CrossRef]
- Chen, Z.; Jin, J.; Li, M. Does media coverage influence firm green innovation? The moderating role of regional environment. Technol. Soc. 2022, 70, 102006. [Google Scholar] [CrossRef]
- Singh, R.K. Wheeling towards sustainability: The nexus of external pressures, green innovation and circular supply chain excellence. Bus. Process Manag. J. 2024, 30, 1044–1064. [Google Scholar] [CrossRef]
- Phillips, D.; Edwards, B.D.; Rutherford, M.W. Conformity or Differentiation: Optimal distinctiveness through mediating channels. J. Bus. Res. 2025, 189, 115154. [Google Scholar] [CrossRef]
- Zhao, E.Y.; Fisher, G.; Lounsbury, M.; Miller, D. Optimal distinctiveness: Broadening the interface between institutional theory and strategic management. Strateg. Manag. J. 2017, 38, 93–113. [Google Scholar] [CrossRef]
- Fabrizi, A.; Gentile, M.; Guarini, G.; Meliciani, V. The impact of environmental regulation on innovation and international competitiveness. J. Evol. Econ. 2024, 34, 169–204. [Google Scholar] [CrossRef]
- Zhong, D.; Um, K.H. How customer integration drives green innovation: Exploring the influence of regulatory pressures and market changes. J. Manuf. Technol. Manag. 2025, 36, 731–754. [Google Scholar] [CrossRef]
- Wang, J.; Xue, Y.; Sun, X.; Yang, J. Green learning orientation, green knowledge acquisition and ambidextrous green innovation. J. Clean. Prod. 2020, 250, 119475. [Google Scholar] [CrossRef]
- Liu, Q.; Dong, B. How does China’s green credit policy affect the green innovation of heavily polluting enterprises? The perspective of substantive and strategic innovations. Environ. Sci. Pollut. Res. 2022, 29, 77113–77130. [Google Scholar] [CrossRef]
- Lian, G.; Xu, A.; Zhu, Y. Substantive green innovation or symbolic green innovation? The impact of ER on enterprise green innovation based on the dual moderating effects. J. Innov. Knowl. 2022, 7, 100203. [Google Scholar] [CrossRef]
- Zhang, M.; Yan, T.; Gao, W.; Xie, W.; Yu, Z. How does environmental regulation affect real green technology innovation and strategic green technology innovation? Sci. Total Environ. 2023, 872, 162221. [Google Scholar] [CrossRef]
- Li, Z.; Huang, Z.; Su, Y. New media environment, environmental regulation and corporate green technology innovation: Evidence from China. Energy Econ. 2023, 119, 106545. [Google Scholar] [CrossRef]
- Bu, J.; Zhao, E.Y.; Li, K.J.; Li, J.M. Multilevel optimal distinctiveness: Examining the impact of within-and between-organization distinctiveness of product design on market performance. Strateg. Manag. J. 2022, 43, 1793–1822. [Google Scholar] [CrossRef]
- Taeuscher, K.; Bouncken, R.; Pesch, R. Gaining legitimacy by being different: Optimal distinctiveness in crowdfunding platforms. Acad. Manag. J. 2021, 64, 149–179. [Google Scholar] [CrossRef]
- Cecere, G.; Corrocher, N.; Mancusi, M.L. Financial constraints and public funding of eco-innovation: Empirical evidence from European SMEs. Small Bus. Econ. 2020, 54, 285–302. [Google Scholar] [CrossRef]
- Agrawal, R.; Agrawal, S.; Samadhiya, A.; Kumar, A.; Luthra, S.; Jain, V. Adoption of green finance and green innovation for achieving circularity: An exploratory review and future directions. Geosci. Front. 2024, 15, 101669. [Google Scholar] [CrossRef]
- Liao, Z. Is environmental innovation conducive to corporate financing? The moderating role of advertising expenditures. Bus. Strategy Environ. 2020, 29, 954–961. [Google Scholar] [CrossRef]
- Dosi, G.; Marengo, L.; Pasquali, C. How much should society fuel the greed of innovators? On the relations between appropriability, opportunities and rates of innovation. Res. Policy 2006, 35, 1110–1121. [Google Scholar] [CrossRef]
- Neumann, T. Does it pay for new firms to be green? An empirical analysis of when and how different greening strategies affect the performance of new firms. J. Clean. Prod. 2021, 317, 128403. [Google Scholar] [CrossRef]
- Chen, M.; Li, Z.; Liu, Z. Substantive response or strategic response? The induced green innovation effects of carbon prices. Int. Rev. Financ. Anal. 2024, 93, 103139. [Google Scholar] [CrossRef]
- Ai, M.; Luo, F.; Bu, Y. Green innovation and corporate financial performance: Insights from operating risks. J. Clean. Prod. 2024, 456, 142353. [Google Scholar] [CrossRef]
- Seroka-Stolka, O.; Fijorek, K. Enhancing corporate sustainable development: Proactive environmental strategy, stakeholder pressure and the moderating effect of firm size. Bus. Strategy Environ. 2020, 29, 2338–2354. [Google Scholar] [CrossRef]
- Akhtar, S.; Tian, H.; Iqbal, S.; Hussain, R.Y. Environmental regulations and government support drive green innovation performance: Role of competitive pressure and digital transformation. Clean. Technol. Environ. 2024, 26, 4433–4453. [Google Scholar] [CrossRef]
- Ma, B.; Li, H. Antitrust laws, market competition and corporate green innovation. Int. Rev. Econ. Financ. 2025, 97, 103768. [Google Scholar] [CrossRef]
- Xu, Y.; Chin, W.; Liu, Y.; He, K. Do institutional pressures promote green innovation? The effects of cross-functional coopetition in green supply chain management. Int. J. Phys. Distrib. Logist. Manag. 2023, 53, 743–761. [Google Scholar] [CrossRef]
- Porter, M.E.; Linde, C.V.D. Toward a new conception of the environment-competitiveness relationship. J. Econ. Perspect. 1995, 9, 97–118. [Google Scholar] [CrossRef]
- He, X.; Jing, Q.; Chen, H. The impact of environmental tax laws on heavy-polluting enterprise ESG performance: A stakeholder behavior perspective. J. Environ. Manag. 2023, 344, 118578. [Google Scholar] [CrossRef] [PubMed]
- Sherazi, K.; Zhang, P.; Ghazanfar, F.; Khan, Q.T.A. Why is institutional pressure insufficient to develop green innovation in manufacturing firms? The role of green high-performance work systems and managerial environmental concern. J. Environ. Plan. Manag. 2025, 68, 1622–1647. [Google Scholar] [CrossRef]
- Lee, C.L.; Liang, J. The effect of carbon regulation initiatives on corporate ESG performance in real estate sector: International evidence. J. Clean. Prod. 2024, 453, 142188. [Google Scholar] [CrossRef]
- Tian, Y.; Song, W.; Liu, M. Assessment of how environmental policy affects urban innovation: Evidence from China’s low-carbon pilot cities program. Econ. Anal. Policy 2021, 71, 41–56. [Google Scholar] [CrossRef]
- Zeng, H.; Li, X.; Zhou, Q.; Wang, L. Local government environmental regulatory pressures and corporate environmental strategies: Evidence from natural resource accountability audits in China. Bus. Strategy Environ. 2022, 31, 3060–3082. [Google Scholar] [CrossRef]
- Martins, H.C. Competition and ESG practices in emerging markets: Evidence from a difference-in-differences model. Financ. Res. Lett. 2022, 46, 102371. [Google Scholar] [CrossRef]
- Leong, C.K.; Yang, Y.C. Market competition and firms’ social performance. Econ. Model. 2020, 91, 601–612. [Google Scholar] [CrossRef]
- Li, P.Y. Determinants of corporate social responsibility performance in emerging markets: An international orientation perspective. Corp. Soc. Responsib. Environ. Manag. 2023, 30, 1348–1362. [Google Scholar] [CrossRef]
- Liu, Y.; Liu, S.; Shao, X.; He, Y. Policy spillover effect and action mechanism for environmental rights trading on green innovation: Evidence from China’s carbon emissions trading policy. Renew. Sust. Energy Rev. 2022, 153, 111779. [Google Scholar] [CrossRef]
- Zou, H.; Zhang, L.; Qi, G. How institutional pressures on green innovation are perceived by firms? The role of board social ties. Bus. Strategy Dev. 2024, 7, e400. [Google Scholar] [CrossRef]
- Acebo, E.; Miguel-Dávila, J.Á.; Nieto, M. External stakeholder engagement: Complementary and substitutive effects on firms’ eco-innovation. Bus. Strategy Environ. 2021, 30, 2671–2687. [Google Scholar] [CrossRef]
- Lee, M.J.; Pak, A.; Roh, T. The interplay of institutional pressures, digitalization capability, environmental, social, and governance strategy, and triple bottom line performance: A moderated mediation model. Bus. Strategy Environ. 2024, 33, 5247–5268. [Google Scholar] [CrossRef]
- Guo, J.; Wang, Y.; Chen, J. Policy instrument mix, financial slack, and firm innovation performance: Evidence from China’s photovoltaic industry. Technovation 2025, 141, 103174. [Google Scholar] [CrossRef]
- Roh, T.; Yu, B. Paving a way toward green world: Two-track institutional approaches and corporate green innovation. IEEE Trans. Eng. Manag. 2023, 71, 9244–9257. [Google Scholar] [CrossRef]
- Zhou, K.Z.; Gao, G.Y.; Zhao, H. State ownership and firm innovation in China: An integrated view of institutional and efficiency logics. Admin Sci. Q. 2017, 62, 375–404. [Google Scholar] [CrossRef]
- Bhatia, M.S.; Kumar, S. Linking stakeholder and competitive pressure to Industry 4.0 and performance: Mediating effect of environmental commitment and green process innovation. Bus. Strategy Environ. 2022, 31, 1905–1918. [Google Scholar] [CrossRef]
- Chu, Z.; Xu, J.; Lai, F.; Collins, B.J. Institutional theory and environmental pressures: The moderating effect of market uncertainty on innovation and firm performance. IEEE Trans. Eng. Manag. 2018, 65, 392–403. [Google Scholar] [CrossRef]
- Cicchiello, A.F.; Cotugno, M.; Foroni, C. Does competition affect ESG controversies? Evidence from the banking industry. Financ. Res. Lett. 2023, 55, 103972. [Google Scholar] [CrossRef]
- Gong, T.J.; Yu, C.M.J.; Huang, K.F. Strategic similarity and firm performance: Multiple replications of Deephouse (1999). Strateg. Organ. 2021, 19, 207–236. [Google Scholar] [CrossRef]
- Topaler, B.; Koçak, Ö.; Üsdiken, B. Positioning new identities for appeal: Configurations of optimal distinctiveness amid ancestral identities. Strateg. Organ. 2023, 21, 537–565. [Google Scholar] [CrossRef]
- Moser, R.; Winkler, J.; Narayanamurthy, G.; Pereira, V. Organizational knowledgeable responses to institutional pressures—A review, synthesis and extension. J. Knowl. Manag. 2020, 24, 2243–2271. [Google Scholar] [CrossRef]
- Tetteh, L.A.; Agyenim-Boateng, C.; Simpson, S.N.Y. Institutional pressures and accountability processes in pursuit of sustainable development goals: Insights from Ghanaian indigenous oil companies. Corp. Soc. Responsib. Environ. Manag. 2024, 31, 89–107. [Google Scholar] [CrossRef]
- Berrone, P.; Fosfuri, A.; Gelabert, L.; Gomez-Mejia, L.R. Necessity as the mother of ‘green’ inventions: Institutional pressures and environmental innovations. Strateg. Manag. J. 2013, 34, 891–909. [Google Scholar] [CrossRef]
- Pache, A.C.; Santos, F. Inside the hybrid organization: Selective coupling as a response to competing institutional logics. Acad. Manag. J. 2013, 56, 972–1001. [Google Scholar] [CrossRef]
- Luo, G.; Guo, J.; Yang, F.; Wang, C. Environmental regulation, green innovation and high-quality development of enterprise: Evidence from China. J. Clean. Prod. 2023, 418, 138112. [Google Scholar] [CrossRef]
- Boubaker, S.; Dang, V.A.; Sassi, S. Competitive pressure and firm investment efficiency: Evidence from corporate employment decisions. Eur. Financ. Manag. 2022, 28, 113–161. [Google Scholar] [CrossRef]
- Zhang, S.; Wu, Z.; Dou, W.; Hao, Y. How does economic policy uncertainty affect corporate green innovation? Evidence from China. J. Environ. Plan. Manag. 2025, 68, 1363–1389. [Google Scholar] [CrossRef]
- Gao, Z.; Zhao, Y.; Li, L.; Hao, Y. Echoes of dependency: The impact of resource reliance on green industry transformation in China. Resour. Policy 2024, 96, 105219. [Google Scholar] [CrossRef]
- March, J.G.; Cyert, R. A Behavioral Theory of the Firm; Prentice Hall: Englewood Cliffs, NJ, USA, 1963; pp. 169–187. [Google Scholar]
- He, X.; Ruan, J.; Bian, C. Development of artificial intelligence empowering green innovation: A case study of the Yangtze River Economic Belt. Environ. Dev. Sustain. 2025, 1–29. [Google Scholar] [CrossRef]
- Oliver, C. Strategic responses to institutional processes. Acad. Manag. Rev. 1991, 16, 145–179. [Google Scholar] [CrossRef]
- Greenwood, R.; Raynard, M.; Kodeih, F.; Micelotta, E.R.; Lounsbury, M. Institutional complexity and organizational responses. Acad. Manag. Ann. 2011, 5, 317–371. [Google Scholar] [CrossRef]
- Struckell, E.; Ojha, D.; Patel, P.C.; Dhir, A. Strategic choice in times of stagnant growth and uncertainty: An institutional theory and organizational change perspective. Technol. Forecast. Soc. Change 2022, 182, 121839. [Google Scholar] [CrossRef]
- Lopes, J.M.; Gomes, S.; Pacheco, R.; Monteiro, E.; Santos, C. Drivers of sustainable innovation strategies for increased competition among companies. Sustainability 2022, 14, 5471. [Google Scholar] [CrossRef]
- Geels, F.W. Reconceptualising the co-evolution of firms-in-industries and their environments: Developing an inter-disciplinary Triple Embeddedness Framework. Res. Policy 2014, 43, 261–277. [Google Scholar] [CrossRef]
- Bataineh, M.J.; Sánchez-Sellero, P.; Ayad, F. Green is the new black: How research and development and green innovation provide businesses a competitive edge. Bus. Strategy Environ. 2024, 33, 1004–1023. [Google Scholar] [CrossRef]
- Durand, R.; Thornton, P.H. Categorizing institutional logics, institutionalizing categories: A review of two literatures. Acad. Manag. Ann. 2018, 12, 631–658. [Google Scholar] [CrossRef]
- Child, J. Organizational structure, environment and performance: The role of strategic choice. Sociology 1972, 6, 1–22. [Google Scholar] [CrossRef]
- Jiang, L.; Bai, Y. Strategic or substantive innovation?-The impact of institutional investors’ site visits on green innovation evidence from China. Technol. Soc. 2022, 68, 101904. [Google Scholar] [CrossRef]
- Song, J.; Xue, L.; Bai, R.; Ye, T. Substantive or strategic green innovation? The green policy effect differentiation perspective. Financ. Res. Lett. 2024, 63, 105313. [Google Scholar] [CrossRef]
- Li, X.; Guo, F.; Xu, Q.; Wang, S.; Huang, H. Strategic or substantive innovation? The effect of government environmental punishment on enterprise green technology innovation. Sustain. Dev. 2023, 31, 3365–3386. [Google Scholar] [CrossRef]
- Wurlod, J.D.; Noailly, J. The impact of green innovation on energy intensity: An empirical analysis for 14 industrial sectors in OECD countries. Energy Econ. 2018, 71, 47–61. [Google Scholar] [CrossRef]
- Liao, Z.; Weng, C.; Shen, C. Can public surveillance promote corporate environmental innovation? The mediating role of environmental law enforcement. Sustain. Dev. 2020, 28, 1519–1527. [Google Scholar] [CrossRef]
- Huang, X. The roles of competition on innovation efficiency and firm performance: Evidence from the Chinese manufacturing industry. Eur. Res. Manag. Bus. Econ. 2023, 29, 100201. [Google Scholar] [CrossRef]
- Wang, X.; Fan, L.W.; Zhang, H. Policies for enhancing patent quality: Evidence from renewable energy technology in China. Energy Policy 2023, 180, 113660. [Google Scholar] [CrossRef]
- Zhao, L.; Zhang, L.; Sun, J.; He, P. Can public participation constraints promote green technological innovation of Chinese enterprises? The moderating role of government environmental regulatory enforcement. Technol. Forecast. Soc. Change 2022, 174, 121198. [Google Scholar] [CrossRef]
- Iacobucci, D.; Posavac, S.S.; Kardes, F.R.; Schneider, M.J.; Popovich, D.L. Toward a more nuanced understanding of the statistical properties of a median split. J. Consum. Psychol. 2015, 25, 652–665. [Google Scholar] [CrossRef]
- Zhao, X.; Liu, C.; Yang, M. The effects of environmental regulation on China’s total factor productivity: An empirical study of carbon-intensive industries. J. Clean. Prod. 2018, 179, 325–334. [Google Scholar] [CrossRef]
- Zhou, G.; Liu, L.; Luo, S. Sustainable development, ESG performance and company market value: Mediating effect of financial performance. Bus. Strategy Environ. 2022, 31, 3371–3387. [Google Scholar] [CrossRef]
- Sun, Q.; Li, Y.; Hong, A. Integrating ESG into corporate strategy: Unveiling the moderating effect of digital transformation on green innovation through employee insights. Systems 2024, 12, 148. [Google Scholar] [CrossRef]
- Deephouse, D.L. To be different, or to be the same? It’s a question (and theory) of strategic balance. Strateg. Manag. J. 1999, 20, 147–166. [Google Scholar] [CrossRef]
- Zhao, E.Y.; Glynn, M.A. Optimal distinctiveness: On being the same and different. Organ. Theory 2022, 3, 26317877221079340. [Google Scholar] [CrossRef]


| Variables | Symbol | Measurement |
|---|---|---|
| Substantive green innovation | SubGI | ln (green invention patents applications + 1) |
| Strategic green innovation | StrGI | ln (green utility patent application + 1) |
| Institutional pressure | IP | ln (environmental administrative penalty cases + 1) |
| Competitive pressure | CP | 1-HHI |
| Enterprise scale | Size | ln (total enterprise assets) |
| Enterprise maturity | Age | ln (years since firm establishment) |
| Asset-liability ratio | Lev | total liabilities/total assets |
| Fixed Asset Ratio | Fixed | net fixed assets/total assets |
| Nature of shareholding | Soe | 1 if state-owned enterprises, 0 otherwise |
| Board size | Board | total number of board directors |
| Management ownership ratio | Mshare | shares held by management/total shares outstanding |
| Dual role | Dual | 1 if CEO and chairman are the same person, 0 otherwise |
| Enterprise market value | TobinQ | market value of firm/total assets |
| Economic development | GDP | ln (regional GDP) |
| Year | Year | year dummy variable |
| Province | Province | province dummy variables |
| Variable | Mean | Std. Dev. | Min | Max |
|---|---|---|---|---|
| StrGI | 0.546 | 0.882 | 0.000 | 3.664 |
| SubGI | 0.539 | 0.910 | 0.000 | 4.043 |
| IP | 8.578 | 1.037 | 5.673 | 10.012 |
| CP | 0.584 | 0.112 | 0.026 | 0.673 |
| Size | 22.267 | 1.283 | 20.108 | 26.330 |
| Age | 2.904 | 0.324 | 1.946 | 3.526 |
| Lev | 0.331 | 0.140 | 0.052 | 0.611 |
| Fixed | 0.177 | 0.119 | 0.003 | 0.506 |
| Soe | 0.321 | 0.467 | 0.000 | 1.000 |
| Board | 1.136 | 0.064 | 0.959 | 1.292 |
| Mshare | 0.298 | 0.457 | 0.000 | 1.000 |
| Dual | 1.649 | 1.163 | 0.000 | 4.235 |
| TobinQ | 1.021 | 0.335 | 0.000 | 2.129 |
| GDP | 2.189 | 0.404 | 1.292 | 2.997 |
| IP | CP | Size | Age | Lev | Fixed | |
|---|---|---|---|---|---|---|
| VIF | 1.17 | 1.01 | 1.99 | 1.15 | 1.50 | 1.10 |
| 1/VIF | 0.853 | 0.993 | 0.502 | 0.873 | 0.668 | 0.906 |
| Soe | Board | Mshare | Dual | TobinQ | GDP | |
| VIF | 1.72 | 1.16 | 1.77 | 1.14 | 1.20 | 1.28 |
| 1/VIF | 0.581 | 0.866 | 0.502 | 0.878 | 0.835 | 0.783 |
| Variables | High IP–High CP | Low IP–Low CP | ||||
|---|---|---|---|---|---|---|
| (1) | (2) | (3) | (1) | (2) | (3) | |
| GI | StrGI | SubGI | GI | StrGI | SubGI | |
| IPCP | −0.343 *** (−5.07) | −0.375 *** (−5.46) | −0.327 *** (−4.69) | −0.021 ** (−2.54) | −0.026 *** (−3.08) | −0.012 (−1.41) |
| Size | 0.456 *** (28.55) | 0.400 *** (24.73) | 0.451 *** (27.36) | 0.452 *** (32.70) | 0.404 *** (28.23) | 0.446 *** (32.09) |
| Age | −0.051 *** (−3.94) | −0.056 *** (−4.26) | −0.033 ** (−2.50) | −0.083 *** (−6.55) | −0.090 *** (−6.83) | −0.068 *** (−5.29) |
| Lev | 0.091 *** (6.52) | 0.113 *** (7.95) | 0.064 *** (4.41) | 0.050 *** (3.91) | 0.069 *** (5.12) | 0.027 ** (2.07) |
| Soe | −0.021 (−0.61) | −0.115 *** (−3.31) | 0.060 * (1.70) | 0.077 *** (2.67) | 0.058 * (1.91) | 0.097 *** (3.31) |
| Fixed | 0.014 (1.06) | 0.071 *** (5.46) | −0.037 *** (−2.76) | −0.093 *** (−8.58) | −0.076 *** (−6.72) | −0.109 *** (−9.99) |
| Board | 0.007 (0.58) | 0.018 (1.49) | −0.003 (−0.26) | −0.024 ** (−2.14) | −0.025 ** (−2.10) | −0.018 (−1.58) |
| Mshare | 0.080 *** (5.52) | 0.049 *** (3.37) | 0.086 *** (5.81) | 0.087 *** (5.77) | 0.075 *** (4.84) | 0.081 *** (5.33) |
| Dual | 0.057 *** (2.32) | 0.055 ** (2.20) | 0.078 *** (3.07) | −0.085 *** (−3.17) | −0.100 *** (−3.58) | −0.053 ** (−1.98) |
| TobinQ | 0.092 *** (7.37) | 0.064 *** (5.05) | 0.099 *** (7.66) | 0.002 (0.18) | −0.027 ** (−2.16) | 0.025 ** (2.06) |
| GDP | 0.697 * (1.91) | 0.546 (1.47) | 0.748 ** (1.98) | −0.224 * (−1.80) | −0.207 (−1.61) | −0.082 (−0.65) |
| Year | Yes | Yes | Yes | Yes | Yes | Yes |
| Province | Yes | Yes | Yes | Yes | Yes | Yes |
| Constant | 1.081 (1.34) | 0.932 (1.14) | 1.233 (1.48) | −0.321 *** (−5.67) | −0.314 *** (−5.34) | −0.265 *** (−4.64) |
| Observations | 6830 | 6830 | 6830 | 6758 | 6758 | 6758 |
| F | 53.53 | 47.81 | 44.96 | 56.40 | 46.37 | 49.78 |
| R2 | 0.206 | 0.188 | 0.179 | 0.292 | 0.253 | 0.267 |
| Variables | High IP–Low CP | Low IP–High CP | ||||
|---|---|---|---|---|---|---|
| (1) | (2) | (3) | (1) | (2) | (3) | |
| GI | StrGI | SubGI | GI | StrGI | SubGI | |
| IPCP | 0.074 *** (6.82) | 0.093 *** (8.23) | 0.049 *** (4.47) | 0.191 *** (4.42) | 0.190 *** (4.45) | 0.193 *** (4.37) |
| Size | 0.429 *** (29.86) | 0.349 *** (23.42) | 0.433 *** (29.88) | 0.355 *** (24.17) | 0.314 *** (21.63) | 0.349 *** (23.25) |
| Age | −0.063 *** (−5.05) | −0.056 *** (−4.29) | −0.063 *** (−5.03) | −0.099 *** (−7.91) | −0.086 *** (−6.98) | −0.088 *** (−6.86) |
| Lev | 0.075 *** (5.67) | 0.108 *** (7.87) | 0.029 ** (2.17) | 0.018 (1.43) | 0.042 *** (3.32) | −0.005 (−0.38) |
| Soe | 0.088 *** (2.75) | 0.071 ** (2.14) | 0.127 *** (3.92) | 0.134 *** (4.73) | 0.093 *** (3.32) | 0.153 *** (5.27) |
| Fixed | −0.054 *** (−4.66) | −0.021 * (−1.77) | −0.075 *** (−6.47) | 0.011 (1.05) | 0.054 *** (5.15) | −0.024 ** (−2.21) |
| Board | 0.008 (0.64) | 0.0030 (0.25) | −0.001 (−0.08) | −0.015 (−1.36) | −0.008 (−0.71) | −0.015 (−1.29) |
| Mshare | 0.061 *** (4.48) | 0.069 *** (4.93) | 0.042 *** (3.04) | 0.074 *** (5.19) | 0.084 *** (5.90) | 0.056 *** (3.81) |
| Dual | 0.071 *** (2.98) | 0.024 (0.96) | 0.096 *** (3.99) | −0.035 (−1.43) | −0.018 (−0.73) | −0.030 (−1.20) |
| TobinQ | 0.054 *** (4.17) | 0.016 (1.17) | 0.068 *** (5.19) | 0.040 *** (3.46) | 0.015 (1.33) | 0.061 *** (5.22) |
| GDP | −0.778 ** (−2.21) | −1.060 *** (−2.91) | −0.477 (−1.35) | −0.085 (−0.67) | −0.144 (−1.16) | −0.057 (−0.44) |
| Year | Yes | Yes | Yes | Yes | Yes | Yes |
| Province | Yes | Yes | Yes | Yes | Yes | Yes |
| Constant | −1.494 * (−1.92) | −2.074 *** (−2.57) | −0.902 (−1.15) | −0.360 *** (−5.57) | −0.288 *** (−4.50) | −0.289 *** (−4.38) |
| Observations | 6848 | 6848 | 6848 | 6777 | 6777 | 6777 |
| F | 67.67 | 51.25 | 59.57 | 30.71 | 27.83 | 25.78 |
| R2 | 0.247 | 0.199 | 0.224 | 0.183 | 0.169 | 0.158 |
Disclaimer/Publisher’s Note: The statements, opinions and data contained in all publications are solely those of the individual author(s) and contributor(s) and not of MDPI and/or the editor(s). MDPI and/or the editor(s) disclaim responsibility for any injury to people or property resulting from any ideas, methods, instructions or products referred to in the content. |
© 2025 by the authors. Licensee MDPI, Basel, Switzerland. This article is an open access article distributed under the terms and conditions of the Creative Commons Attribution (CC BY) license (https://creativecommons.org/licenses/by/4.0/).
Share and Cite
Cong, R.; Gao, H.; Wang, L.; Liu, B.; Wang, Y. Achieving Optimal Distinctiveness in Green Innovation: The Role of Pressure Congruence. Systems 2025, 13, 657. https://doi.org/10.3390/systems13080657
Cong R, Gao H, Wang L, Liu B, Wang Y. Achieving Optimal Distinctiveness in Green Innovation: The Role of Pressure Congruence. Systems. 2025; 13(8):657. https://doi.org/10.3390/systems13080657
Chicago/Turabian StyleCong, Rong, Hongyan Gao, Liya Wang, Bo Liu, and Ya Wang. 2025. "Achieving Optimal Distinctiveness in Green Innovation: The Role of Pressure Congruence" Systems 13, no. 8: 657. https://doi.org/10.3390/systems13080657
APA StyleCong, R., Gao, H., Wang, L., Liu, B., & Wang, Y. (2025). Achieving Optimal Distinctiveness in Green Innovation: The Role of Pressure Congruence. Systems, 13(8), 657. https://doi.org/10.3390/systems13080657