Article

Affordance Actualization and Post-Adoption Perceived Usefulness: An Investigation of the Continued Use of Fitness Apps

1
College of Business, Imam Mohammad Ibn Saud Islamic University (IMSIU), Riyadh 11564, Saudi Arabia
2
Business School, Worcester Polytechnic Institute, Worcester, MA 01609, USA
*
Author to whom correspondence should be addressed.
Systems 2025, 13(8), 652; https://doi.org/10.3390/systems13080652
Submission received: 21 June 2025 / Revised: 25 July 2025 / Accepted: 28 July 2025 / Published: 1 August 2025

Abstract

This study investigates mechanisms that influence how users perceive a technology’s usefulness after adoption as they continue to use the technology. The Expectation Confirmation Model (ECM) has been widely used to examine the key drivers of IT continuance, emphasizing perceived usefulness as a central factor. Although researchers have explored factors, such as ease of use, trust, and site quality, affecting post-adoption perceived usefulness, the mechanisms shaping post-adoption perceived usefulness remain underexplored. This study proposes that post-adoption perceived usefulness is shaped through the actualization of the technology’s affordances. Using a survey focused on fitness app usage (e.g., Fitbit), we examined various affordances users actualize and whether actualization of an affordance shapes their perception of usefulness. Results show that some affordances are actualized widely by most users (e.g., exercise status updating) while others are actualized by fewer users (e.g., reminders to exercise or guiding users how to exercise). Moreover, when an affordance is widely actualized, it significantly influences users’ perceptions of usefulness within the ECM framework. Given that perceived usefulness is a key factor in predicting IT continuance, our findings contribute to the literature by highlighting the influence of actualized affordances on perceptions of usefulness and hence IT continuance.

1. Introduction

Post-adoption or usage behaviors, such as continuance of information technology (IT) use, have been a phenomenon of constant interest in information systems (IS) research [1,2,3,4,5]. IT continuance is described as “users’ decisions to continue using an IT over the long run” [1]. Various IS theories and models have been developed to uncover factors influencing IT continuance [3,5,6,7,8,9,10,11,12]. These theories and models have been applied in research targeting different contexts among various populations with an aim to understand the involved phenomena broadly [6,7,8,9,10].
Among the various developed theoretical models, the Expectation Confirmation Model (ECM) was one of the earliest accepted theoretical models explaining the essential influences on users’ continuing to use technology [5,13,14]. The ECM posits that users’ confirmation of what is expected while using technology impacts their perception of the technology usefulness and their satisfaction [6]. Users’ perceptions of the technology’s usefulness and their satisfaction directly impact their intention to continue using it [6]. Although the original ECM study and its early adopters validated the framework through systems that have since become essential in modern life, such as organizational work systems and online banking [3,6], the model remains relevant for understanding user adoption of emerging technologies that have potential to enhance quality of life such as personal finance apps and mobile health apps but are not mandatory or essential to daily tasks. Without users’ continued use, these optional technologies would not be able to deliver their primary intended purpose [15]. Hence, studying factors impacting continued use in a context where use is optional and benefits are dependent on the continuation of use is important.
Perceived usefulness represents users’ belief that a technology enhances their performance [1,6]. Perceived usefulness, a key construct in ECM, has been consistently shown to have a significant influence on users’ decisions to continue using technologies [4,16,17,18,19,20,21,22]. Research confirms that perceived usefulness exerts enduring effects on IT continuance, as it constitutes “a long-term, transaction-invariant belief” [6]. Given its critical role, a deeper examination of how users perceive post-adoption usefulness is necessary to enhance our understanding of IT continuance. McGrenere and Ho [23]’s conceptualization of usefulness provides valuable insight, suggesting that “the usefulness of a design is determined by what the design affords (that is, the possibilities for action in the design) and whether these affordances match the goals of the user and allow the necessary work to be accomplished” (p. 6). This perspective aligns with the Strong–Volkoff [
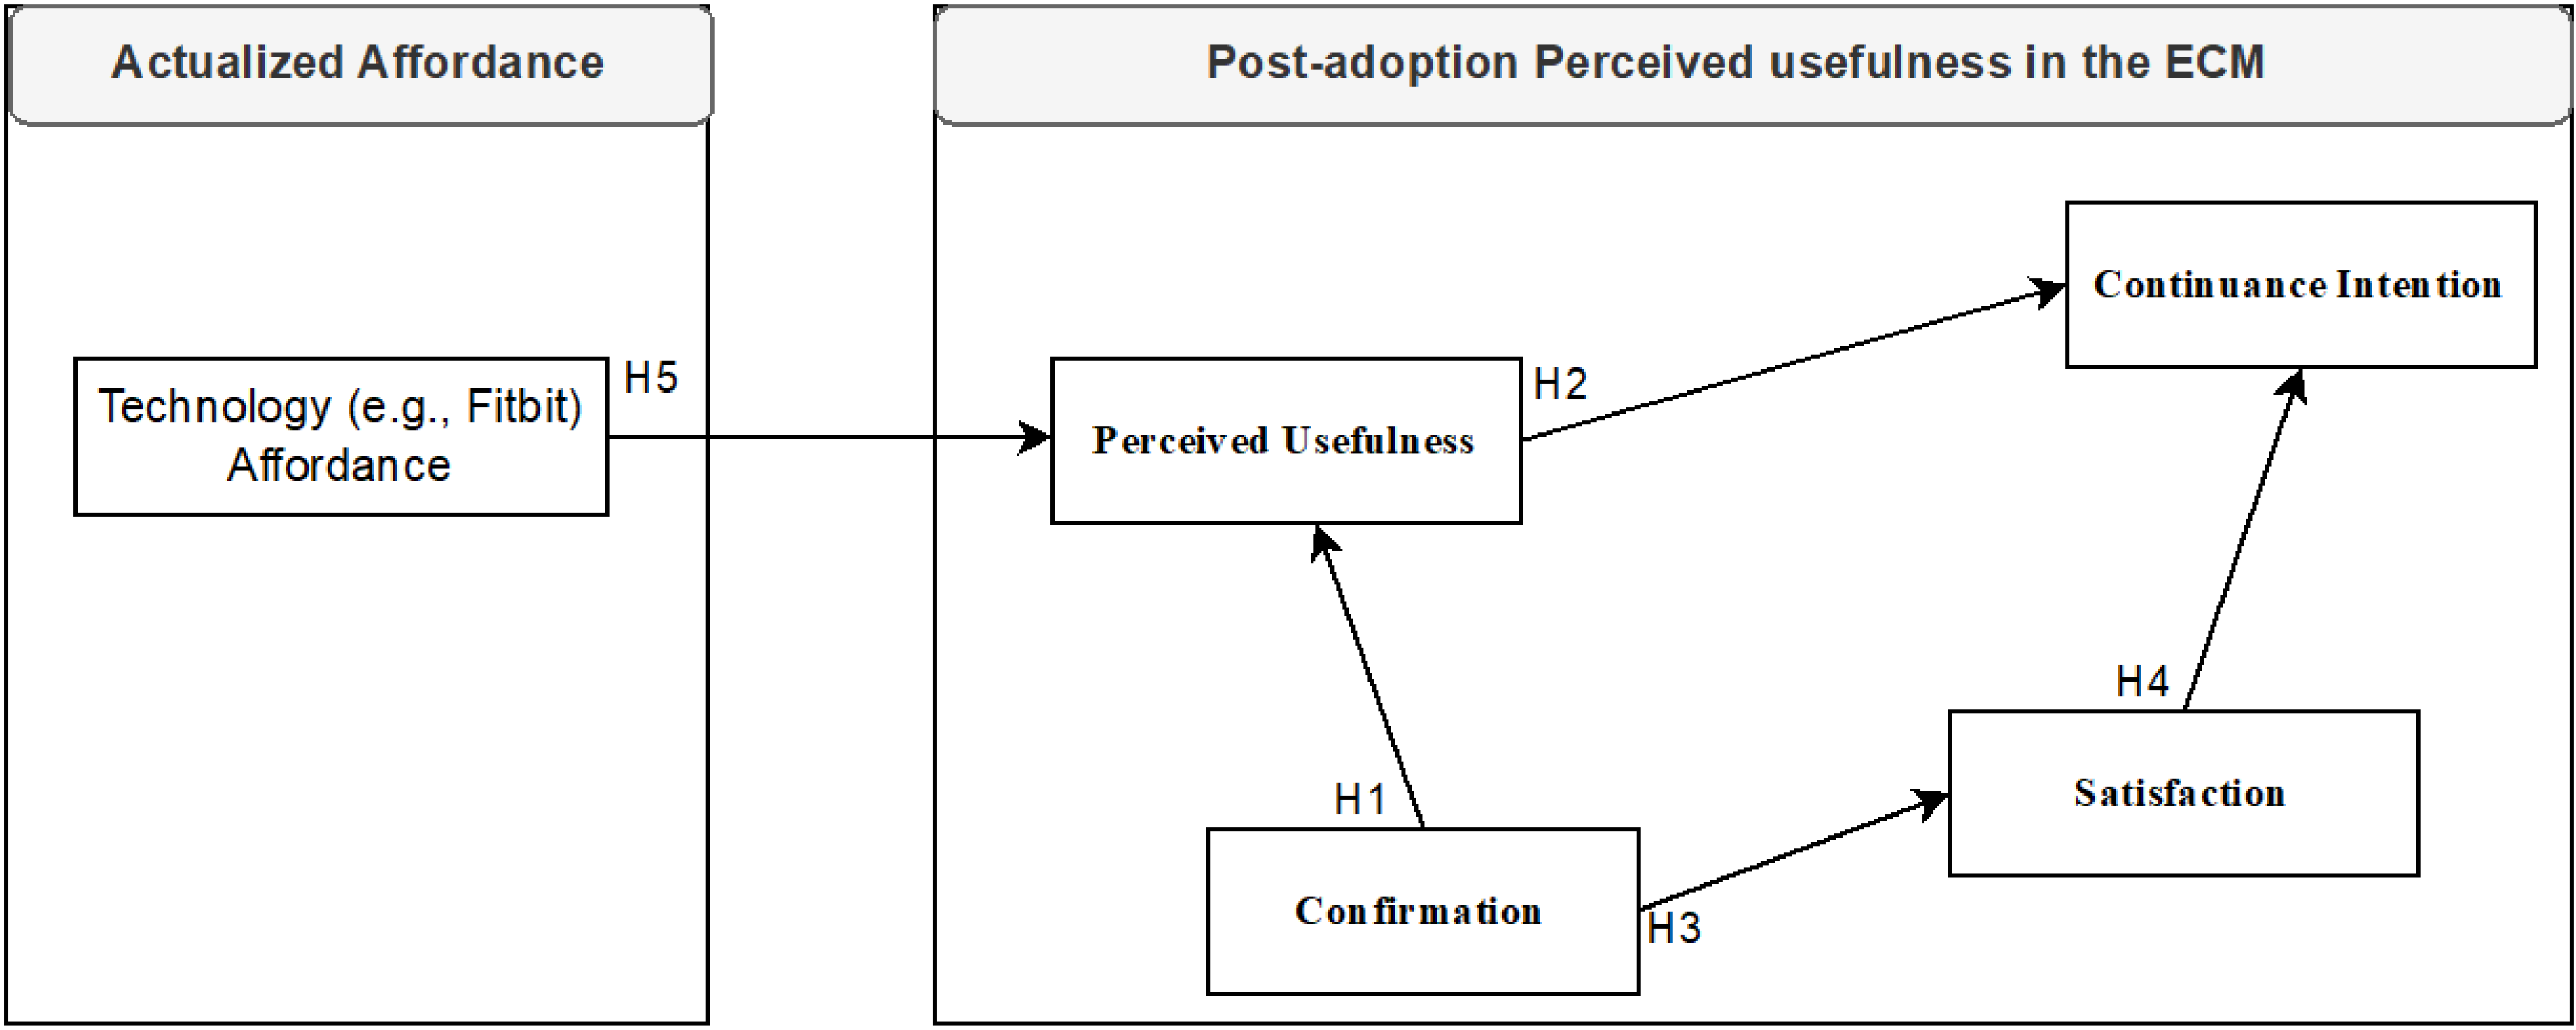
24] framework, where affordances emerge from both (1) potentials for action within the technology and (2) users’ actualization of those potentials through their interactions with the technology.
During post-adoption, Bhattacherjee [6] distinguishes user expectations from their confirmation, arguing that users may feel tension when their pre-adoption perceptions have not been met. Users may then adjust their usefulness perceptions to align with reality, with confirmation elevating perceived usefulness and disconfirmation reducing it. Thus, the confirmation of expectations influences users’ perception of the technology’s usefulness because it transforms users’ expectations into reality. We argue that, during post-adoption, actualized affordances represent what the technology can offer to users based on their goals and hence explain their perception of usefulness.
In the post-adoption phase, the relationship between expectation confirmation and perceived usefulness is broader than that between actualized affordances and perceived usefulness. Originating from consumers’ post-purchase evaluations of expectation–experience discrepancies [25,26], expectation confirmation operates at multiple levels, assessing IT attributes (e.g., system design and usability) and user attributes (e.g., personal benefits and attitudes) [1,6,27,28,29]. In contrast, actualized affordances focus narrowly on how users utilize the technology to achieve specific goals [24]. Thus, while expectation confirmation reflects overarching drivers of post-adoption perceived usefulness, affordance actualization demonstrates its concrete, task-level operationalization, highlighting the distinction between broad evaluative judgments and goal-directed utility in practice. Addressing how technology affordances, beyond mere forms and functions, influence IT continuance represents a critical gap in the literature, as highlighted by Yan and Filieri [13]. This study advances ECM by incorporating affordance actualization to explain how users come to perceive a technology as useful in the post-adoption phase, a nuance that is overlooked by prior ECM-focused research. These insights lead to our research questions: How does actualization of technology affordances influence perceptions of usefulness and hence continuance intention?
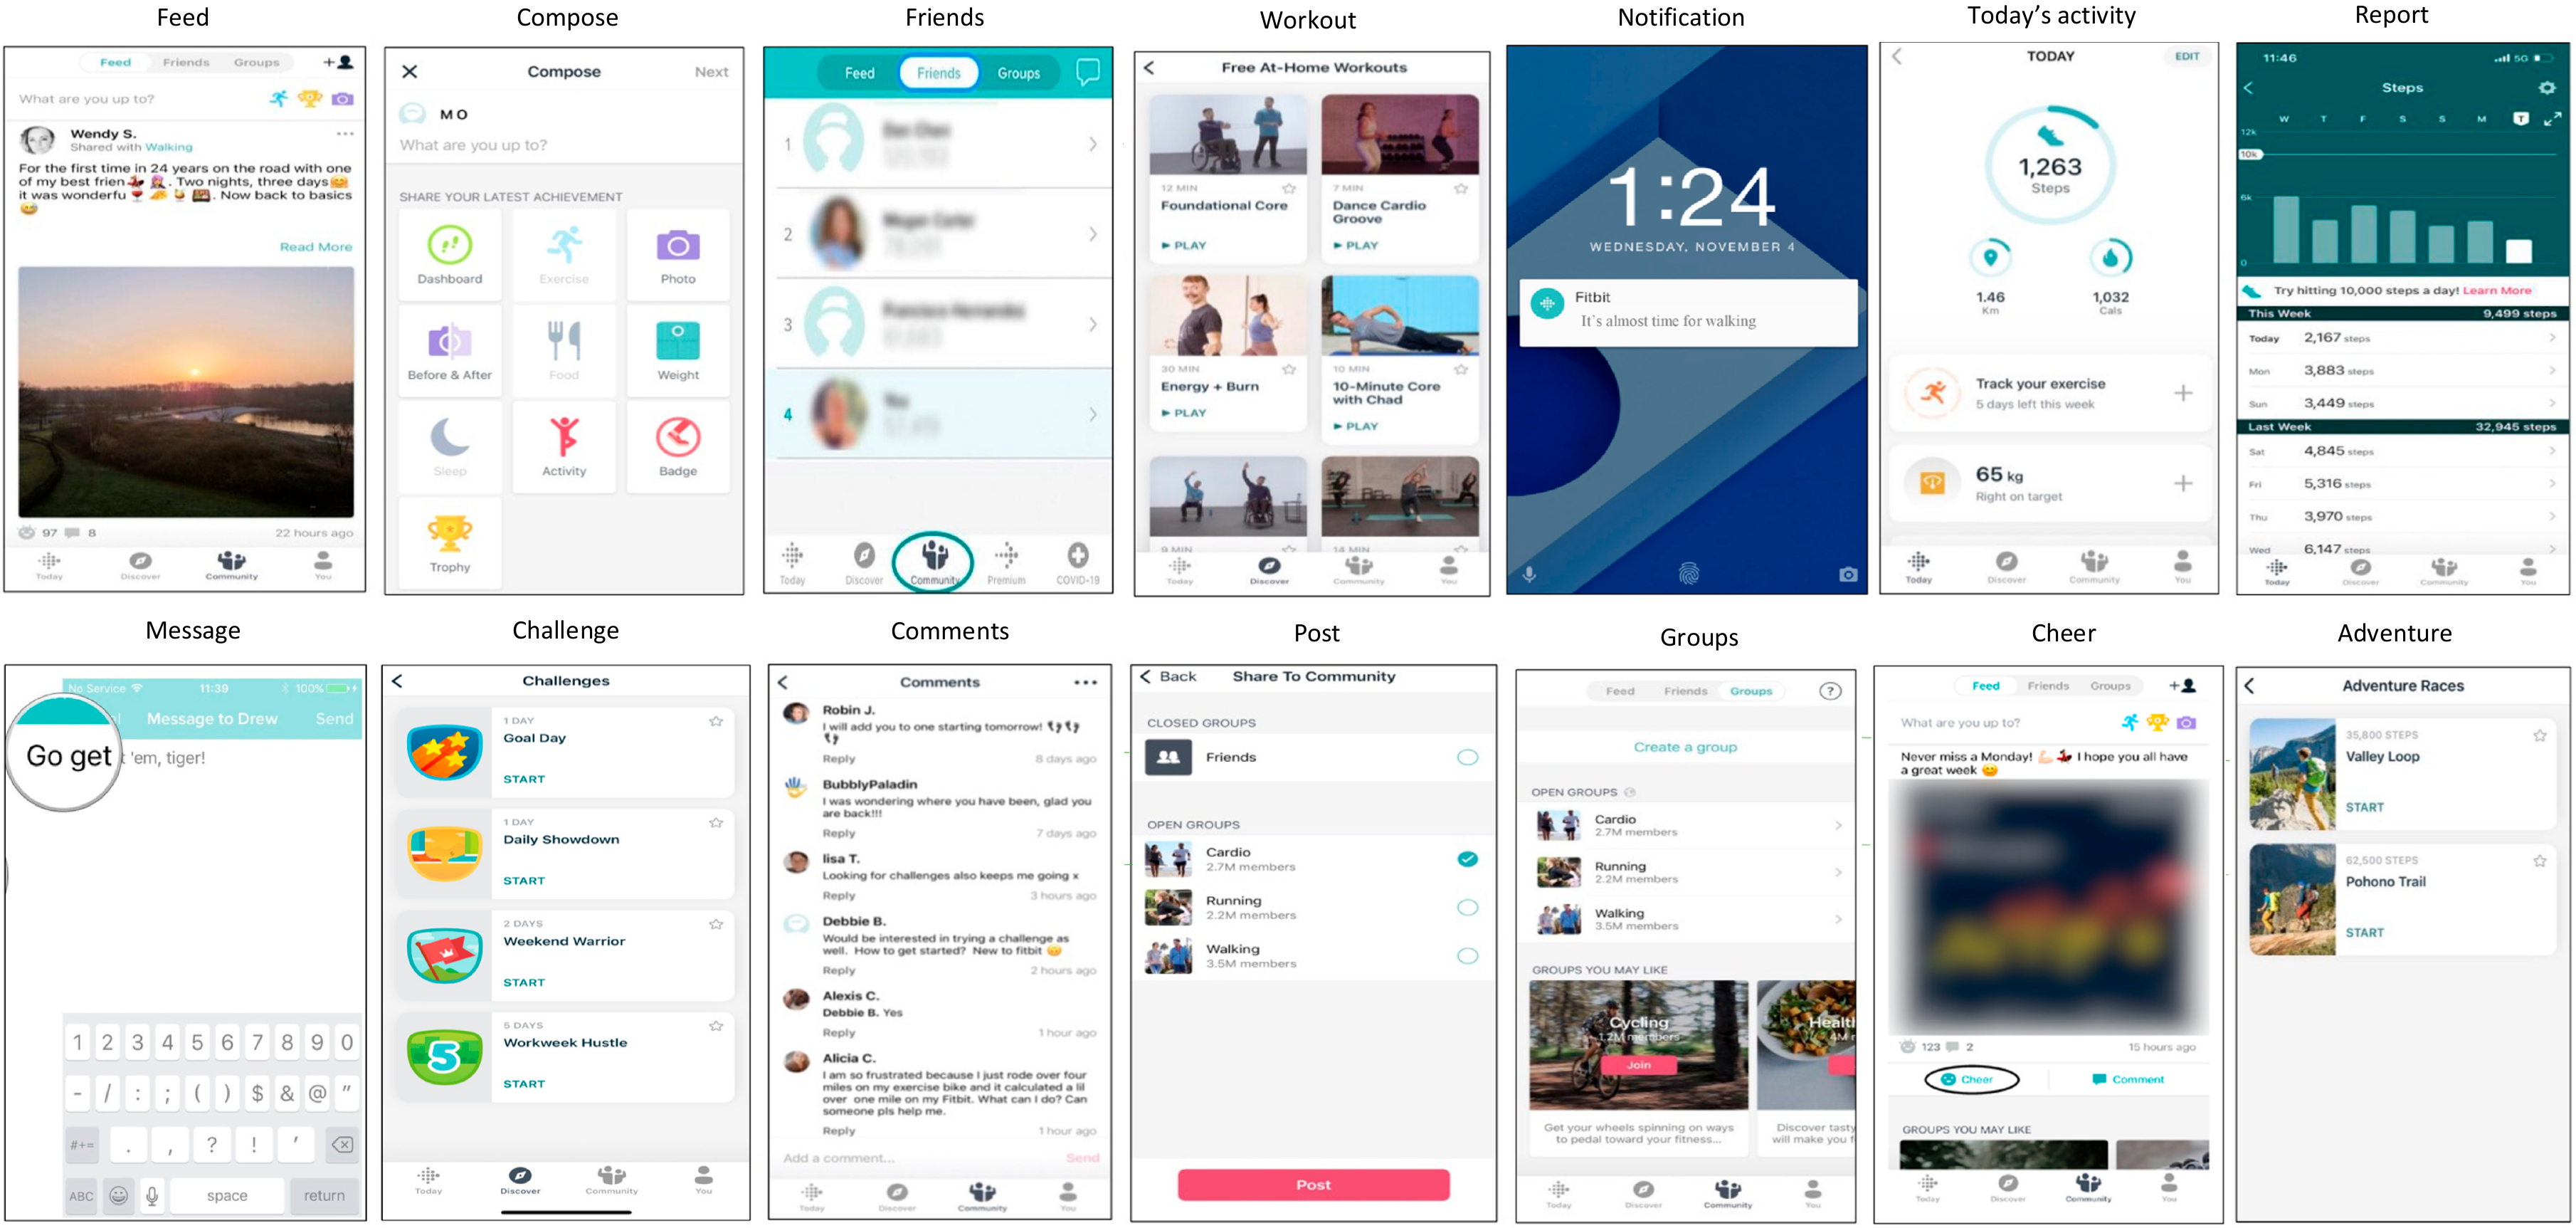
This study seeks to address its research question within the context of fitness apps. Specifically, it explores how users of fitness apps perceive their usefulness through actualizing the apps’ affordances, leading them to continue using the apps. Fitness apps, like Fitbit, offer personalized activity guidance, reports, and a supportive community to enhance exercise efficiency and health awareness [15,30]. Despite being the most downloaded health apps in the US [31], with 17 million active users in 2021 [32] and a projected market of USD 14.64 billion by 2027 [33,34], fitness apps’ success hinges on sustained user engagement facilitated by continued use. Many users abandon these apps shortly after downloading or within months [35,36], making them an ideal case for studying the post-adoption perceived usefulness phenomenon in IT.

2. Background

2.1. The Expectation–Confirmation Model (ECM)

The Expectation–Confirmation Model (ECM) was created by Bhattacherjee [6] to address factors impacting users’ intentions to continue using an IT artifact. The ECM was developed based on a well-known consumer behavior theory, expectation–confirmation theory (ECT), which illustrates the process in which consumers decide to buy and rebuy a product (good or service) [25]. Expectation–confirmation theory (ECT) holds that consumers’ repeated purchase decisions are driven by their satisfaction with a product [25]. Consumers’ satisfaction is influenced by their prior use expectation regarding the product and their perception of its performance. Higher expectations about a product will require higher performance to achieve consumers’ satisfaction, while lower expectations will require lower performance [25]. When consumers’ expectations are met by their perception regarding a product and its performance, confirmation of what was expected will be established [25]. This confirmation will increase users’ satisfaction with the product and hence lead them to repeat their purchases. However, when consumers’ expectations are too low, they may not use the product at all [25].
Bhattacherjee [6] argued that, like consumers’ repeated purchasing decisions, IT users’ continuance intention is influenced by the degree of perceived usefulness and satisfaction users experience while using the information technology. At the same time, the degrees of perceived usefulness and satisfaction are influenced by users’ confirmation of their expectations. However, Bhattacherjee [6] disagreed with the argument from ECT that users’ prior use expectation affects their confirmation. Instead, he argues that users’ confirmation can be determined only after the use of IT artifacts. He argues, contrary to the proposal of ECT, which works on typical consumer products, that the influence of users’ expectations on their confirmation before they start using a product cannot be predicted in technology usage due to the frequent updates and changes in technology design [6].
Later, Bhattacherjee and Perols [1] updated the model, revising it and adding several arguments. First, they dropped the direct association between perceived usefulness and satisfaction [1]. Bhattacherjee and Perols [1] argue that the relationship between perceived usefulness and satisfaction in the original ECM is not straightforward. They argue that we cannot be certain which causes the other to occur (between usefulness and satisfaction). In the original ECM, Bhattacherjee [6] related satisfaction to attitude and proposed that satisfaction might mediate the association between post-adoption usefulness beliefs and continuance intentions, just as attitude mediates the association between beliefs and intention in the Theory of Reasoned Action (TRA) [37] and the Theory of Planned Behavior (TPB) [38]. In the updated ECM, Bhattacherjee and Perols [1] argue that satisfaction and attitude differ because satisfaction is a transaction-specific short-term effect based on the directly preceding usage experience, while attitude is a long-term, transaction-invariant effect probably accumulated from frequent previous transactional experiences. Bhattacherjee and Perols [1] added that satisfaction might influence attitude but does not equal attitude, as suggested in the original ECM [6]. Thus, Bhattacherjee and Perols [1] stopped positing a relationship between usefulness and satisfaction in the updated model and presented them as having separable effects on IT continuance intention. Consistent with the Bhattacherjee and Perols [1] updated model, which established usefulness and satisfaction as independent (rather than correlated) antecedents of continuance intention, we maintain this conceptual distinction in our study’s theoretical framework.
The ECM has been adopted widely in IS research aiming to understand users’ continuing usage behavior in various technology contexts, such as e-learning [17,39,40,41], mobile advertising [42], electronic commerce [43,44], wearable devices [45], mHealth and fitness apps [20,35], and financial management software [46]. These studies have confirmed the validity of the ECM variables in explaining users’ continued use of various technologies. This study will examine the ECM, focusing on a well-known fitness app, Fitbit. Based on the evidence provided in the literature [17,43,44], we posit that the ECM will continue to explain the variation in IT continuance behavior among users of fitness apps. We propose to test the following hypotheses to confirm this claim:
H1: 
Users’ extent of confirmation is positively associated with their perception of the usefulness of fitness apps.
H2: 
Users’ perception of the usefulness of fitness apps is positively associated with their continuance intentions toward using fitness apps.
H3: 
Users’ extent of confirmation is positively associated with their satisfaction with their use of fitness apps.
H4: 
Users’ level of satisfaction with their initial use of fitness apps is positively associated with their continuance intentions toward using fitness apps.

2.2. Factors Impacting Post-Adoption Perceived Usefulness

Uncovering how users perceive usefulness is necessary to enhance our understanding of users’ continued use phenomena. While the ECM has been found useful for understanding core factors impacting users’ continued use of technologies, studies have also found other variables that could affect the ECM [13,14,20,21,27,36,47,48,49,50]. Among these, studies have identified several factors influencing post-adoption perceived usefulness. These include ease of use [16,17,20,21,22], attitude [17], task–technology fit [22], site quality [19], reputation [22], social recognition [22], individual–technology fit [22], technology visibility and accessibility [22], social influence [22], personality traits [36], cognitive absorption [51], and trust [18,19]. While these factors influence users’ evaluations of a technology’s usefulness, they do not formatively explain what usefulness means to users. In other words, they do not clarify what makes a technology useful for users.

2.3. Perceived Usefulness and Affordance Theory

Perceived usefulness has been empirically established as the most robust predictor of technology adoption intentions [52] and remains equally critical in IS continuance contexts [6]. Originally defined by Davis (1989) as the degree to which users believe a system will enhance their job performance, this construct has been conceptually linked to relative advantage [53], job fit [54], outcome expectations [55,56], and perceived efficiency and effectiveness [57]. These convergent conceptualizations collectively position perceived usefulness as users’ assessment of an information system’s capacity to improve work performance and productivity, forming a fundamental determinant of both initial adoption and sustained usage behaviors. Correspondingly, Gibson [58] developed affordance theory to explain how an object such as a chair becomes useful to humans. In other words, how a chair offers or affords sitting. Gibson [58] explains that an object is not useful or does not afford anything other than those things an individual perceives it to afford. For example, a chair is an assembly of wood or metal unless an individual perceives that it affords sitting [58]. Therefore, the same chair could afford another individual standing or holding clothes based on what the individual perceives it to afford, or in other words, to be useful for. Thus, what an object affords an individual makes that object useful to that individual.
McGrenere and Ho [23] explained that the utility of a design depends on the opportunities it provides (i.e., the potential actions within the design) and whether these opportunities align with the user’s goals, enabling them to successfully complete the required tasks. Leonardi [59] underscored that individuals engage with an object only after perceiving its purpose, stating that “people do not interact with an object before or without perceiving what the object is good for” (p. 153). Thus, perceiving an object’s affordance(s) that comes prior to users’ interaction will expose the expected usefulness of that object to that particular user or users.

2.4. Post-Adoption Perceived Usefulness and Actualized Affordance

Perceiving the affordances of an object could disclose its expected usefulness to users. However, putting these potential affordances into action ensures that users actually receive such usefulness. According to the cognitive dissonance theory developed by Festinger [60], an individual experiences discomfort or tension when they hold two or more contradictory beliefs, attitudes, or values, or when their behavior conflicts with their beliefs. Humans strive for internal consistency, and when there is inconsistency or dissonance, they are motivated to reduce this discomfort. This indicates that there could be a variation between human perception before and after their behaviors.
Bhattacherjee [6] applied this logic to IT adoption to distinguish between user expectations before and after the use when users start to confirm or disconfirm their expectations. Bhattacherjee [6] posits that users may experience uncertainty when initial perceptions of usefulness influencing acceptance are contradicted during actual use. As a result, users may recalibrate their perceptions to align with reality, where confirmation enhances perceived usefulness, and disconfirmation diminishes it. Thus, we conclude that perceiving IT usefulness before interacting with it differs from after the interaction.
On the affordance theory side, Gibson [61] explains, “The observer may or may not perceive or attend to the affordance, according to his needs, but the affordance, being invariant, is always there to be perceived” (p. 139). While individuals need to perceive the affordance to realize its existence, their actualization experience would differ from what they perceived. Therefore, Strong and Volkoff [24] distinguished affordances as “potentials for action (in which form they have a degree of durability) and actualization as actions taken by individuals to realize those potentials.” Strong and Volkoff [24] explain actualization as “the actions taken by actors as they take advantage of one or more affordances through their use of technology” (p. 15). They also outline three factors, namely, the abilities and preferences of the individual, features of the system, and characteristics of the work environment that concurrently facilitate an individual’s affordance actualization [24].
Based on these arguments, we argue that perceiving a technology’s usefulness before actualizing its affordances can explain its usefulness in terms of possibility, while perceiving the technology’s usefulness after actualizing its affordances can explain its usefulness in terms of reality. While the possibility could lead to reality, the reality might be different than expected during the possibility, influenced by the abilities and preferences of the individual, features of the system, and characteristics of the work environment. The first usefulness can be explained by users before they interact with IT (when they have the action potential). In contrast, the other usefulness can be explained by users when they have already interacted with it, as is the case in this study.
We illustrate the relationship between affordance actualization and post-adoption perceived usefulness by uncovering how actualizing technology affordances could lead to perceived usefulness of a technology in the form of a fitness app. Fitness app studies have revealed various affordances, such as exercise guidance and competing with others, when investigating user engagement with them [62,63,64,65,66].
Technology (e.g., fitness app like Fitbit) affordances will lead to user perceptions of post-adoption usefulness only when users interact with the features and actualize its affordances. Therefore, the affordances that will be actualized by users, rather than just being present as features, are what lead to possible post-adoption usefulness. Figure 1 portrays the relationship of actualized affordances to the concept of usefulness in the post-adoption model. This leads to the following hypothesis and the research model shown in Figure 1:
H5: 
Actualizing the technology affordance positively influences users’ perception of an app’s usefulness.

2.5. Technology Features and Their Role in the Actualization of Affordances

According to Markus and Silver [67], affordances are not inherent features of technology; instead, they can be facilitated by certain technological features. For instance, Karahanna and Xu [68] found that users interact with Facebook features, such as updating their geographic locations and sharing personal photos, in order to present themselves to others. This interaction exemplifies how these features can create affordances.
The phenomenon of separating an object from its features has been posited by Heidegger [69], with a similar but wider view of the affordance. He argued that a piece of equipment’s features can be identified only by the way it is used. For example, a hammer is a hammer not because it is created with a wooden shank and a metal head but because it can drive nails into a wall or a piece of wood. Heidegger [69] also argued that it is essential to look at an object’s features because they lead users to accomplish an intended task. For example, a hammer can come in various shapes, colors, and weights, and is used by carpenters with varied hand shapes and muscles to drive nails into a wall. If the hammer is too cumbersome for the carpenter, the affordance of driving nails into a wall may not be actualized. Thus, users interact with an object’s features directly, aiming to reach their goals in using the object. Burton-Jones and Straub Jr [70] defined IT use as “a user’s employment of one or more features of a system to perform a task” (p. 231). Similarly, users interact with various fitness app features, seeking to actualize what the apps could afford them. Since it is important to uncover fitness app affordances, it is also important to uncover the features used to reach each affordance.
Thus, fitness app features can be used to actualize app affordances. To identify which features are used to actualize these affordances, we need to look at the features that users engage with. Technology features act as a bridge that allows users to access the app’s affordances. Therefore, this research also aims to discover which Fitbit features are utilized to actualize specific affordances.

2.6. Extending ECM Through Affordance Actualization

Despite the extensive use of the ECM in information systems research, prior studies have largely treated perceived usefulness as a dependent variable influenced by antecedents such as ease of use, trust, or individual traits, without fully exploring how users come to perceive a technology as useful through interaction. This study addresses this gap by integrating affordance actualization theory with the ECM to explain the mechanisms underlying post-adoption perceived usefulness. This integration is distinctive in that it shifts the focus from static predictors to a dynamic, interaction-centered perspective, where users’ actualization of affordances through specific feature usage gives rise to their perceived usefulness. In doing so, this study offers a novel sociotechnical lens for understanding IT continuance, one that accounts for user goals, system features, and contextual conditions as co-constructors of usefulness, thereby extending ECM theory into the realm of affordance-based user–system interaction.

3. Methodology

A survey was developed to uncover the features used to actualize affordances and the impact of user actualized affordances on the perception of an app’s post-adoption usefulness. The instrument includes measures adopted from the literature for existing constructs and new measures for the actualization of affordances by means of app features. We selected the most downloaded fitness app, Fitbit [71], and recruited Fitbit users as participants. We first evaluated the survey in a pilot study to examine the reliability and validity of the measurement items. Data for the pilot were collected through a local subject pool at a university and social media platforms Facebook and Reddit. Data for the main study were collected through Prolific crowdsourcing. Both studies received Institutional Review Board (IRB) approval from a US university, following ethical guidelines for research. We used SmartPLS 4.0.9.6, an application for covariance-based structural equation modeling (CB-SEM), to analyze the data.

3.1. Measurement of Constructs

Survey Items for Features Used

To uncover the relationship between Fitbit app features and fitness app affordances, we developed measures to determine whether a feature was used to actualize an affordance. In the survey, we displayed screenshots of each Fitbit app feature (as shown in Figure 2) and asked participants to rate each feature’s usefulness on a five-point Likert scale, ranging from not at all useful (1) to extremely useful (5). We also provided a never used it option (6) to identify participants who had not used a feature. Participants who selected 1 to 5 on the usefulness scale were directed to the next question measuring the affordance actualizations for each feature. This follow-up question provided participants with a list of all known fitness app affordances (as shown in Table 1) and asked them to select all affordances for which they used the feature shown. Affordances were presented with short definitions taken from the original studies [64,65].

3.2. Survey Items for Actualized Affordance Influence on ECM Usefulness

To uncover actualized affordance influence on ECM usefulness, we adopted measures and scales from previous studies that referred to the ECM [35] and the fitness app affordances [64,65]. The survey instrument consisted of seven sections: (1) Fitbit usage status, (2) continuance intention [35], (3) satisfaction [35], (4) perceived usefulness [35], (5) confirmation [35], (6) eleven fitness app affordances (four items for each affordance) [64,65], and (7) demographic information. Items, shown in Appendix A, were measured on a five-point Likert scale with relevant anchors.

3.3. Pilot Study

We conducted a pilot study via Qualtrics to test the reliability and validity of our measurement items. Participants were recruited through the university’s Sona system and social media (Facebook and Reddit), targeting current and former Fitbit users. The Sona system invited adult students (18+) who used Fitbit to participate in exchange for half a course credit. On social media, the first author posted the invitation in Fitbit-related groups, offering a raffle for ten USD 10 prizes. This study, approved by the university IRB, began with a consent form outlining its purpose and procedures. We received 403 responses. After excluding participants who did not complete the survey (n = 82), never used Fitbit (n = 6), failed attention checks (n = 157), finished too quickly (n = 35), or gave straight-line responses (n = 42), we had 81 valid responses. Reliability (Cronbach’s α ≥ 0.70), convergent, and discriminant validity were supported [72]. Participants’ responses also confirmed that key app features matched intended affordances (e.g., activity tracking linked to updating affordances).

3.4. Participants and Procedure

The main study was conducted via Qualtrics, targeting a larger sample size based on Gaskin’s [73] formula: 50 + 5x (where x is the number of survey items), to ensure sufficient power for SEM analyses. We targeted 500 adult U.S.-based Fitbit app users. Recruitment was performed through Prolific, a crowdsourcing platform known for high-quality data [74]. A prescreening survey of 1300 participants (USD 0.18 incentive) identified 622 current Fitbit users engaging in exercise. These users were invited to the main survey (USD 6 incentive), and 506 completed it. After removing 64 who failed attention checks, 442 valid responses remained. The sample was balanced by gender (50% male, 48% female, 2% trans/nonbinary), with most aged 25–44 (64%), white (81%), and employed (84%). All were current Fitbit users; 96% had used it for over 4 months, 80% had premium subscriptions, and 96% used it at least twice weekly. See Appendix B for additional descriptive statistics related to the sample.

4. Data Analysis

We used the Qualtrics data and analysis tab that enables filtering, classifying, merging, cleaning, and statistically analyzing the response data to investigate participant ratings of the usefulness of each Fitbit feature and the purposes for which participants utilized each feature. Although the survey included items for 11 affordances, only the most actualized affordance was included in the final SEM analysis to minimize model complexity and reflect dominant user behavior to help us understand how the actualized affordance influences users’ perceived usefulness. The most actualized affordance was determined based on the most common purpose for use selected by the users.
Next, the study data were analyzed using covariance-based structural equation modeling (CB-SEM), a robust method for examining and quantifying relationships between variables, particularly in complex models like the one employed in this study [75]. To implement SEM, we followed the two-step approach outlined by Anderson and Gerbing [75]. The initial step involved evaluating the reliability and validity of the measurement scales to ensure the robustness of the measurement instruments. To that end, we employed confirmatory factor analysis (CFA) using maximum likelihood (ML) estimation to evaluate reliability and convergent and discriminant validity. We examined factor loadings, Cronbach’s alpha, average variance extracted (AVE), and the Heterotrait–Monotrait (HTMT) ratio of correlations for discriminant validity, and the variance inflation factor (VIF) for multicollinearity. Following the scale reliability and validity assessments, we tested the model fit. This involved assessing the appropriateness of the measurement model using various indices, including the comparative fit index (CFI), the Tucker and Lewis index (TLI), the root mean square error of approximation (RMSEA), and Mardia’s multivariate normality test.

5. Results

5.1. Fitness Feature Usefulness Ratings

To uncover the usefulness of each feature, we split the rating results into two categories: useful and useless. The useful category includes ratings of the feature as extremely useful, very useful, and moderately useful. The useless category includes ratings of the feature as slightly useful, not at all useful, and never used it. Participants’ responses regarding the usefulness of Fitbit features are presented in Table 2. These results unveiled variations in the perceived usefulness of different features. For example, features such as today’s activity and report were identified as useful by more than 95% of the respondents. On the other hand, features such as adventure, comments, post, message, and feed were determined as useful by less than 25% of the respondents. These findings reveal that levels of usefulness attributed to various Fitbit features by the study participants vary drastically.

5.2. Fitbit Features Used to Actualize Identified App Affordances

To determine the purposes for which participants utilized Fitbit features, a subset of participants who had not rated features as never used it in the usefulness rating questions were asked to provide further details regarding their usage of the app. The results were subsequently narrowed down to the top five affordances with the highest occurrence. These represent the affordances that participants most frequently reported associating with a specific feature. The results connected each feature with some affordances shared by the majority of participants. Some features provided users with similar affordances. For example, today’s activity and report features afforded most participants updates on exercise status and reminded them to exercise. Some features were actualized by fewer participants. For example, comments afforded few users encouragement and recognition of their exercise achievement. This indicates the relative importance of designed features and shows that some features are less important than others based on the goals of the users. Participants’ responses regarding the purposes for which they used each feature are presented in Table 2.

5.3. The Measurement Model

We assessed the measurement model’s reliability and validity using SmartPLS 4 through confirmatory factor analysis. The model included all ECM variables and the updating affordance, the most actualized affordance. Internal reliability, convergent, and discriminant validity, outer loadings, multicollinearity, and model fit were examined.
As shown in Table 3, all constructs had Cronbach’s Alpha values above 0.7 and AVEs above 0.6, indicating strong internal consistency and convergent validity [72]. Most item loadings exceeded 0.7; one ranged from 0.6 to 0.7, which was acceptable given strong reliability and AVE scores, so all items were retained. As shown in Table 4, discriminant validity, assessed via HTMT, was satisfactory for all constructs (HTMT < 0.90) [76]. Multicollinearity occurs when predictor variables are highly correlated, potentially distorting the estimated relationships in a regression model. As shown in Table 5, multicollinearity was assessed using the variance inflation factor (VIF). All VIF values were below the commonly accepted threshold of 5, with most falling under 3, suggesting that multicollinearity was not a threat to the validity of the model estimates [77].
The results showed a CFI with a 0.943 value, a TLI with a 0.930 value, and the RMSEA with a 0.072 value, indicating a good fit [78]. Mardia’s multivariate normality test indicated significant deviations from normality in both skewness and kurtosis (p < 0.001); this is expected given the large sample size (n = 442), which can lead to statistically significant skewness and kurtosis even when the distribution is reasonably close to normal [79]. Thus, to examine the hypotheses, we conducted bootstrapping (5000 samples) to obtain robust standard errors and confidence intervals for the path estimates using SmartPLS 4.

5.4. Hypothesis Testing

The model was initially tested by calculating the coefficient of determination R2 and path analysis to uncover the relationship between the model variables. The R2 values provide insights into the amount of variance explained by the independent variables in the model. As shown in Figure 3, the R2 value for continuance intention was 0.436, indicating that approximately 43% of the variance in continuance intention could be explained by the variables included in the model. Perceived usefulness has an R2 value of 0.546, suggesting that around 54% of the variance in perceived usefulness could be accounted for by the confirmation and actualized affordances. Satisfaction has an R2 value of 0.386, suggesting that around 38% of the variance in satisfaction can be explained by confirmation. These values suggest that the included variables collectively explain a reasonable amount of the variance in these respective constructs.
Path coefficients were estimated using CB-SEM with maximum likelihood estimation. To address concerns about non-normality, we conducted bias-corrected bootstrapping (5000 samples). All hypothesized relationships from the original ECM were significant. For instance, confirmation significantly influenced perceived usefulness (β = 0.508, p < 0.001) and satisfaction (β = 0.445, p < 0.001). Perceived usefulness and satisfaction both positively impacted continuance intention (β = 0.300, p < 0.001; β = 0.396, p < 0.001, respectively). We also discovered that updating affordance also had a significant effect on perceived usefulness (β = 0.232, p < 0.001), confirming our new hypothesis. The results are presented in Table 6.
Mediation effects were assessed using bias-corrected bootstrapping with 5000 resamples. Results indicated that all examined indirect paths were statistically significant, as none of the confidence intervals included zero. Specifically, perceived usefulness significantly mediated the relationship between updating affordance and continuance intention (β = 0.070, p = 0.001). In addition, both satisfaction (β = 0.176, p < 0.001) and perceived usefulness (β = 0.153, p < 0.001) significantly mediated the effect of confirmation on continuance intention. The mediation results are presented in Table 7.

6. Discussion

Given its role in confirming the value of systems and applications, IS researchers have investigated post-adoption behaviors like the continuation of technology use, with perceived usefulness defined as the most salient post-adoption attitude related to IT continuance [1]. Research on IT continuance has investigated how factors such as ease of use [16,17,20,21,22], trust [18,19], attitude [17], and site quality [19] influence post-adoption perceived usefulness. While these factors contribute to shaping users’ perceptions of technology usefulness, they do not fully explain the mechanisms through which these perceptions emerge.
Drawing on affordance actualization theory [23,24,67], this study argues that post-adoption perceived usefulness is directly influenced by the actualization of affordances through the use of technology features. In other words, the extent to which users perceive a technology as useful depends on the affordances they actualize when interacting with its features. This perspective offers a more nuanced understanding of IT continuance, moving beyond forms and functions to consider how perceived usefulness emerges from user–system interactions [13]. By adopting a systemic lens, this study underscores the importance of understanding user behavior as an outcome of interrelated components, users with varying goals and technology features with diverse functionalities, working within a coherent sociotechnical system to shape technology affordances.
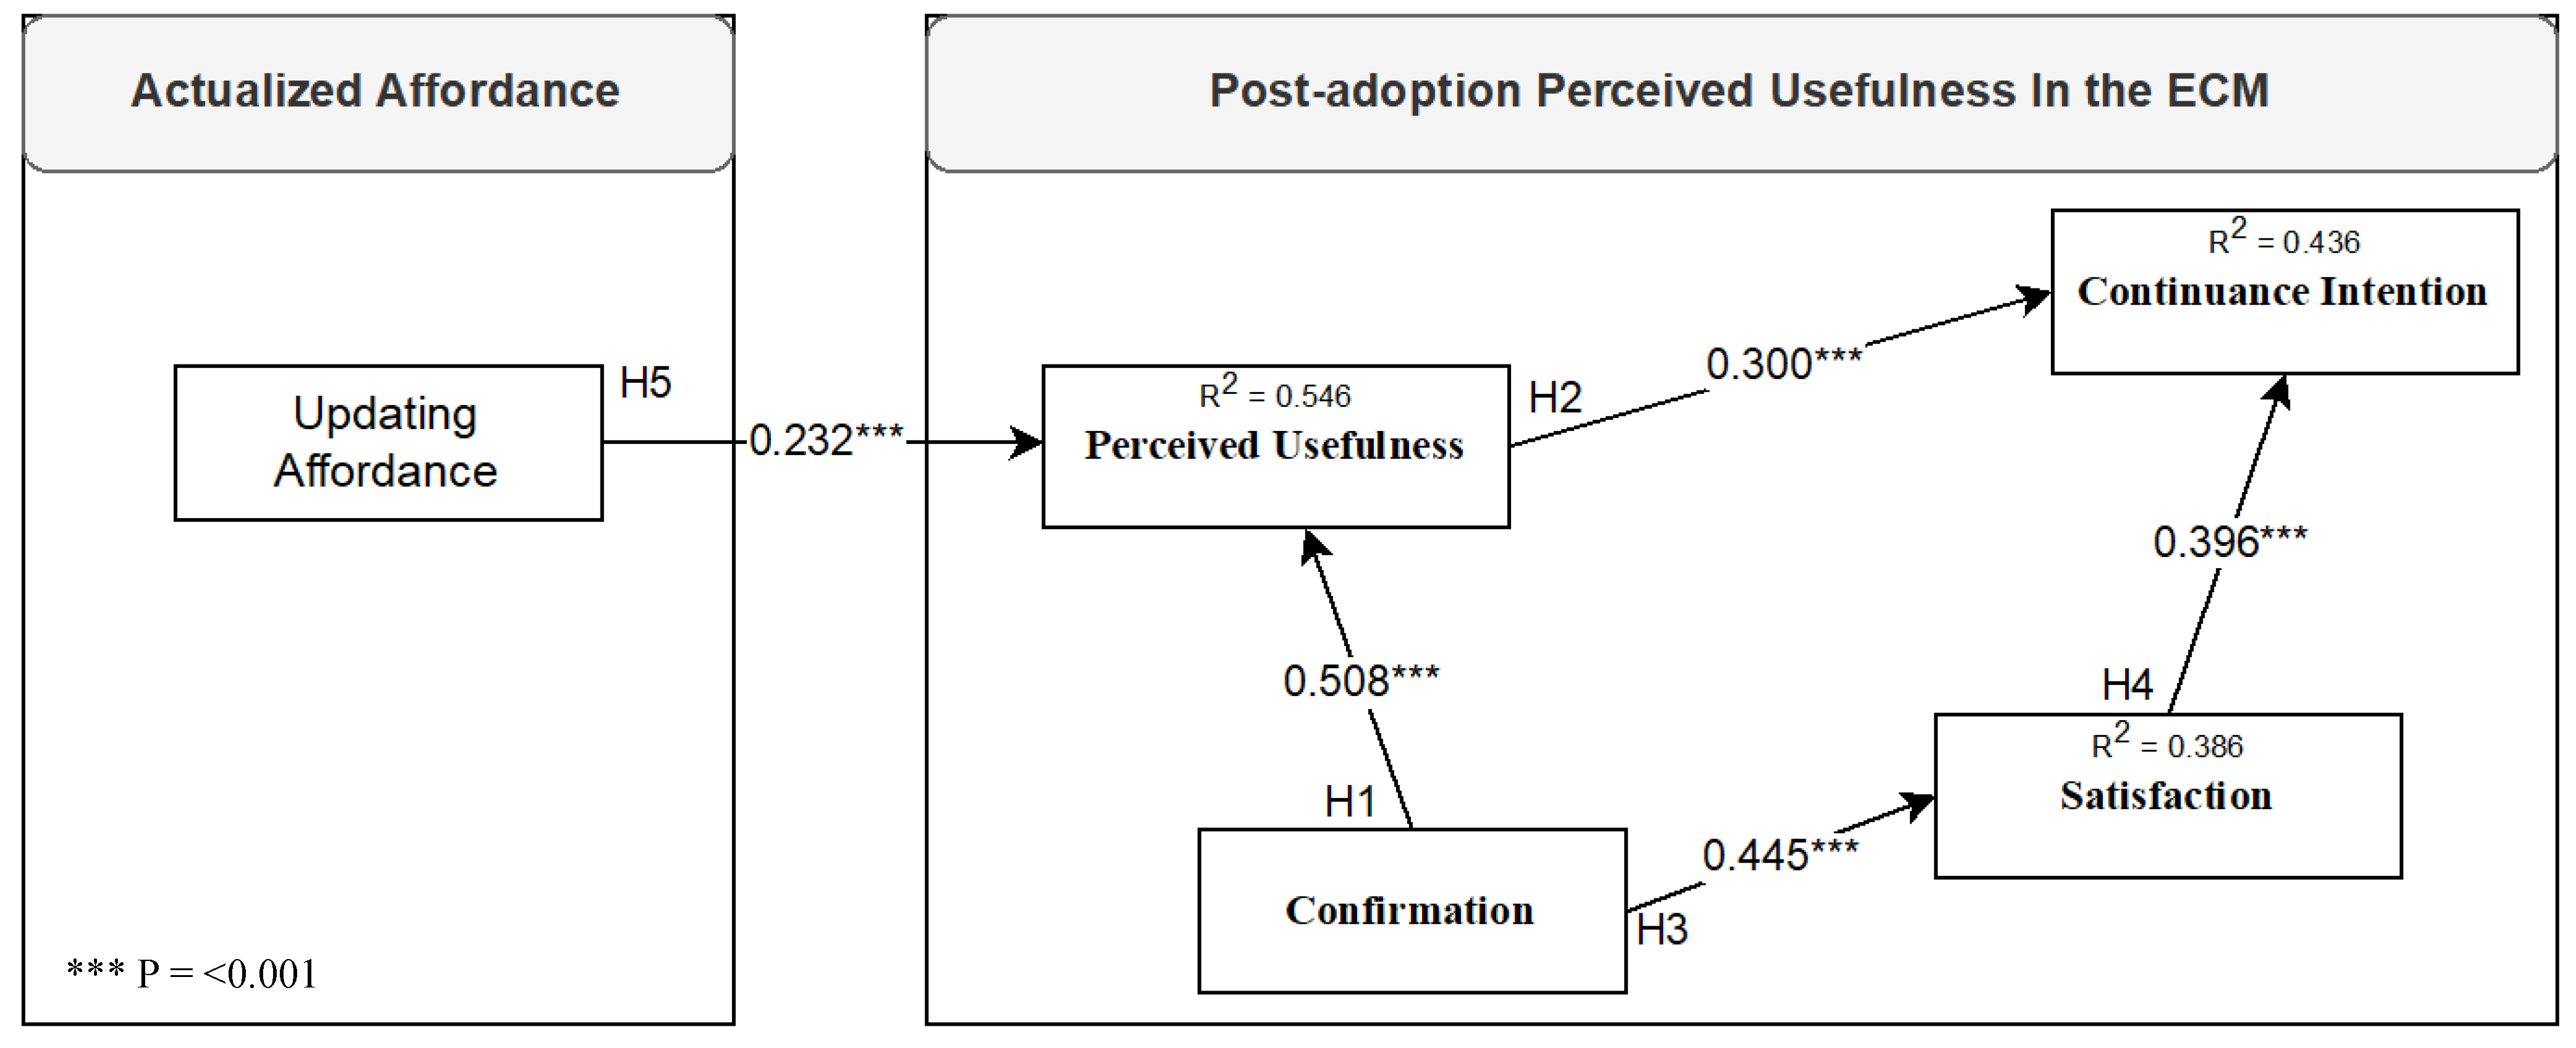
This study examined Fitbit users’ engagement with various features and the affordances they actualized. Our findings highlight that exercise status updating was the most frequently actualized affordance. As a result, the updating affordance was incorporated into the ECM to evaluate its impact on perceived usefulness. The revised model explains approximately 43% of the variance in continuance intention, surpassing the baseline IS continuance model (41%) proposed by Bhattacherjee [6]. This slight increment underscores the importance of actualized affordance (updating) as a key determinant of perceived usefulness.
The model results also explain about 54% of the variance in perceived usefulness shared with the original ECM variable, expectation of confirmation. The expectation of confirmation influence on perceived usefulness is stronger in our model because expectation of confirmation is driven by users’ assessment of all possible IT attributes (e.g., Fitbit design and available support and assistance) that could vary based on users’ attributes (e.g., preference of the design and need for the support and assistance). In contrast, actualized affordances (updating) focus narrowly on how users utilize the technology to achieve specific goals. Furthermore, this study treats actualized affordances as integral to users’ confirmation of expectations rather than as a basis for direct comparison. Users may expect what a technology could possibly afford, along with other expectations. However, these expectations, involved with technology affordance, do not formatively explain perceived usefulness; instead, they only influence it. For instance, technical support for a technology does not inherently explain perceived usefulness, as users do not adopt a technology primarily to receive support. Instead, they use it to fulfill core goals (e.g., to be updated about their exercise status). While technical support may facilitate meeting users’ goals when issues arise, it does not determine the purpose of using a technology and hence its usefulness. Thus, actualized affordances offer a more direct explanation of perceived usefulness, unlike factors such as support expectations, which only indirectly shape it without providing a definitive account. Users hold diverse expectations regarding design and usability, each defined differently, yet none alone explain perceived usefulness.
While previous studies have made important contributions by identifying the broad range of affordances that fitness apps can offer [62,63,64,65,66], they often do not examine the extent to which these affordances are actualized by users. Building on this foundation, our analysis of feature usage patterns reveals that affordance actualization varies across participants. Specifically, our findings suggest that Fitbit’s perceived usefulness and continued usage are primarily shaped by three core affordances: (1) providing most users with updates on their exercise status, (2) reminding a subset of users to stay active, and (3) guiding a smaller group in their exercise routines. These results highlight the value of moving beyond potential affordances to understand which ones are most influential in driving perceived usefulness, offering deeper insights into IT continuance within the fitness app context.
Affordance theory posits that technology design offers possibilities for action, but these must align with user goals to be meaningful [23]. Our study demonstrates that when users actualize the updating affordance, their perception of Fitbit’s usefulness is significantly influenced. By introducing actualized affordance as a critical factor in post-adoption perceived usefulness, this research contributes to the theoretical discourse on IT continuance.
Beyond theoretical implications, these insights offer valuable guidance for technology design. This study underscores the importance of understanding how users actualize affordances through specific features. For instance, updating was primarily actualized through the “Today’s Activity” and “Report” features. This finding suggests that technology designers should explore affordance actualization patterns to identify the key benefits users derive from specific features. Failure to recognize these core advantages may lead to misguided feature enhancements, resulting in redundant or underutilized functionalities.
Moreover, not all features were perceived as useful for exercising. While “Report” and “Today’s Activity” were rated highly, features such as “Adventure,” “Post,” “Comments,” “Feed,” and “Message” were rated lower and rarely used. This suggests that users selectively engage with features that facilitate the actualization of needed affordances. For example, the majority of participants used “Report” and “Today’s Activity” to actualize updating. The observed variability in feature usage also suggests that users have diverse preferences, reinforcing the need for customization options that cater to different needs. From a system design perspective, these findings highlight the importance of affordance-centered feature design. Designers should prioritize the integration and visibility of features that support core user goals, such as updating, while also allowing for personalization and adaptive interfaces that can dynamically surface features aligned with individual usage patterns. In doing so, developers can create more responsive and engaging systems that enhance perceived usefulness and support sustained user engagement.
Overall, this study reinforces the critical role of affordance actualization in shaping perceived usefulness and IT continuance. By identifying which affordances users actualize and through which features, technology designers can develop systems that better align with user needs, ultimately enhancing both adoption and long-term engagement. Future research should explore affordance actualization in other technological contexts to further refine our understanding of IT continuance dynamics.

7. Limitations and Future Research

While both confirmation and affordance actualization operate post-adoption, they reflect distinct mechanisms: confirmation evaluates whether prior expectations were met [6], whereas actualization captures emergent behaviors that shape usefulness perceptions through feature engagement [24]. This suggests that affordance actualization may mediate the link between confirmation and perceived usefulness. This creates a possibility for future research to test with longitudinal behavioral data.
This study examined the impact of affordance actualization on user perceptions of app usefulness, focusing specifically on fitness app affordances that were identified and measured using specific items. However, there are affordances that remain uncovered or that lack measurable items. Future studies can build on the theoretical base of this study to investigate the impact of other affordances on user perceptions of app usefulness. Adding more actualized affordances may increase the variance explained in perceived usefulness. This would contribute to a more comprehensive understanding of the relationship between affordance actualization and user perceptions in the context of fitness apps.
We treated affordances as if they all exist at the same level, implying that users can directly actualize any of them using the app’s features. However, this implication of equality among affordances may not be accurate. Volkoff and Strong [80] elucidated the granularity levels for affordance actualization, proposing that the actualization of one affordance may pave the way for the actualization of another. Our study did not explore whether actualizing one affordance, such as reminding, might lead to the actualization of another, like updating status. So, users might be reminded first, then updated, and vice versa. Further research could examine the sequential processes users undergo that ultimately contribute to the perceived usefulness of the technology.
While this study investigates how users perceive the usefulness of technology through the actualization of affordances, it does not examine how the actualization of different affordances may vary across user groups. For example, younger users might be more inclined to actualize social-related affordances such as “sharing” or “competing,” whereas older users may prioritize features that support tracking and goal-setting. Future research could explore how demographic or psychographic differences influence affordance actualization to better tailor technology design to diverse user needs.
This study focused on Fitbit. However, different fitness apps have distinct designs and feature sets. These variations in technology design can influence perceptions of technology usefulness. Future research could explore a broader range of fitness apps, consider the design differences, and assess how the variations impact perceptions and experience.

8. Conclusions

This study enhances our understanding of IT continuance by demonstrating how the actualization of affordances influences perceived usefulness, a key variable in the Expectation–Confirmation Model (ECM) within the context of fitness apps. It emphasizes the importance of examining actualized affordances through technology features that contribute to perceived usefulness. Additionally, it reveals that not all users utilize a technology’s features, and some features are rarely used by users. These findings underscore the importance of designing technologies that facilitate affordance actualization, offering practical insights to enhance user engagement and support long-term adoption.

Author Contributions

Conceptualization, M.A., B.T., and A.H.-P.; methodology, M.A., B.T., V.W., and A.H.-P.; software, M.A.; validation, M.A., B.T., and A.H.-P.; formal analysis, M.A.; investigation, M.A.; resources, M.A. and B.T.; data curation, M.A.; writing—original draft preparation, M.A.; writing—review and editing, M.A., B.T., and A.H.-P.; visualization, M.A.; supervision, M.A.; project administration, M.A. All authors have read and agreed to the published version of the manuscript.

Funding

This research received no external funding.

Institutional Review Board Statement

The study was conducted in accordance with the Declaration of Helsinki and approved by the Institutional Review Board (IRB) of Worcester Polytechnic Institute (protocol code IRB-22-0351, date of approval: 29-Mar-2022).

Data Availability Statement

The data generated or used during the current study is available from the corresponding author upon request.

Conflicts of Interest

The authors declare no conflicts of interest.

Appendix A

Measurement items used in the survey instrument for ECM constructs [35] and Updating Affordance [66,67]
IS continuance intention [35]
Prompt: Indicate the extent to which you agree or disagree with the following statements.
  • I intend to continue using Fitbit for (the selected exercise, e.g., walking) in the future
  • I will always try to use Fitbit for (selected exercise, e.g., walking) in my daily life
  • I will keep using Fitbit for (the selected exercise, e.g., walking) regularly as I do now
Satisfaction [35]
Prompt: How do you feel about your overall experience using Fitbit for (the selected exercise, e.g., walking)?
  • 1= Very dissatisfied to 5= Very satisfied
  • 1= Very displeased to 5= Very pleased
  • 1= Very frustrated to 5= Very contented
  • 1= Absolutely terrible to 5= Absolutely delighted
Perceived usefulness [35]
Prompt: Indicate the extent to which you agree or disagree with the following statements.
  • Using Fitbit improves my (the selected exercise, e.g., walking) experience
  • Using Fitbit enhances my effectiveness in (the selected exercise, e.g., walking)
  • Using Fitbit increases my productivity in (the selected exercise, e.g., walking)
  • Overall, Fitbit is useful for my (the selected exercise, e.g., walking)
Confirmation [35]
Prompt: Indicate the extent to which you agree or disagree with the following statements.
  • My experience with using Fitbit for (the selected exercise, e.g., walking) was better than I expected
  • The service level provided by Fitbit for (the selected exercise, e.g., walking) was better than I expected
  • Overall, most of my expectations about using Fitbit for (the selected exercise, e.g., walking) were confirmed
Updating [66,67]
Prompt: I use Fitbit for (the selected exercise, e.g., walking) to:
  • Provide me with messages about my exercise progress
  • Give me visual cues about my exercise progress
  • Provide me with exercise progress updates
  • Update me with the status of my exercise progress
Comparing [66,67]
Prompt: I use Fitbit for (the selected exercise, e.g., walking) to:
  • Compare my exercise activities to other people’s exercise activities
  • See how other people’s exercise activities compare to mine
  • Compare my exercise activities to the exercise activities of others
  • Track my exercise activities with respect to how they compare to others
  • Rank my exercise activities relative to others’ exercise activities
Self-presentation [66,67]
Prompt: I use Fitbit for (the selected exercise, e.g., walking) to:
  • Express myself as a physically active person
  • Establish a preferred image of myself as physically active person
  • Present myself as physically active person
  • Project an image about myself as physically active person
Guidance [66,67]
Prompt: I use Fitbit for (the selected exercise, e.g., walking) to:
  • Get guidance how to better perform physical exercise
  • Get taught how to improve my exercise activity
  • Receive instructions while doing exercise activity
  • Get supervised to reach my exercise activity goals
Search [66,67]
Prompt: I use Fitbit for (the selected exercise, e.g., walking) to:
  • Search for exercise information
  • Access exercise information
  • Find exercise information that is relevant to me
  • Browse exercise information
Reminding [66,67]
Prompt: I use Fitbit for (the selected exercise, e.g., walking) to:
  • Remind me to do an exercise activity
  • Notify me to perform an exercise activity
  • Provide me with reminders when I need to do an exercise activity
  • Prompt me when I need to perform an exercise activity
Watching others [66,67]
Prompt: I use Fitbit for (the selected exercise, e.g., walking) to:
  • Observe others who are performing exercise activities
  • Follow exercise activities of other people
  • Keep an eye on other people’s way of doing exercise
  • Get inspired by how others do exercise activity
Competing [66,67]
Prompt: I use Fitbit for (the selected exercise, e.g., walking) to:
  • Compete with other people
  • Challenge other individuals to exercise competitions
  • Have exercise contests with other individuals
  • Enter into exercise competitions with others
Recognize [66,67]
Prompt: I use Fitbit for (the selected exercise, e.g., walking) to:
  • Earn compliments from others for my exercise activity
  • Earn respect of others for my exercise activity
  • Get recognition from others for my exercise behavior
  • Get noticed by others for my exercise activity
Encourage [66,67]
Prompt: I use Fitbit for (the selected exercise, e.g., walking) to:
  • Have other people encourage my exercise activities
  • Receive encouraging messages regarding my exercise activities from others
  • Have my exercise accomplishments acknowledged by other people
  • Receive moral support for my exercise activities from others
Rewards [66,67]
Prompt: I use Fitbit for (the selected exercise, e.g., walking) to:
  • Receive rewards for my exercise activities
  • Obtain rewards for my exercise activities
  • Win prizes for my exercise activities
  • Earn prizes for my exercise activities

Appendix B

Characteristics of study sample
Question% Current users (N = 442)
Gender
  • Male
50%
  • Female
48%
  • Transgender
1%
  • Nonbinary
1%
Age
  • 18–24 years
7%
  • 25–34 years
33%
  • 35–44 years
31%
  • 45–54 years
13%
  • 55–64 years
11%
  • 65–74 years
4%
  • 75 years or older
1%
Ethnicity
  • White
81%
  • Black
9%
  • Asian
8%
  • Other
3%
Employment status
  • Full-Time
70%
  • Part-Time
14%
  • Not in paid work (e.g., homemaker, retired or disabled)
9%
  • Unemployed (and job seeking)
4%
  • Other
3%
Frequency of use
  • Daily
44%
  • 4–6 times a week
31%
  • 2–3 times a week
21%
  • Once a week
2 %
  • Less than once a week
2%
Duration of use
  • Less than 1 month
.0%
  • Between 1 week and 1 month
.0%
  • 1–3 months
4%
  • 4–6 months
9%
  • 7–9 months
5%
  • 10–12 months
8 %
  • More than 12 months
74%
Exercise engaged in
  • Running
24%
  • Walking
62%
  • Biking
5%
  • Swimming
1%
  • Spinning
1%
  • Hiking
3%
  • Yoga
1%
  • Other
3%
Device used
  • Phone
40%
  • Fitbit wearable device
41%
  • Smart watch (like Samsung watch and Apple watch)
11%
  • Laptop/Desktop computer
8%
Duration of premium use
  • Never
20%
  • Up to 3 months or free trial
25%
  • 4–6 months
10%
  • 7–12 months
13%
  • More than 12 months
32%

References

  1. Bhattacherjee, A.; Perols, J.; Sanford, C. Information technology continuance: A theoretic extension and empirical test. J. Comput. Inf. Syst. 2008, 49, 17–26. [Google Scholar] [CrossRef]
  2. Hsu, M.H.; Chiu, C.M.; Ju, T.L. Determinants of continued use of the WWW: An integration of two theoretical models. Ind. Manag. Data Syst. 2004, 104, 766–775. [Google Scholar] [CrossRef]
  3. Jasperson, J.; Carter, P.E.; Zmud, R.W. A comprehensive conceptualization of post-adoptive behaviors associated with information technology enabled work systems. MIS Q. 2005, 29, 525–557. [Google Scholar] [CrossRef]
  4. Wang, T.; Wang, W.; Liang, J.; Nuo, M.; Wen, Q.; Wei, W.; Han, H.; Lei, J. Identifying major impact factors affecting the continuance intention of mHealth: A systematic review and multi-subgroup meta-analysis. NPJ Digit. Med. 2022, 5, 145. [Google Scholar] [CrossRef] [PubMed]
  5. Nabavi, A.; Taghavi-Fard, M.T.; Hanafizadeh, P.; Taghva, M.R. Information technology continuance intention: A systematic literature review. Int. J. E-Bus. Res. (IJEBR) 2016, 12, 58–95. [Google Scholar] [CrossRef]
  6. Bhattacherjee, A. Understanding information systems continuance: An expectation-confirmation model. MIS Q. 2001, 25, 351–370. [Google Scholar] [CrossRef]
  7. Venkatesh, V.; Thong, J.Y.L.; Chan, F.K.Y.; Hu, P.J.-H.; Brown, S.A. Extending the two-stage information systems continuance model: Incorporating UTAUT predictors and the role of context. Inf. Syst. J. 2011, 21, 527–555. [Google Scholar] [CrossRef]
  8. Brown, S.A.; Venkatesh, V.; Goyal, S. Expectation Confirmation in Technology Use. Inf. Syst. Res. 2012, 23, 474–487. [Google Scholar] [CrossRef]
  9. Shaw, H.; Ellis, D.A.; Ziegler, F.V. The Technology Integration Model (TIM). Predicting the continued use of technology. Comput. Hum. Behav. 2018, 83, 204–214. [Google Scholar] [CrossRef]
  10. Jeyaraj, A.; Dwivedi, Y.K.; Venkatesh, V. Intention in Information Systems Adoption and Use: Current State and Research Directions; Elsevier: Amsterdam, The Netherlands, 2023; p. 102680. [Google Scholar]
  11. Burton-Jones, A.; Grange, C. From use to effective use: A representation theory perspective. Inf. Syst. Res. 2013, 24, 632–658. [Google Scholar] [CrossRef]
  12. Ajjan, H.; Hartshorne, R.; Cao, Y.; Rodriguez, M. Continuance use intention of enterprise instant messaging: A knowledge management perspective. Behav. Inf. Technol. 2014, 33, 678–692. [Google Scholar] [CrossRef]
  13. Yan, M.; Filieri, R.; Gorton, M. Continuance intention of online technologies: A systematic literature review. Int. J. Inf. Manag. 2021, 58, 102315. [Google Scholar] [CrossRef]
  14. Mishra, A.; Shukla, A.; Rana, N.P.; Currie, W.L.; Dwivedi, Y.K. Re-examining post-acceptance model of information systems continuance: A revised theoretical model using MASEM approach. Int. J. Inf. Manag. 2023, 68, 102571. [Google Scholar] [CrossRef]
  15. Vaghefi, I.; Tulu, B. The continued use of mobile health apps: Insights from a longitudinal study. JMIR mHealth uHealth 2019, 7, e12983. [Google Scholar] [CrossRef] [PubMed]
  16. Thong, J.Y.; Hong, S.-J.; Tam, K.Y. The effects of post-adoption beliefs on the expectation-confirmation model for information technology continuance. Int. J. Hum. Comput. Stud. 2006, 64, 799–810. [Google Scholar] [CrossRef]
  17. Lee, M.-C. Explaining and predicting users’ continuance intention toward e-learning: An extension of the expectation–confirmation model. Comput. Educ. 2010, 54, 506–516. [Google Scholar] [CrossRef]
  18. Susanto, A.; Chang, Y.; Ha, Y. Determinants of continuance intention to use the smartphone banking services: An extension to the expectation-confirmation model. Ind. Manag. Data Syst. 2016, 116, 508–525. [Google Scholar] [CrossRef]
  19. Al-Maghrabi, T.; Dennis, C.; Halliday, S.V. Antecedents of continuance intentions towards e-shopping: The case of Saudi Arabia. J. Enterp. Inf. Manag. 2011, 24, 85–111. [Google Scholar] [CrossRef]
  20. Cho, J. The impact of post-adoption beliefs on the continued use of health apps. Int. J. Med. Inform. 2016, 87, 75–83. [Google Scholar] [CrossRef]
  21. Cai, J.; Zhao, Y.; Sun, J. Factors influencing fitness app users’ behavior in China. Int. J. Hum. Comput. Interact. 2021, 38, 53–63. [Google Scholar] [CrossRef]
  22. Wu, B.; Chen, X. Continuance intention to use MOOCs: Integrating the technology acceptance model (TAM) and task technology fit (TTF) model. Comput. Hum. Behav. 2017, 67, 221–232. [Google Scholar] [CrossRef]
  23. McGrenere, J.; Ho, W. Affordances: Clarifying and evolving a concept. Graph. Interface 2000, 2000, 179–186. [Google Scholar]
  24. Strong, D.M.; Volkoff, O.; Johnson, S.A.; Pelletier, L.R.; Tulu, B.; Bar-On, I.; Trudel, J.; Garber, L. A Theory of organization-EHR affordance actualization. J. Assoc. Inf. Syst. 2014, 15, 2. [Google Scholar] [CrossRef]
  25. Oliver, R.L. A cognitive model of the antecedents and consequences of satisfaction decisions. J. Mark. Res. 1980, 17, 460–469. [Google Scholar] [CrossRef]
  26. Tse, D.K.; Wilton, P.C. Models of consumer satisfaction formation: An extension. J. Mark. Res. 1988, 25, 204–212. [Google Scholar] [CrossRef]
  27. El-Gayar, O.F.; Elnoshokaty, A.; Behrens, A. Understanding Design Features for Continued Use of Wearables Devices. In Proceedings of the AMCIS, Virtual, 9–13 August 2021. [Google Scholar]
  28. Kaium, M.A.; Bao, Y.; Alam, M.Z.; Hoque, M.R. Understanding continuance usage intention of mHealth in a developing country: An empirical investigation. Int. J. Pharm. Healthc. Mark. 2020, 14, 251–272. [Google Scholar] [CrossRef]
  29. Staples, D.S.; Wong, I.; Seddon, P.B. Having expectations of information systems benefits that match received benefits: Does it really matter? Inf. Manag. 2002, 40, 115–131. [Google Scholar] [CrossRef]
  30. WHO. Physical Activity. 2020. Available online: https://www.who.int/news-room/fact-sheets/detail/physical-activity (accessed on 25 July 2025).
  31. Kunst, A. Popular Health App Types in the U.S. 2018. Available online: https://www.statista.com/forecasts/805851/popular-health-app-types-in-the-us (accessed on 25 July 2025).
  32. Statista. Health and Fitness Apps—Statistics & Facts; Statista: Hamburg, Germany, 2022. [Google Scholar]
  33. Globenewswire. Fitness App Market to Reach USD 14.64 Billion by 2027; Globenewswire: El Segund, CA, USA, 2020. [Google Scholar]
  34. RunRepeat. Fitness Industry Statistics 2021–2028 [Market Research]; RunRepeat: København, Denmark, 2021. [Google Scholar]
  35. Chiu, W.; Cho, H.; Chi, C.G. Consumers’ continuance intention to use fitness and health apps: An integration of the expectation–confirmation model and investment model. Inf. Technol. People 2020, 34, 978–998. [Google Scholar] [CrossRef]
  36. Alshawmar, M.; Tulu, B.; Hall-Phillips, A. Influence of Personality Traits on the Continued Use of Fitness Apps. In Proceedings of the 55th Hawaii International Conference on System Sciences, Maui, HI, USA, 4–7 January 2022. [Google Scholar]
  37. Ajzen, I.; Fishbein, M.; Lohmann, S.; Albarracín, D. The Influence of Attitudes on Behavior; The Handbook of Attitudes; Basic Principles; Psychology Press: Hove, UK, 2018; Volume 1, pp. 197–255. [Google Scholar]
  38. Ajzen, I. The theory of planned behavior. Organ. Behav. Hum. Decis. Process. 1991, 50, 179–211. [Google Scholar] [CrossRef]
  39. Hsieh, T.-C.; Chen, S.-L.; Hung, M.-C. Longitudinal test of ePortfolio continuous use: An empirical study on the change of students’ beliefs. Behav. Inf. Technol. 2015, 34, 838–853. [Google Scholar] [CrossRef]
  40. Limayem, M.; Cheung, C.M. Predicting the continued use of Internet-based learning technologies: The role of habit. Behav. Inf. Technol. 2011, 30, 91–99. [Google Scholar] [CrossRef]
  41. Wu, B.; Zhang, C. Empirical study on continuance intentions towards E-Learning 2.0 systems. Behav. Inf. Technol. 2014, 33, 1027–1038. [Google Scholar] [CrossRef]
  42. Hsiao, W.-H.; Chang, T.-S. Understanding consumers’ continuance intention towards mobile advertising: A theoretical framework and empirical study. Behav. Inf. Technol. 2014, 33, 730–742. [Google Scholar] [CrossRef]
  43. Devaraj, S.; Fan, M.; Kohli, R. Antecedents of B2C channel satisfaction and preference: Validating e-commerce metrics. Inf. Syst. Res. 2002, 13, 316–333. [Google Scholar] [CrossRef]
  44. Lin, C.S.; Wu, S.; Tsai, R.J. Integrating perceived playfulness into expectation-confirmation model for web portal context. Inf. Manag. 2005, 42, 683–693. [Google Scholar] [CrossRef]
  45. Nascimento, B.; Oliveira, T.; Tam, C. Wearable technology: What explains continuance intention in smartwatches? J. Retail. Consum. Serv. 2018, 43, 157–169. [Google Scholar] [CrossRef]
  46. Halilovic, S.; Cicic, M. Antecedents of information systems user behaviour–extended expectation-confirmation model. Behav. Inf. Technol. 2013, 32, 359–370. [Google Scholar] [CrossRef]
  47. Kim, K.H.; Kim, K.J.; Lee, D.H.; Kim, M.G. Identification of critical quality dimensions for continuance intention in mHealth services: Case study of onecare service. Int. J. Inf. Manag. 2019, 46, 187–197. [Google Scholar] [CrossRef]
  48. Gupta, A.; Dhiman, N.; Yousaf, A.; Arora, N. Social comparison and continuance intention of smart fitness wearables: An extended expectation confirmation theory perspective. Behav. Inf. Technol. 2021, 40, 1341–1354. [Google Scholar] [CrossRef]
  49. Nguyen, G.-D.; Dao, T.-H.T. Factors influencing continuance intention to use mobile banking: An extended expectation-confirmation model with moderating role of trust. Humanit. Soc. Sci. Commun. 2024, 11, 276. [Google Scholar] [CrossRef]
  50. Akter, S.; D’AMbra, J.; Ray, P.; Hani, U. Modelling the impact of mHealth service quality on satisfaction, continuance and quality of life. Behav. Inf. Technol. 2013, 32, 1225–1241. [Google Scholar] [CrossRef]
  51. Roca, J.C.; Chiu, C.-M.; Martínez, F.J. Understanding e-learning continuance intention: An extension of the Technology Acceptance Model. Int. J. Hum. Comput. Stud. 2006, 64, 683–696. [Google Scholar] [CrossRef]
  52. Venkatesh, V.; Morris, M.G.; Davis, G.B.; Davis, F.D. User acceptance of information technology: Toward a unified view. MIS Q. 2003, 27, 425–478. [Google Scholar] [CrossRef]
  53. Moore, G.C.; Benbasat, I. Development of an instrument to measure the perceptions of adopting an information technology innovation. Inf. Syst. Res. 1991, 2, 192–222. [Google Scholar] [CrossRef]
  54. Thompson, R.L.; Higgins, C.A.; Howell, J.M. Personal computing: Toward a conceptual model of utilization. MIS Q. 1991, 15, 125. [Google Scholar] [CrossRef]
  55. Compeau, D.R.; Higgins, C.A. Computer self-efficacy: Development of a measure and initial test. MIS Q. 1995, 19, 189–211. [Google Scholar] [CrossRef]
  56. Compeau, D.; Higgins, C.A.; Huff, S. Social cognitive theory and individual reactions to computing technology: A longitudinal study. MIS Q. 1999, 23, 145. [Google Scholar] [CrossRef]
  57. Yeh, R.K.-J.; Teng, J.T. Extended conceptualisation of perceived usefulness: Empirical test in the context of information system use continuance. Behav. Inf. Technol. 2012, 31, 525–540. [Google Scholar] [CrossRef]
  58. Gibson, J.J. The Theory of Affordances. Hilldale 1977, 1, 67–82. [Google Scholar]
  59. Leonardi, P.M. When flexible routines meet flexible technologies: Affordance, constraint, and the imbrication of human and material agencies. MIS Q. 2011, 35, 147–167. [Google Scholar] [CrossRef]
  60. Festinger, L. A Theory of Cognitive Dissonance; Stanford University Press: Redwood, CA, USA, 1957. [Google Scholar]
  61. Gibson, J.J. The Ecological Approach to Visual Perception: Classic Edition; Psychology Press: Hove, UK, 2014. [Google Scholar]
  62. Alshawmar, M. A Review of the Applications of Affordance Theory in mHealth App Research. In Proceedings of the 54th Hawaii International Conference on System Sciences, Kauai, HI, USA, 5 January 2021. [Google Scholar]
  63. Suh, A. Sustaining the use of quantified-self technology: A theoretical extension and empirical test. Asia Pac. J. Inf. Syst. 2018, 28, 114–132. [Google Scholar] [CrossRef]
  64. James, T.L.; Wallace, L.; Deane, J.K. Using organismic integration theory to Explore the associations between users’ exercise motivations and fitness technology feature set use. MIS Q. 2019, 43, 287–312. [Google Scholar] [CrossRef]
  65. Rockmann, R.; Gewald, H. Activity tracking affordances: Identification and instrument development. In Proceedings of the PACIS Proceedings, Yokohama, Japan, 26–30 June 2018; p. 232. [Google Scholar]
  66. James, T.L.; Deane, J.K.; Wallace, L. An application of goal content theory to examine how desired exercise outcomes impact fitness technology feature set selection. Inf. Syst. J. 2019, 29, 1010–1039. [Google Scholar] [CrossRef]
  67. Markus, M.L.; Silver, M. A foundation for the study of IT effects: A new look at desanctis and poole’s concepts of structural features and spirit. J. Assoc. Inf. Syst. 2008, 9, 609–632. [Google Scholar] [CrossRef]
  68. Karahanna, E.; Xu, S.X.; Xu, Y.; Zhang, N. The needs–affordances–features perspective for the use of social media. Mis. Q. 2018, 42, 737–756. [Google Scholar] [CrossRef]
  69. Heidegger, M. Being and Time; Suny Press: Albany, NY, USA, 2010. [Google Scholar]
  70. Burton-Jones, A.; Straub, D.W., Jr. Reconceptualizing system usage: An approach and empirical test. Inf. Syst. Res. 2006, 17, 228–246. [Google Scholar] [CrossRef]
  71. Ceci, L. Leading Health and Fitness Apps in the U.S. 2018, by Users. 2022. Available online: https://www.statista.com/statistics/650748/health-fitness-app-usage-usa/#:~:text=Leading%20health%20and%20fitness%20apps%20in%20the%20U.S.%202018%2C%20by%20users&text=As%20of%20May%202018%2C%20Fitbit,audience%20of%2019.1%20million%20users (accessed on 25 July 2025).
  72. Hair, J.F.; Ringle, C.M.; Sarstedt, M. PLS-SEM: Indeed a silver bullet. J. Mark. Theory Pract. 2011, 19, 139–152. [Google Scholar] [CrossRef]
  73. Gaskin, J. Causal Models. Gaskination’s StatWiki. 2016. Available online: https://statwiki.gaskination.com/index.php/Causal_Models (accessed on 25 July 2025).
  74. Peer, E.; Brandimarte, L.; Samat, S.; Acquisti, A. Beyond the Turk: Alternative platforms for crowdsourcing behavioral research. J. Exp. Soc. Psychol. 2017, 70, 153–163. [Google Scholar] [CrossRef]
  75. Anderson, J.C.; Gerbing, D.W. Structural equation modeling in practice: A review and recommended two-step approach. Psychol. Bull. 1988, 103, 411. [Google Scholar] [CrossRef]
  76. Hair, J.F.; Risher, J.J.; Sarstedt, M.; Ringle, C.M. When to use and how to report the results of PLS-SEM. Eur. Bus. Rev. 2019, 31, 2–24. [Google Scholar] [CrossRef]
  77. Hair, J.; Alamer, A. Partial Least Squares Structural Equation Modeling (PLS-SEM) in second language and education research: Guidelines using an applied example. Res. Methods Appl. Linguist. 2022, 1, 100027. [Google Scholar] [CrossRef]
  78. Schumacker, R.E.; Lomax, R.G. A Beginner’s Guide to Structural Equation Modeling; Psychology Press: Hove, UK, 2004. [Google Scholar]
  79. Ghasemi, A.; Zahediasl, S. Normality tests for statistical analysis: A guide for non-statisticians. Int. J. Endocrinol. Metab. 2012, 10, 486–489. [Google Scholar] [CrossRef]
  80. Volkoff, O.; Strong, D.M. Affordance theory and how to use it in IS research. In The Routledge Companion to Management Information Systems; Routledge: Abingdon, UK, 2017; pp. 232–245. [Google Scholar]
Figure 1. Fitness app actualized affordances and post-adoption perceived usefulness in the ECM.
Systems 13 00652 g001
Figure 2. Fitbit app features.
Systems 13 00652 g002
Figure 3. Results of the study model.
Systems 13 00652 g003
Table 1. Survey items [66,67].
What Did You Use This Feature (Presented as Above Pictures) for? Choose All That Apply.
Affordance Definition
Comparing To compare my exercise performance with others
Guidance To get guidance on how to perform my exercise
Self-presentation To present myself as a physically active person
Rewards To receive rewards for my exercise
Recognizing To get recognition from others for my exercise
EncouragingTo have other people encourage my exercise
CompetingTo compete with others
Watching others To keep an eye on others’ ways of doing exercise
RemindingTo remind me to do an exercise activity
UpdatingTo update me with the status of my exercise progress
Searching To search for exercise information
Table 2. Affordance actualization results by feature.
Today’s Activity
Usefulness: 97% Useful, 3% Useless
 Actualized AffordanceActualized Participants (n = 428)
 Updating77%
 Reminding51%
 Guidance21%
 Comparing14%
 Searching21%
Report
Usefulness: 95% Useful, 5% Useless
 Actualized AffordanceActualized Participants (n = 433)
 Updating81%
 Reminding42%
 Guidance14%
 Searching14%
 Self-presentation10%
Notification
Usefulness: 66% Useful, 34% Useless
 Actualized AffordanceActualized Participants (n = 394)
 Reminding81%
 Updating16%
 Guidance5%
 Rewards1%
 Searching1%
Challenges
Usefulness: 58% Useful, 42% Useless
 Actualized AffordanceActualized Participants (n = 368)
 Reminding40%
 Rewards36%
 Updating34%
 Competing18%
 Comparing10%
Workout
Usefulness: 36% Useful, 64% Useless
 Actualized AffordanceActualized Participants (n = 329)
 Searching41%
 Guidance36%
 Watching others16%
 Reminding16%
 Updating6%
Cheer
Usefulness: 33% Useful, 67% Useless
 Actualized AffordanceActualized Participants (n = 303)
 Encourage22%
 Updating22%
 Recognize17%
 Reminding14%
 Watching others11%
Compose
Usefulness: 31% Useful, 69% Useless
 Actualized AffordanceActualized Participants (n = 294)
 Updating30%
 Reminding21%
 Searching18%
 Recognize16%
 Self-presentation16%
Friends
Usefulness: 30% Useful, 70% Useless
 Actualized AffordanceActualized Participants (n = 342)
 Comparing44%
 Competing29%
 Encourage21%
 Watching others20%
 Recognize17%
Groups
Usefulness: 26% Useful, 74% Useless
 Actualized AffordanceActualized Participants (n = 281)
 Encourage20%
 Watching others20%
 Comparing19%
 Competing19%
 Guidance18%
Adventure
Usefulness: 24% Useful, 76% Useless
 Actualized AffordanceActualized Participants (n = 255)
 Searching18%
 Competing16%
 Reminding15%
 Updating11%
 Guidance10%
Post
Usefulness: 21% Useful, 79% Useless
 Actualized AffordanceActualized Participants (n = 259)
 Comparing21%
 Watching other19%
 Encourage18%
 Competing14%
 Recognize14%
Comments
Usefulness: 20% Useful, 80% Useless
 Actualized AffordanceActualized Participants (n = 277)
 Encourage27%
 Recognize18%
 Comparing19%
 Watching others17%
 Competing12%
Message
 Usefulness: 17% Useful, 83% Useless
 Actualized AffordanceActualized Participants (n =255)
 Encourage23%
 Recognize11%
 Reminding8%
 Guidance7%
 Updating7%
Feed
Usefulness: 15% Useful, 85% Useless
 Actualized AffordanceActualized Participants (n = 298)
 Encourage21%
 Watching others17%
 Comparing14%
 Self-presentation9%
 Recognize9%
Table 3. Construct reliability, validity, and loadings.
Cronbach’s alphaComposite Reliability Average Variance Extracted (AVE)Loading
Updating affordance0.8570.8440.6080.670.7070.890.832
Continuance intention0.8620.8640.690.7420.9160.825
Confirmation0.8180.840.620.860.8240.665
Perceived usefulness0.8840.8890.6610.8020.8660.8010.78
Satisfaction0.8920.8940.6840.8830.9010.7910.72
Table 4. Discriminant validity—Heterotrait–Monotrait ratio (HTMT) criterion.
Updating AffordanceContinuance IntentionConfirmationPerceived Usefulness
Continuance intention0.258
Confirmation0.4160.562
Perceived usefulness0.5090.6180.744
Satisfaction0.3650.6280.6470.566
Table 5. Variance inflation factors.
ConstructItemVIF
Updating affordanceUpdating affordance11.693
Updating affordance21.864
Updating affordance32.885
Updating affordance42.469
ConfirmationConfirmation12.301
Confirmation22.300
Confirmation31.485
Continuance intentionContinuance intention21.901
Continuance intention33.025
Continuance intention12.439
Perceived usefulnessPerceived usefulness12.211
Perceived usefulness23.115
Perceived usefulness32.516
Perceived usefulness41.997
SatisfactionSatisfaction13.060
Satisfaction23.558
Satisfaction32.380
Satisfaction41.935
Table 6. Results for the hypotheses.
NoHypothesisβ (O)β (M)Bias95% CI [2.5%, 97.5%]p Values
H1Confirmation → Perceived Usefulness0.5080.505−0.003[0.403, 0.637]0.000
H2Perceived Usefulness → Continuance Intention0.3000.3030.002[0.193, 0.436]0.000
H3Confirmation → Satisfaction0.4450.443−0.002[0.345, 0.562]0.000
H4Satisfaction → Continuance Intention0.3960.393−0.003[0.268, 0.547]0.000
H5Updating Affordance → Perceived Usefulness0.2320.2350.003[0.138, 0.340]0.000
Note: All confidence intervals exclude zero, indicating that all hypothesized paths are statistically significant.
Table 7. Results of mediation paths.
Mediation Pathsβ (O)β (M)Bias95% CI [2.5%, 97.5%]p Values
Updating Affordance → Perceived Usefulness → Continuance Intention0.0700.0710.0010.037, 0.1200.001
Confirmation → Satisfaction → Continuance Intention0.1760.174−0.0020.113, 0.2670.000
Confirmation → Perceived Usefulness → Continuance Intention0.1530.1530.0000.091, 0.2340.000
Note: All confidence intervals exclude zero, indicating that all mediation effects are statistically significant.
Disclaimer/Publisher’s Note: The statements, opinions and data contained in all publications are solely those of the individual author(s) and contributor(s) and not of MDPI and/or the editor(s). MDPI and/or the editor(s) disclaim responsibility for any injury to people or property resulting from any ideas, methods, instructions or products referred to in the content.

