Abstract
Although carbon emissions trading systems are universally acknowledged as one of the most potent policy instruments for counteracting hazardous climate trends, and digitalization is seen as a favorable technological means to promote corporate green and low-carbon transformation, few studies have investigated the dark side of both. Using data on Chinese listed companies from 2011 to 2020 and adopting a multi-period DID methodology, this research reveals that, in response to the carbon emissions trading system, firms often adopt low-cost, strategic environmental governance behaviors—namely, carbon washing—to reduce compliance costs and maintain their reputation and image. Furthermore, the study reveals that the information advantages of digital transformation create conditions for the opportunistic manipulation of carbon disclosure. Digitalization amplifies the positive influence of the carbon trading system on corporate carbon washing behavior. Mechanism analysis confirms that the carbon emissions trading system increases the production costs of regulated firms, thereby increasing their carbon washing behavior. Economic consequence analysis confirms that firms engage in carbon washing to gain legitimacy and maintain their reputation and image, which may allow them to obtain opportunistic benefits in the capital market. Finally, this study suggests that the government should adopt supplementary policy tools, such as environmental subsidies, enhanced use of digital technologies to strengthen regulatory capacity, and increased media oversight, to mitigate the unintended consequences of the carbon trading system on corporate behavior.
1. Introduction
Green and low-carbon development is a critical strategic priority for China, and the disclosure of carbon information establishes a fundamental nexus between organizations and stakeholders for collaborative climate risk mitigation. Existing research on the factors influencing carbon disclosure is extensive, covering aspects such as corporate operational characteristics [1] and environmental regulations [2]. However, most studies fail to examine whether enterprises ’actual carbon reduction efforts align with their disclosed information. China has established a carbon emissions trading system (ETS) to incentivize emission reductions by internalizing corporate carbon costs. However, companies often resort to symbolic compliance, superficially adhering to institutional requirements while lacking substantive action [3]. Under regulatory gaps and compliance pressures, listed companies have incentives to exaggerate their carbon reduction achievements. By crafting a proactive emission-reduction image, they seek legitimacy, meet regulatory obligations at minimal costs, and gain returns from capital markets. In China’s Greenwashing Watchlist, published annually by Southern Weekly, listed companies are frequently found to engage in greenwashing practices. For example, Hualing Steel was rated as a “Green Factory”, yet multiple production facilities operated by its subsidiaries had no pollution control equipment and allegedly failed to consistently meet emission standards. No emergency mitigation initiatives were deployed by the corporation amidst high-pollution occurrences, suspiciously falsified manual monitoring reports were submitted, and in its annual report, 19 environmental fines were condensed into just three disclosed items. Furthermore, in its 2023 Environmental, Social Responsibility, and Corporate Governance Report, Hualing Steel claimed that it had no major environmental incidents or penalties1. In summary, there is limited research examining whether enterprises’ actual carbon reduction outcomes align with their carbon information disclosures. Against this backdrop, the core aim of this study is to scrutinize the impact of China’s carbon emissions trading system (ETS) on strategic environmental governance behavior, specifically carbon washing (i.e., the disparity between disclosed carbon information and emission reduction results).
The concept of carbon washing derives from the definition [4] and measurement framework [5] of greenwashing, specifically denoting the divergence between disclosed carbon information and carbon-reduction outcomes. Our focus on carbon washing stems from the core objective of the carbon emissions trading system (ETS): to achieve a substantive corporate carbon reduction goal centered on environmental accountability. In contrast, greenwashing reflects discrepancies between a company’s disclosed ESG information and its actual ESG practices. This discrepancy spans three dimensions: environmental responsibility (e.g., green technology innovation and pollution reduction), social responsibility (e.g., charitable donations and employee welfare protection), and governance responsibility (e.g., improving operational performance and protecting shareholder interests). Crucially, the broad scope of greenwashing may trigger conflicts between environmental and governance objectives, such as when emission-reduction investments compromise short-term shareholder returns. Greenwashing based on ESG ratings does not effectively assess the gap between environmental information disclosure and operational environmental performance.
In 2021, China’s digital economy reached USD 7.1 trillion, making it the world’s second-largest [6]. Digital technologies are increasingly deployed to address environmental challenges, and digitalization is an effective decarbonization strategy. For instance, corporate digital transformation has been credited with enhancing operational transparency [7], mitigating information asymmetry, and facilitating the green transition [8]. Conversely, digitally transformed enterprises leverage technological and informational advantages, where the digital divide creates opportunities for opportunistic conduct. Companies may exploit digital tools to conceal environmental data, manipulate disclosures, and exaggerate sustainability claims [9,10]. Given these competing hypotheses regarding the impact of digitalization on corporate disclosure, this study’s second research objective examines how corporate digital transformation moderates the relationship between China’s ETS and carbon washing practices.
This study makes the following key contributions:
First, this study contributes to the carbon disclosure literature by overcoming previous shortcomings, specifically the insufficient consideration of strategic disclosure behaviors. It provides empirical support for legitimacy theory and the fraud triangle theory, showing that when firms face environmental regulatory pressure and digital transformation offers opportunities to conceal, manipulate, or exaggerate carbon disclosures, they are more likely to engage in fraudulent and improper behavior—namely, carbon washing. By analyzing the interaction between environmental regulation and internal corporate factors, this study examines their joint impact on carbon-washing behavior. In contrast to the prevailing focus on the positive effects of environmental regulation and digital transformation, this research explores the unintended consequences of carbon emissions trading systems and digitalization, thereby extending the boundaries of prior studies.
Second, prior research exhibits gaps in analyzing the mediating mechanisms through which emissions trading systems (ETS) influence corporate carbon washing and in evaluating the economic consequences of such behavior. Addressing these deficiencies, this study demonstrates that increased production costs serve as the primary channel through which the ETS drives carbon washing practices. Carbon washing generates opportunistic gains for firms in capital markets. While previous studies have examined the unintended consequences of environmental regulations, few have explored how to mitigate corporate greenwashing from a policy perspective. Therefore, this study analyzes how external governance mechanisms (government environmental subsidies, media supervision, and public environmental attention) moderate the ETS–corporate carbon washing linkage and proposes corresponding policy recommendations.
Third, the commonly used dictionary-based approach to measuring digital transformation has recently been criticized. For instance, it may suffer from incomplete keyword lists and mistakenly count negative expressions, future-oriented statements, or industry background descriptions involving digital technologies as evidence of a firm’s digital transformation [6]. To measure corporate digital transformation more accurately, this study adopts the digital transformation indicator developed by JIN, ZUO, FANG, LI, and NIE [6], utilizing machine learning techniques to analyze the annual report texts of Chinese listed companies and determine whether a firm has adopted digital technologies.
2. Literature Review
2.1. Influencing Factors of Greenwashing
Factors influencing corporate greenwashing include government policies, media supervision, competitive pressure, investor and consumer demand, market opportunities, firm characteristics, incentive structures, and organizational culture [4,11]. From a stakeholder perspective, factors influencing corporate greenwashing can be categorized into external factors (government policies, regional culture, and competitive pressures), organizational factors (firm characteristics), and individual factors (executive characteristics). In terms of government policies, some scholars have found that certain policies either suppress or promote corporate greenwashing. These policies include the mandatory disclosure of internal private meeting systems in enterprises [12], the UK’s mandatory qualitative tax disclosure policy for large companies [13], China’s green financial regulatory policies [14], the Low-Carbon City Pilot Policy in China [15], and China’s environmental tax policy [16]. Regarding cultural influences, some scholars have found that regional speculative culture increases cash flow volatility, agency costs, and managerial self-interest, thereby promoting corporate greenwashing [17]. Family-oriented culture suppresses greenwashing behavior because of its lower agency costs [18]. In terms of organizational characteristics, some researchers argue that firms utilizing financial technology (fintech) can inhibit greenwashing behavior by promoting green innovation and improving management efficiency [19]. Regarding executive characteristics, Hao et al. [20] found that executives’ green awareness can alleviate corporate greenwashing by promoting green management innovation.
2.2. The Economic Effects of Carbon Emissions Trading Policy
The carbon emissions trading policy not only has a direct impact on carbon emissions but also produces a synergistic effect in reducing PM2.5 concentrations [21] and influences firms’ economic decision-making. This line of research mainly explores how carbon emissions trading policies affect corporate green governance and financial management. In terms of green governance, many scholars have examined whether the implementation of carbon emissions trading policies supports the Porter Hypothesis and whether it promotes green technological innovation. However, the findings remain inconclusive. Deng et al. [22] argue that China’s carbon emissions trading system has promoted green innovation in pilot regions, particularly by facilitating green innovation in state-owned enterprises. Conversely, some empirical studies suggest that the carbon trading system has inhibited green innovation in listed companies from the eight high-carbon pilot industries [23] and in the energy sector in pilot regions [24]. These studies indicate that following carbon market operationalization, higher environmental compliance costs [24], coupled with diminished cash flows and anticipated revenue declines, drive firms to reduce R&D expenditures, consequently impeding green innovation. In terms of financial management, some researchers have found that the carbon trading system increases firms’ debt costs [25], raises compliance costs and carbon-related risks, and thereby intensifies firms’ accrual-based earnings management [26]. On a more positive note, the carbon trading system has improved energy efficiency in pilot regions by optimizing the energy structure and promoting green technological innovation [27]. It has also contributed to improvements in firms’ total factor productivity [28,29] and increased firm market value [30].
2.3. Environmental Effects of Digital Transformation
Some scholars have investigated the positive effects of digitalization on firms’ environmental performance [31,32], green transformation [33], and greenwashing behavior [7]. The mechanisms through which digital transformation enhances environmental performance mainly include driving green technological innovation, expediting human capital development, increasing environmental information disclosure, and enhancing corporate environmental oversight [31]. The internal mechanisms by which digital resources drive the green transformation of manufacturing enterprises are as follows: when digital resources evolve from tool-based to online-based, they promote “green structuring,” such as energy data visualization and improved energy efficiency; when digital resources progress from online-based to intelligent-based, they drive “green capability-building,” including green innovation in production processes and the development of energy-saving and environmentally friendly products; and when digital resources advance from intelligent-based to ecosystem-based, they promote “green leveraging,” such as implementing green standards across the entire value chain and building green ecosystems [33].
Many scholars have explored digitalization as a constraint on corporate greenwashing. The main reasons are that digitalization enhances corporate transparency and improves information dissemination efficiency, enabling stakeholders to better identify discrepancies between ESG disclosures and actual ESG practices [7,34]. Additionally, digitalization strengthens the government’s environmental regulatory capacity and optimizes the regional business environment, thereby effectively suppressing corporate green-washing behavior [35]. Recently, a few studies have begun to examine the potential downsides of corporate digital transformation concerning greenwashing. Firms with weaker digital capabilities tend to rely on digitally advanced firms to obtain unique and valuable information and knowledge, which can lead to opportunistic behavior [10]. Moreover, digital tools offer firms the ability to selectively disclose information to stakeholders and conceal unfavorable details, allowing them to manipulate information and mislead stakeholders to gain their legitimacy. As a result, digitalized firms may increase their greenwashing behavior [9].
3. Theoretical Framework and Research Hypotheses
3.1. Background of the Carbon Emissions Trading Policy
As a ratified party, China adheres to both the United Nations Framework Convention on Climate Change and the Kyoto Protocol. As a climate-responsible state, China has bound itself to a 40–45% carbon intensity cut (2005-referenced) by 2020, achieve maximum emissions by 2030, and neutralize residual carbon output by 2060. These emission reduction obligations and responsibilities have made it urgent for China to adopt market-based tools. To achieve these emission reduction goals, the National Development and Reform Commission (NDRC) issued a Notice on Launching Carbon Emissions Trading Programs in October 2011. This marked the official establishment of pilot carbon emissions trading systems (ETS) in Guangdong Province, Hubei Province, and the municipalities of Beijing, Tianjin, Shanghai, Chongqing, and Shenzhen. In 2013, carbon emissions trading markets were launched in Shenzhen, Beijing, Shanghai, and Guangdong, followed by the launch of markets in Hubei and Chongqing in 2014. The industries covered by these ETS pilots mainly include steel, cement, chemicals, electricity, transportation, and aviation. In 2016, Fujian Province was added as the eighth national pilot region for carbon emissions trading.
China’s carbon emissions trading system is designed based on the following framework: First, a cap is set on the total amount of carbon dioxide emissions allowed in the carbon market, implementing total emissions control. Second, a list of regulated (compliance) enterprises is determined based on their historical carbon intensities. Third, initial emission allowances are allocated, typically using either the historical emissions method or the benchmark method to assign allowances to each regulated enterprise, and the method of allocation—whether free or paid—is specified. Finally, at the end of the compliance period, an allowance settlement takes place. During this process, regulated enterprises can buy or sell allowances on the carbon market based on their initial allocations and actual emissions to comply with aggregate emission caps [36].
3.2. Carbon Emissions Trading System and Carbon Washing
Corporate legitimacy refers to the general perception or assumption that a company’s actions are desirable, proper, or appropriate within a socially constructed system of norms, values, beliefs, and definitions [37]. Legitimacy theory emphasizes that firms are embedded within a specific institutional environment, and only by conforming to this environment can they gain legitimacy, sustain their survival and development, and mitigate external pressures [38,39]. Environmental information disclosure provides organizations with a means to maintain legitimacy without necessarily altering their economic models [40]. The carbon emissions trading system internalizes the cost of carbon emissions, increasing production costs, R&D expenditures, fluctuations in operating cash flows, equity financing expenses, and default risks for regulated enterprises [26]. Green practices, such as investing in carbon reduction equipment, using environmentally friendly raw materials, engaging in technological innovation, and modifying production processes, require significant resources and time to generate corresponding environmental and financial performance. According to the fraud triangle theory, the pressures faced by firms increase the likelihood of engaging in fraudulent or improper behavior [41,42]. Therefore, when faced with environmental regulatory pressure, firms may strategically choose low-cost “carbon washing” behaviors to conform to institutional expectations, reduce compliance costs, and maintain their reputation and image in the eyes of their stakeholders. This may involve selectively or inaccurately disclosing carbon emissions information, while actual carbon reduction efforts fall short of what is reported, resulting in a decoupling between carbon disclosure and real-emission reduction actions.
Therefore, this research advances the following hypothesis:
H1:
The carbon emissions trading system exerts a positive influence on carbon washing practices among regulated firms.
3.3. Corporate Digital Transformation and Carbon Washing
From the perspectives of neoclassical economics and information economics, greenwashing is a profit-maximizing strategy adopted by firms under insufficient environmental regulation, which exploits information asymmetry [43]. Information asymmetry is a key condition for greenwashing. Digitalization has become an important strategic tool for firms to address environmental challenges. Scholarly contestation has emerged regarding whether digitization constrains or enables corporate greenwashing. On the one hand, digitalization reduces the cost of information acquisition, enhances a firm’s ability and efficiency in processing information, reduces information asymmetry and transaction costs, increases transparency, and improves monitoring efficiency and the precision of supervision [34,44], all of which help prevent corporate greenwashing. On the other hand, digitally transformed firms possess technological and informational advantages over non-digitally transformed firms, governments, and the public. The digital divide and asymmetry in digital capabilities create conditions for opportunistic behavior, enabling firms to conceal, manipulate, or exaggerate carbon disclosures, thereby increasing information asymmetry. Digitally transforming firms may use digital tools to increase real-world complexity and create new information barriers, thereby embellishing or concealing their environmental performance, rather than achieving substantive improvements. Advanced digital technologies provide firms with channels to hide critical information, making carbon washing behaviors more difficult to regulate and detect. Digital transformation also requires substantial investment and consumes a substantial portion of a firm’s slack resources, making firms more inclined to pursue the economic benefits of digitalization. As a result, firms may opt for low-cost, symbolic carbon disclosures to achieve legitimacy, increasing the potential benefits of engaging in carbon-washing behavior [9,34].
Based on this, the following hypothesis was formulated:
H2:
Digital transformation amplifies the positive linkage between the carbon emissions trading system and carbon washing behavior.
3.4. Theoretical Analysis Framework Diagram
In the following analysis, we address three key aspects of the study. First, we examined the mechanism through which the carbon emissions trading system influences carbon-washing behavior. Under the pressure of internalizing carbon costs, the system increases production costs for regulated firms, prompting them to adopt low-cost carbon-washing strategies. Second, we explore how the capital market responds to corporate carbon washing—specifically, whether exaggerated or false carbon disclosures mislead investors and creditors, potentially allowing carbon-washing firms to benefit from reduced financing costs. Third, from the perspective of external oversight and governance, we analyze the moderating effects of government environmental subsidies, media supervision, and public environmental concern on the relationship between the carbon trading system and corporate carbon-washing behavior in order to propose relevant policy recommendations.
The theoretical analysis framework of the key variables in this paper is illustrated in Figure 1 below.
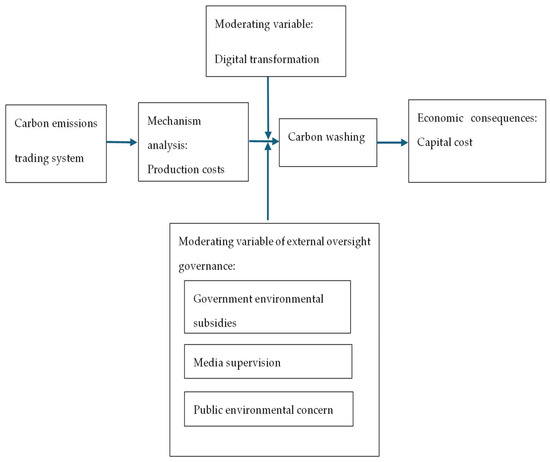
Figure 1.
Theoretical framework.
4. Research Design
4.1. Sample Selection and Data Sources
Because carbon emissions data are available starting from 2010, and measuring carbon washing requires calculating a firm’s actual carbon reduction for the current year (i.e., computing the absolute difference in carbon emissions between the current and previous years), this research constructs a comprehensive sample encompassing all Shanghai and Shenzhen A-share listed firms over the 2011–2020 period. The following exclusions were made: (1) firms in the financial industry, (2) specially treated (ST, *ST) firms, and (3) firms with missing key variables or control variables. Data on the carbon disclosure index, carbon emissions, the list of regulated firms under the carbon emissions trading system, control variables, government subsidies, and detailed notes on “government subsidies” from listed firms’ annual reports were all obtained from the CSMAR database. This study adopts the digital transformation indicator developed by JIN, ZUO, FANG, LI, and NIE [6], who utilized machine learning to identify digital transformation indicators from corporate annual reports. Media coverage data were sourced from the CNRDS database, and public environmental concern data were sourced from the Baidu Index.
4.2. Model Specification and Variable Measurement
(1) Carbon Washing (CWi,t): Following the definition and measurement of greenwashing by Yu, Luu and Chen [5], drawing on the definition and measurement of carbon washing proposed by Gangqiang, et al. [45], this study defines carbon washing as the gap between the level of carbon information disclosed by a firm and its actual carbon reduction performance. The following formula was used to measure it:
where CIDi,t represents the Carbon Information Disclosure Index, calculated as the sum of scores across various detailed disclosure indicators, including: governance, risks and opportunities, low-carbon transition strategy, carbon reduction targets, greenhouse gas emissions, value chain and supply chain, other climate-related information, and verifiability. The common scoring standard assigns 0 points for non-disclosure, while quantitative disclosures receive higher scores than qualitative ones. denotes the average Carbon Information Disclosure Index of all firms in year t; and is the standard deviation of the index in that year; Carboni,t refers to the estimated carbon emissions of firm i in year t, referring to the study by [46], computed as: total energy consumption of the firm’s national economic industry × CO2 conversion factor × operating costs of the listed firm/operating costs of the national economic industry; Facti,t represents the actual carbon reduction level of firm i in year t, as defined by Equation (3). is the average actual carbon reduction level of all firms in year t, and is the corresponding standard deviation. Based on these calculations, the firm’s level of carbon washing is obtained.
(2) Emissions Trading Scheme (ETSi,t). In 2011, China’s National Development and Reform Commission (NDRC) issued a Notice on Launching Pilot Carbon Emissions Trading, approving pilot carbon trading programs in Beijing, Tianjin, Shanghai, Chongqing, Hubei, Guangdong, and Shenzhen. These pilot regions successively launched their carbon emissions trading markets in 2013 and 2014. In 2016, Fujian Province was added to the pilot program as well. As firms in different regions participated in the ETS at different times, a multi-period DID design was utilized to evaluate the policy’s impact. If a firm is a regulated entity under the ETS policy implementation period, ETSi,t takes a value of 1.
(3) Control Variables. Xi,t represents the set of control variables. Following the studies of Cao, et al. [47] and Jia, Du, Chen, Lim and Cheng [9], the control variables include firm age (Age), firm profitability (ROA), leverage ratio (Lev), board size (BS), proportion of independent directors (Ind), nature of firm ownership (SOE), capital expenditure (Cap), and government environmental regulation (Reg). Industry and Year represent industry and year fixed effects, respectively. εi,t denotes the error term, α0 is the constant term, β1 is the coefficient of the key explanatory variable ETSi,t, and Σβ represents the coefficients of the control variables. To address potential issues of heteroskedasticity and serial correlation, robust standard errors are clustered at the firm level.
Regression Equation (4) tests the moderating effect of firms’ digital transformation on the ETS-carbon washing link.
(4) Corporate Digital Transformation (DTi,t). One of the most commonly used methods in academia to measure corporate digital transformation is the dictionary-based approach, which involves counting the frequency or proportion of digital technology-related keywords in the annual reports of listed companies [9]. However, the dictionary method has recently faced criticism: ① the keyword dictionary may be incomplete and omit certain digital technology terms; ② it may incorrectly classify digital transformation by including keywords from negative statements, future plans, or industry background descriptions [6]. To address these limitations, JIN, ZUO, FANG, LI, and NIE [6] applied a machine learning approach to analyze the annual report texts of Chinese listed companies and determine whether a firm had adopted digital technologies. A value of 1 indicates adoption, and 0 indicates otherwise. This paper adopts the digital transformation indicator developed by JIN, ZUO, FANG, LI, and NIE [6].
is the key coefficient for testing whether corporate digital transformation moderates the relationship between the Emissions Trading Scheme and carbon washing. The other symbols are defined in Equation (1).
Table 1 presents the detailed variable definitions.

Table 1.
Variable definitions.
5. Empirical Results
5.1. Descriptive Statistics of Main Variables
Table 2 reports the descriptive statistics for the main variables. The mean value of carbon washing (CW) is 0.277, indicating a certain level of carbon washing behavior within the sampled enterprises. The arithmetic mean of corporate digital transformation (DT) is 0.633, suggesting that 63.3% of the dataset firms engaged in digital transformation. No significant anomalies were observed in the distributions of the other control variables. Winsorization at 1% was applied to continuous variables for outlier mitigation. Most correlation coefficients between variables were significant, with absolute values below 0.8. The largest variance inflation factor (VIF) is 1.53, well below the threshold of 10, and the mean VIF for all variables is 1.26 (below 2), indicating no severe multicollinearity issues in the model.
Table 2.
Descriptive statistics of the main variables.
5.2. DID Regression Results
Table 3 provides empirical support for H1. Whether or not control variables are included, we observe a significantly positive coefficient for ETS. The treatment variable (ETS) in Table 3 indicates that after a firm is included in the carbon emissions trading system, its level of carbon washing increases by an average of 0.409 units. This suggests a growing divergence between corporate carbon information disclosure and its actual carbon reduction performance, reflecting more strategic behavior, thus supporting Hypothesis H1.
Table 3.
DID baseline regression results.
5.3. Moderating Variable Regression Results
Table 4 provides empirical support for H2. The ETS×DT interaction term exhibits a statistically significant positive coefficient. The treatment variable (ETS×DT) in Table 4 indicates that when a firm is included in the carbon emission trading system, those undergoing digital transformation exhibit a level of carbon washing that is, on average, 0.25 units higher than non-transformed firms. This suggests that firms may use digital tools to exaggerate carbon information disclosure and conceal the gap between disclosed and actual carbon reduction, thereby intensifying carbon washing behavior. This finding supports Hypothesis H2.
Table 4.
The moderating effect of corporate digital transformation (DT).
5.4. Parallel Trend Test
Based on the parallel trend test depicted in Figure 2, using the year prior to the policy shock as the baseline, we find that all confidence intervals encompass zero in the pre-treatment period. No significant pre-policy group differences.
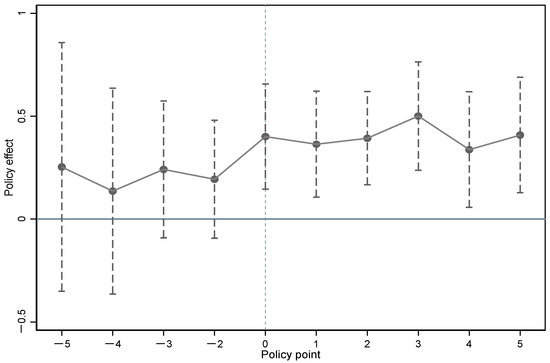
Figure 2.
Parallel trend test.
5.5. Placebo Test
Following the approach of Chen, Zhang, and Chen [23], Qing-feng [48], the original regulated (treatment) group of carbon-controlled enterprises is redefined as a new placebo control group. Keeping the original policy implementation year for regulated firms unchanged, if n firms were included in the carbon trading pilot in year t, n firms are randomly selected from the real control group to serve as a new placebo treatment group. Based on this reshuffled sample, Model (1) was re-estimated to complete one round of placebo testing. This process was repeated 1000 times, resulting in 1000 estimated coefficients for the interaction term ETS. As shown in Figure 3, after randomizing the treatment group, the mean of the estimated ETS coefficients was 0.0115, which was significantly below the Table 3 benchmark (0.409). Figure 3 shows that the estimated coefficients for the placebo treatment group are mostly distributed around zero, and most coefficients are insignificant (p > 0.1). The red vertical dashed line represents the actual baseline DID coefficient of 0.409, which appears to be a clear outlier relative to the distribution of placebo estimates from the 1000 repetitions. This indicates that the probability of obtaining the actual baseline coefficient purely by chance is extremely low, conclusively demonstrating that the ETS significantly intensifies carbon washing in regulated firms.
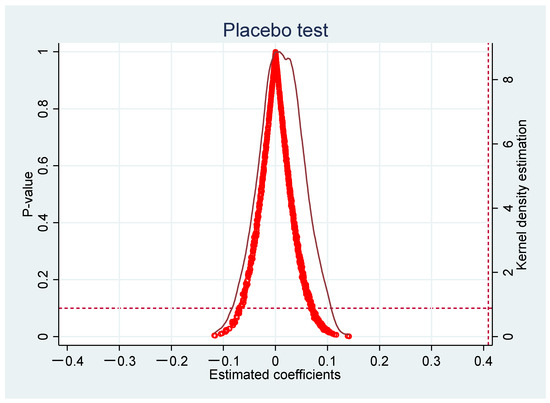
Figure 3.
Placebo test. Notes: The red vertical dashed line represents the actual baseline DID coefficient of 0.409.
5.6. Robustness Tests
5.6.1. Entropy Balance Method
To achieve the most accurate possible matching between the treatment and control groups, this study adopts the entropy balancing method proposed by Hainmueller [49], which ensures a multidimensional balance of covariates between the treated and control samples. Specifically, we applied entropy balancing to the control variables in Model (1). The generated weights are then used to reweight the data, and the weighted data are applied to Model (1). The key coefficients are tabulated in Column (1) of Table 5, showing that the positive impact of the carbon emissions trading scheme on corporate carbon washing behavior remains statistically significant.
Table 5.
Robustness test.
5.6.2. Replacement of the Explained Variable
The explained variable, carbon washing, was recalculated using Equation (5) and standardized using the min-max normalization method. The recalculated carbon washing variable was then applied to Model (1). Refer to Table 5, Column (2) for the core regression outputs, showing that the positive impact of the carbon emissions trading scheme on corporate carbon washing behavior remains statistically significant.
We replace carbon emissions in Equation (2) with carbon emission intensity to calculate the level of corporate carbon washing, and the regression result remains significantly positive (Table 5, Column 3). Carbon emission intensity is defined as a firm’s total carbon emissions divided by its operating revenues.
5.6.3. Inclusion of Higher-Order Interaction Term “Industry × Year”
To control for the heterogeneous shocks from the joint variation of industry and time, we include interaction terms between industry fixed effects and year fixed effects in Model (1). Column (4) of Table 5 confirms the estimation robustness: the inclusion of industry × year fixed effects yields coefficients statistically congruent with the baseline specifications at conventional levels.
5.6.4. Excluding the Impact of the COVID-19 Pandemic
To mitigate the potential impact of the COVID-19 pandemic on firms’ financial indicators, we restrict the sample period to 2011–2019 and re-estimate Regression Model (1). The carbon washing response to ETS remains precisely estimated and positive (Table 5, Column 5), a finding robust to all specification checks.
5.6.5. Firm Fixed Effect
To deal with omitted variable concerns related to time-invariant firm-specific characteristics, this paper employs firm fixed effects and year fixed effects in the regression model (1). The regression results remain significant (Table 5, Column 6).
5.6.6. Heterogeneous Treatment Effect Tests
To mitigate the impact of heterogeneous policy effects across treatment periods on the regression results, this research implements the Goodman-Bacon decomposition method [50]. As shown in Table 6, the average treatment effect (ATE) derived from the difference-in-differences (DID) estimator comprises three distinct components. Our results indicate that the ATE is predominantly driven by two components: (1) Treatment vs. Never-Treated Groups (weight = 0.583) and (2) Earlier-Treated vs. Later-Comparison Groups (weight = 0.412). The potentially biased component, Later-Treated vs. Earlier-Comparison Groups, carries a negligible weight of merely 0.005. Crucially, the decomposition reveals no evidence of negative weights, precluding significant bias in the baseline estimates.
Table 6.
Goodman-Bacon decomposition.
To address potential biases in estimates due to treatment effect heterogeneity, Borusyak et al. [51] proposed an imputation method that remains valid under any weighting scheme. Column (7) of Table 5 reports the average treatment effect on corporate carbon washing using this method. The results show a positive and statistically significant effect, further demonstrating the robustness of our results.
5.7. Policy Uniqueness Test
Controlling for overlapping environmental initiatives, the Low-Carbon City Pilot is operationalized as a binary regressor (Carbon City = 1 if the firm is in the pilot city in the current year). This controls for simultaneous policy shocks that might contaminate carbon washing measurements. After accounting for contamination via the Carbon City indicator (Table 7, Col. 1), the ETS coefficient remains unchanged from the baseline specifications. Similarly, we control for the Environmental Protection Tax via a binary indicator, Tax, which takes the value of 1 for heavily polluting industries from 2018 onward (0 otherwise). This mitigates the concurrent policy shocks in the baseline regressions. As shown in Table 7, Column (2), the regression outputs, after excluding the interference of the Environmental Protection Tax Policy, are similar to those of the baseline regression. Similarly, we control for the Green Financial Regulatory Policy via a binary indicator, Finance, which takes 1 for heavily polluting industries from 2016 onward (0 otherwise). After excluding the interference of the Green Financial Regulatory Policy, the regression results remained positive and significant (Table 7, Col.3).
Table 7.
Policy uniqueness test.
6. Mechanism Analysis and Economic Consequence Analysis
6.1. Mechanism Analysis
Environmental regulations increase firms’ operating costs, while the costs of green and low-carbon investments require a long time to be reflected in firms’ economic and environmental performance. To maintain legitimacy, protect their reputation and image, and gain benefits from the capital market, firms may choose strategic, low-cost environmental governance behavior, namely, carbon washing. PC refers to the ratio of operating costs to operating revenue. The results in Table 8 (Columns 1 and 2) confirm that the carbon emissions trading system increases the production costs (PC) of regulated firms, thereby leading to an increase in their carbon washing behavior.
Table 8.
Mechanism Analysis.
6.2. Economic Consequence Analysis
Firms engage in carbon washing to gain legitimacy and maintain their reputation and image, which may allow them to obtain opportunistic benefits in the capital market. WACC refers to the weighted average cost of capital. The table below demonstrates that carbon washing reduces firms’ capital costs (WACC), indicating that firms have gained opportunistic benefits from the capital market (Table 9, Col. 1).
Table 9.
Economic Consequence Analysis.
7. Further Analysis: The Moderating Effects of Government Environmental Subsidies, Media Supervision, and Public Environmental Concern
The previous analysis confirmed the positive impact of the ETS and digital transformation on corporate carbon washing. From the perspective of external supervision and governance, this section examines whether such mechanisms can mitigate the side effects of the ETS on firms. Specifically, it analyzes the moderating effects of government environmental subsidies, media supervision, and public environmental concern on the relationship between the carbon emissions trading system and corporate carbon-washing behavior.
GES refers to government environmental subsidies. Following Li [52], this study defines government environmental subsidies as government grants containing keywords such as “environmental governance,” “environmental protection,” “energy saving,” and “emission reduction” in the detailed subsidy descriptions. Two measures are used to quantify government environmental subsidies: GES1, the relative environmental subsidy adjusted by total operating revenue, and GES2, the log-transformed environmental subsidy.
Columns (1) and (2) of Table 10 demonstrate that government environmental subsidies (ETS × GES1, ETS × GES2) significantly negatively moderate the ETS-CW relationship. This suggests that government environmental subsidies can mitigate firms’ strategic environmental governance behavior in response to regulatory pressure. According to the resource dependence theory, firms that “comply” with government institutions are more likely to obtain resources from the government. Enterprises receiving government subsidies tend to rely on the government and adjust their resource allocation to meet environmental requirements, thereby enhancing their legitimacy [52]. Moreover, government environmental subsidies can help alleviate the financial burden of carbon-reduction investments and promote more substantive environmental actions. In summary, government environmental subsidies can reduce firms’ carbon-washing behavior under environmental regulatory pressure.
Table 10.
The moderating effects of government environmental subsidies, media supervision, and public environmental concerns.
Following Clarkson et al. [53], this paper constructs a media monitoring index based on the Janis-Fadner coefficient (J-F), as shown in Equation (6):
where e represents the number of positive media reports, c represents the number of negative media reports, and t represents the total number of positive and negative reports. The J-F index is bounded on [−1, 1], with values asymptotically approaching 1 under increasingly favorable media coverage conditions. When negative coverage dominates, it approaches −1. Media denotes media supervision.
As shown in Column (3) of Table 10, media supervision (ETS × Media) negatively moderates the relationship between ETS and corporate carbon-washing behavior. Positive media coverage can mitigate firms’ strategic environmental governance behavior under regulatory pressure. According to impression management theory, negative media coverage can trigger a firm’s impression motivation, prompting it to take actions to protect its reputation and image through impression construction [54]. Consequently, in response to negative media coverage, firms may use carbon information disclosure to fulfill corporate social responsibility and construct a green and low-carbon image, thereby increasing carbon washing behavior. Conversely, when a firm receives more positive coverage, its motivation to engage in impression management to maintain a green and low-carbon reputation is weaker, resulting in less exaggeration or selective disclosure of carbon management information. Therefore, positive media coverage can reduce carbon-washing behavior under environmental regulatory pressure.
Jiang et al. [55] used the monthly search volume index (SVI) on “global warming” from Google Trends to measure public concern about climate issues. Public environmental concern is proxied by the annual mean Baidu Index search volume for ‘environmental pollution’ (EPSVI).
As shown in Column (4) of Table 10, the ETS × EPSVI interaction fails to significantly moderate the association between the emissions trading scheme and corporate carbonwashing. This suggests that public oversight is limited in its effectiveness in curbing corporate carbon-washing behavior. The main reason for this is the significant information asymmetry between the public and corporations, as the public lacks the professional knowledge required to determine whether a firm is engaging in carbon washing.
8. Conclusions and Recommendations
Based on an unbalanced panel dataset of A-share companies listed in Shanghai and Shenzhen from 2011 to 2020, this study explores the interaction between regulatory frameworks and internal corporate factors, revealing the unintended consequences of environmental regulation and corporate digital transformation. The findings show that the Emissions Trading Scheme (ETS) promotes carbon washing behavior among regulated enterprises, providing empirical support for legitimacy and fraud triangle theories. When faced with environmental regulatory pressure, firms may strategically choose low-cost “carbon washing” behaviors to conform to institutional expectations, reduce compliance costs, and maintain their reputation and image in the eyes of their stakeholders. Published research has largely emphasized the positive effects of digital transformation [7,56], and this study uncovers its dark side. Specifically, digital transformation intensifies the positive impact of the ETS on carbon-washing behavior among regulated firms. The digital divide and information asymmetry between digitally transformed firms and their non-digital peers, governments, and the public create conditions conducive to opportunistic behaviors. Mechanism analysis confirms that the carbon emissions trading system increases the production costs of regulated firms, thereby increasing their carbon washing behavior. Economic consequence analysis confirms that firms engage in carbon washing to gain legitimacy and maintain their reputation and image, which may allow them to obtain opportunistic benefits from the capital market.
Building on these empirical insights, we propose the following:
First, the unintended consequences of environmental regulations on firms should not be ignored. Therefore, the government needs to introduce complementary policy tools to regulate corporate carbon information disclosures. Given the long cycle, high risk, and substantial investment required for green and low-carbon transformation, the government should increase environmental subsidies to ensure that firms undertaking low-carbon transitions have sufficient funding to carry out substantive carbon-reduction activities, thereby reducing low-cost, strategic carbon-governance behaviors. At the same time, a standardized and mandatory carbon disclosure framework with a penalty mechanism should be established. A national-level blockchain platform for carbon information should be developed, requiring enterprises to upload fundamental data such as fossil energy procurement and consumption, electricity purchases, and production logs to achieve traceable and verifiable carbon emissions data. Carbon disclosure must undergo independent third-party audits and certifications. Enterprises engaging in carbon washing behavior should face financial penalties, be disqualified from preferential green and low-carbon transition policies, and be required to return any subsidies received.
Second, positive media coverage can alleviate firms’ strategic environmental governance behaviors under environmental regulatory pressure. The external supervision role of the media can be leveraged to constrain corporate carbon washing, promote consistency between corporate rhetoric and action, and help achieve a genuine low-carbon transformation.
Third, while the advantages of digital transformation are undeniable, only by recognizing its dark side can its positive role be better utilized. The government should support organizations that are at a disadvantage in digital transformation to actively adopt digital strategies and narrow the gap with digitally advanced companies. This will help reduce opportunistic behavior among digitally transformed enterprises. The government itself should also leverage digital tools to promote the development of a digital government and enhance its capacity for environmental regulation through digital technologies. For example, blockchains can be used to secure carbon emission monitoring data against tampering. An AI-driven system should be established to detect the carbon washing behavior. Additionally, AI risk assessment models can be developed to conduct semantic analyses of corporate carbon disclosure reports and compare them with data from IoT-based monitoring systems. If inconsistencies are detected, high-risk alerts and audit investigations can be initiated. For instance, if a company claims in its carbon disclosure that it has adjusted its energy consumption structure and increased the proportion of renewable energy used, but the system identifies an increase in fossil energy procurement and consumption with no corresponding rise in renewable energy usage, it will trigger a red flag.
Finally, our study offers a warning to rapidly developing emerging economies, especially those with underdeveloped environmental information disclosure systems, and the need to reconcile economic development and ecological stewardship. These countries should focus intently on the financial pressures and potential misconduct that environmental regulatory pressure may impose on firms and remain vigilant against opportunistic behavior arising from uneven development in digital capabilities.
9. Constraints and Scope for Further Study
In terms of data measurement, due to the lack of verified corporate carbon emissions data, we currently use an indirect calculation method to estimate firms’ carbon emissions. In the future, when more comprehensive and verified carbon emission data become available, carbon washing can be measured using data that have been independently audited by third parties. The current digital transformation indicator is a binary variable; in the future, machine learning methods can be applied to construct more heterogeneous indicators to better capture the differences in digital transformation across firms.
In terms of research topics, future studies could explore the mechanisms through which digital transformation facilitates corporate carbon washing. For example, whether firms with digital advantages exacerbate information asymmetry among stakeholders. Additionally, further research could investigate the economic consequences of carbon washing and identify which types of stakeholders can detect such behavior, thereby reducing firms’ ability to gain opportunistic benefits.
Author Contributions
Conceptualization, Y.W. and C.L.; methodology, Y.W. and C.L.; software, Y.W.; validation, C.L.; formal analysis, Y.W. and C.L.; data curation, Y.W.; writing—original draft preparation, Y.W.; writing—review and editing, C.L. All authors have read and agreed to the published version of the manuscript.
Funding
This research received no external funding.
Data Availability Statement
Data are contained within the article. If you require further information, please contact the author by email.
Conflicts of Interest
The authors declare no conflicts of interest.
Note
| 1 | China Greenwashing Watchlist (2023–2024). Available online: https://weibo.com/ttarticle/p/show?id=2309405065176218206566 (accessed on 30 April 2025). |
References
- Desai, R. Determinants of corporate carbon disclosure: A step towards sustainability reporting. Borsa Istanb. Rev. 2022, 22, 886–896. [Google Scholar] [CrossRef]
- Grauel, J.; Gotthardt, D. The relevance of national contexts for carbon disclosure decisions of stock-listed companies: A multilevel analysis. J. Clean. Prod. 2016, 133, 1204–1217. [Google Scholar] [CrossRef]
- Marquis, C.; Toffel, M.W.; Zhou, Y. Scrutiny, Norms, and Selective Disclosure: A Global Study of Greenwashing. Organ. Sci. 2016, 27, 483–504. [Google Scholar] [CrossRef]
- Yang, Z.; Nguyen, T.T.H.; Nguyen, H.N.; Nguyen, T.T.N.; Cao, T.T. Greenwashing Behaviours: Causes, Taxonomy and Consequences Based on a Systematic Literature Review. J. Bus. Econ. Manag. 2020, 21, 1486–1507. [Google Scholar] [CrossRef]
- Yu, E.P.-y.; Luu, B.V.; Chen, C.H. Greenwashing in environmental, social and governance disclosures. Res. Int. Bus. Financ. 2020, 52, 101192. [Google Scholar] [CrossRef]
- Jin, X.; Zuo, C.; Fang, M.; Li, T.; Nie, H. Measurement Problem of Enterprise Digital Transformation: New Methods and Findings Based on Large Language Models. Econ. Res. 2024, 59, 34–53. [Google Scholar]
- Lu, Z.; Lin, Y.; Li, Y. Does corporate engagement in digital transformation influence greenwashing? Evidence from China. Financ. Res. Lett. 2023, 58, 104558. [Google Scholar] [CrossRef]
- Sarkis, J.; Kouhizadeh, M.; Zhu, Q.S. Digitalization and the greening of supply chains. Ind. Manag. Data Syst. 2020, 121, 65–85. [Google Scholar] [CrossRef]
- Jia, F.; Du, K.; Chen, L.; Lim, M.K.; Cheng, Y. The Side Effects of Corporate Digitalization on Corporate Social Responsibility: A Fraud Triangle Perspective. Br. J. Manag. 2025, 36, 1360–1373. [Google Scholar] [CrossRef]
- Son, B.-G.; Kim, H.; Hur, D.; Subramanian, N. The dark side of supply chain digitalisation: Supplier-perceived digital capability asymmetry, buyer opportunism and governance. Int. J. Oper. Prod. Manag. 2021, 41, 1220–1247. [Google Scholar] [CrossRef]
- Delmas, M.A.; Burbano, V.C. The Drivers of Greenwashing. Calif. Manag. Rev. 2011, 54, 64–87. [Google Scholar] [CrossRef]
- Cao, J.; Huang, Z.; Shahid, A.U. Fostering environmental integrity via investor-focused communications: Private in-house meeting disclosures and greenwashing behaviors. J. Econ. Behav. Organ. 2025, 232, 106946. [Google Scholar] [CrossRef]
- Bilicka, K.; Casi, E.; Seregni, C.; Stage, B.M.B. Tax Strategy Disclosure: A Greenwashing Mandate? J. Account. Res. 2025. [Google Scholar] [CrossRef]
- Zhang, D. Green financial system regulation shock and greenwashing behaviors: Evidence from Chinese firms. Energy Econ. 2022, 111, 106064. [Google Scholar] [CrossRef]
- Zhang, G. Regulatory-driven corporate greenwashing: Evidence from “low-carbon city” pilot policy in China. Pac.-Basin Financ. J. 2023, 78, 101951. [Google Scholar] [CrossRef]
- Hu, S.; Wang, A.; Du, K. Environmental tax reform and greenwashing: Evidence from Chinese listed companies. Energy Econ. 2023, 124, 106873. [Google Scholar] [CrossRef]
- Wang, J.; Ke, Y.; Sun, L.; Liu, H. Speculative culture and corporate greenwashing: Evidence from China. Int. Rev. Financ. Anal. 2024, 95, 103447. [Google Scholar] [CrossRef]
- Zhang, D.; Guo, Y.; Vigne, S.A. Does family culture hamper corporate deceptive green behavior decision-making? J. Econ. Behav. Organ. 2024, 228, 106812. [Google Scholar] [CrossRef]
- Sun, Z.; Liu, L.; Johan, S.; Zhao, L. FinTech Adoption and Corporate Greenwashing: A Technology Affordance Perspective. Br. J. Manag. 2024, 36, 978–1002. [Google Scholar] [CrossRef]
- Hao, X.; Miao, E.; Wen, S.; Wu, H.; Xue, Y. Executive Green Cognition on Corporate Greenwashing Behavior: Evidence From A-Share Listed Companies in China. Bus. Strategy Environ. 2024, 34, 2012–2034. [Google Scholar] [CrossRef]
- Liu, J.-Y.; Woodward, R.T.; Zhang, Y.-J. Has Carbon Emissions Trading Reduced PM2.5 in China? Environ. Sci. Technol. 2021, 55, 6631–6643. [Google Scholar] [CrossRef] [PubMed]
- Deng, H.; Zhang, W.; Liu, D. Does carbon emission trading system induce enterprises’ green innovation? J. Asian Econ. 2023, 86, 101597. [Google Scholar] [CrossRef]
- Chen, Z.; Zhang, X.; Chen, F. Do carbon emission trading schemes stimulate green innovation in enterprises? Evidence from China. Technol. Forecast. Soc. Change 2021, 168, 120744. [Google Scholar] [CrossRef]
- Sun, Y.; Shen, S.; Zhou, C. Does the pilot emissions trading system in China promote innovation? Evidence based on green technology innovation in the energy sector. Energy Econ. 2023, 126, 106984. [Google Scholar] [CrossRef]
- Ni, X.; Jin, Q.; Huang, K. Environmental regulation and the cost of debt: Evidence from the carbon emission trading system pilot in China. Financ. Res. Lett. 2022, 49, 103134. [Google Scholar] [CrossRef]
- Long, W.; Qu, X.; Yin, S. How does carbon emissions trading policy affect accrued earnings management in corporations? Evidence from China. Financ. Res. Lett. 2023, 55, 103840. [Google Scholar] [CrossRef]
- Song, M.; Zheng, H.; Shen, Z. Whether the carbon emissions trading system improves energy efficiency–Empirical testing based on China’s provincial panel data. Energy 2023, 275, 127465. [Google Scholar] [CrossRef]
- Wu, Q.; Wang, Y. How does carbon emission price stimulate enterprises’ total factor productivity? Insights from China’s emission trading scheme pilots. Energy Econ. 2022, 109, 105990. [Google Scholar] [CrossRef]
- Zhang, S.; Cheng, L.; Ren, Y.; Yao, Y. Effects of carbon emission trading system on corporate green total factor productivity: Does environmental regulation play a role of green blessing? Environ. Res. 2024, 248, 118295. [Google Scholar] [CrossRef] [PubMed]
- Niu, X.; Zhang, Y.; Li, B.; Chen, Z.; Ni, G.; Lyu, N. How does carbon emission trading scheme affect enterprise market value? A roadmap towards natural resources sustainability. Resour. Policy 2024, 88, 104542. [Google Scholar] [CrossRef]
- Xu, Q.; Li, X.; Guo, F. Digital transformation and environmental performance: Evidence from Chinese resource-based enterprises. Corp. Soc. Responsib. Environ. Manag. 2023, 30, 1816–1840. [Google Scholar] [CrossRef]
- Bendig, D.; Schulz, C.; Theis, L.; Raff, S. Digital orientation and environmental performance in times of technological change. Technol. Forecast. Soc. Change 2023, 188, 122272. [Google Scholar] [CrossRef]
- Yu, C.; Xiang, L.; Hanli, H.; Guangyu, W.; Shouyang, W. How Does Digitalization Promote Green Transformation in Manufacturing Enterprises?—An Exploratory Case Study from the Perspective of Resource Orchestration Theory. Manag. World 2023, 39, 96–112+126+113. [Google Scholar]
- Zhang, K.; Ahmed, B.; Wang, R.; Gu, B. The Influence of Internal Governance and External Legitimacy on Greenwashing: A Digitalization Perspective. Environ. Dev. Sustain. 2023, 27, 4881–4909. [Google Scholar] [CrossRef]
- Xu, T.; Sun, Y.; He, W. Government digitalization and corporate greenwashing. J. Clean. Prod. 2024, 452, 142015. [Google Scholar] [CrossRef]
- Jun, H.; Qi, F.; Wenbin, L. Carbon Emission Regulation, Corporate Emission Reduction Incentives, and Total Factor Productivity: A Natural Experiment Based on China’s Emissions Trading Scheme. Econ. Res. J. 2023, 58, 77–94. [Google Scholar]
- Suchman, M.C. Managing Legitimacy: Strategic and Institutional Approaches. Acad. Manag. Rev. 1995, 20, 571–610. [Google Scholar] [CrossRef]
- DiMaggio, P.J.; Powell, W.W. The Iron Cage Revisited: Institutional Isomorphism and Collective Rationality in Organizational Fields. Am. Sociol. Rev. 1983, 48, 147–160. [Google Scholar] [CrossRef]
- Meyer, J.W.; Rowan, B. Institutionalized Organizations: Formal Structure as Myth and Ceremony. Am. J. Sociol. 1977, 83, 340–363. [Google Scholar] [CrossRef]
- Neu, D.; Warsame, H.; Pedwell, K. Managing Public Impressions: Environmental Disclosures in Annual Reports. Account. Organ. Soc. 1998, 23, 265–282. [Google Scholar] [CrossRef]
- Kurpierz, J.R.; Smith, K. The greenwashing triangle: Adapting tools from fraud to improve CSR reporting. Sustain. Account. Manag. Policy J. 2020, 11, 1075–1093. [Google Scholar] [CrossRef]
- Duchin, R.A.N.; Gao, J.; Xu, Q. Sustainability or Greenwashing: Evidence from the Asset Market for Industrial Pollution. J. Financ. 2024, 80, 699–754. [Google Scholar] [CrossRef]
- Dayuan, L.; Xiaolin, J.; Linna, X. A Review and Prospect of Research on Corporate Greenwashing Behavior. Foreign Econ. Manag. 2015, 37, 86–96. [Google Scholar]
- Liu, Z.; Zhang, N. The productivity effect of digital financial reporting. Rev. Account. Stud. 2023, 29, 2350–2390. [Google Scholar] [CrossRef]
- Gangqiang, Y.; Haisen, W.; Ziyang, Y.; Gang, L. Customer Digital Transformation, Supplier Carbon Emission Reduction, and Carbon Disclosure Catering. China Ind. Econ. 2024, 99–117. [Google Scholar] [CrossRef]
- Zhu, B.; Zhao, Y. Carbon risk and the cost of bank loans: Evidence from China. Technol. Forecast. Soc. Change 2022, 180, 121741. [Google Scholar] [CrossRef]
- Cao, J.; Huang, Z.; Kristanto, A.B. Brightening the Dark Side of Environmental Regulation: Evidence from Green Revenues and Greenwashing Behaviors. J. Int. Account. Res. 2025, 1–34. Available online: https://publications.aaahq.org/ (accessed on 30 April 2025). [CrossRef]
- Qing-feng, C. Driving Effects of National New Zone on Regional Economic Growth—Evidence from 70 Cities of China. China Ind. Econ. 2020, 7, 43–60. [Google Scholar]
- Hainmueller, J. Entropy Balancing for Causal Effects: A Multivariate Reweighting Method to Produce Balanced Samples in Observational Studies. Political Anal. 2012, 20, 25–46. [Google Scholar] [CrossRef]
- Goodman-Bacon, A.A. Difference-in-differences with variation in treatment timing. J. Econom. 2021, 225, 254–277. [Google Scholar] [CrossRef]
- Borusyak, K.; Jaravel, X.; Spiess, J. Revisiting Event-Study Designs: Robust and Efficient Estimation. Rev. Econ. Stud. 2024, 91, 3253–3285. [Google Scholar] [CrossRef]
- Li, W. Why Does Government Environmental Protection Subsidy Induce Deviate Behavior of Green Governance?—From the Perspective of Resource Dependence Theory. Account. Res. 2024, 138–149. Available online: http://www.asc.net.cn/ (accessed on 30 April 2025).
- Clarkson, P.M.; Li, Y.; Richardson, G.D.; Vasvari, F.P. Revisiting the relation between environmental performance and environmental disclosure: An empirical analysis. Account. Organ. Soc. 2008, 33, 303–327. [Google Scholar] [CrossRef]
- Jiang, W. Negative Media Coverage, Impression Management and Strategic Environmental Governance. Account. Res. 2023, 11, 150–162. [Google Scholar]
- Jiang, W.; Gao, Z.; Choi, D.; Karolyi, A. Attention to Global Warming. Rev. Financ. Stud. 2020, 33, 1112–1145. [Google Scholar]
- Lin, B.; Zhang, Q. Corporate environmental responsibility in polluting firms: Does digital transformation matter? Corp. Soc. Responsib. Environ. Manag. 2023, 30, 2234–2246. [Google Scholar] [CrossRef]


Disclaimer/Publisher’s Note: The statements, opinions and data contained in all publications are solely those of the individual author(s) and contributor(s) and not of MDPI and/or the editor(s). MDPI and/or the editor(s) disclaim responsibility for any injury to people or property resulting from any ideas, methods, instructions or products referred to in the content. |
© 2025 by the authors. Licensee MDPI, Basel, Switzerland. This article is an open access article distributed under the terms and conditions of the Creative Commons Attribution (CC BY) license (https://creativecommons.org/licenses/by/4.0/).