Article

The Structure and Driving Mechanisms of the Departmental Collaborative Network in Primary-Level Social Risk Prevention and Control: A Network Study of J City, China

1
School of Public Administration, Central China Normal University, Wuhan 430079, China
2
College of Public Administration, Huazhong Agricultural University, Wuhan 430070, China
*
Author to whom correspondence should be addressed.
Systems 2025, 13(8), 617; https://doi.org/10.3390/systems13080617
Submission received: 4 June 2025 / Revised: 11 July 2025 / Accepted: 16 July 2025 / Published: 22 July 2025
(This article belongs to the Section Systems Practice in Social Science)

Abstract

Primary-level social risk prevention and control is a complex, systemic endeavor that requires close cooperation among various local government departments. Within this context, addressing bureaucratic segmentation and strengthening interdepartmental collaboration are critical issues in primary-level social risk governance. This study uses social network analysis and the exponential random graph model to examine the collaborative network structure and driving mechanisms among government departments engaged in risk prevention, with J City as a network study. The findings reveal that (1) while a collaborative governance framework exists, the network has low overall density, strong localized clustering, and a clear core-periphery structure, indicating the need for improved coordination and more refined collaborative mechanisms; (2) the formation of the risk prevention network is influenced by both endogenous structural factors and exogenous actor attributes. Endogenously, reciprocity and transitivity play significant roles in tie formation; exogenously, departments with similar resource mobilization capacities are more likely to collaborate, while those with strong communication, digital technology, and resource mobilization capabilities are more likely to initiate collaborations, and those with high communication capacity are more likely to accept collaborative offers. This study offers insights into the dynamics and formation mechanisms of departmental collaborative networks in primary-level social risk governance.

1. Introduction

Primary-level social risk prevention and control constitutes a vital component for ensuring the long-term stability and sustainable development of local communities, playing a significant role in enhancing national governance capacity, strengthening societal resilience, and safeguarding public welfare [1]. In recent years, China has entered a period characterized by the coexistence of strategic opportunities and emerging risk challenges, marked by an increasing number of unpredictable “black swan” and “gray rhino” events [2]. Contemporary social risks exhibit complex features of diversity, overlap, concealment, and persistence, collectively forming what may be termed a “risk complex” [3]. Beyond objective constraints such as inadequate infrastructure resilience and limited sophistication of risk monitoring and early warning systems [4], inefficiencies and fragmentation of bureaucratic structures—manifested in overlapping mandates, information silos, and decentralized decision-making—have further undermined interdepartmental coordination in risk governance [5]. Together, these factors impose unprecedented strains on local governments’ capacity to manage complex, cross-cutting social threats [6].
Social risks do not occur in isolation but are rooted in the deep-seated contradictions of social development, typically emerging from the interplay of multiple interdependent factors [7]. Any natural disaster, accident, or public crisis can trigger broader social risks; these “spillover effects” frequently transcend temporal, administrative, and functional boundaries, exhibiting chain-reaction and systemic coupling dynamics [8]. Moreover, risk prevention and control encompass multiple stages—including identification and assessment, monitoring and early warning, emergency mitigation, and response management—whose combined complexity far exceeds the capacity of any single government department [9]. Consequently, effective risk governance can no longer rely on the independent intervention of a solitary department. Under the traditional bureaucratic paradigm, segmented divisions of responsibility and barriers to information flow among departments have severely constrained the efficacy of risk responses [10]. Therefore, dismantling fragmented bureaucratic boundaries and cultivating integrated, cross-departmental networks become imperative for effective governance [11]. This reality necessitates dismantling fragmented governance structures and establishing efficient cross-departmental collaborative networks, integrating discrete units into a cohesive and multidimensional governance framework.
Compared to research on interdepartmental network structures in other domains, studies focusing on primary-level social risk governance remain limited. If constructing an efficient collaborative network among departments represents a viable pathway to address complex risk challenges, then what structural features characterize the existing collaborative governance network of local government departments? What are the principal driving forces behind its formation? Addressing these questions will facilitate the improvement of collaborative governance mechanisms, enhancing both the effectiveness of primary-level departmental networks and overall social risk governance.

2. Literature Review

With the advent of the risk society and the increasing frequency of emergent crises, individuals are continually exposed to a variety of hazards [12]. Scholars have conceptualized risk governance as a multi-level, polycentric process combining state, market, and civil society actors [13]. Within this paradigm, effective management of “risk complexes” requires horizontal integration across bureaucratic silos and vertical linkages among policy scales. Risk governance exhibits complex couplings among multiple actors, problems, and objectives, rendering the authority and capacity of any single entity insufficient to meet contemporary societal and public service demands [14]. Therefore, effective social risk prevention and control necessitates the reinforcement of close collaboration among actors across different organizational tiers and departments. Within the Chinese governmental system, interdepartmental collaboration is a common organizational phenomenon in which two or more functional departments leverage coordination mechanisms to clarify chains of responsibility, share information and resources, and jointly manage complex governance tasks [15]. The resulting departmental collaborative network refers to the interconnected relational structure that emerges from these collaborative processes.
Contemporary scholarship on interdepartmental collaborative networks in government primarily adopts two perspectives. First, some studies treat local government collaborative networks as the dependent variable, focusing on the mechanisms driving network formation, the genesis of specific structural features, and the evolution of these configurations. For example, Zhang and Tao (2021) compared interdepartmental cooperation networks across three public health emergencies, demonstrating that as the complexity of events and the sophistication of response mechanisms increase, interorganizational collaboration at the network level intensifies and becomes more balanced, while core organizations at the individual network level expand their scale and diversify their functions [16]. Similarly, Yan et al. (2021) analyzed structural holes and cohesive subgroups within 300 cross-departmental water governance networks, confirming the absolute hub status of river chief offices in these collaborative arrangements [17]. Second, other research regards departmental collaborative networks as independent variables to examine how network structures influence specific outcomes. For instance, Huang et al. (2020) collected data on 41 local government water governance cooperation networks and employed spatial regression models to investigate how network characteristics at the organizational level promote policy actor performance [18].
Overall, while scholars both domestically and internationally have made significant strides in studying local government interdepartmental collaborative networks, there remains a paucity of quantitative characterization and empirical validation of the structural features of departmental collaborative networks in risk prevention and control, as well as an exploration of the key drivers of such governance networks. Given that networks constitute complex systems, analyses that focus solely on local topological characteristics or that attribute network formation exclusively to individual actor attributes or dyadic relational features risk overlooking the joint influences of endogenous network structures and exogenous node attributes [19]. A comprehensive understanding of the emergence and driving mechanisms of interdepartmental collaboration thus requires a systemic perspective combined with advanced network-analytic methods to examine both the global and local structural properties of risk prevention collaborative networks and their underlying generative processes.
In this context, numerous studies have employed the exponential random graph model (ERGM) to address these challenges [20,21,22,23]. ERGM simulates the generative processes of networks and quantitatively estimates the probabilities of local structural configurations [24], thereby capturing proclivities for cross-departmental risk prevention collaboration. Moreover, ERGM can incorporate node attribute variables to statistically test the exogenous drivers of tie formation. Its explanatory power for network formation mechanisms lies in its capacity to simulate random graph realizations while jointly modeling endogenous and exogenous factors to elucidate causal relationships underlying global network structures. Exogenous mechanisms encompass the influence of actor attributes, whereas endogenous mechanisms reflect the social processes of network self-organization, wherein local structural motifs emerge through endogenous dynamics and facilitate subsequent tie formation [25]. ERGM treats the observed global network architecture as the aggregate outcome of numerous local processes; these local processes are represented by structural configurations—or “building blocks”—and accompanying attribute effects, thereby revealing the non-random generative patterns of network ties [26].

3. Theoretical Mechanisms and Research Hypotheses

This study leverages the strengths of the ERGM to address two central questions: the role of endogenous network structural features in the formation of collaborative ties and the joint influence of endogenous and exogenous factors on interdepartmental network formation. Unlike conventional regression models, ERGM offers a more nuanced framework that quantitatively assesses causal contributions of both structural dependencies and actor attributes and interprets macro-level network configurations through the statistical significance of micro-level endogenous terms [27]. This approach mitigates the risk of overstating or misattributing the effects of exogenous variables. Accordingly, this paper examines the collaborative network of social risk prevention departments within J City’s local government, employing social network analysis and ERGM to elucidate its structural characteristics and underlying driving mechanisms.

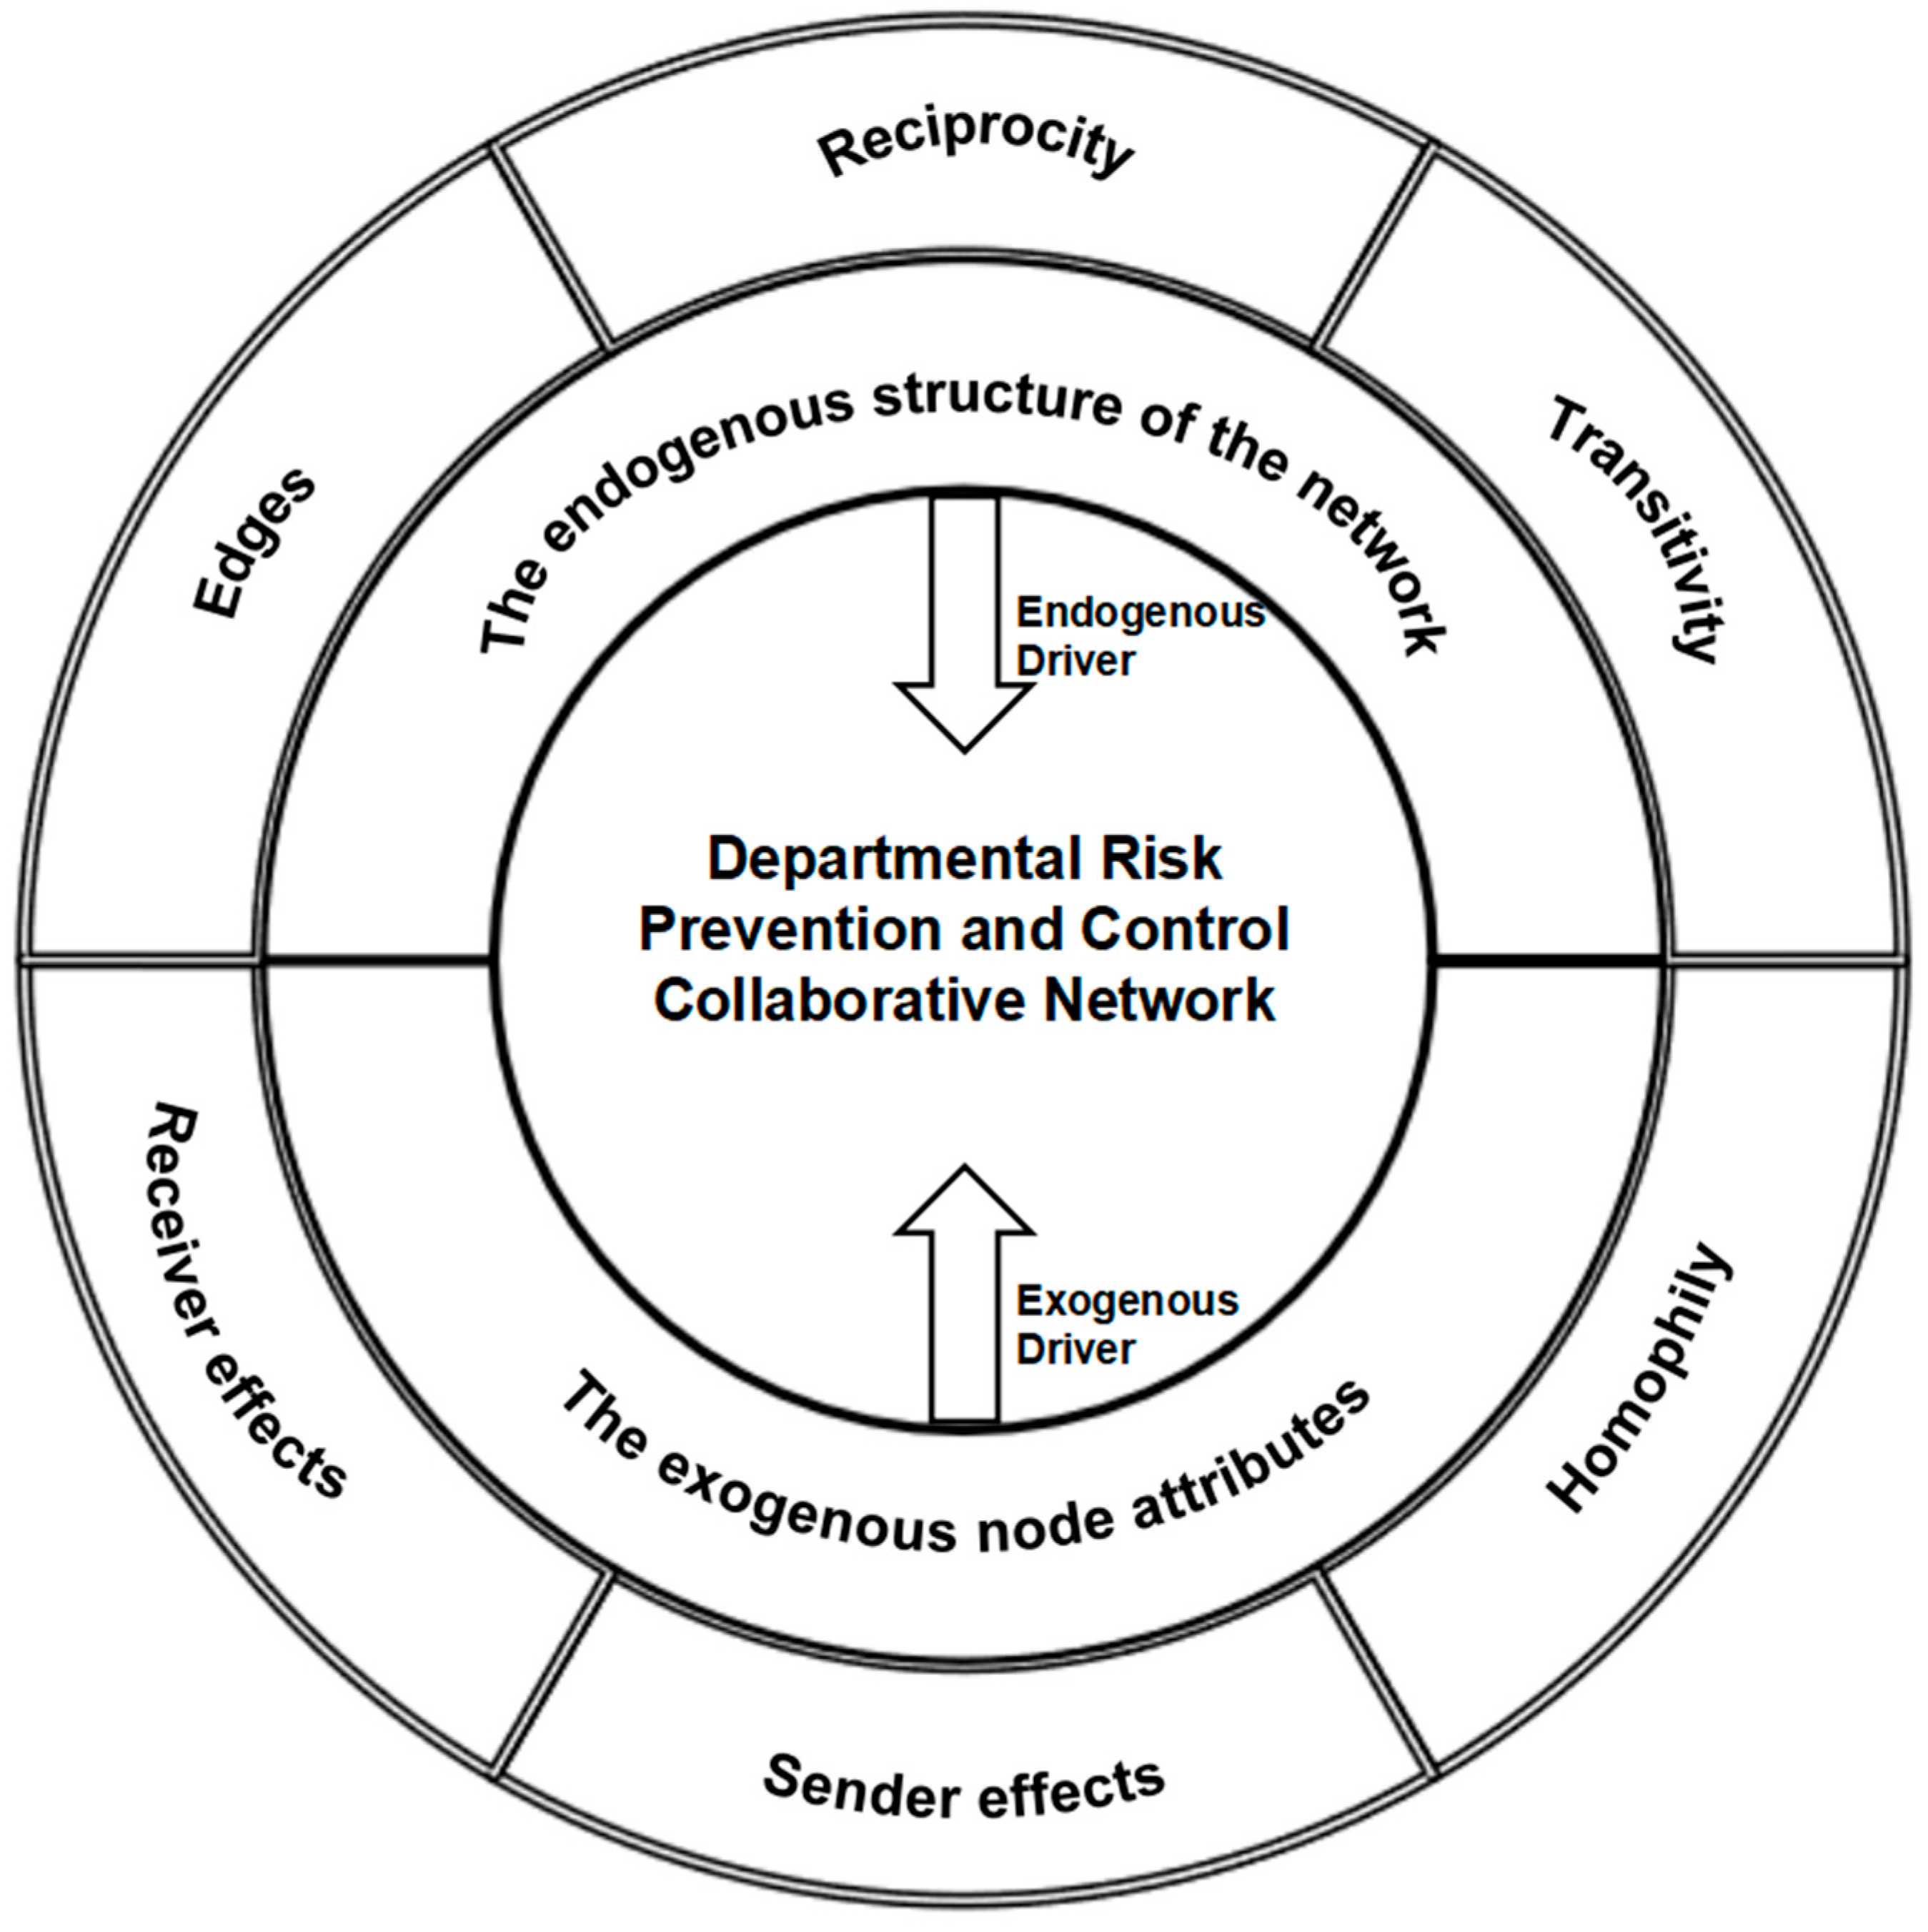
3.1. Effects of Endogenous Structures on the Collaborative Network

The principal distinction between the exponential random graph model and traditional inferential statistical methods lies in ERGM’s requirement to specify structural configurations that encapsulate the interdependencies among nodes within the network [26]. These endogenous structural terms are instrumental in furnishing a more comprehensive understanding and interpretation of the architecture and dynamics of complex networks, constituting the methodological core of the ERGM framework [28]. Drawing upon network theory and the theoretical underpinnings of ERGM specification, this study, beyond the fundamental edge term (Edges), concentrates on two localized network configurations—reciprocity and transitivity—to elucidate their respective effects on the formation of collaborative ties.

3.1.1. Reciprocity Effect

In seeking collaborative decision-making, primary-level government departments often select partners based on prior experiences of mutual support or the trust established through earlier cooperative engagements. Collaboration inherently incurs transaction costs, and effective joint decision-making relies on mutual understanding and trust; thus, choosing former collaborators reduces the costs of communication and negotiation and, on the basis of existing trust, facilitates smoother cooperation and enhances collaborative motivation [29]. Accordingly, Ostrom (2019) asserts that networks with high levels of reciprocity tend to exhibit more active and diverse cooperative relationships [30]. In this study, we include reciprocity as an endogenous term in the ERGM to capture actors’ propensity to “repay favors” through mutual support. A statistically significant reciprocity parameter would indicate that reciprocal ties play a critical role in shaping the collaborative network. Hence, we propose the following hypothesis:
H1. 
Reciprocity significantly influences the formation of ties within the departmental collaborative network for social risk prevention and control.

3.1.2. Transitivity Effect

In directed network analysis, the transitive closure effect—also operationalized as the geometrically weighted edgewise shared partner distribution (GWESP)—denotes that if two departments each collaborate with a common third department, the likelihood of a direct collaborative tie forming between them increases significantly [31]. This endogenous structural motif manifests at the macro level as clustering, facilitating the emergence of cohesive communities. Transitivity fosters direct collaboration among departments and serves as a core driving force for the formation of cohesive subgroups within the network, appearing structurally as triadic closure [32]. Its inherent reciprocity and establishment of shared trust consensus are necessary conditions for promoting synergistic development; they not only reduce communication and coordination costs but also gradually reinforce the trust foundation between actors, ensuring the sustained and healthy evolution of collaborative endeavors [33]. As indicated by the foregoing analysis, departments tend to coalesce into collaborative clusters, driving closure in the network’s connectivity. Therefore, we employ the GWESP parameter to quantify the influence of transitivity and propose the following hypothesis:
H2. 
Transitivity significantly influences the formation of ties within the departmental collaborative network for social risk prevention and control.

3.2. Effects of Exogenous Node Attributes on the Collaborative Network

The attribute characteristics of each department—such as resource endowments and latent capabilities—exert substantial influence on network formation, commonly referred to as node attribute effects or “actor–relation” effects. In the context of the directed collaborative network among risk prevention and control departments, node attribute effects primarily encompass sender effects, receiver effects, and homophily effects [34]. The sender effect measures the extent to which actors possessing a particular attribute initiate more ties than other actors. The receiver effect refers to the influence of a department’s attributes on its likelihood of being the recipient of collaborative ties. Homophily effect captures the increased probability of tie formation between departments sharing similar attribute profiles [35]. Based on the characteristics of local government departments, this study examines three node attributes—information communication capacity, digital technology utilization capacity, and resource mobilization capacity—to evaluate their respective sender effects, receiver effects, and homophily effects within the ERGM framework.

3.2.1. Influence of Departments’ Information Communication Capacity

Information communication capacity plays a pivotal role in interdepartmental collaboration for social risk prevention and control and constitutes a critical determinant of cross-departmental coordination effectiveness [36]. Efficient communication ensures that all departments can promptly acquire and disseminate the most up-to-date risk intelligence and situational developments [37], thereby accelerating response times and mitigating erroneous judgments arising from information asymmetry or misunderstanding [38]. Concurrently, robust communication facilitates cooperative action under shared objectives, averting redundant efforts or resource waste and enabling departments to better comprehend each other’s needs and resource endowments, thus achieving optimal resource allocation and utilization.
Moreover, departments demonstrating high information communication capacity often serve as trusted information hubs within the network. Their proven competence and reliability foster a reputation that attracts collaboration requests from other units seeking timely guidance, data support, or coordination assistance [39]. In this way, superior communication capabilities not only enable departments to disseminate information effectively but also increase their visibility and centrality, making them preferred recipients of incoming collaborative ties. Based on the aforementioned analysis, we propose the following hypotheses:
H3. 
Departments with similar information communication capacities are more likely to form collaborative ties within the risk prevention network.
H4. 
In risk prevention collaboration, departments possessing high information communication capacity are more inclined to initiate collaborative ties, thereby fostering network formation.
H5. 
In risk prevention collaboration, departments possessing high information communication capacity are more inclined to receive collaborative ties, thereby fostering network formation.

3.2.2. Influence of Departments’ Digital Technology Utilization Capacity

The application of digital technologies dismantles departmental silos, transforms the power dynamics within and between bureaucratic hierarchies, and reshapes accountability relations, thereby addressing the traditional “segmented” management paradigm [40,41]. Robust digital technology utilization capacity serves as a critical support for effective collaboration among social risk prevention and control departments, enabling more efficient coordination in the digital era [42]. By optimizing information flows, facilitating cross-departmental cooperation, and enhancing resource integration and sharing, digital technologies not only bolster departments’ individual operational capabilities but also generate synergistic effects, ensuring rapid and effective responses to complex and evolving social risk challenges. Based on the foregoing analysis, we propose the following hypotheses:
H6. 
Departments with similar digital technology utilization capacities are more likely to form collaborative ties within the risk prevention network.
H7. 
In risk prevention collaboration, departments possessing high digital technology utilization capacity are more inclined to initiate collaborative ties, thereby fostering network formation.
H8. 
In risk prevention collaboration, departments possessing high digital technology utilization capacity are more inclined to receive collaborative ties, thereby fostering network formation.

3.2.3. Influence of Departments’ Resource Mobilization Capacity

According to resource dependence theory, the scarcity of and reliance on critical resources constitute a primary motivation for intergovernmental collaboration [43], particularly when confronting increasingly complex and severe public problems that necessitate concerted cooperation, resource sharing, and functional complementarity among local government departments [44]. Moreover, the capacity for resource mobilization is intrinsically linked to the scope of resource sharing, as this capacity directly determines the feasibility and strength of interdepartmental collaborative ties. Departments endowed with superior resource mobilization and integration capabilities can more effectively identify, procure, allocate, and utilize both internal and external resources, thereby furnishing essential support during critical junctures. Accordingly, we posit the following hypotheses:
H9. 
Departments with similar resource mobilization capacities are more likely to form collaborative ties within the risk prevention network.
H10. 
In risk prevention collaboration, departments possessing high resource mobilization capacity are more inclined to initiate collaborative ties, thereby fostering network formation.
H11. 
In risk prevention collaboration, departments possessing high resource mobilization capacity are more inclined to receive collaborative ties, thereby fostering network formation.
Collectively, these propositions inform the theoretical analytical framework for the driving mechanisms underlying the departmental collaborative network in primary-level social risk prevention and control (see Figure 1).

4. Research Methods and Data Sources

4.1. Data Sources and Processing

Social network analysis, as a methodology focused on relational data [45], is employed in this study to examine the interdepartmental collaborative practices of the J City government in the context of social risk prevention and control. Collaborative ties are classified into two types based on their degree of formalization: formal collaboration, which is established through binding mechanisms such as cooperation agreements, and informal collaboration, which arises from stakeholder interactions via meetings, consultations, and other non-binding engagements [46]. The combined use of formal and informal networks or networks spanning different authority levels more effectively addresses complex collective action problems [47]. Notably, informal collaboration occurs at a substantially higher frequency than formal collaboration and plays a critical role in fostering trust among departments and personnel, thereby facilitating subsequent formal cooperation [48]. Moreover, the inherent flexibility of informal collaboration allows for more agile communication and coordination, promoting information and resource flows and enhancing mutual trust and reciprocity perceptions among participants [49]. Accordingly, this study focuses on the informal collaborative network of local government departments in social risk prevention and control.
In light of the intrinsic characteristics of informal interdepartmental collaboration, field research was conducted in J City in early August 2023. During this period, in-depth interviews were held with the heads of each municipal department, and a structured questionnaire was administered to each department via the Wenjuanxing platform. A total of 65 questionnaires were returned, of which 60 were deemed valid after excluding incomplete or inconsistent responses, yielding an effective response rate of 92.3% (n = 60; N = 65). Based on these data, a 60 × 60 adjacency matrix was constructed for analysis in UCINET, with each node representing a department involved in joint prevention and control activities and each dyadic tie coded as “1” if two departments had engaged in collaborative interactions and “0” otherwise. This analysis also incorporated departmental attributes to assess whether specific capacities influence the network’s structural configuration. The attributes examined—information communication capacity, digital technology utilization capacity, and resource mobilization capacity—were provided by government authorities based on a standardized third-party evaluation. Each capacity was rated on a seven-point Likert scale (1 = lowest, 7 = highest) to ensure consistency and comparability across departments.

4.2. Research Methods

4.2.1. Social Network Analysis

Social network analysis (SNA) is employed to study relationships among actors within social systems by abstracting complex social relations into networks of nodes and edges, thereby facilitating quantitative and visual analysis of these relations [50]. In this study, the focus is on the linkage relationships among functional departments of the J City government in social risk prevention and control. Interdepartmental cooperative ties are used to establish relational links between “actors”. Using the SNA software UCINET 6, we constructed the network matrix and computed measurement indices such as density and centrality. Subsequently, the visual network of governmental department collaborations in risk prevention was generated with the NETDRAW visualization tool.

4.2.2. Exponential Random Graph Model

To identify the driving factors of the risk prevention collaborative network, this study applies the exponential random graph model (ERGM). ERGM is a statistical framework designed for analyzing and simulating complex network structures. Implemented via the Statnet package in R, ERGM enables the elucidation of network formation mechanisms. In the ERGM, the probability of a tie between two departmental nodes serves as the dependent variable, while endogenous structural terms and exogenous node attribute terms are included as independent variables, thus accounting for the joint influences of “relation” and “attribute” factors on the collaborative network of primary-level government departments. Table 1 lists the selected ERGM parameters and their interpretations. The general form of the model is specified as follows:
p Y y = e x p θ g y , X k
Here, Y denotes the set of all possible networks of interdepartmental risk-prevention ties under the random graph model, and y represents the observed network configuration. The vector X comprises exogenous department-attribute variables, while g ( y , X ) is the vector of network statistics—including endogenous structural terms (e.g., reciprocity, transitivity), node-attribute effects, and cross-department interaction effects (homophily, sender, and receiver). The normalizing constant k ensures that the probabilities of all possible networks sum to one. The parameter vector θ contains the estimated coefficients corresponding to each network statistic; the magnitude and significance of these coefficients reveal the relative influence of distinct factors on tie formation. Model fit is evaluated using the Akaike Information Criterion (AIC) and Bayesian Information Criterion (BIC), with lower values indicating a closer approximation of the fitted model to the empirically observed collaborative network.
Table 1. ERGM variable specifications and descriptions.
TypeVariableNetwork ConfigurationDescription
Endogenous Structural VariablesEdgesBaseline effect analogous to an intercept, representing overall tie propensity.
Mutual ReciprocityCaptures reciprocity in the network, indicating the tendency for departments to engage in mutual collaboration.
GWESPMeasures network closure, representing the tendency for departments sharing multiple partners to form ties.
Node Attribute VariablesInformation Communication Homophily (nodematch. X1)HomophilyDepartments with similar information communication capacities are more likely to establish collaborative ties.
Digital Technology Utilization Homophily (nodematch. X2)HomophilyDepartments with similar digital technology utilization capacities are more likely to establish collaborative ties.
Resource Mobilization Homophily (nodematch. X3)HomophilyDepartments with similar resource mobilization capacities are more likely to establish collaborative ties.
Initiator Information Capacity (nodeocov. X1)Sender EffectDepartments with higher information communication capacities are more inclined to initiate collaboration.
Initiator Digital Capacity (nodeocov. X2)Sender EffectDepartments with higher digital technology utilization capacities are more inclined to initiate collaboration.
Initiator Resource Capacity (nodeocov. X3)Sender EffectDepartments with higher resource mobilization capacities are more inclined to initiate collaboration.
Receiver Information Capacity (nodeicov. X1)Receiver EffectDepartments with higher information communication capacities are more inclined to accept collaboration.
Receiver Digital Capacity (nodeicov. X2)Receiver EffectDepartments with higher digital technology utilization capacities are more inclined to accept collaboration.
Receiver Resource Capacity (nodeicov. X3)Receiver EffectDepartments with higher resource mobilization capacities are more inclined to accept collaboration.

5. Results

5.1. Structural Characteristics of the Risk Prevention Departmental Collaborative Network

Using NETDRAW, the topological structure of the risk prevention collaborative network among J City’s local government departments was visualized (see Figure 2), with node size proportional to degree centrality. In the network diagram, nodes (depicted as circles) represent departments engaged in social risk prevention and control, and directed edges (arrows) indicate the direction of collaborative ties. Departments establish these ties through information sharing, joint actions, and mutual resource support, resulting in a densely populated and complex relational network. Descriptive network metrics illuminate the overarching network morphology and provide a foundation for more precise interpretation of the subsequent ERGM analysis. The following sections present an in-depth examination of the structural characteristics of the risk prevention departmental collaborative network.

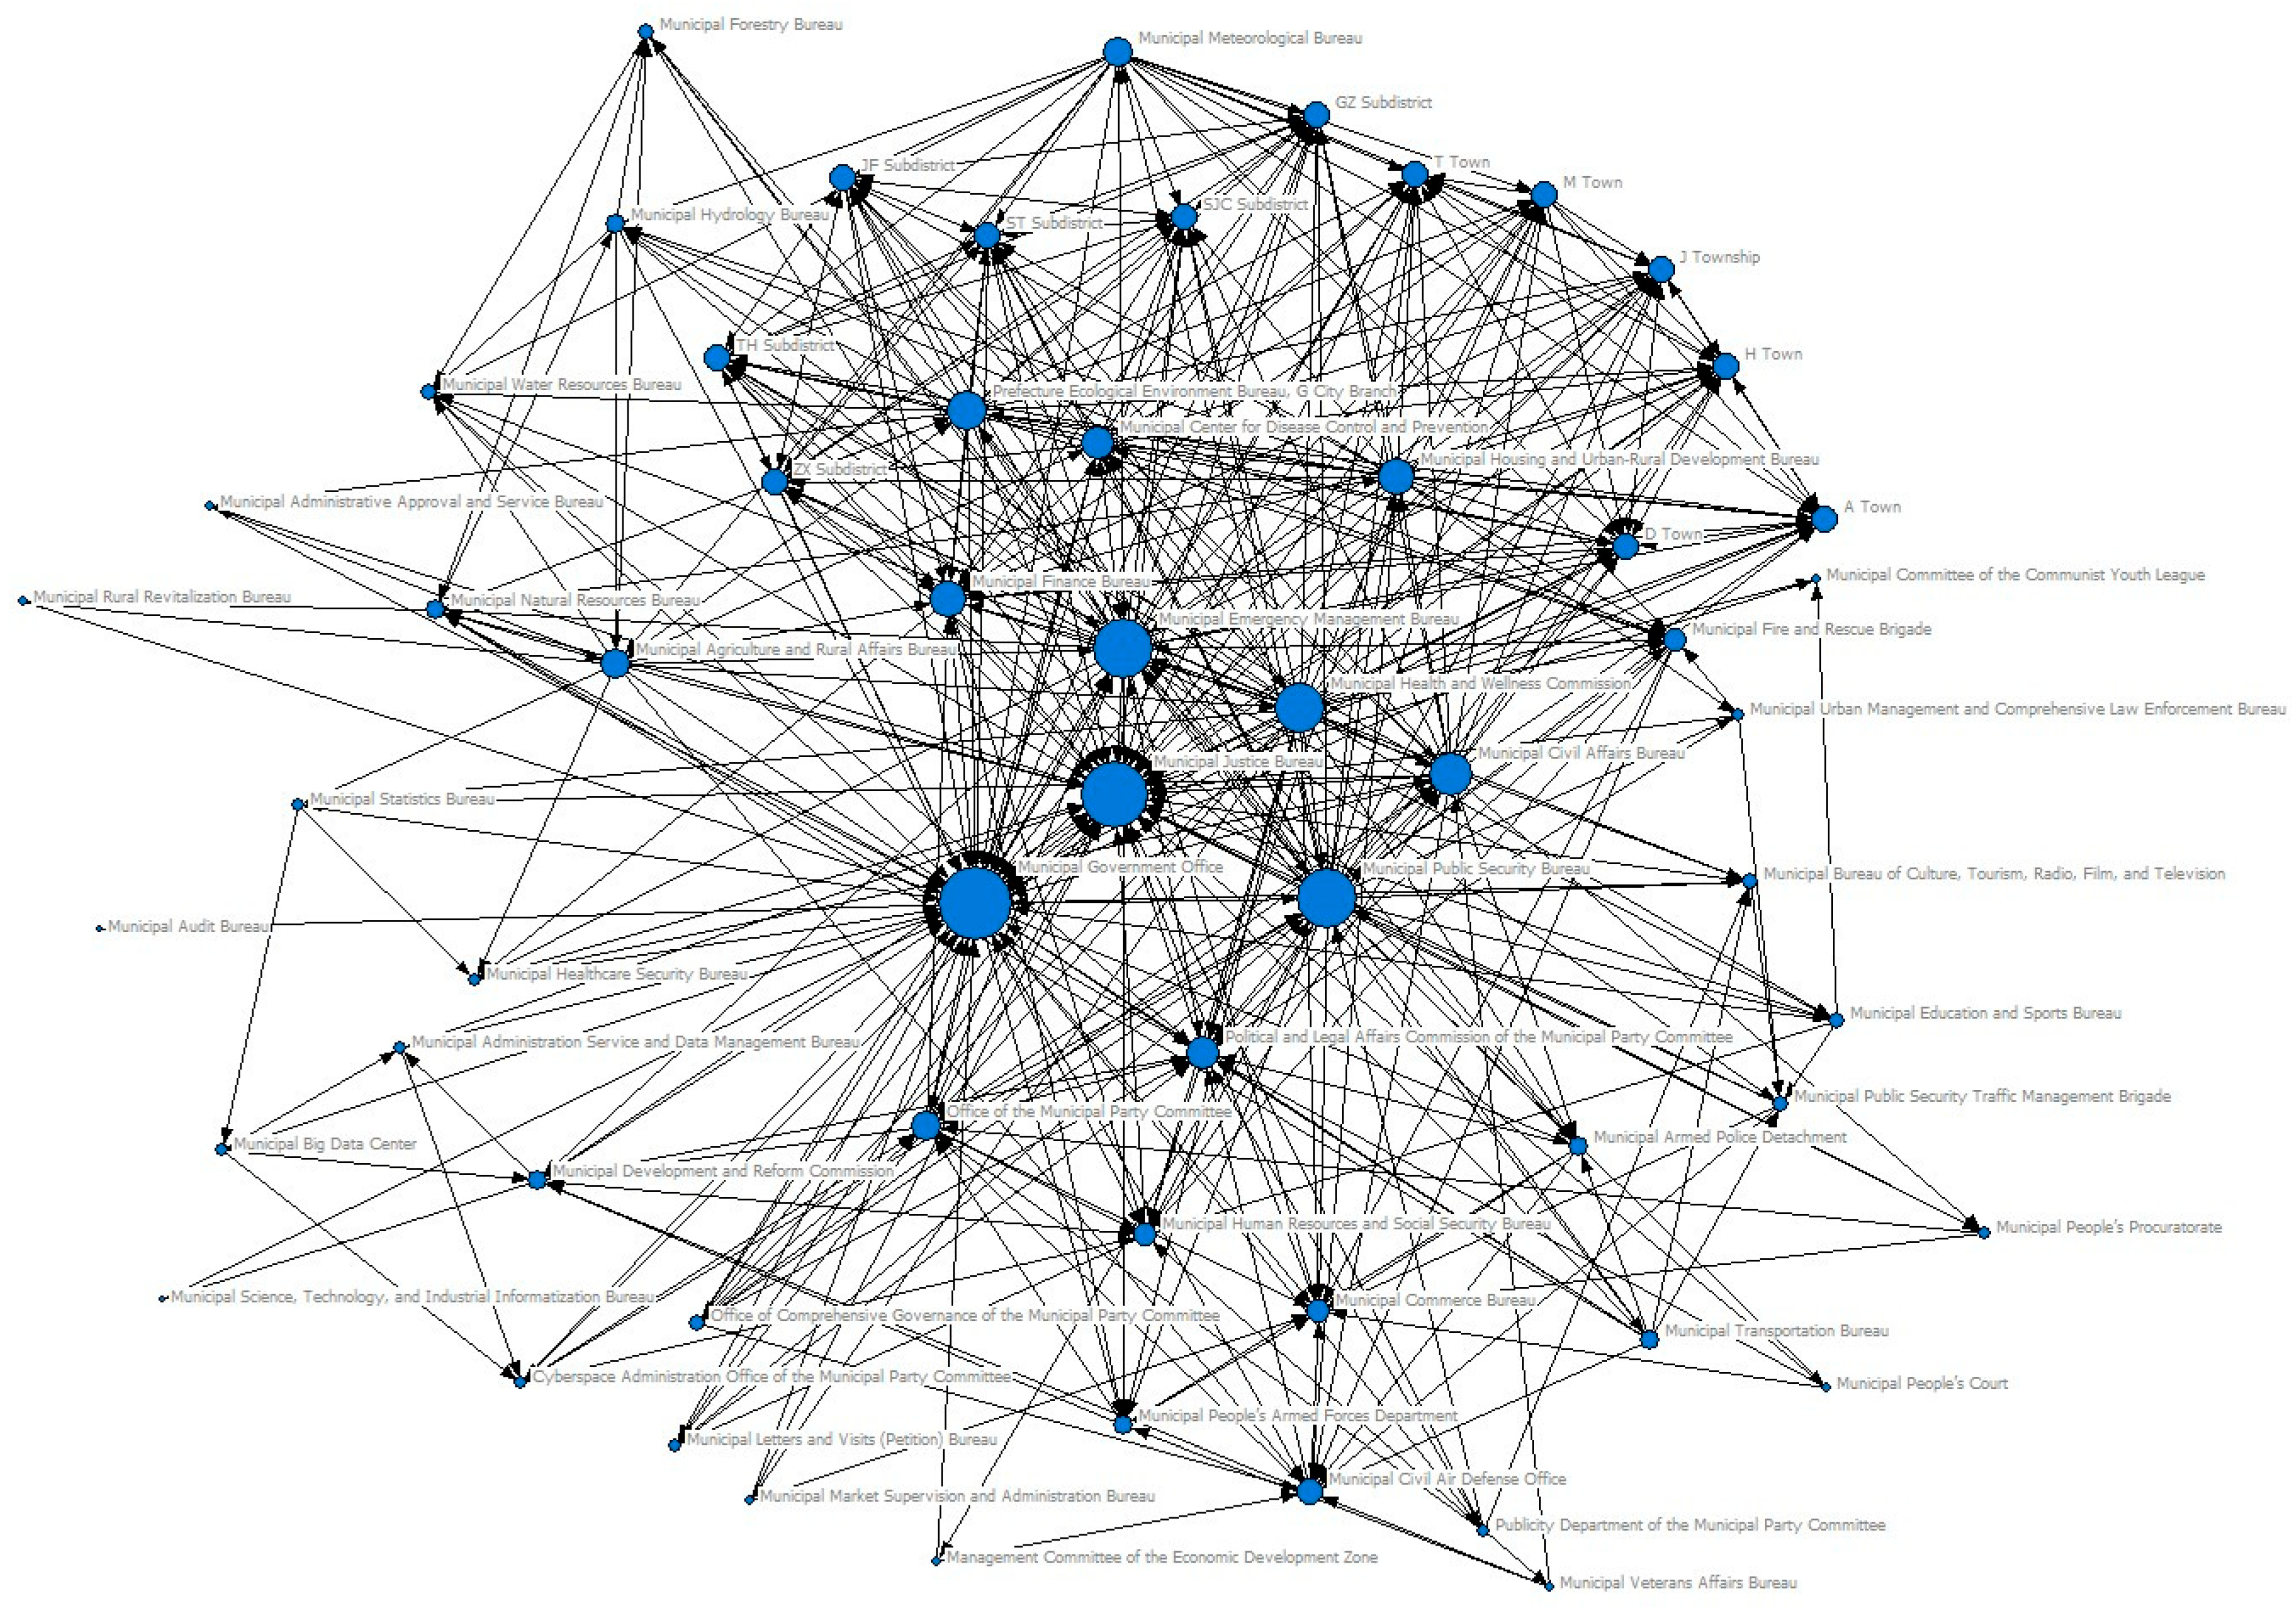
5.1.1. Analysis of Overall Structural Characteristics of the Risk Prevention Departmental Collaborative Network

The network density of J City’s risk prevention departmental collaborative network is 0.171 with a standard deviation of 0.376. The relatively low network density indicates that interdepartmental collaborations are not pervasive, while the small standard deviation suggests a lack of significant variation in density across different network subregions. Such low-density conditions imply the presence of structural barriers between departments, which may impede the overall connectivity and cohesion of the network. We also include in Table 2 eight key topological metrics of the J City risk prevention collaborative network, namely density, standard deviation of degree, total number of ties, average degree, average path length, cohesion index, network width, and small-world index. While these measures are not directly tested in our ERGM hypotheses, they provide an essential first look at the network’s overall connectivity, cohesion, and efficiency, thereby grounding our subsequent inferential analysis in a clear descriptive portrait of how departments are positioned within the collaboration structure.
In social network analysis, centrality metrics constitute a suite of measures used to assess the importance and positional status of nodes within a network [51]. This study evaluates the micro-level centrality of departmental nodes in the overall network to identify key actors in the interdepartmental collaborative network. By synthesizing three centrality measures—degree centrality, betweenness centrality, and closeness centrality—the Office of the Municipal Party Committee, the Office of the Municipal Government, the Municipal Emergency Management Bureau, the Municipal Public Security Bureau, the Municipal Health Commission, the Municipal Civil Affairs Bureau, and the Municipal Justice Bureau rank among the top ten in degree and betweenness centrality and the bottom ten in closeness centrality. Consequently, these seven departments emerge as pivotal nodes within J City’s social risk prevention collaborative network. They occupy strategic positions, wield advantages in information and resource control, and maintain the most direct and intensive connections with other departments.
Notably, the Office of the Municipal Government exhibits the highest degree and betweenness centrality, with a degree centrality of 50—indicating interactions with 50 other departments—and thus plays a “leading” and “coordinating” role in J City’s risk prevention efforts. Practically, this centrality facilitates the formation of a risk governance framework characterized by party leadership, government responsibility, and interdepartmental coordination.
In contrast, departments such as the Municipal Audit Bureau, the Municipal People’s Court, the Municipal Youth League Committee, and the Municipal Administrative Approval Service Bureau rank among the bottom ten in degree and betweenness centrality and among the top ten in closeness centrality, reflecting weaker centrality and fewer collaborative ties in risk prevention activities. Their interaction with other departments is limited, and their capacity for resource control is lower, resulting in a more constrained role. Although these departments do not exhibit prominent network centrality, clearly delineating their responsibilities and roles in risk management is essential to ensure their effective engagement in coordinated risk prevention actions.

5.1.2. Analysis of Cohesive Substructures Within the Risk Prevention Departmental Collaborative Network

To further examine the evolution of relatively cohesive departmental clusters within J City’s interdepartmental collaborative network—those groups characterized by dense internal ties and sparse external connections—the adjacency matrix was subjected to iterative correlation calculations and binarization, progressively revealing the network’s hierarchical block structure and cohesive subgroups [20]. The CONCOR clustering results offer an intuitive perspective on the structural relations and power distribution phenomena in the departmental collaborative network by delineating the cooperative capacities of departments within each block.
For optimal partitioning in the CONCOR analysis, the maximum depth of splits was set to 3, yielding eight cohesive subgroups within J City’s risk prevention network and a pronounced block structure. Subgroups 1 and 7 occupy the most central positions, exhibiting the highest centrality among all blocks. Subgroup 1 is anchored by the Office of the Municipal Party Committee and the Office of the Municipal Government and is linked to key functional departments, including the Municipal Political and Legal Affairs Commission, the Municipal Justice Bureau, and the Municipal Letters and Visits Bureau, collectively engaging in risk prevention to maintain social stability. Subgroup 7 comprises five departments—the Municipal Center for Disease Control and Prevention, the Municipal Civil Affairs Bureau, the Municipal Health Commission, the Municipal Public Security Bureau, and the Municipal Emergency Management Bureau—which, through their rapid response and efficient handling of emergent risk events, form a frontline defense against major social risks.
In contrast, Subgroup 5, consisting of fifteen township- and subdistrict-level risk prevention units (e.g., A Town, D Town, TH Subdistrict), is the largest subgroup, reflecting the extensive participation and critical role of local government departments in risk prevention. Conversely, Subgroup 6 is the smallest, comprising only four departments—the Municipal Hydrology Bureau, the Municipal Meteorological Bureau, the Municipal Housing and Urban–Rural Development Bureau, and the GS Branch of the State Ecological Environment Bureau. Despite its limited size, this subgroup’s members possess distinct functional specialties and play vital roles in their respective domains.
Regarding subgroup heterogeneity, members within each collaborative cluster predominantly share similar attribute profiles, with a low proportion of heterogeneous departments, indicating that homophilic departments maintain stronger intra-cluster ties and more readily form cohesive subgroups, in accordance with homophily theory. Conversely, departments with high heterogeneity tend to exhibit fewer inter-dependencies and sparser collaborative ties in risk prevention. Further examination of internal versus external density reveals that intra-cluster densities consistently exceed densities of ties to external departments. This disparity indicates that collaborative interactions are more frequent and intensive within small departmental clusters, while connections to outside departments are relatively weak. Such a pattern of high internal density coupled with low external density may engender “silo” and “island” effects among departmental blocks, impeding coordinated action and undermining overall prevention efficacy.

5.1.3. Analysis of Individual Positional Roles in the Departmental Collaborative Network for Social Risk Prevention and Control

First, the core–periphery structure of J City’s social risk prevention collaborative network distinctly demarcates the internal positional characteristics of departmental nodes. Core nodes comprise pivotal municipal bodies such as the Office of the Municipal Party Committee, the Office of the Municipal Government, and the Municipal Political and Legal Affairs Commission, as well as frontline local government departments, including D Town, A Town, and SJC Subdistrict. Core government departments oversee the entire risk management continuum—responsible for pre-event early warning and identification, in-event leadership coordination, and post-event recovery and improvement—and therefore constitute the leadership nucleus of risk governance. Township governments and subdistrict offices, serving as the vanguard of risk prevention, function both as loci of risk emergence and aggregation; their role is indispensable in advancing risk governance from post-event response toward pre-event prevention, thereby minimizing risks at the primary level.
In contrast, although peripheral departments are numerous, their engagement in social risk prevention is limited, and their decision-making influence is modest. Departments such as the Municipal Water Resources Bureau, the Municipal Statistics Bureau, and the Municipal Human Resources and Social Security Bureau primarily execute specific operational mandates and depend on core departments for guidance and coordination. Consequently, they occupy auxiliary and supportive roles in risk prevention activities, situated at the network periphery. This configuration underscores that in J City’s social risk governance, the Party committee and government act as the collaborative axis: core departments leverage their authority and bureaucratic apparatus to respond swiftly, allocate resources efficiently, and coordinate departmental functions, thereby spearheading risk management. Peripheral departments, by contrast, emphasize their specialized functions and proprietary resources; their collaborative ties are relatively limited, resulting in a network characterized by centralized coordination and peripheral specialization.
Secondly, at the meso-structural level, numerous departments occupy structural-hole positions within the collaborative network, thereby enjoying distinct advantages in information coordination [52]. This study employs a structural-hole index to quantify each department’s network redundancy and brokerage ties—where “brokers” serve as connectors between otherwise disconnected groups—and reveals three salient characteristics. First, the network exhibits a heterogeneous organizational layout: departments with large effective sizes, low constraint scores, and high efficiency function as pivotal brokers and catalysts, whereas those with small effective sizes and high constraints face limitations in information access and autonomous action. Second, departments characterized by structural holes—such as the Office of the Municipal Party Committee, the Office of the Municipal Government, the Municipal Emergency Management Bureau, and the Municipal Public Security Bureau—serve as essential brokers in the risk prevention system; by leveraging their positional advantages, they can strengthen interdepartmental cooperation, diversify relational ties, broaden collaborative scopes, and mitigate informational asymmetries during crises, thus facilitating resource sharing and complementary expertise. Third, the existence of structural holes provides non-redundant relational channels that enable the rapid integration and bridging of risk-related information and resources from diverse sources, ensuring that critical data are transmitted promptly and accurately to highly constrained or relatively isolated units and effectively alleviating information silos. By deploying such integrative brokerage strategies, the overall responsiveness of the network is enhanced, offering significant potential to improve local government performance in social risk governance.

5.2. Driving Factors of the Risk Prevention Departmental Collaborative Network

To examine the relative influences of endogenous and exogenous factors on the observed network structure, ERGMs were sequentially estimated using the Statnet package in R, fitting Model 1 through Model 3. The results are presented in Table 3. Model 1 serves as the baseline specification, including only the edge statistic (Edges), which functions analogously to an intercept and is not substantively interpreted. Model 2 extends Model 1 by incorporating endogenous structural configuration terms. Model 3 further augments Model 2 by adding homophily, sender, and receiver effects. Compared to Model 1, both AIC and BIC decrease in Models 2 and 3, with Model 3 exhibiting the lowest AIC and BIC values; hence, Model 3 is adjudged the optimal ERGM specification and forms the basis for subsequent result interpretation. In the ERGM framework, the magnitude and sign of parameter estimates indicate the strength and direction of each effect: a statistically significant positive coefficient implies that the corresponding configuration or attribute enhances the probability of tie formation relative to a random graph, whereas a significant negative coefficient denotes an inhibiting effect; non-significant coefficients suggest neither promotion nor suppression of tie formation.

5.2.1. Effects of Endogenous Network Structures

The coefficient for the edge term (Edges) is significantly negative across Models 1–3, indicating that the formation of the risk prevention departmental collaborative network is non-random. The mutual term exhibits a statistically significant positive coefficient at the 1% level, demonstrating that reciprocal configurations occur more frequently than expected by chance; this finding confirms that interdepartmental collaborations are driven by endogenous reciprocity mechanisms, thus supporting H1. Likewise, the geometrically weighted edgewise shared partner (GWESP) term is both statistically significant and positive, indicating that transitivity markedly facilitates the establishment of new collaborative ties. The prevalence of closed triadic structures in the network suggests that departments preferentially form connections with those sharing common collaborators, thereby validating H2.

5.2.2. Effects of Exogenous Node Attributes

With respect to homophily effects, neither information communication capacity nor digital technology utilization capacity achieved statistical significance, indicating that similarity in these attributes does not significantly influence the formation of the collaborative network; thus, H3 and H6 are not supported. In contrast, homophily in resource mobilization capacity is highly significant and positive at the 1% level, demonstrating that departments with comparable resource mobilization capabilities are more likely to form collaborative ties, thereby supporting H9.
The initiation of collaborative ties is typically led by certain departments; therefore, sender effects reveal which departmental attributes predispose actors to serve as originators of network formation. The estimated coefficients for sender effects on information communication capacity, digital technology utilization capacity, and resource mobilization capacity are all significantly positive, indicating that departments endowed with these capabilities are more inclined to initiate collaborations and thereby facilitate network formation. Hence, H4, H7, and H10 are supported.
Moreover, the establishment of collaborative structures often involves both leading and participating departments; thus, receiver effects capture the motivations of departments as they accept collaborations. The receiver effect for information communication capacity is positive and significant at the 5% level, indicating that departments with strong communication capabilities are more predisposed to accept collaboration, thereby promoting network formation and supporting H5. Conversely, the receiver effect for digital technology utilization capacity is significantly negative, contradicting H8. This may reflect the tendency of highly digitalized departments to function as information brokers, controlling inbound interactions to safeguard proprietary data workflows and mitigate information overload. As a result, their formal propensity to accept new ties is diminished.
Finally, the receiver effect for resource mobilization capacity is not statistically significant, suggesting that this attribute does not significantly impact a department’s propensity to accept collaborative ties, and H11 is not supported. This outcome may derive from a relative homogeneity in resource mobilization capabilities among departments, such that this attribute does not differentiate their receptivity to collaboration. Alternatively, it may indicate that statutory mandates and hierarchical protocols supersede resource-based considerations in influencing a department’s acceptance of collaborative requests.

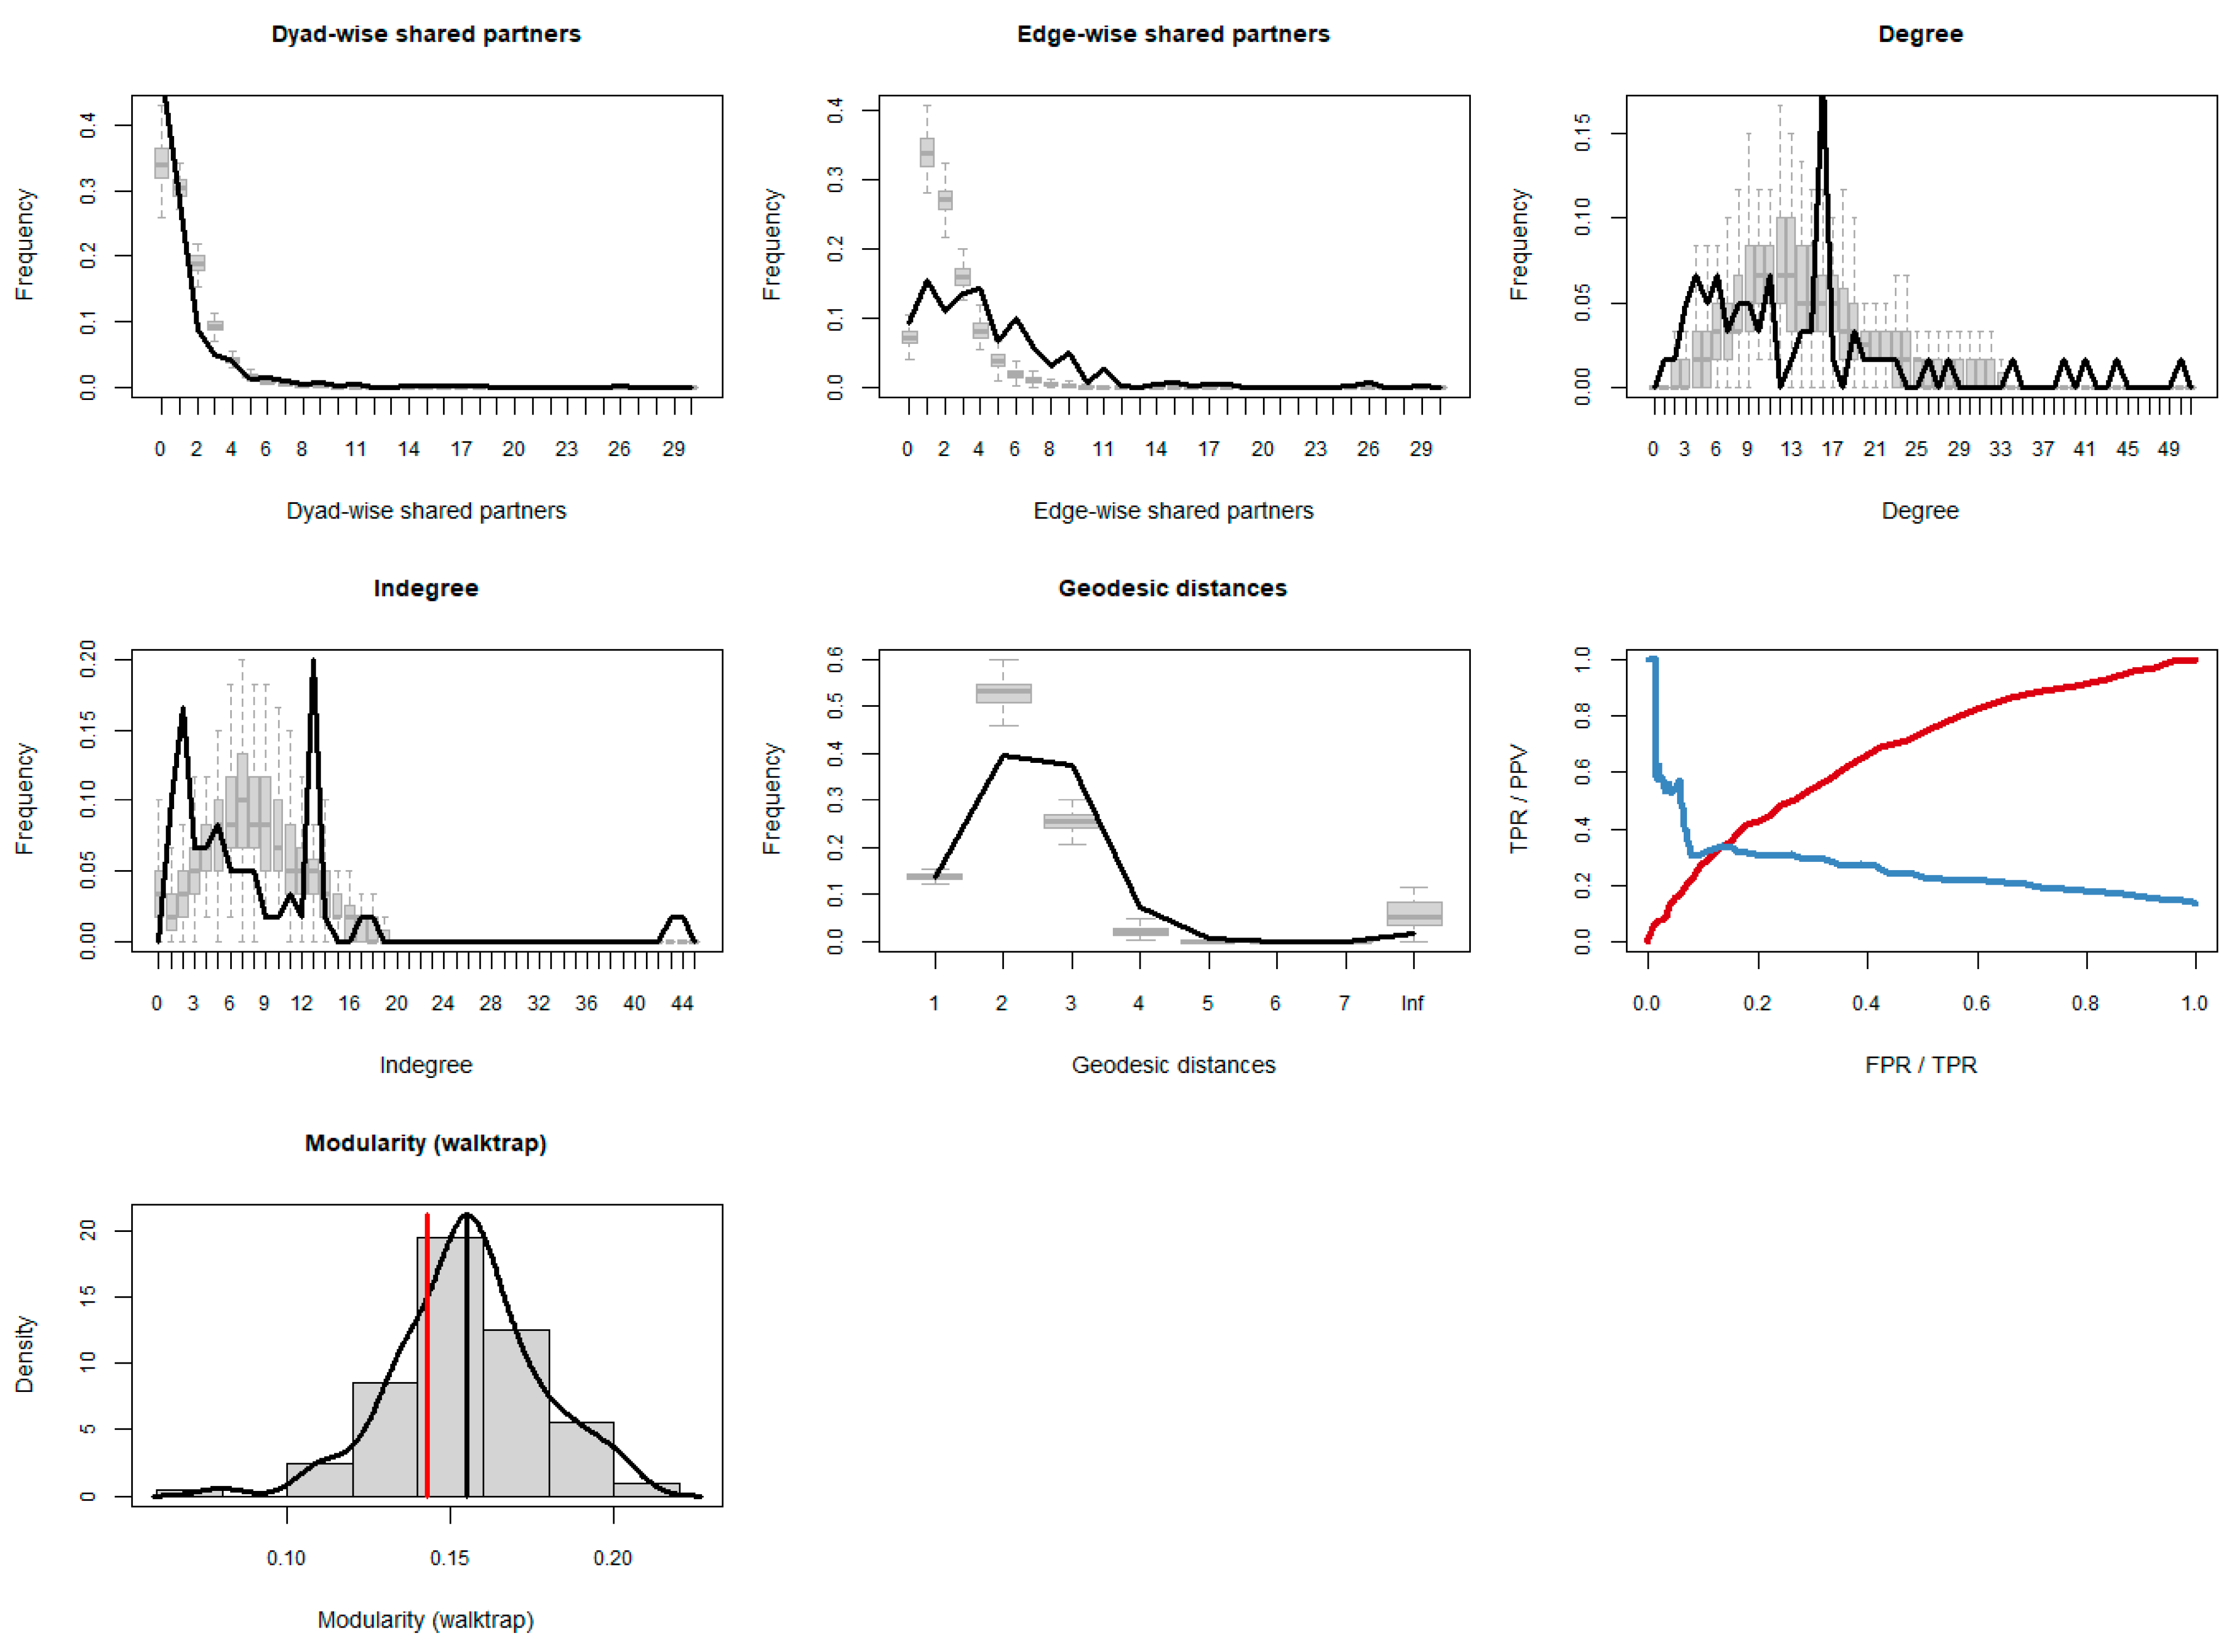
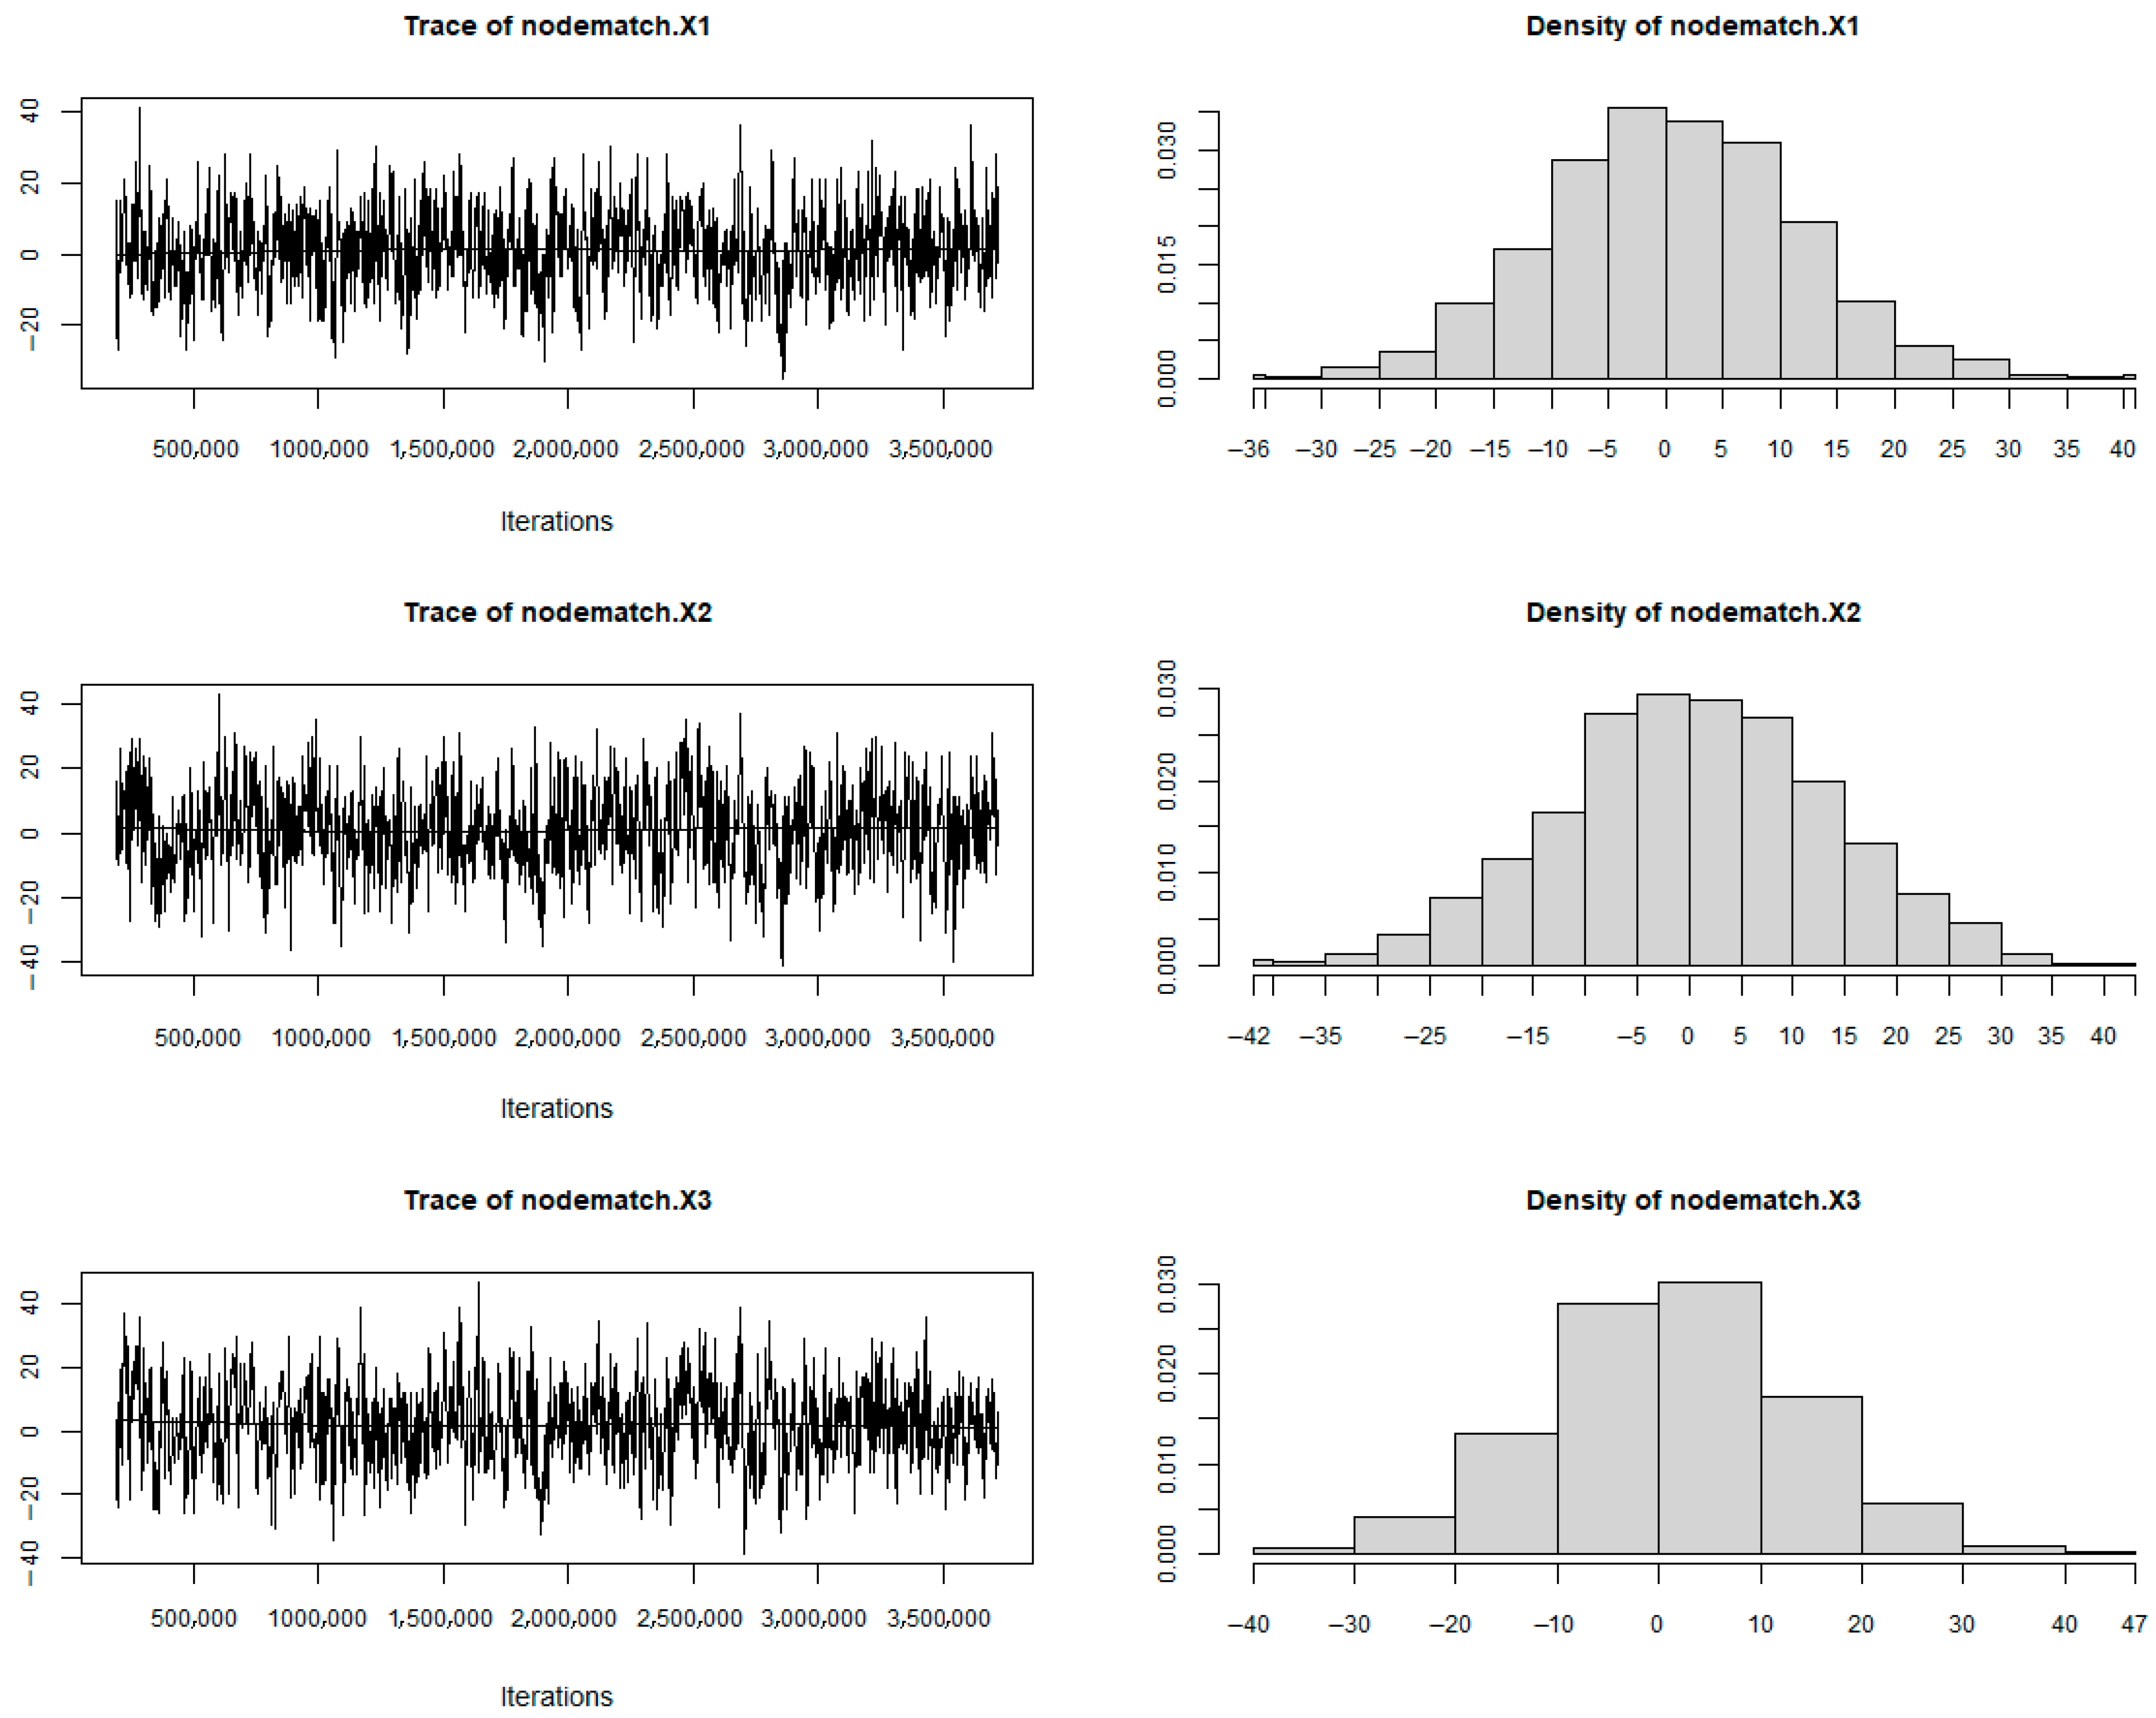
5.3. Goodness-of-Fit and MCMC Convergence Diagnostics

To assess the congruence between simulated and empirical network structures, we conducted goodness-of-fit (GOF) evaluations for the ERGM. Utilizing the ERGM package in R, statistics such as geometrically weighted edgewise shared partner (GWESP) were incorporated into the GOF assessment. The optimal ERGM at each modeling stage was subjected to GOF testing, yielding corresponding diagnostic plots. In Figure 3, the solid black line denotes the observed statistics of the risk prevention departmental collaborative network, while the boxplots represent the distribution of simulated network statistics under the 95% confidence envelope. A solid line lying within the boxplot indicates an adequate model fit, whereby the simulated networks closely replicate the structural characteristics of the observed network. As illustrated in Figure 3, the estimated parameters exhibit minimal deviation from the observed network, demonstrating that the specified ERGM achieves a satisfactory fit.
We assessed the convergence of Model 3 via MCMC diagnostics. After discarding an initial burn-in of 10,000 iterations and sampling at intervals of 10,000 steps, we generated the final MCMC output. In Figure 4, the left panels present trace plots for each parameter, illustrating their temporal evolution and rapid mixing around stable posterior means. The right panels display the empirical sampling distributions for information communication capacity, digital technology utilization capacity, and resource mobilization capacity, each of which closely approximates a normal distribution centered at zero. Overall, these diagnostics confirm that the MCMC chains have converged reliably and that the resulting parameter estimates are reliable.

6. Conclusions and Discussion

In the context of an increasingly complex risk society, the growing intricacy of risk events necessitates strengthening governmental departments’ capabilities in social risk governance to minimize adverse impacts. By employing social network analysis and ERGM to examine the structural characteristics and driving factors of J City’s risk prevention collaborative governance network, this study yields the following key conclusions:
1. Heterogeneity within the Interdepartmental Collaborative Network. Although J City has established a collaborative governance framework, the overall network density remains relatively low, and network cohesion is weak, indicating superficial levels of collaboration and the presence of structural impediments. It is, therefore, imperative to strengthen interdepartmental coordination and cooperation and to incrementally refine the mechanisms for risk prevention collaboration. Additionally, the risk prevention network exhibits pronounced cohesive subgroups of varying sizes, with homogeneous departments readily forming tightly knit clusters. However, the concentration of close collaboration within small cohorts can give rise to isolated cliques, impeding broader interdepartmental exchange and resource flow, thereby undermining synergistic potential. Moreover, a clear core–periphery structure emerges: core departments with structural-hole advantages exert dominant influence and leadership in risk prevention, while peripheral departments predominantly assume supportive roles within their specialized domains. Effective construction of a high-functioning collaborative system for risk prevention thus requires not only the authoritative guidance of core departments but also the precise engagement and responsiveness of peripheral departments in their respective areas of expertise to maximize governance efficacy.
2. The formation of the risk prevention collaborative network is jointly influenced by endogenous structural configurations and exogenous node attributes. Endogenously, reciprocity and transitivity mechanisms serve as pivotal drivers that positively facilitate interdepartmental tie formation. Exogenously, departments with comparable resource mobilization capacities are more inclined to establish collaborative relationships; moreover, departments endowed with strong information communication, digital technology utilization, and resource mobilization capacities are more likely to initiate collaborations, thereby fostering network formation. Conversely, departments possessing high information communication capacity exhibit a greater propensity to accept collaborative overtures.
Based on the foregoing analysis, interdepartmental coordination in primary-level social risk prevention can be advanced through the following strategies:
1. Optimize both the overall network architecture and its block structures to establish a high-quality collaborative governance regime. First, implement rotating cross-departmental task forces and scenario-based joint training exercises to systematically increase network density. By convening representatives from peripheral and central departments in structured, outcome-oriented collaborations, these mechanisms will generate new relational ties, dissolve isolated cliques, and integrate all actors into a cohesive governance framework. Second, institutionalize the brokerage role by appointing dedicated liaison officers within key departments and granting them formal mandates for cross-departmental coordination, thereby ensuring systematic facilitation of information flows and resource allocation across the network. Third, amplify the bridging and hub functions of key departments: empower lead agencies with the requisite mandate and coordination authority to align departmental actions while devolving certain powers to local government departments to extend early warning capabilities and bolster frontline responsiveness. Such vertical integration will establish an efficient, bidirectional linkage mechanism that maximizes the agility and effectiveness of risk prevention across all administrative levels.
2. Cultivate a systemic mindset and prioritize the enhancement of departments’ integrated capacities. First, adopting a holistic, systems-thinking approach enables simultaneous enhancement of technological, organizational, informational, and cross-departmental coordination capabilities. This framework supports optimized resource integration and sharing and underpins the development of robust risk-assessment and feedback mechanisms, thereby reducing role ambiguity and alleviating resource constraints. Moreover, institutionalizing mutual-aid agreements and promoting joint initiatives among departments with common partners will expedite tie formation and strengthen overall network cohesion. Second, facilitate strategic partnerships among departments with comparable resource-mobilization profiles through targeted resource-pooling programs and joint funding mechanisms. By leveraging homophily in resource endowments, local authorities can promote more equitable and effective collaboration, ensuring that similarly equipped departments can rapidly deploy shared assets in response to emergent risks. Third, empower departments to both initiate and receive ties by investing in tailored capacity-building initiatives, such as advanced training in digital platforms, communication protocols, and emergency coordination procedures. By enhancing information communication and digital-technology competencies across the network, all departments will be better positioned to propose, accept, and sustain collaborative ventures.
This study represents an initial exploration of primary-level government collaborative networks and their driving mechanisms in social risk prevention, thereby enriching the literature on risk governance contexts. However, owing to the sensitivity of social risk topics and the attendant challenges in data collection, several limitations remain. First, the analysis was conducted from a static perspective, examining only the structural characteristics of the collaborative network and its formation drivers at a single point in time; yet, social risk prevention constitutes a lifecycle process, and future research should investigate the temporal dynamics influencing the evolution of collaborative ties. Second, this study analyzes relational data from only one jurisdiction without conducting comparative analyses across multiple regions. Other cases may exhibit distinct network configurations and model parameters; consequently, extending this research to additional cases or undertaking cross-regional comparative studies would help to validate and generalize the present findings.

Author Contributions

Conceptualization, L.Z. and Q.J.; methodology, Q.J.; software, H.Z.; validation, L.Z., H.Z. and Q.J.; formal analysis, Q.J.; investigation, Q.J.; resources, Q.J.; data curation, Q.J.; writing—original draft preparation, H.Z.; writing—review and editing, L.Z.; visualization, H.Z.; supervision, L.Z.; project administration, Q.J.; funding acquisition, L.Z. All authors have read and agreed to the published version of the manuscript.

Funding

This research was funded by the Philosophy and Social Science Foundation of China (grant number: 22BZZ087), under the project title “Holistic Governance Mechanism and Implementation Pathways for Social Risk Prevention and Control in Local Governments under the Context of the Digital Revolution”.

Institutional Review Board Statement

Not applicable.

Informed Consent Statement

Informed consent was obtained from all subjects involved in the study.

Data Availability Statement

The data presented in this study are available on request from the corresponding author.

Conflicts of Interest

The authors declare no conflicts of interest.

References

  1. Holzmann, R.; Jørgensen, S. Social Risk Management: A New Conceptual Framework for Social Protection, and Beyond. Int. Tax Public Finance 2001, 8, 529–556. [Google Scholar] [CrossRef]
  2. Ye, F. 5 Urban Risk Prevention-and-Control System and Capacity Building. In Urban Risk Management in China: Principles, Methods and Practices; Elsevier: Amsterdam, The Netherlands, 2024; p. 185. [Google Scholar]
  3. Renn, O.; Lucas, K. Systemic Risk: The Threat to Societal Diversity and Coherence. Risk Anal. 2022, 42, 1921–1934. [Google Scholar] [CrossRef] [PubMed]
  4. Achillopoulou, D.V.; Mitoulis, S.A.; Argyroudis, S.A.; Wang, Y. Monitoring of Transport Infrastructure Exposed to Multiple Hazards: A Roadmap for Building Resilience. Sci. Total Environ. 2020, 746, 141001. [Google Scholar] [CrossRef] [PubMed]
  5. Scott, I.; Gong, T. Coordinating Government Silos: Challenges and Opportunities. Glob. Public Policy Gov. 2021, 1, 20–38. [Google Scholar] [CrossRef]
  6. Aven, T.; Renn, O. Improving Government Policy on Risk: Eight Key Principles. Reliab. Eng. Syst. Saf. 2018, 176, 230–241. [Google Scholar] [CrossRef]
  7. Joffe, H. Risk: From Perception to Social Representation. Br. J. Soc. Psychol. 2003, 42, 55–73. [Google Scholar] [CrossRef]
  8. Rosenthal, U.; Kouzmin, A. Crises and Crisis Management: Toward Comprehensive Government Decision Making. J. Public Adm. Res. Theory 1997, 7, 277–304. [Google Scholar] [CrossRef]
  9. Somers, S.; Svara, J.H. Assessing and Managing Environmental Risk: Connecting Local Government Management with Emergency Management. Public Adm. Rev. 2009, 69, 181–193. [Google Scholar] [CrossRef]
  10. Henderson, L.J. Emergency and Disaster: Pervasive Risk and Public Bureaucracy in Developing Nations. Public Organ. Rev. 2004, 4, 103–119. [Google Scholar] [CrossRef]
  11. Vantaggiato, F.P.; Kassim, H.; Connolly, S. Breaking out of Silos: Explaining Cross-Departmental Interactions in Two European Bureaucracies. J. Eur. Public Policy 2021, 28, 1432–1452. [Google Scholar] [CrossRef]
  12. Jarvis, D.S. Risk, Globalisation and the State: A Critical Appraisal of Ulrich Beck and the World Risk Society Thesis. Glob. Soc. 2007, 21, 23–46. [Google Scholar] [CrossRef]
  13. Vij, S. Polycentric Disaster Governance in a Federalising Nepal: Interplay between People, Bureaucracy and Political Leadership. Policy Sci. 2023, 56, 755–776. [Google Scholar] [CrossRef]
  14. Klinke, A.; Renn, O. Adaptive and Integrative Governance on Risk and Uncertainty. J. Risk Res. 2012, 15, 273–292. [Google Scholar] [CrossRef]
  15. Rocheleau, B. Interorganizational and Interdepartmental Information Systems: Sharing among Governments. Public Adm. Public Policy N. Y. 2005, 111, 59. [Google Scholar]
  16. Zhang, H.; Tao, Z. Evolution of Interdepartmental Collaboration Networks in Public Health Emergency Management. J. Wuhan Univ. Philos. Soc. Sci. Ed. 2021, 74, 114–126. (In Chinese) [Google Scholar]
  17. Yan, H.; Guo, P.; Zeng, D. How Is a “Third Way” of Cross-Departmental Collaborative Governance Possible? A Social Network Analysis of 300 Water Governance Cases. Acad. Res. 2021, 10, 67–74. (In Chinese) [Google Scholar]
  18. Huang, C.; Chen, W.; Yi, H. Collaborative Networks and Environmental Governance Performance: A Social Influence Model. Public Manag. Rev. 2021, 23, 1878–1899. [Google Scholar] [CrossRef]
  19. Yan, J.; Guo, Y.; Zhang, H. The Dynamic Evolution Mechanism of Structural Dependence Characteristics in the Global Oil Trade Network. Energy 2024, 303, 131914. [Google Scholar] [CrossRef]
  20. Lee, Y.; Lee, I.W.; Feiock, R.C. Interorganizational Collaboration Networks in Economic Development Policy: An Exponential Random Graph Model Analysis. Policy Stud. J. 2012, 40, 547–573. [Google Scholar] [CrossRef]
  21. Whetsell, T.A.; Kroll, A.; DeHart-Davis, L. Formal Hierarchies and Informal Networks: How Organizational Structure Shapes Information Search in Local Government. J. Public Adm. Res. Theory 2021, 31, 653–669. [Google Scholar] [CrossRef]
  22. Xu, H.; Feng, L.; Wu, G.; Zhang, Q. Evolution of Structural Properties and Its Determinants of Global Waste Paper Trade Network Based on Temporal Exponential Random Graph Models. Renew. Sustain. Energy Rev. 2021, 149, 111402. [Google Scholar] [CrossRef]
  23. Lu, C.; Li, B. The Influence Factors of Innovation Networking Formation Based on ERGM: Evidence from the Smart Medical Industry. J. Digit. Econ. 2023, 2, 64–80. [Google Scholar] [CrossRef]
  24. Mele, A. A Structural Model of Dense Network Formation. Econometrica 2017, 85, 825–850. [Google Scholar] [CrossRef]
  25. Ghafouri, S.; Khasteh, S.H. A Survey on Exponential Random Graph Models: An Application Perspective. PeerJ Comput. Sci. 2020, 6, e269. [Google Scholar] [CrossRef] [PubMed]
  26. Hunter, D.R.; Handcock, M.S.; Butts, C.T.; Goodreau, S.M.; Morris, M. Ergm: A Package to Fit, Simulate and Diagnose Exponential-Family Models for Networks. J. Stat. Softw. 2008, 24, 1–29. [Google Scholar] [CrossRef] [PubMed]
  27. Kim, J.Y.; Howard, M.; Cox Pahnke, E.; Boeker, W. Understanding Network Formation in Strategy Research: Exponential Random Graph Models. Strateg. Manag. J. 2016, 37, 22–44. [Google Scholar]
  28. van Der Pol, J. Introduction to Network Modeling Using Exponential Random Graph Models (Ergm): Theory and an Application Using R-Project. Comput. Econ. 2019, 54, 845–875. [Google Scholar] [CrossRef]
  29. Leifeld, P.; Schneider, V. Information Exchange in Policy Networks. Am. J. Polit. Sci. 2012, 56, 731–744. [Google Scholar] [CrossRef]
  30. Ostrom, E. Institutional Rational Choice: An Assessment of the Institutional Analysis and Development Framework. In Theories of the Policy Process, 2nd ed.; Routledge: Oxfordshire, UK, 2019; pp. 21–64. [Google Scholar]
  31. Siciliano, M.D.; Wukich, C. Network Features and Processes as Determinants of Organizational Interaction during Extreme Events. Complex. Gov. Netw. 2015, 2, 23–44. [Google Scholar] [CrossRef]
  32. Zhang, C.; Bu, Y.; Ding, Y.; Xu, J. Understanding Scientific Collaboration: Homophily, Transitivity, and Preferential Attachment. J. Assoc. Inf. Sci. Technol. 2018, 69, 72–86. [Google Scholar] [CrossRef]
  33. Murshed, S.T.H.; Uddin, S.; Hossain, L. Transitivity, Hierarchy and Reciprocity of Organizational Communication Network during Crisis. Int. J. Organ. Anal. 2015, 23, 2–20. [Google Scholar] [CrossRef]
  34. Siciliano, M.D. Advice Networks in Public Organizations: The Role of Structure, Internal Competition, and Individual Attributes. Public Adm. Rev. 2015, 75, 548–559. [Google Scholar] [CrossRef]
  35. Wang, R.; Shin, J. Determinants of Alliance Formation and Dissolution among International Health Organizations: The Influence of Homophily and Institutional Power in Affinity Communication Networks. Manag. Commun. Q. 2023, 37, 913–940. [Google Scholar] [CrossRef]
  36. Tabak, R.G.; Duggan, K.; Smith, C.; Aisaka, K.; Moreland-Russell, S.; Brownson, R.C. Assessing Capacity for Sustainability of Effective Programs and Policies in Local Health Departments. J. Public Health Manag. Pract. 2016, 22, 129–137. [Google Scholar] [CrossRef]
  37. Comfort, L.K. Shared Risk: Complex Systems in Seismic Response; Emerald Publishing: Leeds, UK, 1999. [Google Scholar]
  38. López, T. Building Local Health Department COVID-19 Emergency and Risk Communications Capacity. J. Public Health Manag. Pract. 2020, 26, 384–386. [Google Scholar] [CrossRef]
  39. Mitcham, D.; Taylor, M.; Harris, C. Utilizing Social Media for Information Dispersal during Local Disasters: The Communication Hub Framework for Local Emergency Management. Int. J. Environ. Res. Public Health 2021, 18, 10784. [Google Scholar] [CrossRef]
  40. Yihan, X.; Zhenlin, L. Digital Transformation and the Frontier of China’s State Governance. Soc. Sci. China 2024, 45, 70–91. [Google Scholar] [CrossRef]
  41. Pardo, T.A.; Gil-Garcia, J.R.; Luna-Reyes, L.F. Collaborative Governance and Cross-Boundary Information Sharing: Envisioning a Networked and IT-Enabled Public Administration. In The Future of Public Administration around the World: The Minnowbrook Perspective; Georgetown University Press: Washington, DC, USA, 2010; pp. 129–139. [Google Scholar]
  42. Roy, J. Digital Government and Service Delivery: An Examination of Performance and Prospects. Can. Public Adm. 2017, 60, 538–561. [Google Scholar] [CrossRef]
  43. Klein, L.L.; Pereira, B.A.D. The Survival of Interorganizational Networks: A Proposal Based on Resource Dependence Theory. RAM Rev. Adm. Mackenzie 2016, 17, 153–175. [Google Scholar] [CrossRef]
  44. AbouAssi, K.; Bowman, A.O.; Johnston, J.M.; Bauer, Z.; Tran, L. Relations, Resources, and Costs: Exploring Cross-Sectoral Collaboration at the Local Level in a Developing Country. Int. Public Manag. J. 2021, 24, 646–672. [Google Scholar] [CrossRef]
  45. Edwards, G. Mixed-Method Approaches to Social Network Analysis; NCRM: Southampton, UK, 2010. [Google Scholar]
  46. Thomson, A.M.; Perry, J.L. Collaboration Processes: Inside the Black Box. Public Adm. Rev. 2006, 66, 20–32. [Google Scholar] [CrossRef]
  47. Shrestha, M.; Berardo, R.; Feiock, R. Solving Institutional Collective Action Problems in Multiplex Networks. Complex. Gov. Netw. 2014, 1, 49–60. [Google Scholar] [CrossRef]
  48. Hawkins, C.V.; Hu, Q.; Feiock, R.C. Self-organizing Governance of Local Economic Development: Informal Policy Networks and Regional Institutions. J. Urban Aff. 2016, 38, 643–660. [Google Scholar] [CrossRef]
  49. Song, A.M.; Temby, O.; Kim, D.; Cisneros, A.S.; Hickey, G.M. Measuring, Mapping and Quantifying the Effects of Trust and Informal Communication on Transboundary Collaboration in the Great Lakes Fisheries Policy Network. Glob. Environ. Chang. 2019, 54, 6–18. [Google Scholar] [CrossRef]
  50. Freeman, L. The Development of Social Network Analysis. Study Sociol. Sci. 2004, 1, 159–167. [Google Scholar]
  51. Das, K.; Samanta, S.; Pal, M. Study on Centrality Measures in Social Networks: A Survey. Soc. Netw. Anal. Min. 2018, 8, 13. [Google Scholar] [CrossRef]
  52. Long, J.C.; Cunningham, F.C.; Braithwaite, J. Bridges, Brokers and Boundary Spanners in Collaborative Networks: A Systematic Review. BMC Health Serv. Res. 2013, 13, 158. [Google Scholar] [CrossRef]
Figure 1. Theoretical framework of driving mechanisms for the departmental collaborative network in primary-level social risk prevention and control.
Systems 13 00617 g001
Figure 2. Topological map of the departmental collaborative network for social risk prevention and control in J City.
Systems 13 00617 g002
Figure 3. Goodness-of-fit diagnostics for the ERGM.
Systems 13 00617 g003
Figure 4. MCMC convergence diagnostics.
Systems 13 00617 g004
Table 2. Descriptive topological statistics of the J City risk prevention collaborative network.
Network MetricValueNetwork MetricValue
Density0.171Average Path Length2.191
SD of Degree Distribution0.376Cohesion Index0.521
Total Number of Ties604Network Width0.479
Average Degree10.067Small-World Index1.963
Table 3. ERGM results.
VariablesModel 1Model 2Model 3
Edges−1.836 ***
(0.049)
−4.387 ***
(0.202)
−5.662 ***
(0.261)
Mutual 0.474 ***
(0.170)
0.477 ***
(0.182)
GWESP 1.825 ***
(0.170)
1.536 ***
(0.167)
Department Information Communication Capacity 0.068
(0.120)
Department Digital Technology Utilization Capacity 0.135
(0.115)
Department Resource Mobilization Capacity 0.423 ***
(0.115)
Initiating Department Information Communication Capacity 0.079 **
(0.045)
Initiating Department Digital Technology Utilization Capacity 0.261 ***
(0.042)
Initiating Department Resource Mobilization Capacity 0.085 **
(0.045)
Receiving Department Information Communication Capacity 0.230 **
(0.046)
Receiving Department Digital Technology Utilization Capacity −0.207 ***
(0.046)
Receiving Department Resource Mobilization Capacity −0.051
(0.046)
AIC283826112489
BIC284426272563
Notes: standard errors in parentheses. *** and ** represent statistical significance at the 1% and 5% levels, respectively.
Disclaimer/Publisher’s Note: The statements, opinions and data contained in all publications are solely those of the individual author(s) and contributor(s) and not of MDPI and/or the editor(s). MDPI and/or the editor(s) disclaim responsibility for any injury to people or property resulting from any ideas, methods, instructions or products referred to in the content.

