Abstract
The scientific measurement of corporate resilience is a prerequisite for identifying risk vulnerabilities, formulating targeted support policies, and enhancing the stability of the economic system. This paper utilizes data from 2054 listed companies on China’s A-share market from 2007 to 2023 to construct a corporate resilience evaluation system integrating three dimensions: risk resistance, adaptive adjustment, and recovery growth. Using a multi-level dynamic factor analysis, it depicts the multi-dimensional structure of resilience while introducing time series dynamic changes. This study found that corporate resilience has shown a steady upward trend overall, with phased fluctuations before and after major crisis events, which is highly consistent with macro- and microeconomic indicators. And fluctuations are primarily concentrated among low-resilience enterprises. The further analysis of low-resilience enterprises revealed the following: At the industrial level, compared with the primary industry, the secondary and tertiary industries have a higher proportion of low-resilience enterprises. At the regional level, the proportion of low-resilience enterprises in eastern and central regions decreased during shocks, while western regions showed a significant divergence, and northeastern regions consistently underperformed. This study offers empirical evidence and management insights for strengthening corporate resilience and enhancing the resilience of China’s economy. It also offers valuable insights for other countries in addressing external uncertainties and building economic resilience.
1. Introduction
Corporate resilience is the core capability that enables businesses to withstand shocks, maintain stable operations, and achieve sustainable development. It is also the microfoundation for the stability of industrial chains and supply chains, as well as the smooth operation of the national economy. Against the backdrop of accelerating global changes, slowing economic growth, and frequent geopolitical conflicts [1], heightened external uncertainties have placed higher demands on corporate resilience. According to Allianz Research statistics, the global bankruptcy index surged by 10% in 2024, with most countries seeing a rebound in corporate bankruptcy numbers. Enhancing the ability of enterprises to withstand shocks and achieve stable development has become a core issue faced by all countries. Given the above challenges, this study focuses on China, a country that occupies a key position in the global industrial chain and supply chain. As the world’s second-largest economy and largest trading nation, China boasts a vast and diverse corporate system. Its resilience not only affects domestic economic stability but also has spillover effects on global supply chain security and market confidence. In recent years, despite repeated major crises, the Chinese economy has demonstrated remarkable resilience, with a minimal impact and rapid recovery [2], thanks in large part to the strength and resilience of Chinese enterprises. Therefore, accurately measuring the resilience of Chinese enterprises and revealing their dynamic evolution and structural distribution characteristics not only helps to optimize policy responses and strengthen weak links but also provides valuable Chinese experience for global efforts to address risks and challenges and enhance the resilience of economic systems.
There are existing methods for measuring corporate resilience, primarily including the core variable method and the comprehensive indicator method. The selection of core variables can be further divided into financial indicators and market indicators: financial indicators focus on metrics such as the revenue growth rate [3], main business revenue [4], return on net assets [5], and net profit margin [6] to assess a company’s operational flexibility before and after a crisis; market indicators primarily utilize variables such as the stock price decline and recovery time [7] or the stock price yield [8] to reflect a company’s ability to respond to and adjust for risks in real time. The comprehensive indicator method integrates multi-dimensional indicators to construct a corporate resilience assessment system, with data primarily sourced from questionnaire scales or corporate financial statements. Early scholars primarily designed questionnaire scales or conducted targeted interviews around core dimensions such as adaptability, planning ability, and recovery ability [9,10], using subjective weighting methods to measure the strategic tendencies and behavioral patterns of corporate management under uncertainty [11], emphasizing the critical role of cognition and organizational behavior in the formation of resilience. In recent years, relevant studies have mostly been based on publicly available financial data, using entropy weighting to construct a corporate resilience index from the perspectives of corporateresistent capacity, recovery capacity, reorganization capacity, and development capacity [12,13]. These existing methods, with their structured and systematic advantages, have gradually become important tools for measuring corporate resilience, providing both theoretical foundations and empirical support for revealing its influencing factors and evolutionary mechanisms.
Existing methods have established a general framework for measuring corporate resilience, but they have limitations in terms of data dimensions and model calculations, making it difficult to ensure the scientific and accurate nature of the measurement results. On the one hand, the existing research generally faces challenges in balancing the sample selection and indicator choice. Resilience calculations based on the core variable method suffer from the issue of a limited indicator selection, while resilience measurements based on questionnaire scales are only applicable to small sample sizes. This results in a narrow analytical perspective on corporate resilience, failing to fully reflect its complex connotations and resulting subjective selection biases. On the other hand, the existing research uses subjective weighting or entropy weighting for indicator system weight calculations, which leads to biases and inconsistencies. This results in resilience measurement outcomes lacking longitudinal comparability, making it difficult to conduct cross-period dynamic evaluations. As a comprehensive capability, resilience involves complex trade-offs and interdependent relationships among its internal attributes, making it difficult to measure using static, fixed weights. Due to the limitations of measurement methods, the composition and evolutionary mechanisms of corporate resilience are difficult to uncover, leading to unclear resilience improvement pathways, coarse regulatory strategies, and a lack of targeted, differentiated optimization measures and policy recommendations. This not only limits the academic community’s deepening understanding of the concept of resilience but also constrains the formulation and implementation of effective intervention measures at the practical level.
Overall, the existing literature remains insufficient in terms of measuring the dynamism and systemic nature of resilience, particularly in the context of large samples and long-term time series. There is a lack of unified and temporally comparable corporate resilience index tools, making it difficult to effectively reveal its evolutionary path and structural heterogeneity characteristics. Especially in the context of multiple external shocks, there is a lack of empirical spatiotemporal evolutionary analysis. This paper aims to address these gaps by constructing a resilience index suitable for a dynamic evolutionary analysis and systematically characterizing its heterogeneous distribution patterns at the industrial and regional levels. Based on this, this paper focuses on the following core research questions: (1) What dynamic evolutionary characteristics does corporate resilience in China exhibit over time under the backdrop of multiple external shocks? (2) Are there significant differences in corporate resilience at the industrial and regional levels? (3) How can more targeted and differentiated intervention measures be provided for policy-making?
This paper uses 2054 listed companies on China’s A-share market from 2007 to 2023 as the research sample. It uses a multi-level dynamic factor analysis to construct a corporate resilience index, aiming to achieve the unified modeling and dynamic extraction of corporate characteristic indicators across time dimensions. Compared with the existing research, the marginal contribution of this paper lies in two aspects. First, it improves the scientific and accurate measurement of corporate resilience. Based on a dynamic perspective, this paper constructs a comprehensive indicator system for corporate resilience and introduces a multi-level dynamic factor analysis that can effectively extract representative factors from the corporate resilience indicator system without sacrificing the dimensions of the indicators. This method balances the sample size and indicator breadth, demonstrating a strong comparability and explanatory power over time, thereby effectively addressing the shortcomings of traditional methods in terms of longitudinal identification and dynamic measurement. Second, its expands the application of corporate resilience measurements in policy design. Through a systematic analysis of the temporal evolution trajectories of corporate resilience across different industries and regions, this paper identifies the distribution characteristics of corporations with relatively weak resilience in multiple rounds of shocks, providing micro-level evidence for policymakers. The measurement of the corporate resilience index provides decision-making references for implementing differentiated and phased policy interventions, enhancing the targeting and effectiveness of policies.
2. Conceptual Framework and Research Design
2.1. Conceptual Framework
Corporate resilience refers to “the ability of a company to effectively respond to external uncertainties and shocks within the constraints of existing resources and the environment, maintain stable operations, and explore sustainable development pathways.” The existing research on the definition of corporate resilience primarily divides it into static and dynamic categories. Under the static perspective, enterprise resilience is defined as the characteristics or recovery outcomes of a company in responding to adversity, i.e., the ability to maintain operations and return to a stable state under external disturbances [14,15]. However, this definition overlooks the temporal development and original driving characteristics of corporate resilience. The dynamic perspective emphasizes that corporate resilience is the process or ability to identify environmental changes, integrate resources, withstand shocks, and achieve sustainable development [16], placing a greater emphasis on the evolution of resilience stages and feedback mechanisms. Therefore, this paper adopts the dynamic perspective, whose core elements include the following three points.
First, corporate resilience is reflected in risk resistance capability. During the early stage of sudden external shocks, risk resistance determines whether a firm can maintain stable production and operational continuity, which can be measured from three aspects: financial stability, market stability, and risk prevention. Firstly, financial vitality is a key indicator of a firm’s survival capacity [17]. Enterprises with sound financial conditions and reasonable capital structures possess stronger adaptability and resource allocation flexibility [18], enabling them to maintain liquidity and alleviate pressures brought by external uncertainties during abrupt disruptions [19]. Secondly, market stability represents a firm’s ability to sustain investor confidence and market share [20]. Firms with solid market positions and stable valuation tend to retain competitive advantages amidst industry volatility, thereby reducing the negative impacts of market fluctuations on liquidity and financing capabilities. Lastly, the risk prevention capability reflects a firm’s ability to manage its capital structure and leverage level prudently [21]. By establishing robust financial buffers and enhancing resilience to external risks, enterprises can sustain financial soundness and operational stability under high uncertainty [22].
Second, corporate resilience is reflected in the adaptive adjustment capacity. This dimension captures the responsiveness and adjustment capability of firms during the deepening phase of external shocks, emphasizing the restructuring and optimization of both internal and external resources. It encompasses three key aspects: resource allocation, environmental adaptability, and governance structures. Firstly, resource allocation capability forms the fundamental basis for firms to adapt to external changes. According to dynamic capability theory [23], firms with efficient resource allocation mechanisms can dynamically reallocate key resources in response to market demands, achieving an optimal combination and utilization of resources [24], thereby maintaining operational flexibility in complex environments. Secondly, external environmental adaptability has become one of the key capabilities for enterprises to respond to external risk shocks [25]. This capability not only reflects the response speed and flexibility of enterprises in markets but also reflects their integration and coordination capabilities in supply chain networks [26]. Stable upstream and downstream relationships, a loyal customer base, and a dominant position in the industrial chain help companies maintain operational continuity and resource allocation capabilities in the event of sudden shocks, thereby improving their crisis response effectiveness. Lastly, the flexible governance structure can enhance a company’s strategic responsiveness and performance [27], which is crucial for companies to quickly adapt to external shocks and achieve organizational restructuring. Companies with sound governance systems and agile decision-making can complete organizational adjustments and strategic revisions more quickly, improving overall coordination and risk response capabilities [28]. A stable management team, loyal employees, and good corporate governance structures all help to improve a company’s crisis management capabilities.
Third, corporate resilience is reflected in the recovery and growth capacity. This dimension captures the speed of recovery and the potential for rebound during the post-shock phase, assessing whether firms can quickly restore operational order and achieve sustainable development. It is measured through profitability, the recovery speed, and the growth potential. Firstly, profitability serves as a key indicator of a firm’s capacity for sustained development. Firms with stable profit levels and high earnings quality are more capable of resource accumulation [29], enabling them to maintain operational stability and enhance both their repair capability and steady growth during adverse conditions. Secondly, the recovery speed reflects a firm’s operational repair capacity. Enterprises with high managerial efficiency and a smooth turnover of assets and capital demonstrate strong operational control and repair capabilities [30], allowing them to reduce the duration of negative impacts. Lastly, the growth potential represents a firm’s ability for strategic upgrading and value enhancement [31]. Firms with a robust market expansion capacity and strong capital appreciation potential are better positioned to seize new opportunities in uncertain environments, achieving growth and breakthroughs amid crises.
In summary, this paper defines corporate resilience as a multi-dimensional, dynamically evolving composite capability system, covering the whole process of pre-crisis preparation, crisis response, and post-crisis recovery. Specifically, it includes the following: the risk resistance capability to maintain the basic operation and stability of the enterprise in the face of external shocks; the adaptive adjustment capacity to realize resource reorganization and a strategic adjustment in the midst of drastic changes in the environment; and the recovery and growth capacity to restore normalcy and promote the sustainable development of the enterprise after the shocks.
2.2. Research Design
2.2.1. Indicators System
According to the connotation analysis and conceptual framework of corporate resilience, this paper constructs an indicator system including 3 dimensions, 9 attributes, and 35 indicators (Table 1). Based on the existing research and the relevant literature [12,30,32], this paper initially selected 49 candidate indicators. Using KMO values greater than 0.6 and Bartlett’s sphericity test at a 1% significance level as criteria, indicators with weak relationships that are unable to effectively extract research item information were removed from each dimension. Ultimately, 35 core indicators with representativeness and explanatory power were retained. The remainder of this paper is based on this indicator system for the modeling and indicator measurement.

Table 1.
Corporate resilience evaluation indicators system.
2.2.2. Research Methodology
In this paper, a multi-level dynamic factor analysis is used to measure corporate resilience [33,34]. First of all, based on the three dimensions of risk resistance, adaptive adjustment, and recovery growth, the two-factor variance dynamic factor model is constructed, the potential driving factors in each dimension are extracted, and the scores are calculated; then, based on the scores of the three dimensions, the model is constructed again, and the overall corporate resilience index is formed. Compared with traditional methods, such as the principal component analysis and entropy weighting, the multi-level dynamic factor analysis adopted in this paper can take into account the dynamics of the time series, the relevance of the variables, and the complexity of the hierarchical structure and provide a more scientifically robust statistical tool for the measurement of the corporate resilience index.
The principle of the dynamic factor analysis is to synthesize the cross-sectional results of the principal component analysis with the time series results of the linear regression, specifically, assuming that the given data is
where denotes the sample, denotes the indicator, and denotes the time point; then, each observation can be decomposed into the following form:
where represents the mean value of each indicator ignoring the difference between the time and samples; represents the difference in the static structure between samples after excluding the time factor; represents the effect of dynamic changes in time while ignoring the difference between samples; and represents the complete dynamic difference resulting from the interaction between samples and time. Based on the decomposition of Equation (2), the total variation can be divided into the following equation:
where represents the overall variance and covariance matrix, which can be expressed as the sum of three different variance and covariance matrices; represents the static structure matrix of the sample, which is the variance and covariance matrix of the sample mean across time points, reflecting the relative structural differences between the samples without considering the time factor; represents the single-sample dynamic variance matrix, i.e., the variance and covariance matrix of the sample interaction with time, reflecting the difference between the overall average trend of change and that produced by the trend of change in the single-sample dynamics; and represents the differences at different points in time obtained through linear regression, reflecting the trend of change in the sample due to the time factor. The equation can be further processed by using to represent the sum of and , which represents the average covariance matrix at each time point extracted through the principal component analysis. The regression equation can be expressed as
where is a constant term, is the estimated coefficient of , and is a disturbance term. should satisfy the following conditions:
Based on the above model, the specific calculation steps of the dynamic factor analysis method are as follows:
First, this paper draws on the practice of the World Economic Forum (WEF) and adopts the Min–Max standardization method to standardize the data of each three-level indicator:
where the normalized data is denoted by .
Second, based on the period-by-period covariance matrix , calculate the average covariance matrix, i.e.,
Third, solve for the eigenvectors, eigenvalues, and variance contribution of the mean covariance matrix .
Fourth, calculate the matrix of the mean scores for each sample:
where , , , , , and is the th feature vector.
Fifth, calculate the dynamic score matrix for each sample based on the mean values of the indicators for each period:
Sixth, use the ratio of the eigenvalues corresponding to each principal component to the sum of the eigenvalues extracted from the principal components (variance contribution rate) as the weight to calculate the dynamic score.
2.2.3. Data Sources
This paper selects Chinese A-share-listed companies in Shanghai and Shenzhen from 2007 to 2023 as the research object, and the corporate financial and governance structure data are all from the China Stock Market & Accounting Research (CSMAR) database (https://data.csmar.com/, accessed on 10 June 2025). The CSMAR database covers the listed company financial database, financial notes database, and governance structure research database of Chinese listed companies, which is one of the most comprehensive economic and financial research databases in China at present. In order to ensure the accuracy and reliability of the data, the obtained data are screened and processed as follows: (1) All financial industry companies are deleted. (2) Enterprises labeled as ST, *ST, and delisted within the sample interval are removed. (3) We removed firms with serious data anomalies or missing data. (4) A few missing values were imputed using multiple imputation methods. (5) All indicators were standardized according to Equation (6) to eliminate scale differences and enhance the comparability across firms and time. After the above data screening and processing, the final panel data containing 34,918 valid observations for 2054 firms from 2007 to 2023 is obtained.
3. Results and Analysis
3.1. Results of Variability
Following the calculation principle of the dynamic factor analysis, this paper takes the threshold of the cumulative variance contribution rate exceeding 80% as the criterion for extracting factors, obtains the refined weights of three dimensions, and calculates the indices of the risk resistance capacity, adaptive adjustment capacity, and recovery growth capacity of China’s listed companies in the period of 2007–2023. Among them, three common factors are extracted for the enterprise risk resistance capacity, with a cumulative variance contribution rate of 84.52%; five common factors are extracted for the enterprise adaptive adjustment capacity, with a cumulative variance contribution rate of 85.39%; and four common factors are extracted for the enterprise recovery growth capacity, with a cumulative variance contribution rate of 81.71% (Table 2). As a result, this paper obtains the refined weights of the three dimensions according to the variance contribution rate and calculates the risk resistance, adaptive adjustment, and recovery growth index of China’s listed companies from 2007 to 2023.
Table 2.
Variance explanation of dimensions.
Based on the calculated scores of the three subdimension indicators, the dynamic factor analysis was conducted again. The comprehensive evaluation of the corporate resilience level extracts one common factor with a variance contribution rate of 80.249% (Table 3). Based on the variability, this paper obtains the refined weights of the corporate resilience evaluation index system and thus calculates the level of the corporate resilience index during the sample period.
Table 3.
Variance explanation of corporate resilience.
3.2. Validity Analysis
3.2.1. Comparison with Realistic Indicators
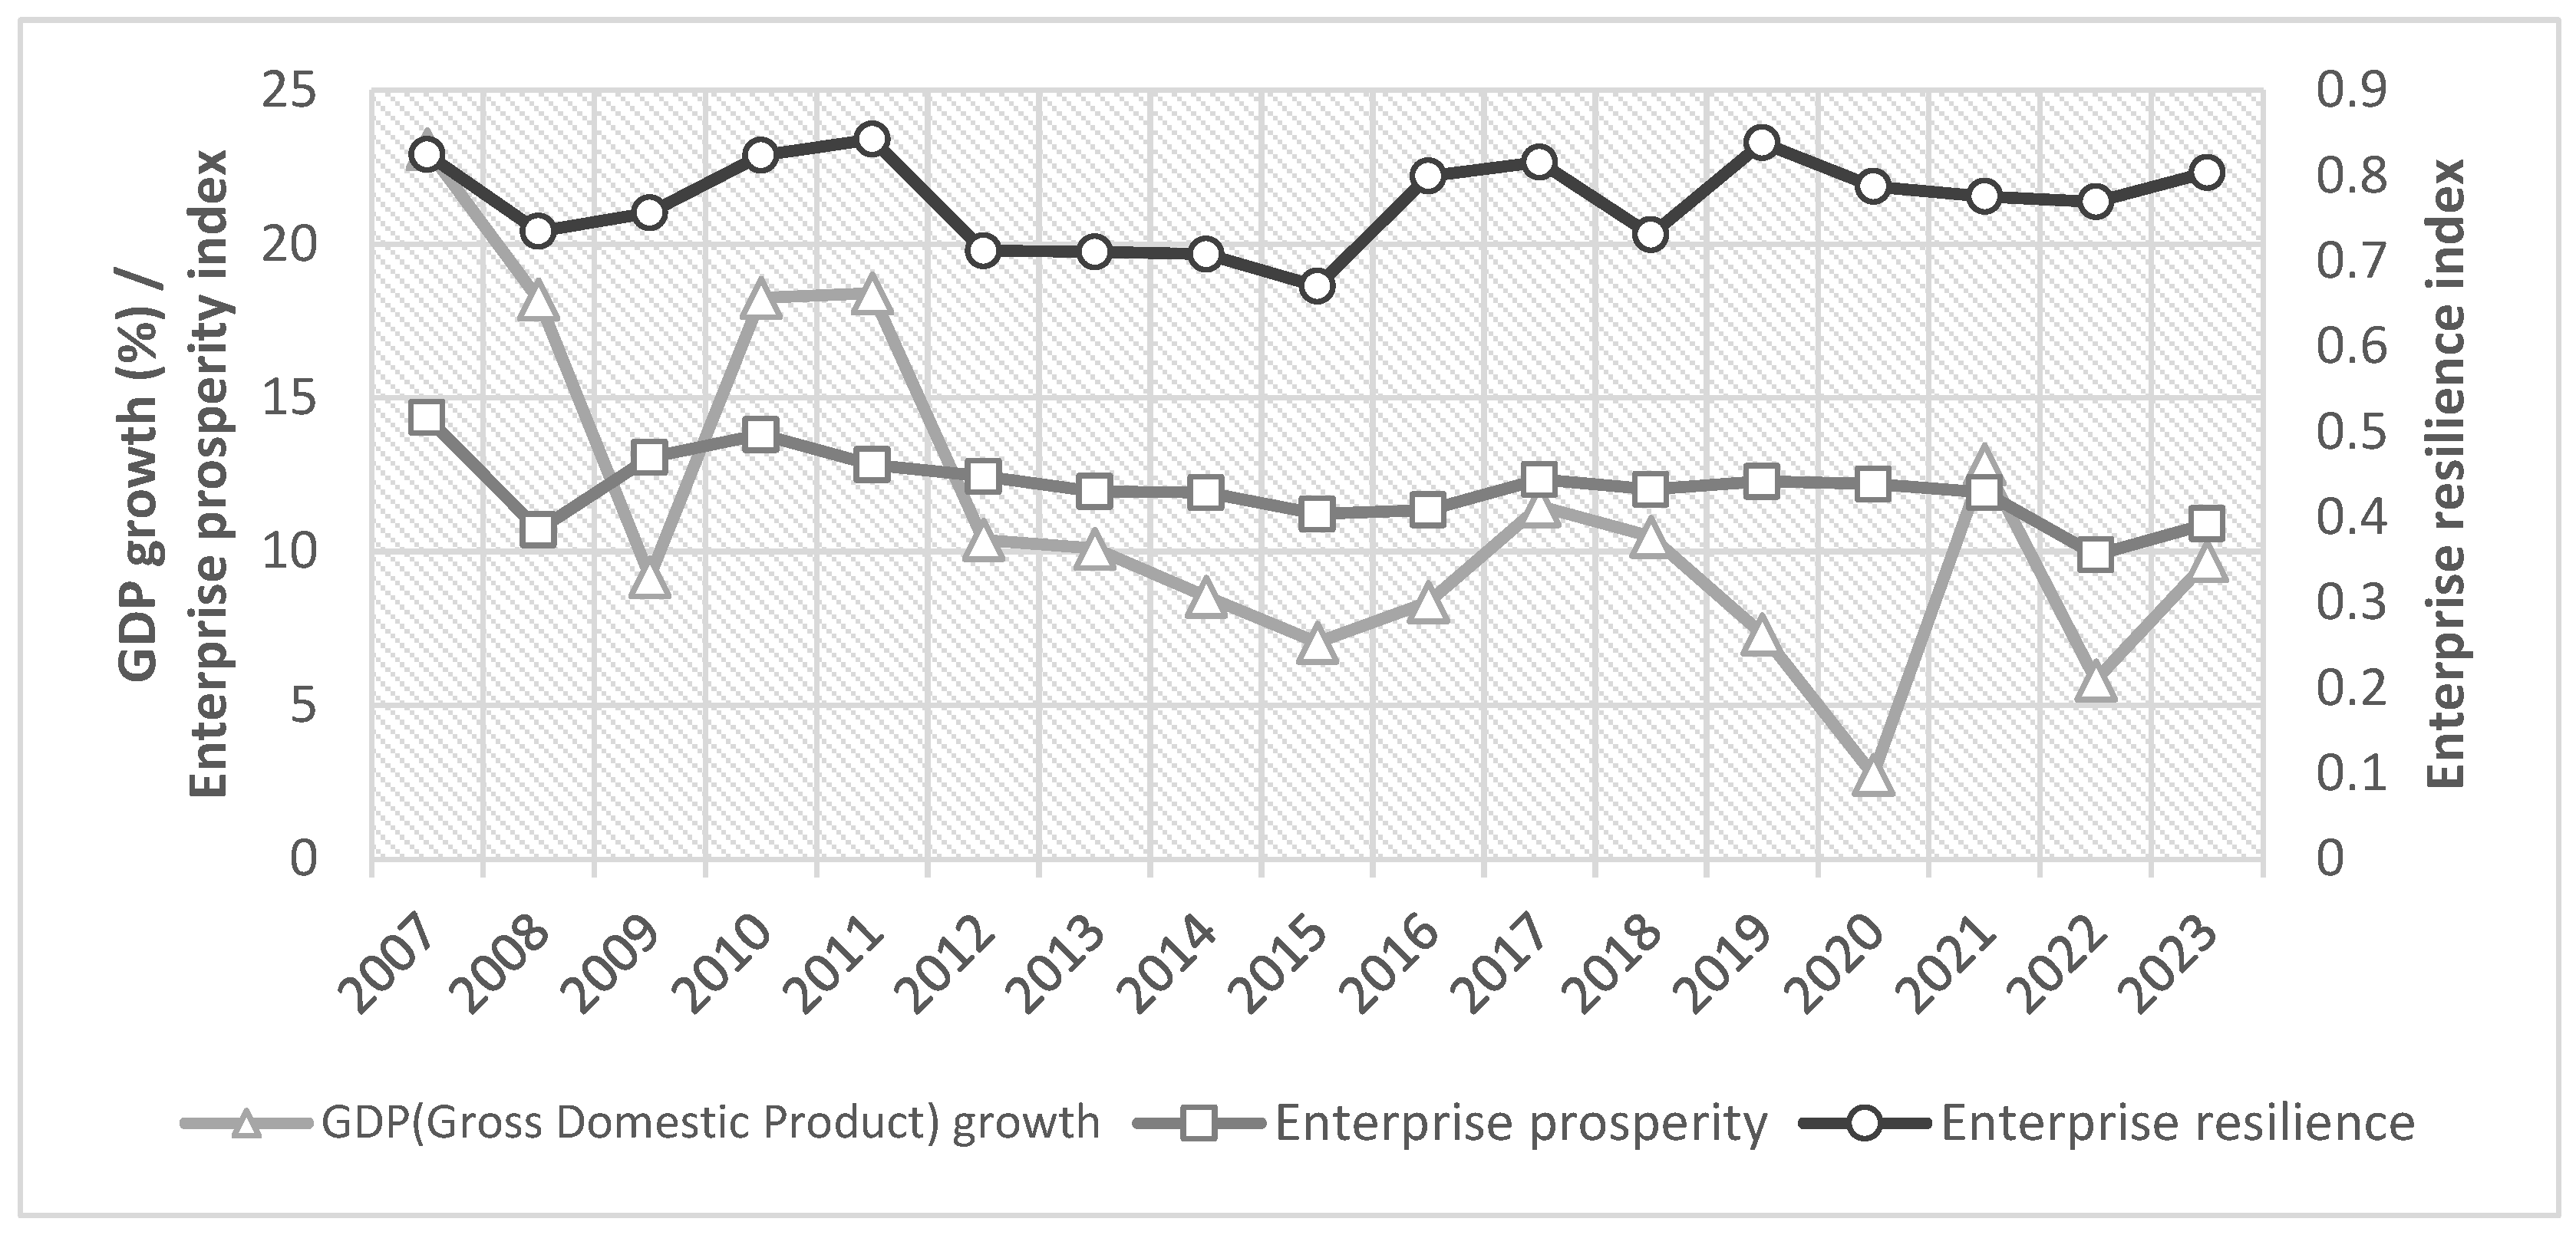
In order to verify the scientificity and validity of the index construction, this paper starts from two perspectives of macroeconomics and microeconomics and selects the GDP growth rate and the enterprise prosperity index as the reference of realistic indicators and conducts the fit test of the corporate resilience index constructed in this paper. Among them, the enterprise prosperity index is a composite index calculated by weighting the enterprise prosperity index and the expected enterprise prosperity index [35], which can be used as a pre-indicator for judging economic fluctuations and is consistent with the connotation of the enterprise resilience measured in this paper. The analysis results show that the mean value of the corporate resilience index and the enterprise prosperity index show a consistency in the trend direction, and both of them also maintain a high degree of synchronization in the dynamic changes. Changes in economic activity often need a certain amount of time to be transmitted to the entire economic system, so there is a certain lag in the trend of the GDP growth compared with the two, but the overall trend is basically the same (Figure 1). The comprehensive analysis shows that the corporate resilience index is highly consistent with macro and micro real economic indicators, which verifies the rationality and effectiveness of the index system and measurement method.
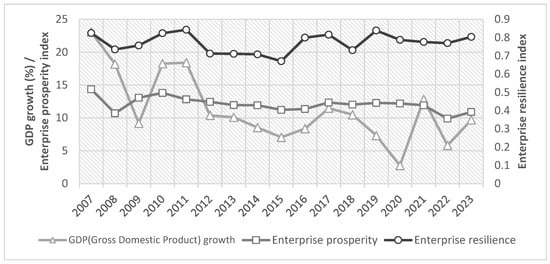
Figure 1.
Realistic indicators vs. corporate resilience index.
3.2.2. Comparative Testing with Existing Corporate Resilience Indicators
In order to verify the reliability and explanatory power of the constructed corporate resilience index, this paper refers to existing corporate resilience measurement methods and introduces stock returns as a comparative indicator for testing. Existing studies have pointed out that when investors anticipate that a company will be significantly affected by shocks and its subsequent performance may decline significantly, they often adjust their holdings in advance, thereby causing a decline in stock returns [36]. Based on this, this study selected four major crisis events experienced by Chinese enterprises between 2007 and 2023 as natural experiment scenarios, namely the 2008 financial crisis, the 2015 stock market turmoil, the 2018 US–China trade conflict, and the 2020 COVID-19 pandemic [37,38]. The top 10% of companies ranked by resilience index are defined as the high-resilience group, while the bottom 10% are defined as the low-resilience group. This study examines the stock return performance of the two groups during three time windows: the year prior to the crisis (t − 1), the year of the crisis (t), and the year following the crisis (t + 1).
Empirical results show that, under the aforementioned major shock scenarios, high-resilience companies consistently outperformed low-resilience companies in terms of annual stock returns across different stages, with most mean difference t-tests reaching a statistical significance (Table 4). Specifically, during the t − 1 to t period, the high-resilience group exhibited a relatively stable performance, while the stock returns of the low-resilience group generally declined. During the t to t + 1 period, the stock returns of both groups recovered, but the recovery was more pronounced in the high-resilience group. This indicates that the corporate resilience index constructed in this study possesses a good discriminative ability and external validity in actual crisis shocks, effectively identifying a company’s ability to respond to external risks. Although stock returns can reflect the market’s expected response to corporate resilience, they are essentially a single-dimensional and relatively indirect measure. In contrast, this paper constructs a multi-indicator system based on three dimensions, the risk resistance, adaptive adjustment, and recovery growth, and introduces a multi-level dynamic factor analysis, which has stronger theoretical support and empirical explanatory power.
Table 4.
Stock return differences between high- and low-resilience firms around major crisis events.
3.3. Character Analysis
Major crisis events, as typical external shocks faced by enterprises, serve as a natural testing ground for measuring and observing corporate resilience. Therefore, this paper further regards the four external shocks mentioned earlier as key nodes and focuses on examining the trends and distribution characteristics of corporate resilience and its various dimensions before and after the occurrence of these shocks, thereby analyzing the dynamic evolution of corporate resilience.
3.3.1. Trend Analysis of Corporate Resilience
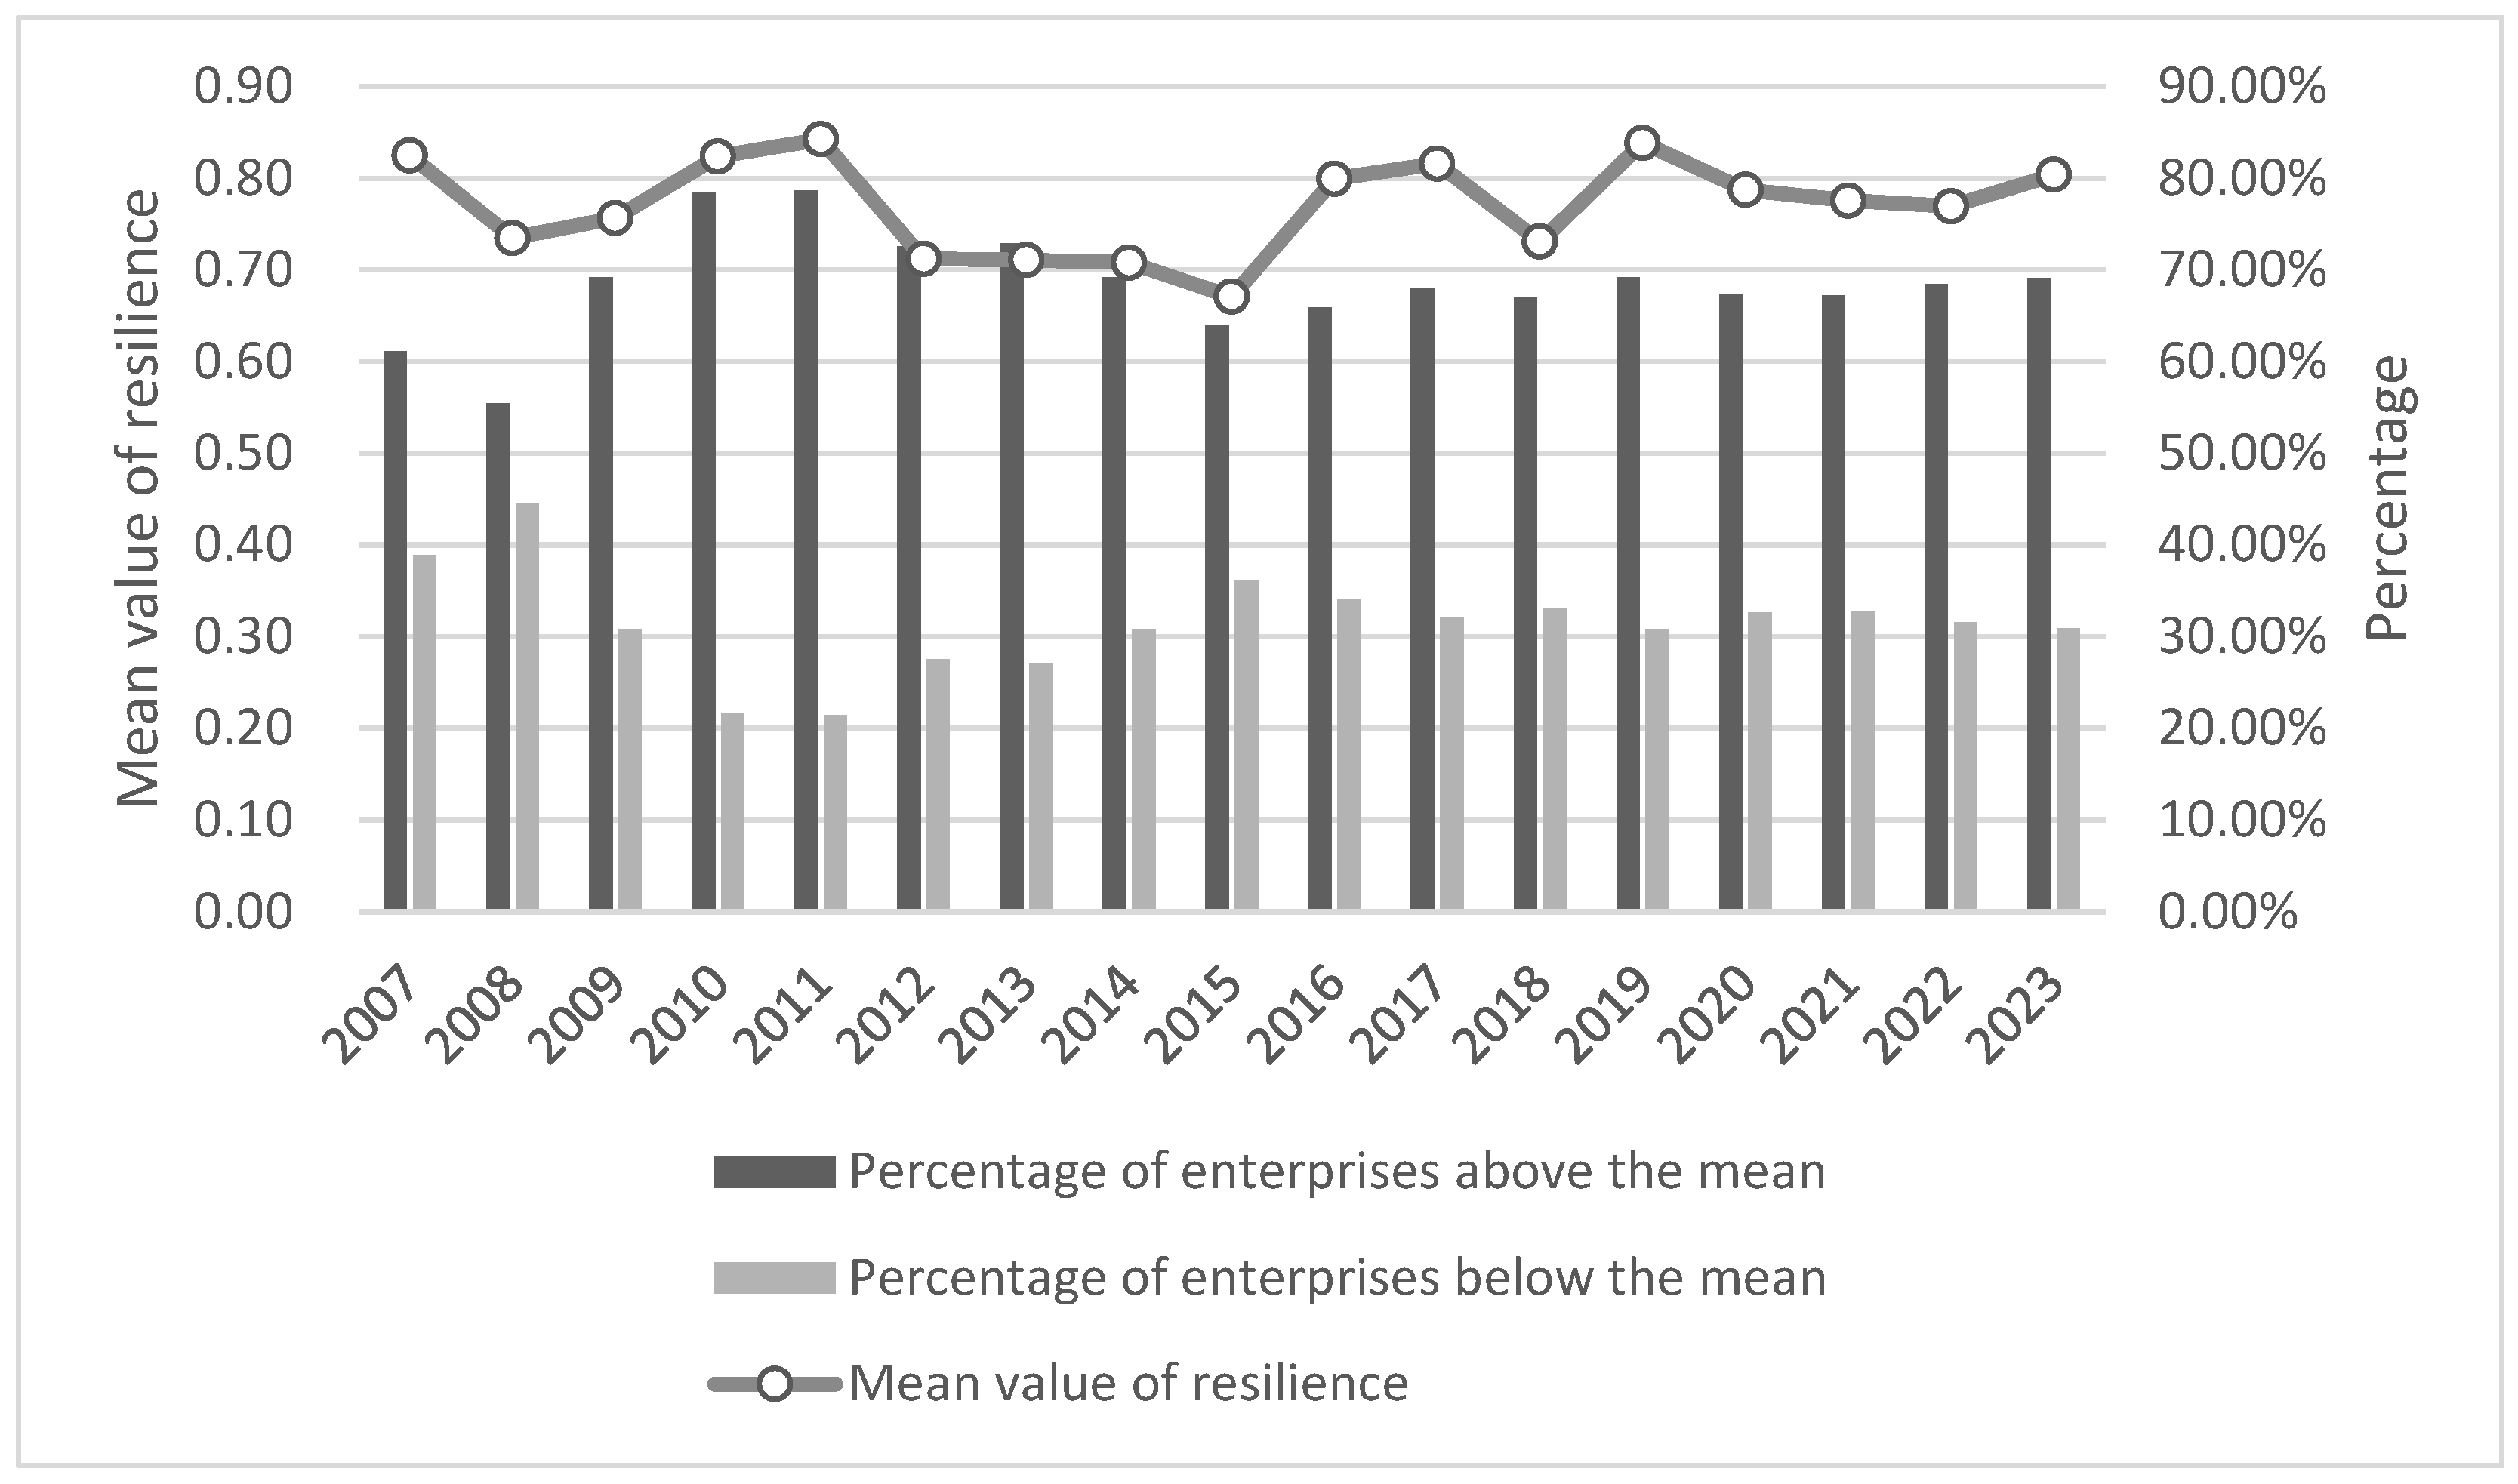
During the sample period, corporate resilience had significant phase fluctuations during several major crisis events, with the overall trend characterized by a decline followed by a gradual rebound (Figure 2). During the 2008 financial crisis, the corporate resilience index fell from 0.82 to 0.73, while since 2009 the resilience index has rebounded rapidly, clearly demonstrating the process of the resilience repair and reconstruction after the crisis. Similarly, under the economic scenarios of the stock market crisis in 2015 and the trade dispute between China and the U.S. in 2018, corporate resilience both showed an initial decline followed by a strong rebound. The resilience index basically stabilized in 2019, but resilience sank again in 2020 under the impact of COVID-19. With the negative impact of COVID-19 on the economy and society under effective control, the decline in corporate resilience will gradually slow down and turn into an upward trend in 2023, signaling that the overall resilience of China’s enterprises has gradually stepped out of the shadow of the impact and regained the growth momentum.
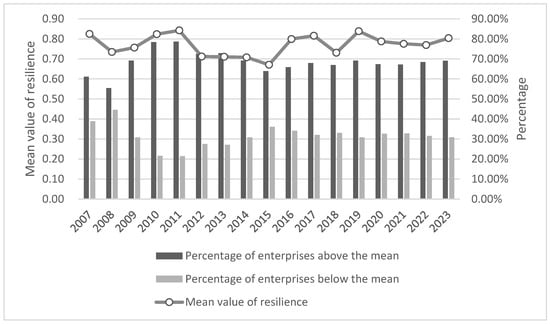
Figure 2.
Distributional structure of corporate resilience and mean value of resilience.
In terms of the distribution of the number of firms, the proportion of firms with resilience scores above the mean is consistently larger than that of firms with scores below the mean, and the structure of the proportion features a mildly right-skewed distribution. During the 2008 and 2015 crises, the percentage of highly resilient enterprises declined more, while in the 2018 trade conflict and the 2020 COVID-19 crisis, the percentage of highly resilient enterprises declined slightly but the magnitude was significantly narrowed, indicating that the overall ability of enterprises to cope with external shocks has been strengthened. Overall, China’s corporate resilience has demonstrated a strong stability and structural advantages in multiple rounds of major shocks, but the persistence of a group of low-resilience firms, accounting for about 30% of the total, constitutes a major source of resilience volatility.
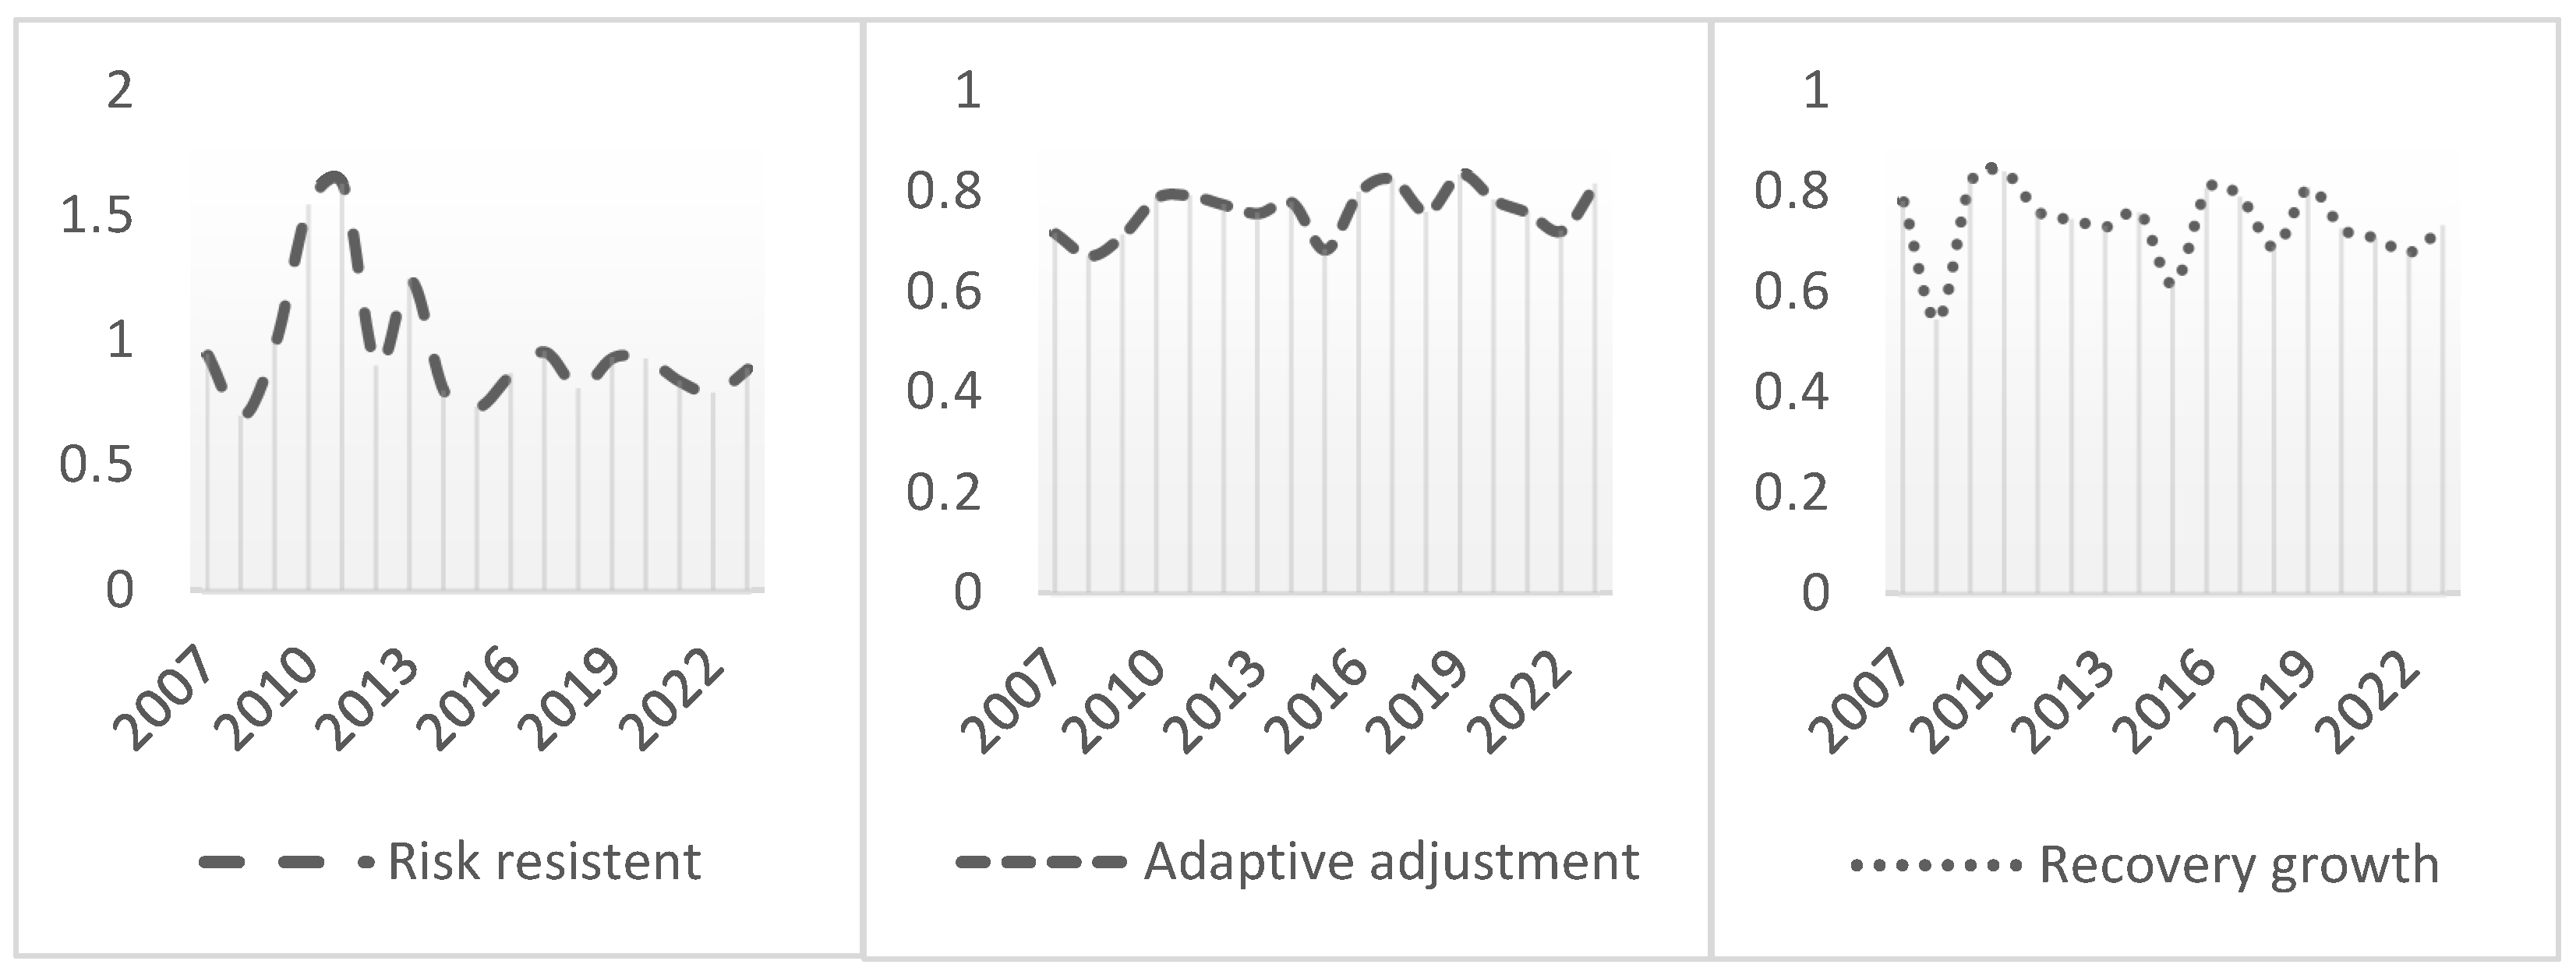
During the periods surrounding several major crisis events, the indices for various dimensions of corporate resilience also exhibited significant phased fluctuations (see Figure 3). First, the risk resistance capacity plummeted during the 2008 financial crisis, rebounded rapidly in 2010, and subsequently exhibited an accelerating rebound trend in subsequent fluctuations. This pattern of an initial decline followed by stabilization indicates that when faced with major external shocks, companies often struggle to maintain financial and market stability in the early stages. However, after accumulating experience, optimizing capital structures, and enhancing risk response mechanisms, their short-term resilience significantly improves. Second, the adaptive adjustment capacity exhibited relatively stable fluctuations with smaller amplitudes during the observation period. Compared to other dimensions, the adaptability and adjustment capability rely more on corporate resource reallocation, internal structural optimization, and sustained coordination with the external environment. Such adjustments are often rooted in medium- to long-term strategic planning and are less susceptible to the severe impacts of short-term economic fluctuations. This stability reflects both the institutional inertia at the organizational level and the company’s ability to achieve an endogenous adaptation through systemic adjustments in times of change. Finally, the recovery growth capacity exhibited a phased decline during crisis events, particularly during the 2008 financial crisis and the 2015 stock market turmoil, indicating that companies were impacted to varying degrees in terms of their profitability, operational efficiency, and growth momentum. From an overall trend perspective, this capability exhibits a stable upward trajectory and remains at a high level during non-crisis periods, indicating that most enterprises possess a strong foundation for growth recovery and medium- to long-term development resilience.
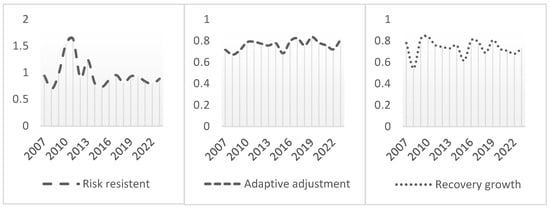
Figure 3.
Dimensions of corporate resilience index.
In summary, during the period from 2007 to 2023, Chinese enterprises demonstrated strong stability and structural advantages in terms of resilience, maintaining a steady rebound in their resilience index despite multiple major external shocks. However, judging from the stage-by-stage fluctuation of resilience scores, the differentiated response of each dimension, and the fact that the proportion of low-resilience firms has remained at around 30% for a long time, the resilience of firms has not been improved in a balanced manner, and there are still significant structural differences and weaknesses. Therefore, further identifying the industrial affiliation and regional concentration characteristics of low-resilience enterprises is of great practical significance for understanding the micro-mechanisms of resilience fluctuations, identifying potential sources of risk, and formulating targeted policy interventions and capacity-building paths.
3.3.2. Distributional Analysis of Low-Resilience Enterprises
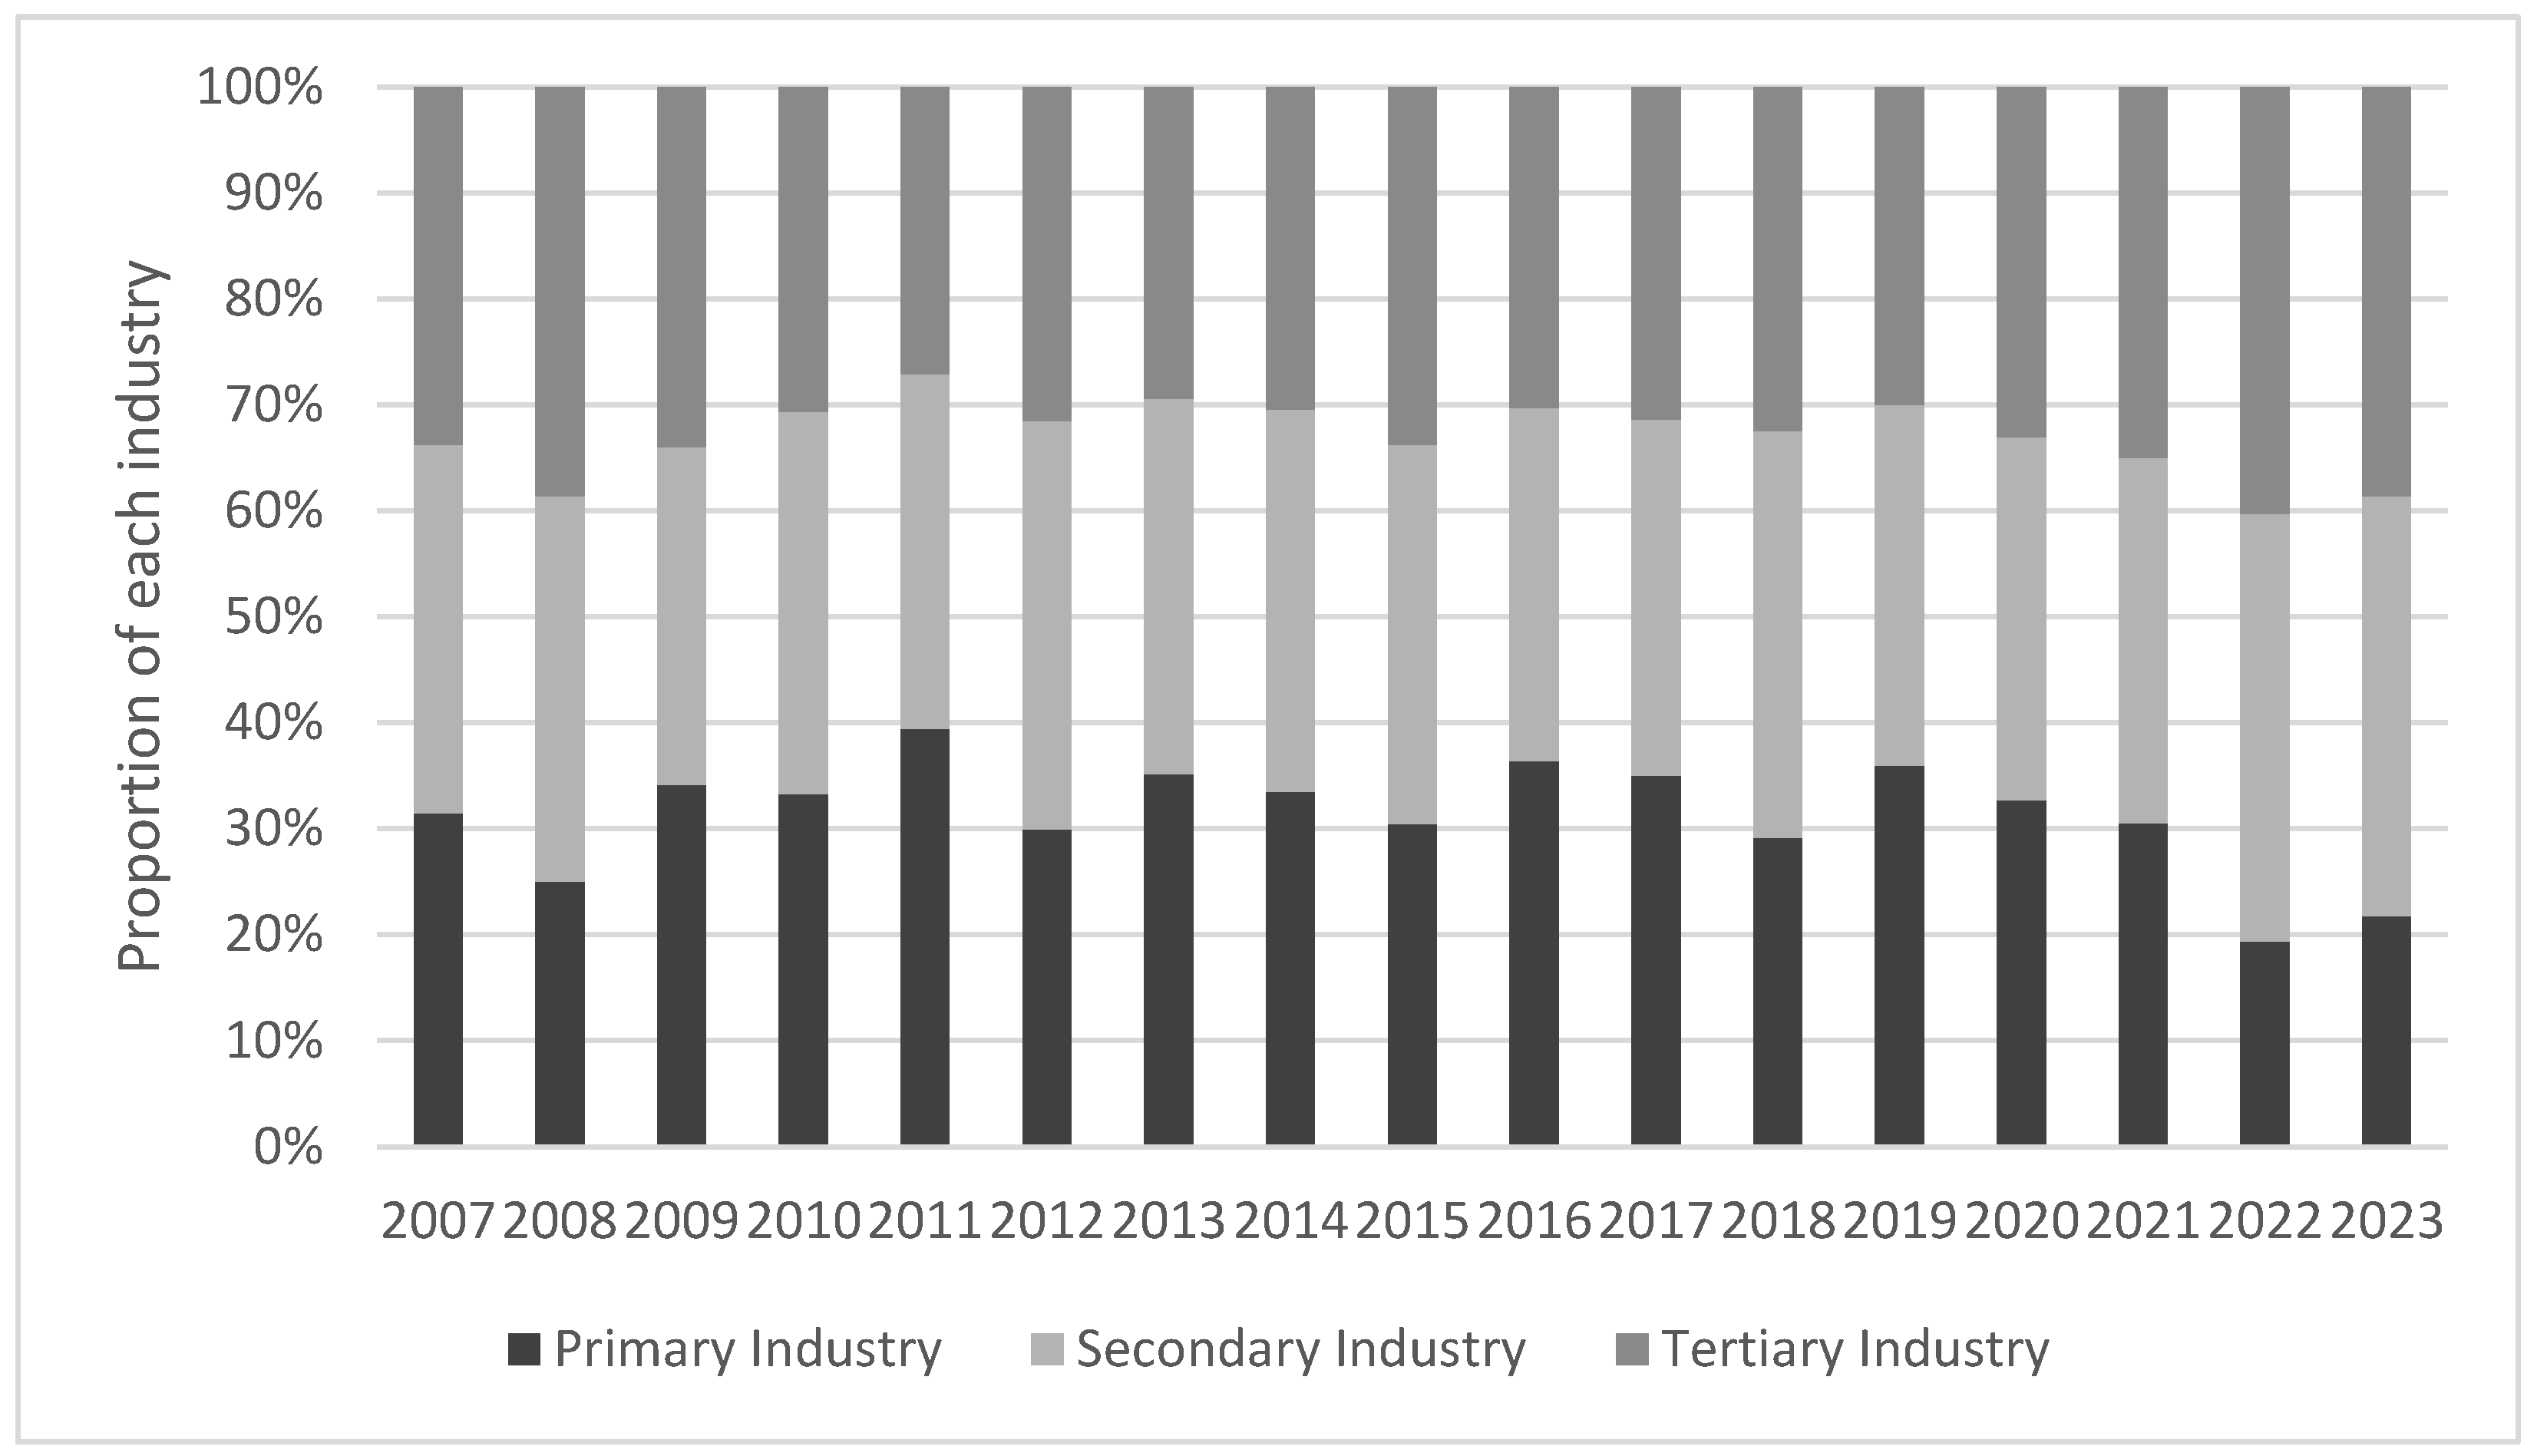
In terms of industrial distribution, there are significant differences in the share of low-resilience firms in different industries (Figure 4). First, the overall proportion of the primary industry is relatively low, reflecting that enterprises in the primary industry, such as agriculture enterprises, have a certain buffer against economic cycle fluctuations due to the attribute of a rigid product demand and the influence of strong policy intervention. However, due to the more traditional structure of the primary industry, slow technological progress, and resource and environmental constraints, its fluctuations are still affected by natural factors and structural adjustment, showing cyclical changes [39]. Second, the proportion of low-resilience enterprises in the secondary industry is relatively high, with a significant climb in all four major crisis years, indicating that enterprises in the secondary industry, such as the manufacturing industry, are not only affected by the global industrial chain and are highly sensitive to external demand and trade barriers but also face the problems of lagging technological upgrading and overcapacity [40]. Although the rise in the share of the secondary industry during the 2020 epidemic slowed down compared with previous crises, the continued high volatility indicates that the pressure on the resilience of the secondary industry still exists. Finally, the tertiary industry exhibits obvious industry chain transmission effects and persistent risks. During the 2008 financial crisis, international trade and logistics declined sharply, hitting the export-related service industry hard. After 2015, the risks are mainly concentrated in the domestic demand-based service industry, especially construction services. Most of the tertiary industries are capital-intensive and technology-intensive [41], facing challenges such as an over-reliance on a single downstream industry, slow digital transformation, and intensified regional homogenization and competition, and risks persist.
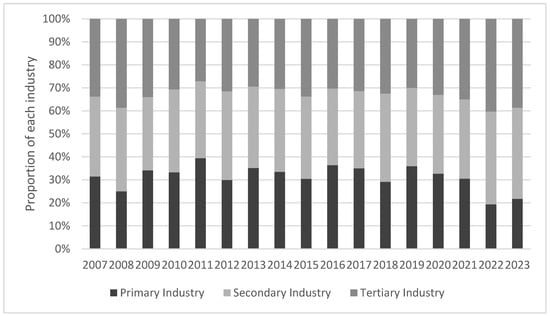
Figure 4.
Industrial distribution of firms below the resilience mean.
In terms of regional distribution, the share of low-resilience firms shows a clear spatial heterogeneity, and the regional structure evolved before and after the four major shocks (Figure 5). Enterprises in the eastern region gradually transformed from “high-exposure” to “high-adaptation” during the crises. The high proportion of low-resilience enterprises in export-oriented provinces such as Guangdong, Jiangsu, and Zhejiang in 2008 highlights the vulnerability associated with a high dependence on the international market. Along with the rise of the digital economy and the transformation and upgrading of the manufacturing industry, the proportion of low-resilience enterprises in most eastern provinces declined significantly in 2018 and 2020, reflecting that enterprises have gradually built up a stronger shock-resistant capacity in the reconstruction of the supply chain and the iteration of technological innovation [42]. Enterprises in the central regions, in the wake of the resilience repair posture of 2008 caused by the decline in external demand, of Henan, Hubei, and Anhui and other low-resilience enterprises accounted for a moderately high amount. However, since 2015, with the acceptance of the eastern industrial transfer and the improvement of the local industrial system [43], most of the provinces in the central region showed a gradual decline in the proportion of low-resilience enterprises, especially in 2020 under the impact of the epidemic, and still showed a strong resilience to pressure, indicating that the regional corporate resilience to construction has made substantial progress. The proportion of low-resilience enterprises in the western region is consistently high and has significant internal differences. Resource-dependent provinces, such as Tibet, Qinghai, and Gansu, were consistently in the resilience disadvantage zone during the sample period, reflecting that constraints such as their single economic structure, prominent position at the end of the industrial chain, and weak local markets have not been fundamentally alleviated [44]. Some provinces, such as Chongqing and Sichuan, have shown a relative improvement in their performance after 2018, indicating that intra-regional improvements in infrastructure and manufacturing upgrades have been effective, but the overall level of resilience is still uneven. In the northeast, the proportion of low-resilience firms remained high during the observation period, with traditional industries declining sharply in 2008 due to the contraction of external demand and the economic deleveraging and weak investment in 2015 further weakening the resilience of firms in the region. Even after 2018, when the overall resilience of enterprises in the country rebounded, the proportion of low-resilience enterprises in the northeast region has not seen any significant improvement, highlighting the systemic challenges that the region still faces in terms of economic structural transformation and resilience system construction.
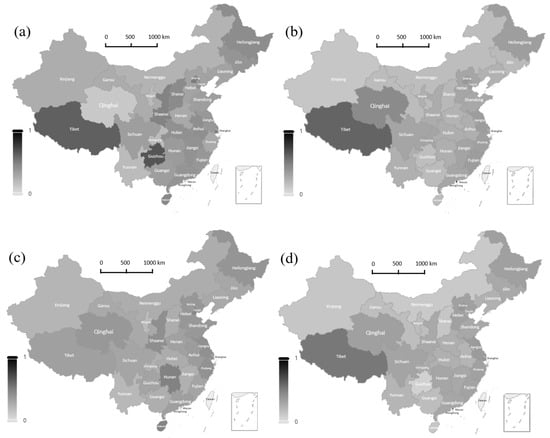
Figure 5.
The regional distribution of firms below the resilience mean.(a) 2008; (b) 2015; (c) 2018; (d) 2020.
4. Conclusions and Recommendations
4.1. Conclusions
Against the background of rising global uncertainty and the frequent occurrence of major shocks, how enterprises can maintain stability and realize recovery and transformation in the turbulent environment has become a core issue affecting economic resilience and sustainable development. Based on the data of China’s A-share-listed companies in Shanghai and Shenzhen from 2007 to 2023, this paper constructs a corporate resilience measurement system covering three dimensions—risk resistance, adaptive adjustment, and recovery growth—through a multi-level dynamic factor analysis to make up for the deficiencies of the existing measurement methods, which are one-sided and lack dynamic comparisons, and to scientifically and accurately realize the dynamic modeling and comprehensive empowerment of corporate resilience. Based on the measurement results, this study systematically portrays the dynamic evolution process of corporate resilience and identifies the key features of the resilience fluctuation in combination with many major crisis events.
Our findings show that the resilience of Chinese corporations exhibits a phased evolutionary pattern of first declining and then recovering when responding to major external shocks. Whether it was the 2008 financial crisis, the abnormal stock market fluctuations in 2015, the US–China trade friction in 2018, or the COVID-19 pandemic in 2020, enterprise resilience experienced a significant decline in the short term before gradually recovering, with an overall trend of steady improvement. However, approximately 30% of low-resilience enterprises persist, constituting the primary source of fluctuations in the overall resilience. The further analysis of the structural characteristics of low-resilience enterprises from both industry and regional dimensions reveals a significant heterogeneity in the resilience distribution. Low-resilience enterprises are primarily concentrated in the secondary and tertiary industries, facing multiple pressures such as fluctuations in the global value chain, overcapacity, and lagging technological updates. Regionally, northeast China and some western provinces have long been in resilience-disadvantaged zones, primarily constrained by a single industrial structure, insufficient economic vitality, and relatively weak local governance capabilities. In contrast, the eastern and central regions have demonstrated greater resilience in the face of multiple shocks through industrial restructuring and improvements to their governance systems. These findings not only reveal the key constraints and pathways for enhancing resilience but also provide empirical evidence and theoretical references for promoting structural transformation and implementing differentiated support policies. This study has achieved breakthroughs in resilience measurement methods, offering a “Chinese solution” and global insights for constructing a resilience governance framework for enterprises in uncertain environments.
4.2. Recommendations
Based on the empirical findings regarding the dynamic evolution and structural distribution of corporate resilience in China, this paper proposes the following targeted policy recommendations:
First, enhance resilience through technological upgrading and supply chain diversification. The analysis shows that low-resilience enterprises are mainly concentrated in sectors with a high dependence on external markets and limited technological adaptability. To address this, policymakers should support independent R&D in core areas such as manufacturing, energy, and ICT. Establishing collaborative innovation platforms among firms, universities, and research institutes can accelerate the commercialization of technological achievements. Encouraging enterprises to build decentralized and backed-up supply networks will help reduce systemic risks stemming from regional or single-point failures, thereby strengthening the adaptive and redundancy capacity of the industrial system.
Second, promote differentiated regional strategies to rebalance resilience. Regional disparities in resilience are significant, with northeast and certain western provinces showing persistent vulnerabilities. Tailored interventions are needed: the northeast should focus on revitalizing legacy industrial bases by promoting functional and institutional restructuring; the western region should prioritize industrial coordination and the introduction of green, innovation-driven sectors. Through regional industrial synergy and differentiated policy support, the structural bottlenecks hindering resilience can be addressed, promoting more balanced and robust regional development.
Third, build corporate resilience monitoring and empowerment mechanisms. Construct a corporate resilience monitoring platform; integrate operation, energy consumption, import and export data; and form a dynamic scoring system combining indicator-driven model predictions, so as to realize the early identification of risks and quick responses. Rely on platform enterprises to promote the digital empowerment of small- and medium-sized enterprises, improve their resource deployment and information response capabilities, and support their access to key technology systems through financial incentives to enhance their stress-resistant capabilities and transformation resilience.
Fourth, improve the emergency buffer and rapid recovery mechanism for enterprises. Establish a risk reserve system and a portfolio of emergency support tools to provide corporate liquidity relief and recovery support in response to major crisis events. Improve the fiscal and financial linkage mechanism to ensure that support policies are fast-starting, implementable, and precise enough, so as to prevent micro-risks from being transmitted to the systemic level, thereby strengthening the emergency response capacity of enterprises through institutionalized arrangements and constructing the last line of resilience at the enterprise level.
4.3. Discussion and Limitations
This paper systematically describes the dynamic evolution and structural distribution characteristics of Chinese corporations’ resilience and proposes targeted policy recommendations. However, since the sample does not cover SMEs and international firms, this may limit the universality of the research conclusions to a certain extent. Overall, this study still has the following limitations, which need to be further expanded and deepened in subsequent studies. (1) This study focuses on Chinese enterprises and lacks an international comparative perspective. If the data are available, the index system and measurement methodology constructed in this paper can be expanded and applied at the international level, including developed countries and other emerging economies to carry out comparative resilience research, to test the differences in the resilience of enterprises and their causes under different institutional backgrounds, and to enhance the external validity of this study and the value of the policy references. (2) Though the dimensions of the enterprise resilience measurement are comprehensive, there is still some simplification. Although the comprehensive indicators constructed in this paper can better capture the core capacity of resilience, they are not able to pay attention to the behavioral heterogeneity of individual enterprises, and future research can introduce behavioral process variables, such as management practices, organizational restructuring, and the evolution of innovation capacity, so as to more accurately portray the resilience paths of different enterprises. (3) The coverage of the enterprise types is limited. The sample in this paper has not fully considered the resilience performance of unlisted enterprises, private SMEs, and core nodes of the regional industrial chain. Subsequent research can enhance the universality of the results by expanding data sources. At the same time, it can also be combined with the industrial chain perspective to build a multi-subject resilience network model to explore the resilience linkage and transmission mechanism among enterprises.
Author Contributions
Data curation, J.L.; formal analysis, J.L.; investigation, J.L.; methodology, J.L.; validation, J.L.; visualization, J.L.; writing—original draft, J.L.; writing—review and editing, J.L.; conceptualization, C.S.; funding acquisition, C.S.; project administration, C.S.; supervision, C.S. All authors have read and agreed to the published version of the manuscript.
Funding
This research was funded by the National Social Science Fund of China, grant number 24BGL205.
Data Availability Statement
The raw data and python code supporting the conclusions of this article will be made available by the authors on request.
Conflicts of Interest
The authors declare no conflicts of interest.
References
- Li, Z.P.; Peng, J.; Huang, X.F. Export Experience and Firms’ OFDI. Econ. Rev. 2024, 2, 90–105. [Google Scholar] [CrossRef]
- Sui, J.L.; Li, Y.X.; Liu, J.Q. The Spatiotemporal Convergence and Divergence, Heterogeneous Differentiation Characteristics of Economic Resilience in China: Identification Based on a Markov Switching Mixed-Frequency Dynamic Factor Model. J. Manag. World 2024, 40, 16–36. [Google Scholar] [CrossRef]
- Fahlenbrach, R.; Rageth, K.; Stulz, R.M. How Valuable Is Financial Flexibility When Revenue Stops? Evidence from the COVID-19 Crisis. Rev. Financ. Stud. 2021, 34, 5474–5521. [Google Scholar] [CrossRef]
- Feng, T.; Zhu, Z.Y. Exploratory Innovation and Firm Resilience—Evidence from NEEQ Listed Companies. J. Shanxi Univ. Financ. Econ. 2023, 45, 116–126. [Google Scholar] [CrossRef]
- Zhang, Q.; Deng, S.J. The Impact of Digital Transformation on Firm Resilience: Evidence From the COVID-19 Pandemic. Econ. Manag. 2023, 37, 38–48. [Google Scholar]
- Hu, D.M.; Zhao, L.; Chen, W.Z. A Study on the Mechanism and Effect of Heterogeneity Characteristics of Senior Management Teams in Listed Companies on Organisational Resilience. Soc. Sci. Res. 2021, 43, 73–83. [Google Scholar] [CrossRef]
- DesJardine, M.; Bansal, P.; Yang, Y. Bouncing Back: Building Resilience Through Social and Environmental Practices in the Context of the 2008 Global Financial Crisis. J. Manag. 2019, 45, 1434–1460. [Google Scholar] [CrossRef]
- Hu, H.F.; Song, X.X.; Dou, B. The Value of Digitalization in Times of Crisis: Evidence of Corporate Resilience. Financ. Trade Econ. 2022, 43, 134–148. [Google Scholar] [CrossRef]
- Lee, A.V.; Vargo, J.; Seville, E. Developing a Tool to Measure and Compare Organizations’ Resilience. Nat. Hazards Rev. 2013, 14, 29–41. [Google Scholar] [CrossRef]
- Jiang, L.; Ling, Y.P.; Zhang, J.C.; Lu, J.F. How Does Digital Transformation Affect Firm’s Resilience? An Ambidexterous Innovation View. J. Technol. Econ. 2022, 41, 1–11. [Google Scholar] [CrossRef]
- Zhang, X.E.; Teng, X.Y. The Connotation, Dimensions and Measurement of Organizational Resilience. Sci. Technol. Prog. Policy 2021, 38, 9–17. [Google Scholar] [CrossRef]
- Wang, N.N.; Cui, D.F. Evaluation Index System and Quantitative Analysis of Corporate resilience. J. Ind. Technol. Econ. 2023, 42, 86–95. [Google Scholar] [CrossRef]
- Liang, L.; Li, Y. The Double-Edged Sword Effect of Organizational Resilience on Product Cost Advantage of Manufacturing Enterprises. China Bus. Mark. 2024, 38, 115–127. [Google Scholar] [CrossRef]
- Gunderson, L.H. Ecological Resilience—In Theory and Application. Annu. Rev. Ecol. Syst. 2000, 31, 425–439. [Google Scholar] [CrossRef]
- Cumming, G.S.; Barnes, G.; Perz, S.; Schmink, M.; Sieving, K.E.; Southworth, J.; Binford, M.; Holt, R.D.; Stickler, C.; Van Holt, T. An Exploratory Framework for the Empirical Measurement of Resilience. Ecosystems 2005, 8, 975–987. [Google Scholar] [CrossRef]
- Zhang, J.C.; Long, J.; Ling, Y.P.; Jiang, L. Thriving Against the Odds: A Review and Outlook on Corporate Resilience Research. Manag. Mod. 2021, 41, 121–125. [Google Scholar] [CrossRef]
- Cui, L.H.; Liu, D.; Qu, H.S. Research on Factors of the Survival of Backdoor-listed Companies. J. Yanbian Univ. (Soc. Sci.) 2020, 53, 85–92+142. [Google Scholar] [CrossRef]
- Liu, B.; Tan, S.Q. The Impact of Corporate Social Responsibility on Organizational Resilience Innovation. Enterp. Econ. 2022, 41, 113–121. [Google Scholar] [CrossRef]
- Ding, W.; Levine, R.; Lin, C.; Xie, W. Corporate Immunity to the COVID-19 Pandemic. J. Financ. Econ. 2021, 141, 802–830. [Google Scholar] [CrossRef]
- Chen, H.; Guo, T.M.; Zhang, Y.; Guo, Q.Y. Research on the Impact of Internal Control on Organizational Resilience—Based on the Perspective of Corporation Lifecycle. Nankai Bus. Rev. 2024, 1–28. [Google Scholar]
- Liu, H.J.; Hu, H.G.; Zhang, S.S.; Sun, L. Supply Chain Digitalization and Firm Performance: Mechanism and Empirical Evidence. Bus. Manag. J. 2023, 45, 78–98. [Google Scholar] [CrossRef]
- Huangfu, Y.; Feng, T.; He, J.; Dong, Z. Research on the Relationship Between Structural Characteristics of Corporate Social Networks and Risk-Taking Levels: Evidence from China. Systems 2025, 13, 319. [Google Scholar] [CrossRef]
- Teece, D.J. Explicating Dynamic Capabilities: The Nature and Microfoundations of (Sustainable) Enterprise Performance. Strateg. Manag. J. 2007, 28, 1319–1350. [Google Scholar] [CrossRef]
- Yang, Y.; Luo, F. Unlocking Corporate Sustainability: The Transformative Role of Digital–Green Fusion in Driving Sustainable Development Performance. Systems 2025, 13, 13. [Google Scholar] [CrossRef]
- Chowdhury, S.; Rodriguez-Espindola, O.; Dey, P.; Budhwar, P. Blockchain Technology Adoption for Managing Risks in Operations and Supply Chain Management: Evidence from the UK. Ann. Oper. Res. 2023, 327, 539–574. [Google Scholar] [CrossRef]
- Lochan, S.A.; Rozanova, T.P.; Bezpalov, V.V.; Fedyunin, D.V. Supply Chain Management and Risk Management in an Environment of Stochastic Uncertainty (Retail). Risks 2021, 9, 197. [Google Scholar] [CrossRef]
- Awais, M.; Ali, A.; Khattak, M.S.; Arfeen, M.I.; Chaudhary, M.A.I.; Syed, A. Strategic Flexibility and Organizational Performance: Mediating Role of Innovation. SAGE Open 2023, 13, 21582440231181432. [Google Scholar] [CrossRef]
- Lin, J.; Zhong, J.Y. Effect of Corporate Governance on Digital Transformation. Enterp. Econ. 2023, 42, 60–68. [Google Scholar] [CrossRef]
- Luo, L.W.; Zhang, L.L.; Wang, C. Digital Transformation and Corporate Resilience: Empirical Evidence from Chinese A-Share Listed Corporations. Reform 2024, 5, 64–79. [Google Scholar]
- Cai, X.J.; Xia, Y.X.; Xue, L.D. Construction, Measurement and Testing of Corporate resilience Index: Based on Data from A-Share Listed Companies. Sci. Decis. Mak. 2024, 3, 57–74. [Google Scholar]
- Mgammal, M.; Al-Matari, E. Dataset of Companies’ Profitability, Government Debt, Financial Statements’ Key Indicators and Earnings in an Emerging Market: Developing a Panel and Time Series Database of Value-Added Tax Rate Increase Impacts. F1000Research 2023, 12, 405. [Google Scholar] [CrossRef] [PubMed]
- Liang, L.; Li, Y. The Double-edged Sword Effect of Organizational Resilience on ESG Performance. Corp. Soc. Responsib. Environ. Manag. 2023, 30, 2852–2872. [Google Scholar] [CrossRef]
- Xue, W.; Cai, C. Comprehensive Evaluation of High-Quality Development in China Based on Multi-Level Factor Analysis. Stat. Decis. 2022, 38, 22–25. [Google Scholar] [CrossRef]
- Federici, A.; Mazzitelli, A. Dynamic Factor Analysis with STATA. In Proceedings of the 2nd Italian Stata Users Group Meeting, Milano, Italy, 10 October 2005; pp. 10–11. [Google Scholar]
- Shi, F.; Hu, Y. Prediction on Chinese Business Climate Index and Entrepreneur Confidence Index. Stat. Decis. 2021, 37, 41–45. [Google Scholar] [CrossRef]
- Albuquerque, R.; Koskinen, Y.; Yang, S.; Zhang, C. Resiliency of Environmental and Social Stocks: An Analysis of the Exogenous COVID-19 Market Crash. Rev. Corp. Financ. Stud. 2020, 9, 593–621. [Google Scholar] [CrossRef] [PubMed]
- Liu, D.Y.; Xu, B.; Wang, Q.R. A Time-varying Estimation and Decomposition of the Long-term Trend on China‘s Economic Growth. J. Quant. Technol. Econ. 2022, 39, 26–46. [Google Scholar] [CrossRef]
- Su, J.H.; Zhang, Y.L.; Zhang, X.D. Corporate Governance and Stock Price Stability in the Market Crisis: Based on Empirical Evidence from the 2015Stock Market Crash. Macroeconomics 2021, 2, 108–124. [Google Scholar] [CrossRef]
- Zhang, P.; Thurasamy, R. Bridging Big Data Analytics Capability and Competitive Advantage in China’s Agribusiness: The Mediator of Absorptive Capacity. Systems 2025, 13, 3. [Google Scholar] [CrossRef]
- Guo, J.; Dong, H.; Farzaneh, H.; Geng, Y.; Reddington, C.L. Uncovering the Overcapacity Feature of China’s Industry and the Environmental & Health Co-Benefits from de-Capacity. J. Environ. Manag. 2022, 308, 114645. [Google Scholar] [CrossRef]
- Li, C.X.; Ran, L.J. Domestic Circulation and Industrial Chain Resilience. J. Beijing Technol. Bus. Univ. (Soc. Sci.) 2024, 39, 1–13. [Google Scholar]
- Zhao, X.; Wang, Y.; Li, Y.; Lin, S.-H.; Shi, H. Exploring the Spatial Agglomeration Characteristics and Determinants of Strategic Emerging Industries: Evidence from 12,979 Industrial Enterprises in China. Systems 2025, 13, 27. [Google Scholar] [CrossRef]
- Li, C.M. Inter-regional Industrial Transfer and Regional Economic Gap. Econ. Surv. 2021, 38, 13–22. [Google Scholar] [CrossRef]
- Liu, Y.; Duan, D.; Feng, Z. The Impact of New Quality Productive Forces on the High-Quality Development of China’s Foreign Trade. Systems 2025, 13, 367. [Google Scholar] [CrossRef]

Disclaimer/Publisher’s Note: The statements, opinions and data contained in all publications are solely those of the individual author(s) and contributor(s) and not of MDPI and/or the editor(s). MDPI and/or the editor(s) disclaim responsibility for any injury to people or property resulting from any ideas, methods, instructions or products referred to in the content. |
© 2025 by the authors. Licensee MDPI, Basel, Switzerland. This article is an open access article distributed under the terms and conditions of the Creative Commons Attribution (CC BY) license (https://creativecommons.org/licenses/by/4.0/).