Abstract
As China’s economy grows and travel demand increases, its aviation market has evolved to become the second-largest in the world. This study presents a pioneering analysis of China’s aviation network evolution (1990–2024) by integrating temporal dynamics into a network density matrix theory, addressing critical gaps in prior static network analyses. Unlike conventional studies focusing on isolated topological metrics, we introduce a triangulated methodology: ① a network sequence analysis capturing structural shifts in degree distribution, clustering coefficient, and path length; ② novel redundancy–entropy coupling quantifying complexity evolution beyond traditional efficiency metrics; and ③ economic-network coordination modeling with spatial autocorrelation validation. Key innovations reveal previously unrecognized dynamics: ① Time-embedded density matrices () demonstrate how sparsity balances information propagation efficiency () and response diversity, resolving the paradox of functional yet sparse connectivity. ② Redundancy–entropy synergy exposes adaptive trade-offs. Entropy () rises 18% (2000–2024), while redundancy () rebounds post-2010 (0.25→0.33), reflecting the strategic resilience enhancement after early efficiency-focused phases. ③ Economic-network coupling exhibits strong spatial autocorrelation (, ), with eastern China achieving “primary coordination”, while western regions lag due to geographical constraints. The empirical results confirm structural self-organization. Power-law strengthening, route growth exponentially outpacing cities, and clustering () rising 16% as the path length () increases, validating the hierarchical hub formation. These findings establish aviation networks as dynamically optimized systems where economic policies and topological laws interactively drive evolution, offering a paradigm shift from descriptive to predictive network management.
1. Introduction
According to data released by the Civil Aviation Administration of China, as of early 2024, China has over 250 airports and more than 5000 flight routes, making it the world’s second-largest aviation market. With rapid economic development and increasing travel demand, aviation networks have evolved from traditional local transportation modes to national and dense network systems [1]. During this process, the complexity of aviation networks has continuously increased, with the evolution of network structures and node connection patterns exhibiting strong dynamic and nonlinear characteristics, urgently requiring systematic theoretical analysis and practical guidance [2]. The stability, resilience, and optimal design of aviation networks directly impact the national and regional transportation efficiency, economic development, and public welfare [3]. Aviation networks face a fundamental paradox: why does sparse connectivity persist despite dense node distribution? This contradicts traditional cost-driven explanations (Li & Dawood [4]). Therefore, in-depth research on the evolutionary characteristics of aviation networks can provide theoretical support for network management and planning.
Existing studies on aviation networks exhibit several notable limitations. Firstly, they suffer from static bias, as structural metrics typically fail to account for temporal evolution, leading to incomplete representations of the dynamic nature of these networks (Freeman [5], Barrat [6]). Secondly, many studies oversimplify the mechanisms by attributing network sparsity to a singular set of factors, thereby neglecting the multifactorial nature of sparsity in aviation networks (Leng [7], Sun [8]). Lastly, there is a significant methodological gap due to the absence of comprehensive multidimensional complexity metrics. This absence impedes a deeper understanding of the intricate processes governing network behavior (Bilotkach, 2019 [9]). As a result, the majority of current research on aviation networks tends to focus narrowly on static structural analyses or the optimization of dynamic evolution models, overlooking a more systematic exploration of the complexity evolution process. This gap is especially evident in the lack of in-depth studies on the dynamic relationship between network redundancy and information entropy, which are essential factors influencing the network’s adaptability and efficiency over time.
This study integrates a network sequence analysis with a density matrix theory to provide a comprehensive framework for capturing the dynamic behavior of aviation networks. Specifically, the analysis focuses on three key dimensions:
(1) Structural evolution, assessed through temporal variations in degree distribution and clustering coefficients (Equations (1)–(4));
(2) Complexity dynamics, evaluated via the coupling relationship between network redundancy and information entropy (Equations (5)–(7));
(3) Economic-network coordination, modeled through the integration of macroeconomic factors with network performance indicators (Equations (13)–(17)).
By incorporating the temporal dimension into the density matrix framework, this approach enables a systematic investigation of how aviation network structures and complexities evolve over time. The overarching objective is to identify an optimal trade-off between transportation efficiency and response diversity, thereby enhancing the adaptability and robustness of aviation networks under dynamic operational conditions.
The key findings of this study include the following: ① The scale-free topology of the network intensifies over time. ② The sparsity–efficiency trade-off follows phase transition rules. ③ Eastern China leads in coupling coordination. The theoretical and practical contributions are threefold: firstly, the development of a time-embedded density matrix theory that explains sparse connectivity as an equilibrium between efficiency and diversity (Equations (9)–(11)), addressing the theoretical gap identified by Ghavasieh [10]; secondly, the introduction of a redundancy–entropy coupled metric to quantify complexity evolution (Equation (7)), advancing beyond Barrat’s [6] single-efficiency indicator; and lastly, the identification of regional disparities in economic-network coordination, providing valuable insights for the development of PPP models for airports in western China.
2. Literature Review
2.1. Previous Studies on Aviation Networks
Initial studies in the field of aviation network research primarily focused on static structural analyses using graph theory to explore the relationships between airports and routes and analyze the impact of network topological features and node centrality on network connectivity. For example, Freeman [5] proposed centrality indices, providing theoretical support for measuring the importance of each node in aviation networks. Li & Dawood [4] studied the topological structure of air transportation networks and found that network compactness and node connectivity significantly influence the aviation network stability. In recent years, with the deepening of aviation network research, scholars have gradually shifted to dynamic evolution studies, focusing on changes in aviation networks over time. For instance, Wang [11] analyzed data from China’s aviation network and proposed a model for airspace sector resilience and recoverability, discovering that the recovery speed and resilience of aviation networks are closely related to betweenness centrality. Kölker et al. [12] investigated the internal connectivity and temporal variations of the dynamic network of European air transport, analyzing from four dimensions: accessibility, connectivity, competition, and robustness. It conducted comparisons between networks and airports by leveraging identified trends and other means, and further proposed a framework integrating classified metrics for network analyses. Chen et al., 2023 [13,14] investigated the lane-changing behavior in complex highway scenarios and proposed a framework for accurate ship detection in adverse weather, demonstrating significant advancements in their respective fields. Additionally, Li et al. [15] analyzed the evolution of China’s civil aviation cargo network from 2015 to 2019 from a spatial correlation perspective using complex network theory, emphasizing the dynamic interaction between cities in air connectivity and the changing roles of different regions in the network. Guimera et al. [16] recognized the “hub-and-spoke” evolution pattern in global aviation networks, though they did not account for the influence of policy interventions. Lordan et al. [17] examined how airline alliances reshape transcontinental network structures. These studies indicate that aviation network evolution is not only a static structural process but also a dynamically changing complex system influenced by multiple factors. Research directions have gradually shifted toward network resilience, recoverability, and policy impacts. However, these studies mainly focus on static and partial dynamic evolutionary structural analyses of aviation networks, lacking a comprehensive analysis of the complexity influencing network evolution.
With the rapid development of the aviation industry, China’s aviation network has shown a clear trend toward densification. However, its connectivity remains sparse, meaning that the actual number of flight routes is far lower than the theoretically maximum possible number. This widespread sparsity raises fundamental questions: Why do aviation networks adopt such seemingly “inadequate” connection patterns? And how do aviation networks maintain functionality while achieving such sparse structures? Traditional theories suggest that sparsity may be caused by connection cost limitations or specific network growth mechanisms [4]. However, these theories cannot fully explain why nearly all complex networks—such as social networks, transportation networks, and biological networks—exhibit similar sparse structures. Research on the sparsity of complex networks has gradually shifted toward common features across multiple domains and emerging explanatory frameworks. For example, Leng et al., 2011 [7] pointed out in their research that the sparsity of complex networks is related to urban economic development. For aviation networks, although numerous potential route connections theoretically exist, the actual number of connections is influenced by multiple factors, including route demand, operational costs, technical limitations, and policies [18]. This view is also supported by recent studies, such as a study by Sun et al., 2024 [8], which, through analyzing airline competitiveness using aviation networks, argued that airlines must consider market competitiveness and resource allocation when designing routes, leading to aviation networks functionally maintaining sufficient connectivity while remaining sparse in connections. These studies indicate that the sparsity of aviation networks is not accidental but rather the result of multiple factors. Especially with network scale expansion and changing aviation demands, sparse structures may become an adaptive optimization strategy that ensures network functionality while reducing operational costs and enhancing stability. Ghavasieh [10] proposed a theoretical framework based on network density matrices, which analogizes network formation to phase transitions in physical systems and reveals that sparse network structures are an inevitable result of the system seeking an optimal balance between information transmission efficiency and response diversity. Barrat et al. [6] demonstrated that network sparsity is essential for maximizing information transmission efficiency. However, this research primarily focuses on static network structural features, failing to incorporate the temporal dimension into the theoretical framework. Additionally, the theory assumes that the system can achieve optimal efficiency, while real-world systems may be limited by local optima or evolutionary dynamics.
A network sequence analysis, a relatively new research method, has been widely applied in aviation network research in recent years [19]. By treating aviation networks as dynamically evolving processes and utilizing time-series analysis methods, this approach can uncover structural changes at different time points and the temporal relationships of influencing factors [20]. This method provides detailed insights into the evolutionary patterns of aviation networks, particularly in identifying key events and timings that impact network evolution. Multiple studies have employed network sequence analyses to quantitatively analyze the evolution of China’s aviation network [21,22,23,24], highlighting its transition from low to high connectivity and underscoring the significant effects of policy reforms and market demand changes on network evolution. Bilotkach et al., 2019 [9] were the first to apply sequence analysis to studies of European route competition. However, due to the complexity of the aviation network evolution, it is challenging to capture the network’s multidimensional features using single or traditional network metrics. Moreover, systematic theoretical analyses and empirical research on the relationship between aviation network redundancy and information entropy—especially their dynamic characteristics during network evolution—remain insufficient.
2.2. Enlightenment and Research Innovation
Despite these advancements, there is a gap in the comprehensive integration of dynamic efficiency and diversity, as well as the incorporation of both structural and economic factors in a network analysis. Our study aims to address these gaps by introducing a theoretical framework that captures the dynamic equilibrium between efficiency and diversity, alongside multidimensional complexity metrics that integrate both structural and economic dimensions. Furthermore, there is a need for policy-actionable regional coordination strategies that consider local economic and network characteristics. By advancing these innovations, our research seeks to offer a more holistic and actionable understanding of aviation network dynamics, providing valuable tools for both theoretical exploration and practical policy formulation.
3. Data Sources and Aviation Network Reconstruction
This study investigates the structural evolution characteristics of China’s aviation network from 1990 to 2024 using a 27-year period of data as the research object. The research data are sourced from the Official Aviation Guide (OAG) [25] and Civil Aviation Administration of China (CAAC) [26] from a statistical perspective. The data at the beginning of each year serve as the basis for the annual aviation network data.
Graph theory is an effective tool for analyzing the evolution of aviation networks. In aviation network analyses, cities with airports are considered nodes, while flight paths are considered edges. This study constructs aviation networks for various years, denoted as GT, based on data collected on Chinese cities with air service and airline flight routes. is a set , consisting of the number of cities with airports () and the number of flight routes between cities (), representing the aviation network, where T denotes the year. As T varies, generates a series of aviation networks over different years. Data for cities with multiple airports are combined; for example, Shanghai Pudong Airport and Shanghai Hongqiao Airport are combined to form “Shanghai”. Due to data collection constraints, Hong Kong, Macau, Taiwan, and other locations are not included in the analysis.
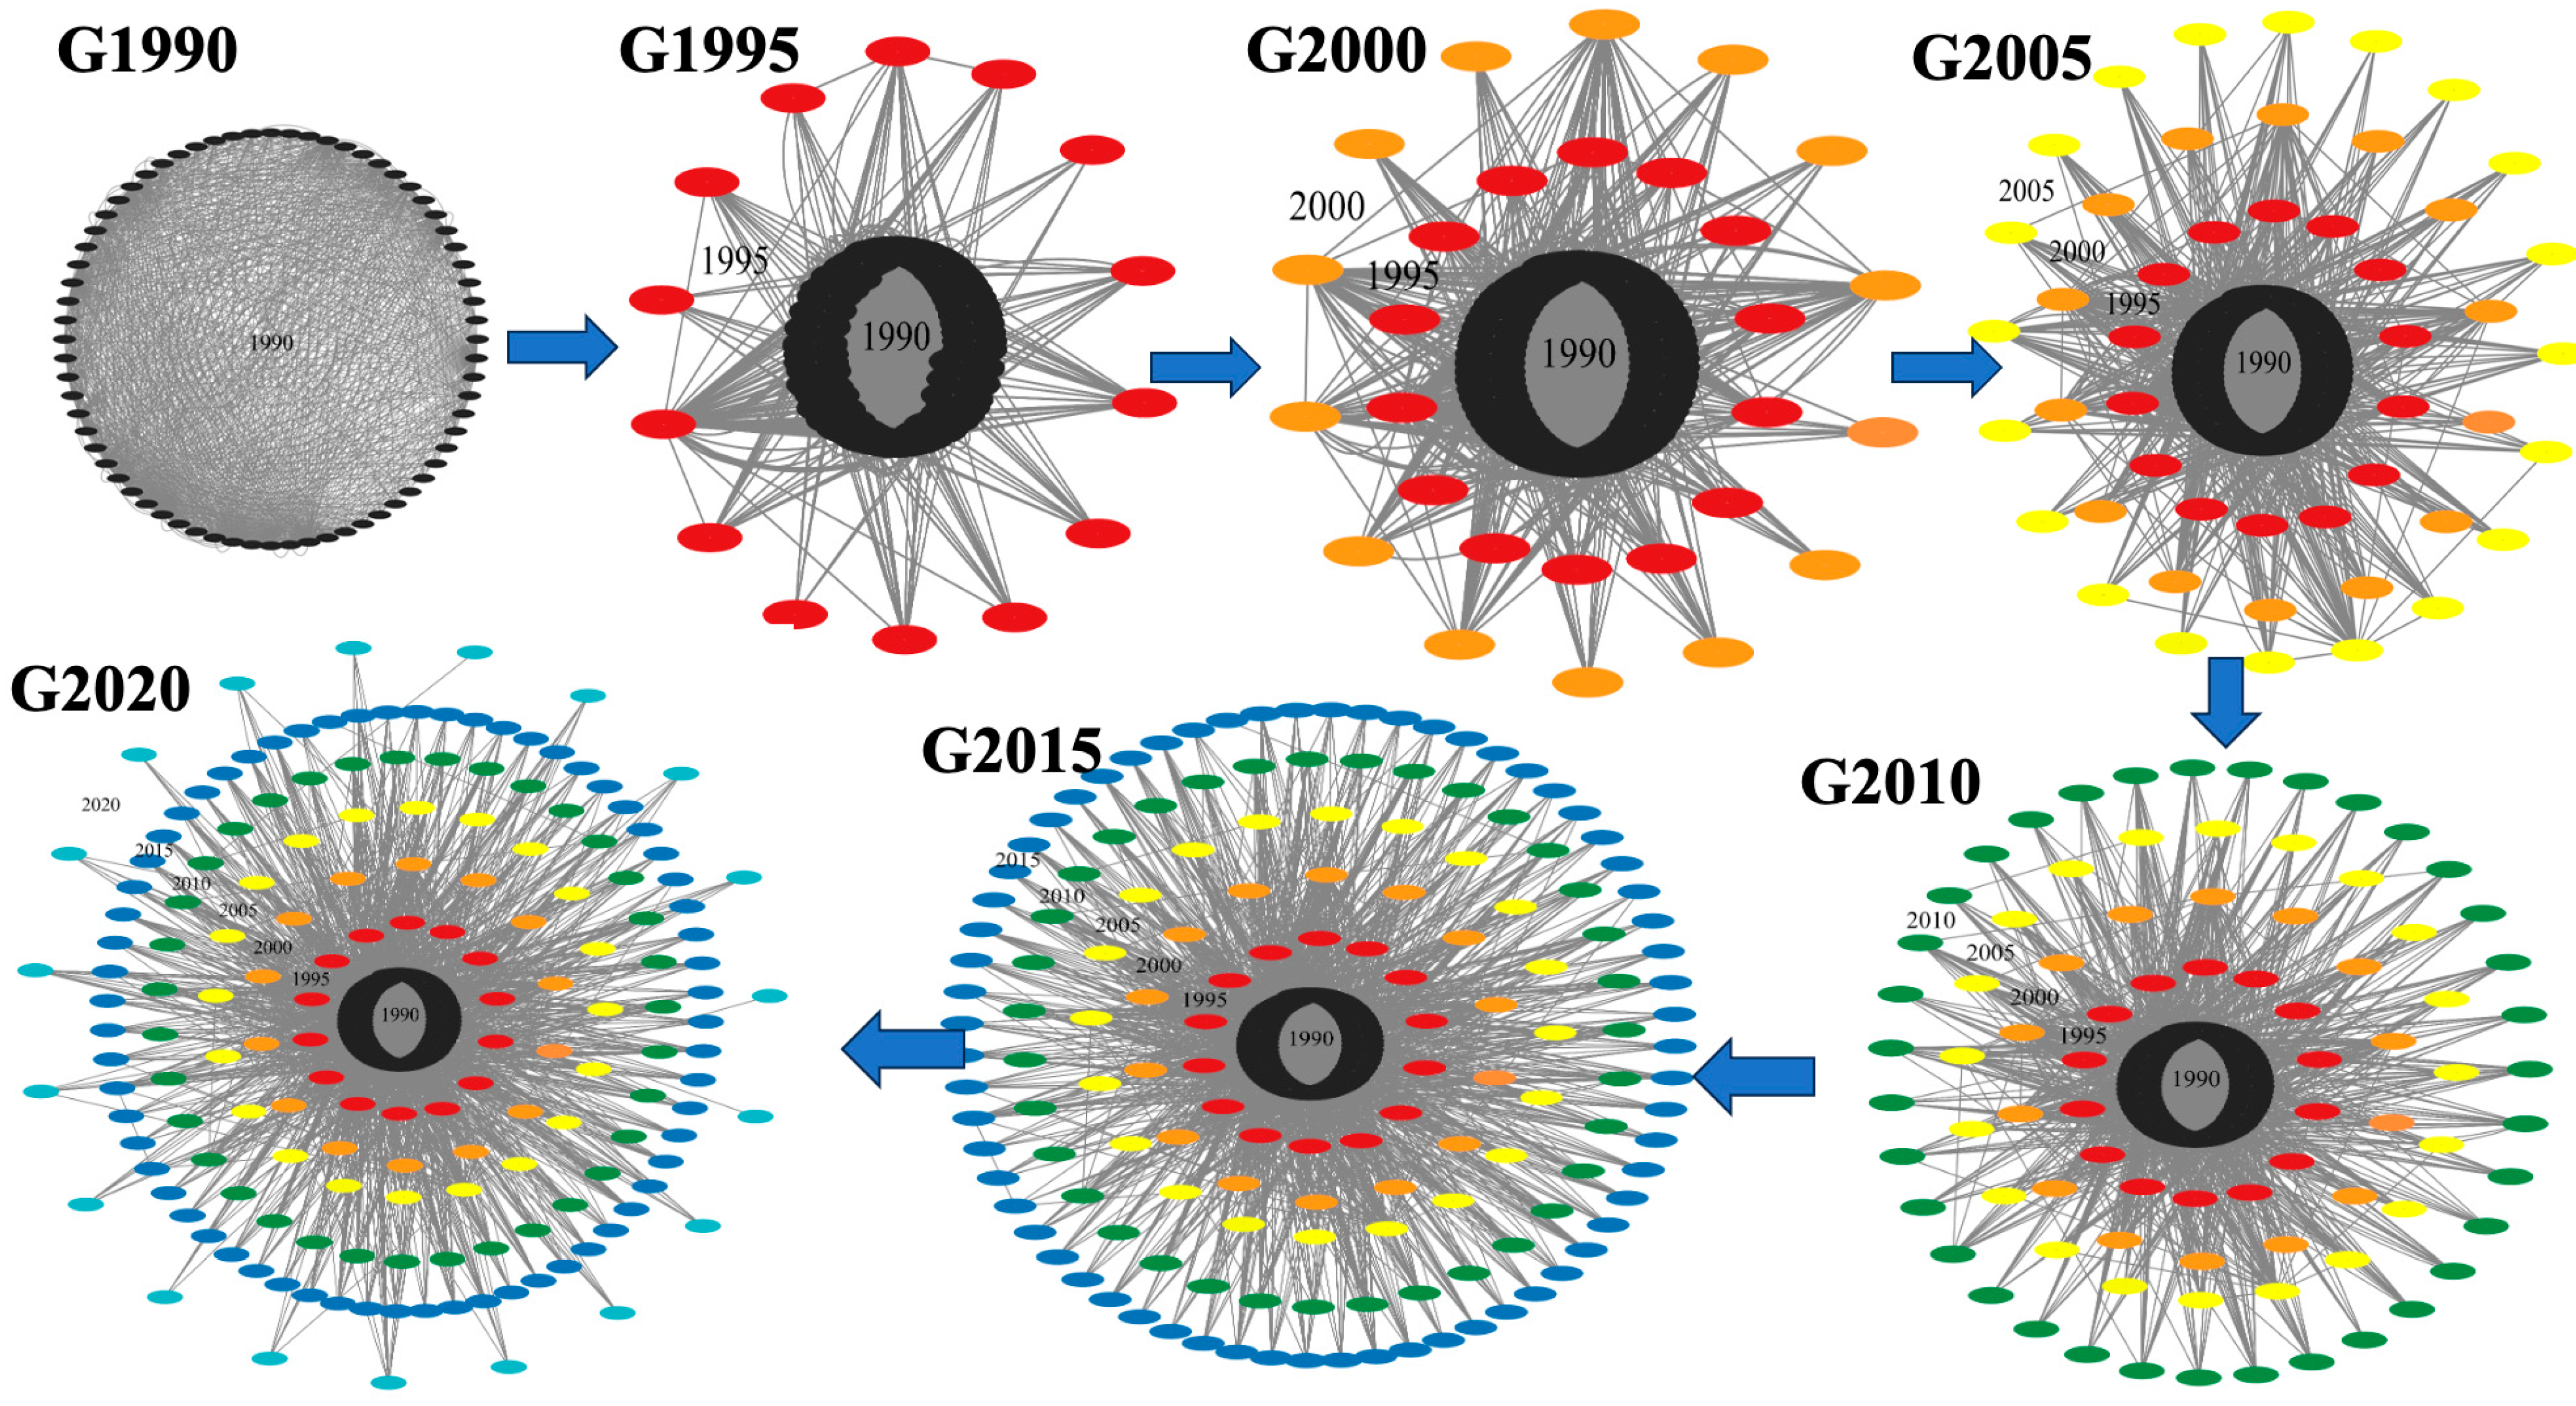
Network sequence diagrams were created every five years from 1990 to 2024, as shown in Figure 1. The black nodes in the figure represent major Chinese cities with air service as of 1990. Newly added cities with air service between 1990 and 1995 are indicated by red nodes; cities added between 1995 and 2000, 2000 and 2005, 2010 and 2015, and 2015 and 2020 are represented by orange, yellow, green, cyan, blue, and purple nodes, respectively. The figure reveals the following two distinct features:
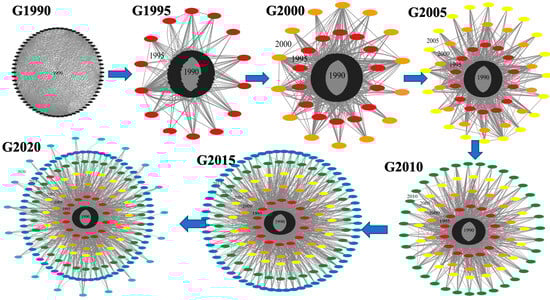
Figure 1.
Aviation network sequence construction diagram.
- (1)
- Larger cities, with more flight routes, attract newly added cities to initiate air service. In other words, the edges of new nodes tend to connect with high-degree core nodes. This characteristic indicates some scale-free properties within the aviation network.
- (2)
- Over time, new routes connecting existing cities also emerge, alongside new routes introduced by recently added cities. Consequently, the network structure becomes increasingly complex.
4. Methodology
This research examines the temporal evolution of the aviation network structure. Utilizing network sequence analysis techniques, it systematically reveals the intricate characteristics and relationships exhibited by aircraft networks over time. Firstly, the study employs the node degree distribution, average path length, and network clustering coefficient of the aviation network sequence to explore the dynamic evolution of the network structure. Secondly, it analyzes dynamic changes in network complexity through redundancy, network efficiency, and network information entropy of the network sequence. Thirdly, to investigate the balance between aircraft network efficiency and associated diversity, the time dimension is incorporated into the theory of network density matrices. Finally, the coordinated and paired relationship between economic development and aviation networks is examined.
4.1. Analysis of the Structural Evolution of Aviation Networks
The selected metrics address two core characteristics of aviation networks: ① Scale-free property verification. Degree distribution is essential because >85% of transportation networks exhibit power-law patterns [27], and our observation of Beijing-centric growth requires quantifying hub dominance. ② Hierarchical connectivity dynamics [28]. The average path length measures the global efficiency of passenger flow, while the clustering coefficient captures the regional cluster formation. Therefore, we calculate the degree distribution, average path length, and clustering coefficient of China’s aviation network, respectively.
The number of aircraft routes in a city, denoted by , represents the node degree of the aviation network. The degree distribution of the route network is represented by , which is the probability distribution of the node degrees of all cities [29]. This indicates the importance of each city within the overall network. The following is the calculation formula:
In Equation (1), indicates the number of nodes with degree k, and N indicates the total number of nodes in the network. When the condition is satisfied, and a logarithmic transformation is applied to both and , resulting in a linear correlation, it indicates that the aviation network follows a power-law distribution [30].
The average length of the shortest paths between every pair of nodes in the aircraft network is referred to as the average path length, denoted as L [31,32]. It measures the overall connectedness and efficiency of the aviation network. The calculation formula is as follows:
In Equation (2), represents the shortest path length between nodes i and j, while L denotes the average path length. The local clustering coefficient of the network, denoted by , is defined as the ratio of the actual number of edges connected to node i to the number of possible edges between the neighbors of node i [33]. The formula for this calculation is as follows:
In Equation (3), denotes the number of actual edges between the neighbors of node i. The local clustering coefficient in aviation networks can be employed to determine whether a specific airport (node) has a high degree of connectivity with its neighboring airports. The average value of the local clustering coefficients across the network is represented by the global clustering coefficient, or C, calculated using the following formula:
A higher clustering coefficient typically indicates the presence of numerous local groups or highly connected airports within specific regions.
4.2. Analysis of the Complexity Evolution of Aviation Networks
Here, we choose network redundancy and information entropy as the methods to solve the core paradox. This choice is both necessary and insightful, as it can comprehensively address two fundamental challenges in the network theory:
① Why do sparse connections persist despite dense node distribution (Figure 1): Sparse connections in a network, despite a high density of nodes, suggest an optimization process that balances cost and efficiency. Network redundancy, quantified by Equation (5), helps explain how networks maintain robustness and fault tolerance without the need for excessive connections. By introducing redundancy, the network ensures that alternative paths exist in the case of a failure while still minimizing the number of direct connections. This ensures that the network remains resilient without incurring high costs, such as increased wiring or connectivity in dense node regions [31].
② How networks balance functionality and cost:
Information entropy, as represented in Equation (7), is a measure of uncertainty and distribution of resources across a network. This metric allows for the assessment of how efficiently the network is utilizing its resources (such as bandwidth or connections) while maintaining optimal functionality. A network that efficiently balances functionality with minimal redundancy, or vice versa, can be better optimized both in terms of performance and cost. Information entropy enables the network design to dynamically adjust the distribution of connections based on the level of necessary functionality, ensuring minimal cost while maintaining overall network resilience [34].
The concept of network redundancy refers to the availability of alternative routes within a network, which ensures that connectivity is maintained even if a node or edge fails. Our previous research has proposed a method to quantify the network redundancy from a comprehensive perspective [32].The specific procedure is as follows: (1) Firstly, construct an adjacency matrix A by mapping the aviation network. (2) Next, calculate the covariance and eigenvalues of the adjacency matrix, rank the eigenvalues by magnitude, and determine the proportion of variance explained by each eigenvalue. (3) Finally, as shown in Figure 2, plot the percentage curve on a Cartesian coordinate system, where the redundancy is represented by the shaded area. The calculation procedure is detailed below:
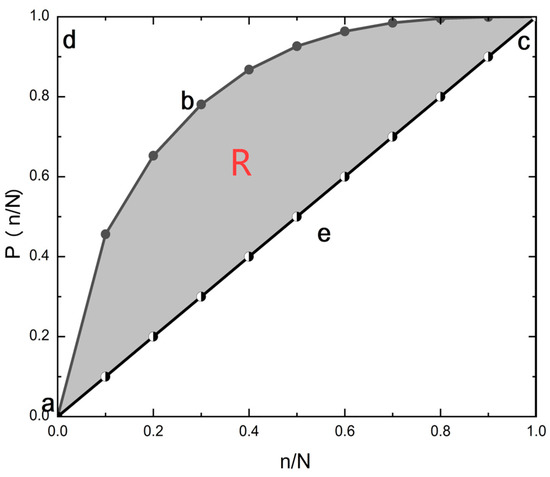
Figure 2.
Schematic diagram of the sequence redundancy calculation method for aviation. a represents the origin, b represents the curve, c represents the intersection point of the curve and the line y = x, and d represents (0.1).
The covariance between nodes i and j in the network is denoted by . Next, determine the eigenvalues of the covariance matrix and their corresponding eigenvectors. Then, sort the eigenvalues by magnitude.
Lastly, calculate each node’s cumulative contribution rate. Plot a curve with as the abscissa and λ as the cumulative percentage of the first n eigenvalues on the ordinate. The redundancy R in Figure 2 is represented by the area of the shaded region; the larger the value of R, the greater the redundancy.
The complexity of the aircraft network, or the unpredictability of the information source, is quantified by the network’s information entropy, denoted as H(k). The network information entropy is calculated using the likelihood of degree distribution [18]. The formula for information entropy is as follows:
Higher information entropy indicates a more complex aviation network with additional unknown factors influencing the network. According to the information entropy formula, an aircraft network with higher entropy has a more intricate structure and more unpredictable elements.
By adopting these two methods, network redundancy and information entropy, the approach offers a comprehensive framework to resolve the paradox of sparse connections in dense networks and the trade-off between cost and functionality. The combination of these methods provides insights into the structural design of resilient, efficient, and cost-effective networks, making them indispensable tools for understanding complex network behaviors.
4.3. Study on Sparsity and Efficiency in Aviation Network Evolution
A theoretical framework based on the network density matrix is presented here [35]. Using this approach, we compare phase transitions in physical systems to the formation process of aviation networks. Specifically, employing basic diffusion dynamics, we first elucidate how information spreads in aviation networks, where “information” encompasses elements such as passenger demand and emergency signals. Information (or disruptions) within the network propagates from one node to its neighboring nodes, akin to physical systems. The Laplacian matrix L can characterize the phase transition process of information diffusion paths, which can be interpreted as the increase or reduction in edges:
- If there is air service between cities i and j, then ; otherwise, . Here, A represents the adjacency matrix.
- M is a diagonal matrix, where for and for . This matrix considers each node’s degree of connectivity and the connections between the nodes.
The statistical propagation factor, , is then determined using the following formula:
where represents the propagation scale, a very small value implies that information primarily propagates between nearby nodes, whereas a large value indicates long-range propagation. The network density matrix is defined as follows:
The network development process can be understood as a phase transition from disorder to order. In this context, the information flow gain (W), which is analogous to “work” in physical systems, signifies the network’s information transmission capability gained through link establishment. This is one of the two key physical quantities in this process:
The incremental information flow of the network, from a state of zero edges to various time points, is represented by . Analogous to “heat” in physical systems, the response diversity loss (Q) indicates the loss of free response modes as the system forms connections.
denotes the amount of response diversity loss in the network from an initial state of zero edges to various time points. The efficiency indicates how well the network maintains response diversity as it acquires the ability to transmit information.
Here, we measure the network sparsity (V) by the ratio of the total number of edges to the maximum possible number of edges.
where E represents the actual edge count of the network. A network is considered sparser if V is smaller and denser if V is larger. We investigate the relationship between sparsity and the network’s propagation effectiveness at different levels of sparsity.
4.4. Study on the Coupling Coordination Degree Between Aviation Network Evolution and Economic Development
We examine the potential impact of economic factors on the evolution of aviation networks [36,37]. Firstly, we develop an indicator system for aviation networks and comprehensive evaluation indicators for urban economic capabilities, as depicted in Table 1, to construct the dataset.

Table 1.
Coupling indicator system and weights for China’s aviation network and urban economic development.
Specifically, Dataset Y consists of the evaluation indicators for urban economic development, while Dataset X represents the indicator system for aviation networks.
Subsequently, the data were processed using Min−Max normalization. The formula for Min−Max normalization is as follows:
Here, represents the minimum value of the indicator, and represents the maximum value of the indicator. This method scales all indicators to the range of [0, 1], eliminating the impact of dimensional differences and ensuring comparability across the variables.
Next, the coupling degree was calculated using the formula:
where C denotes the coupling degree.
The comprehensive evaluation index T was then computed to measure the overall development level of the coupled systems, defined as follows:
and are the importance weights of the two systems. In this study, the two systems are considered equally important, so .
The coupling coordination degree model further evaluates the balance between system development levels. A common formulation is the following:
Next, we employ spatial autocorrelation techniques to determine the spatial distribution pattern of data values and assess whether these values are influenced by geographic environmental factors. Subsequently, spatial autocorrelation analysis is applied within the coupling coordination model. Specifically, Moran’s I is used to identify the spatial distribution pattern of the values and detect whether there are clustering, dispersion, or random distribution patterns. Moran’s I is particularly valuable for quantifying the global spatial autocorrelation pattern in the aviation-economy coupling coordination system, aligning precisely with the core objective of this study: to verify whether regions with high or low coordination exhibit significant clustering trends, rather than modeling causal mechanisms or local spillover effects. The formula is as follows:
In this formula, Z denotes the standardized variable vector, W is the spatial weight matrix constructed from the association intensity between locations, and tr represents the trace of the weight matrix. The result of is in the range of [−1, 1]. A value of indicates positive spatial autocorrelation, meaning that high-value nodes in space tend to be adjacent to other high-value nodes, while low-value nodes tend to be adjacent to other low-value nodes. A value of signifies negative spatial autocorrelation, where high-value and low-value nodes are alternately connected. When , the spatial distribution is random with no significant pattern. In the analysis using Moran’s I, both the P-value and Z-statistic are comprehensively considered. If , the null hypothesis is rejected, indicating significant spatial autocorrelation. Moreover, a larger absolute value of the Z-statistic implies stronger spatial autocorrelation.
5. Analysis of China’s Aviation Network
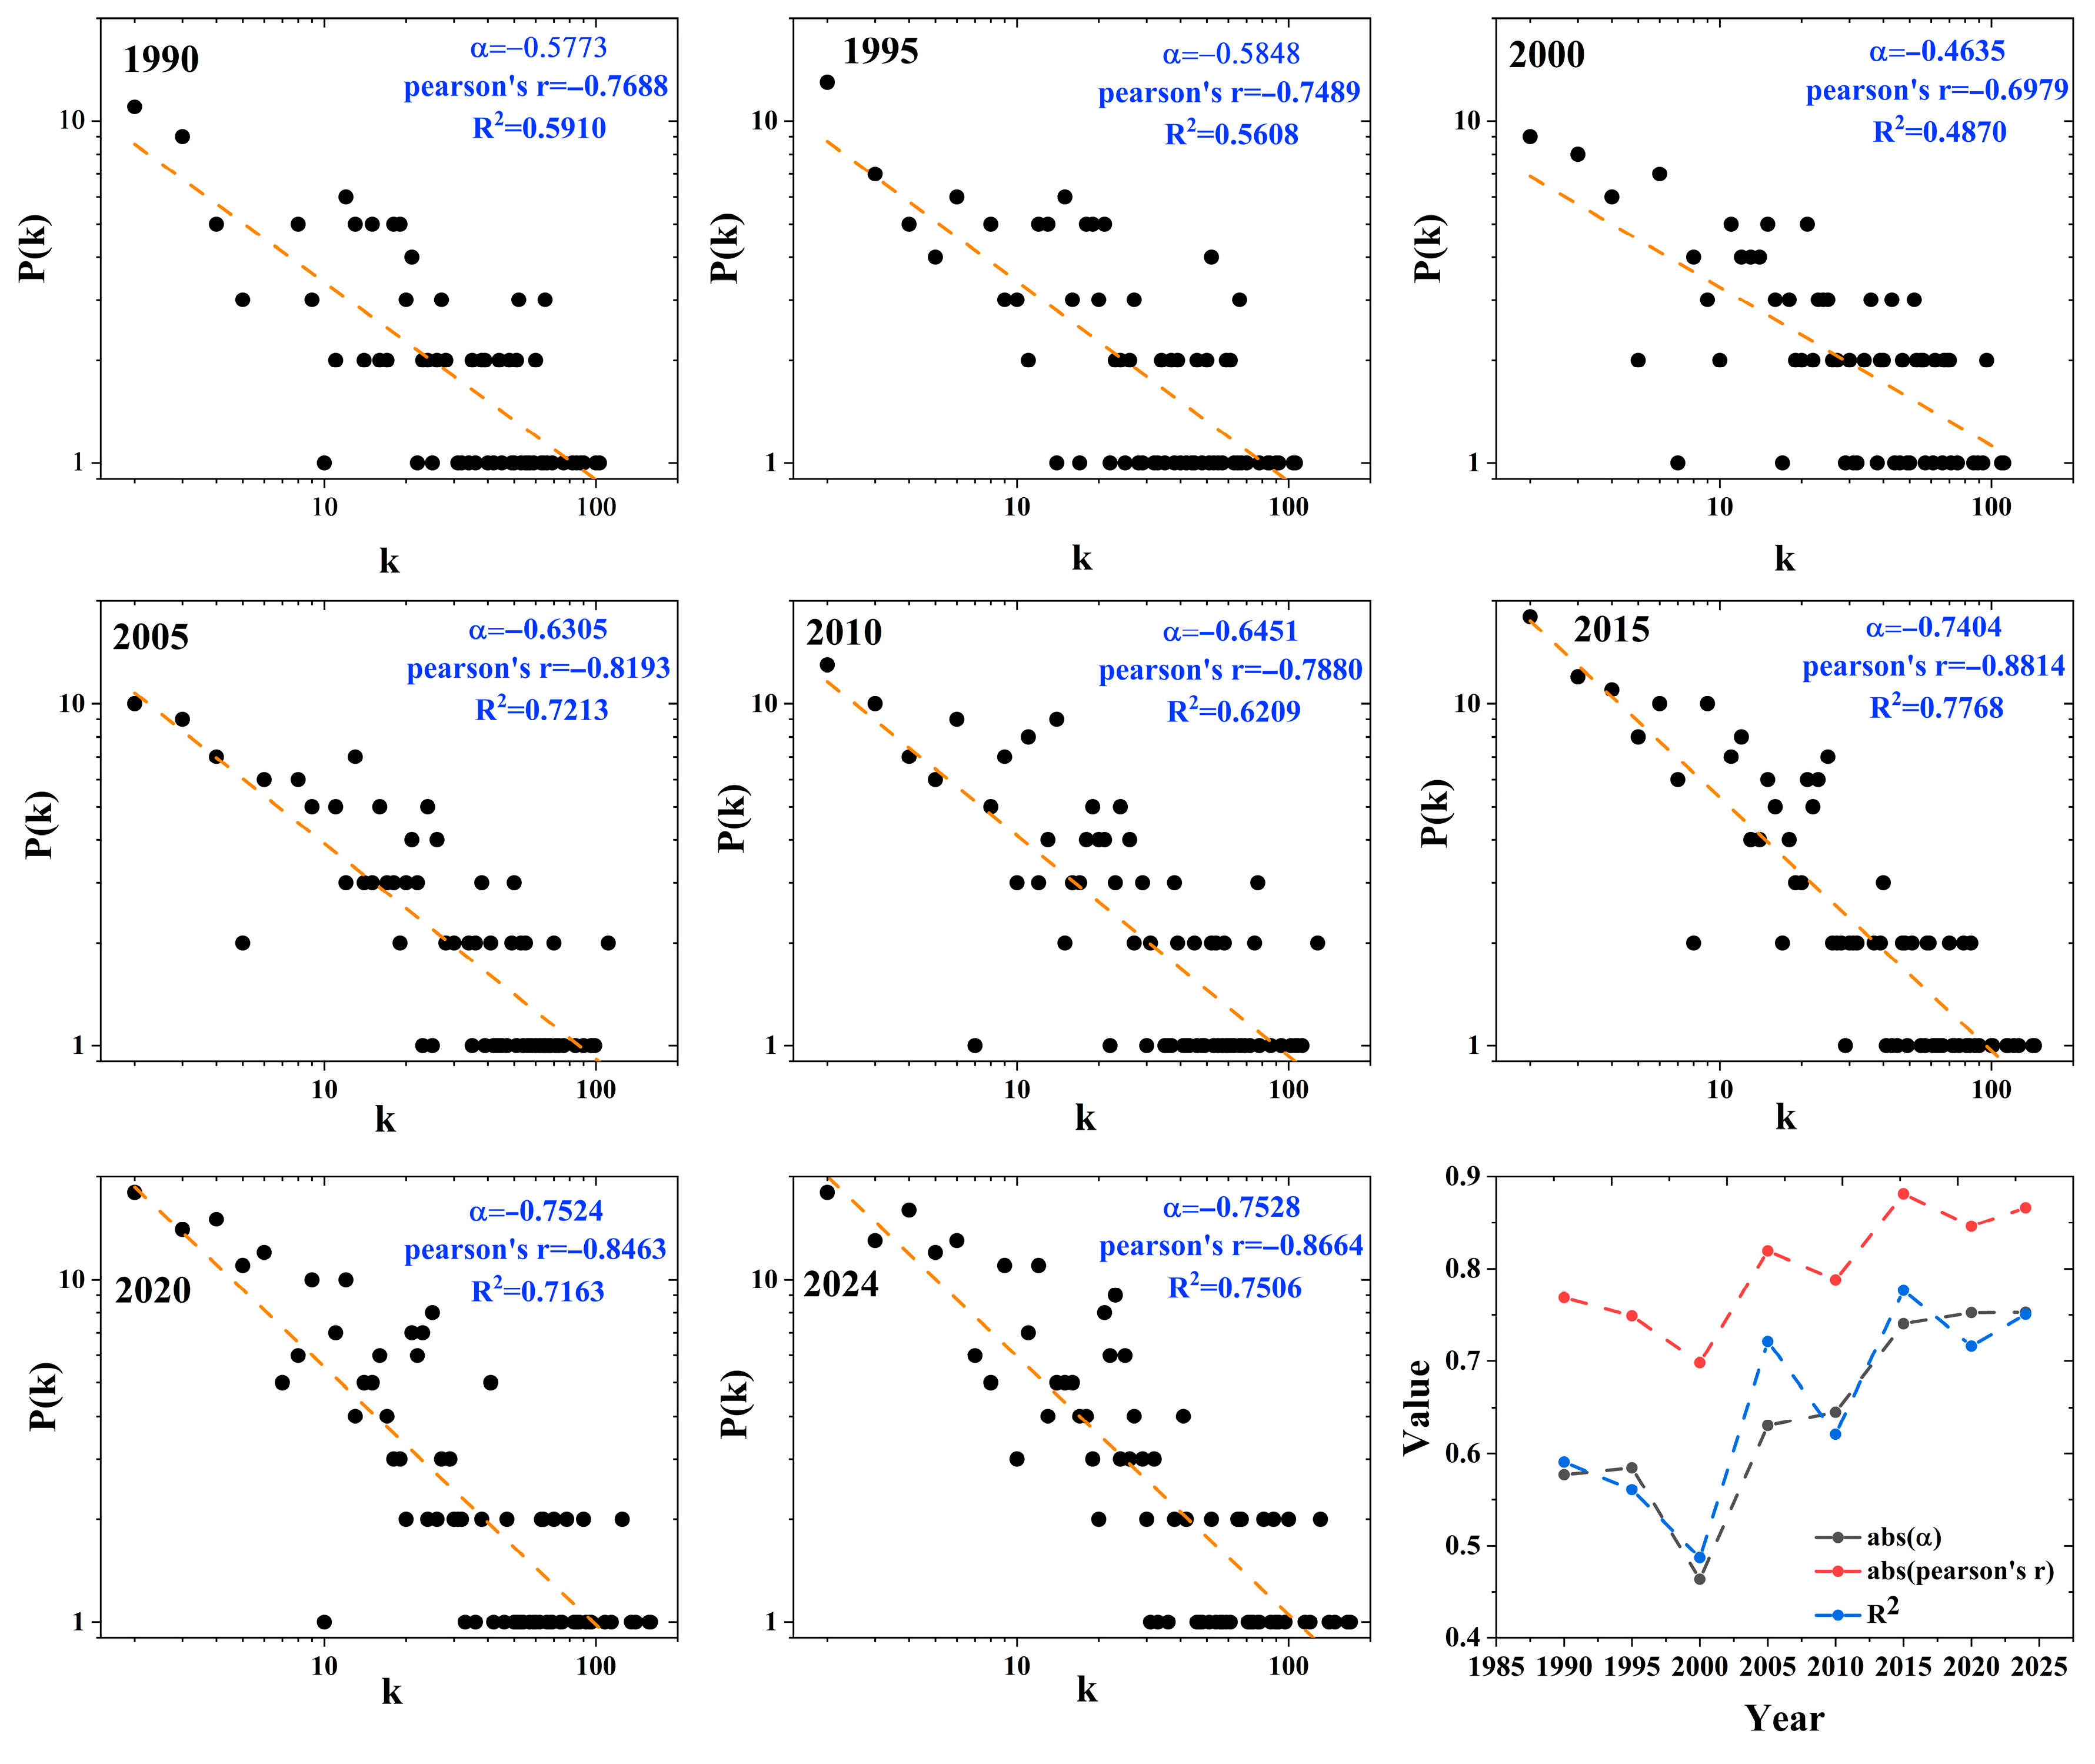
The degree distribution of the aviation network at various time periods is illustrated in Figure 3. This series of log–log scatter plots systematically demonstrates a statistically grounded transition toward scale-free topology. Each annual distribution depicts degree against probability , where the empirical data (black dots) increasingly align with fitted power-law models (orange dashed line) across decades. Crucially, three quantitative metrics validate the progressive convergence to power-law distribution: the absolute value of the scaling exponent exhibits a marked rise from 0.5773 (1990) to 0.7524 (2024), quantitatively confirming the steepening skewness toward hub dominance. Simultaneously, Pearson’s correlation coefficient strengthens from −0.7688 to −0.8463, indicating tighter linear alignment in the log–log space, a diagnostic requirement for robust power-law behavior. Complementary goodness-of-fit is evidenced by a coefficient of determination () improvement from 0.5910 to 0.7506, decisively rejecting visual subjectivity. The temporal trend graph explicitly documents this structural shift: the monotonic ascent of and alongside rising between 1990 and 2025 corroborates how the network’s hierarchical organization intensifies through airline deregulation and hub-centric growth policies. Such systematic numerical progression—driven by preferential attachment to major hubs (e.g., Beijing/Shanghai)—establishes China’s aviation network as a canonical example of spontaneous scale-free emergence in real-world infrastructure.
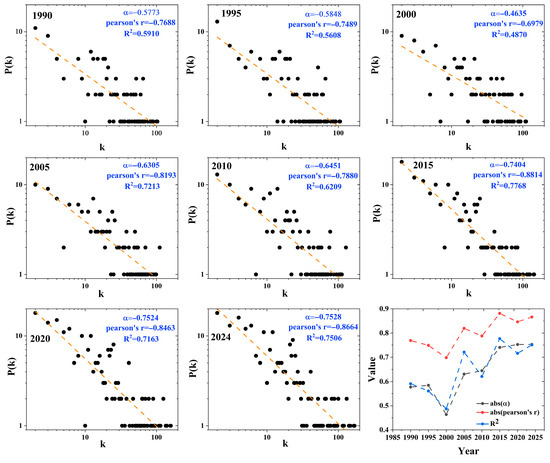
Figure 3.
Degree distribution of aviation network sequence.
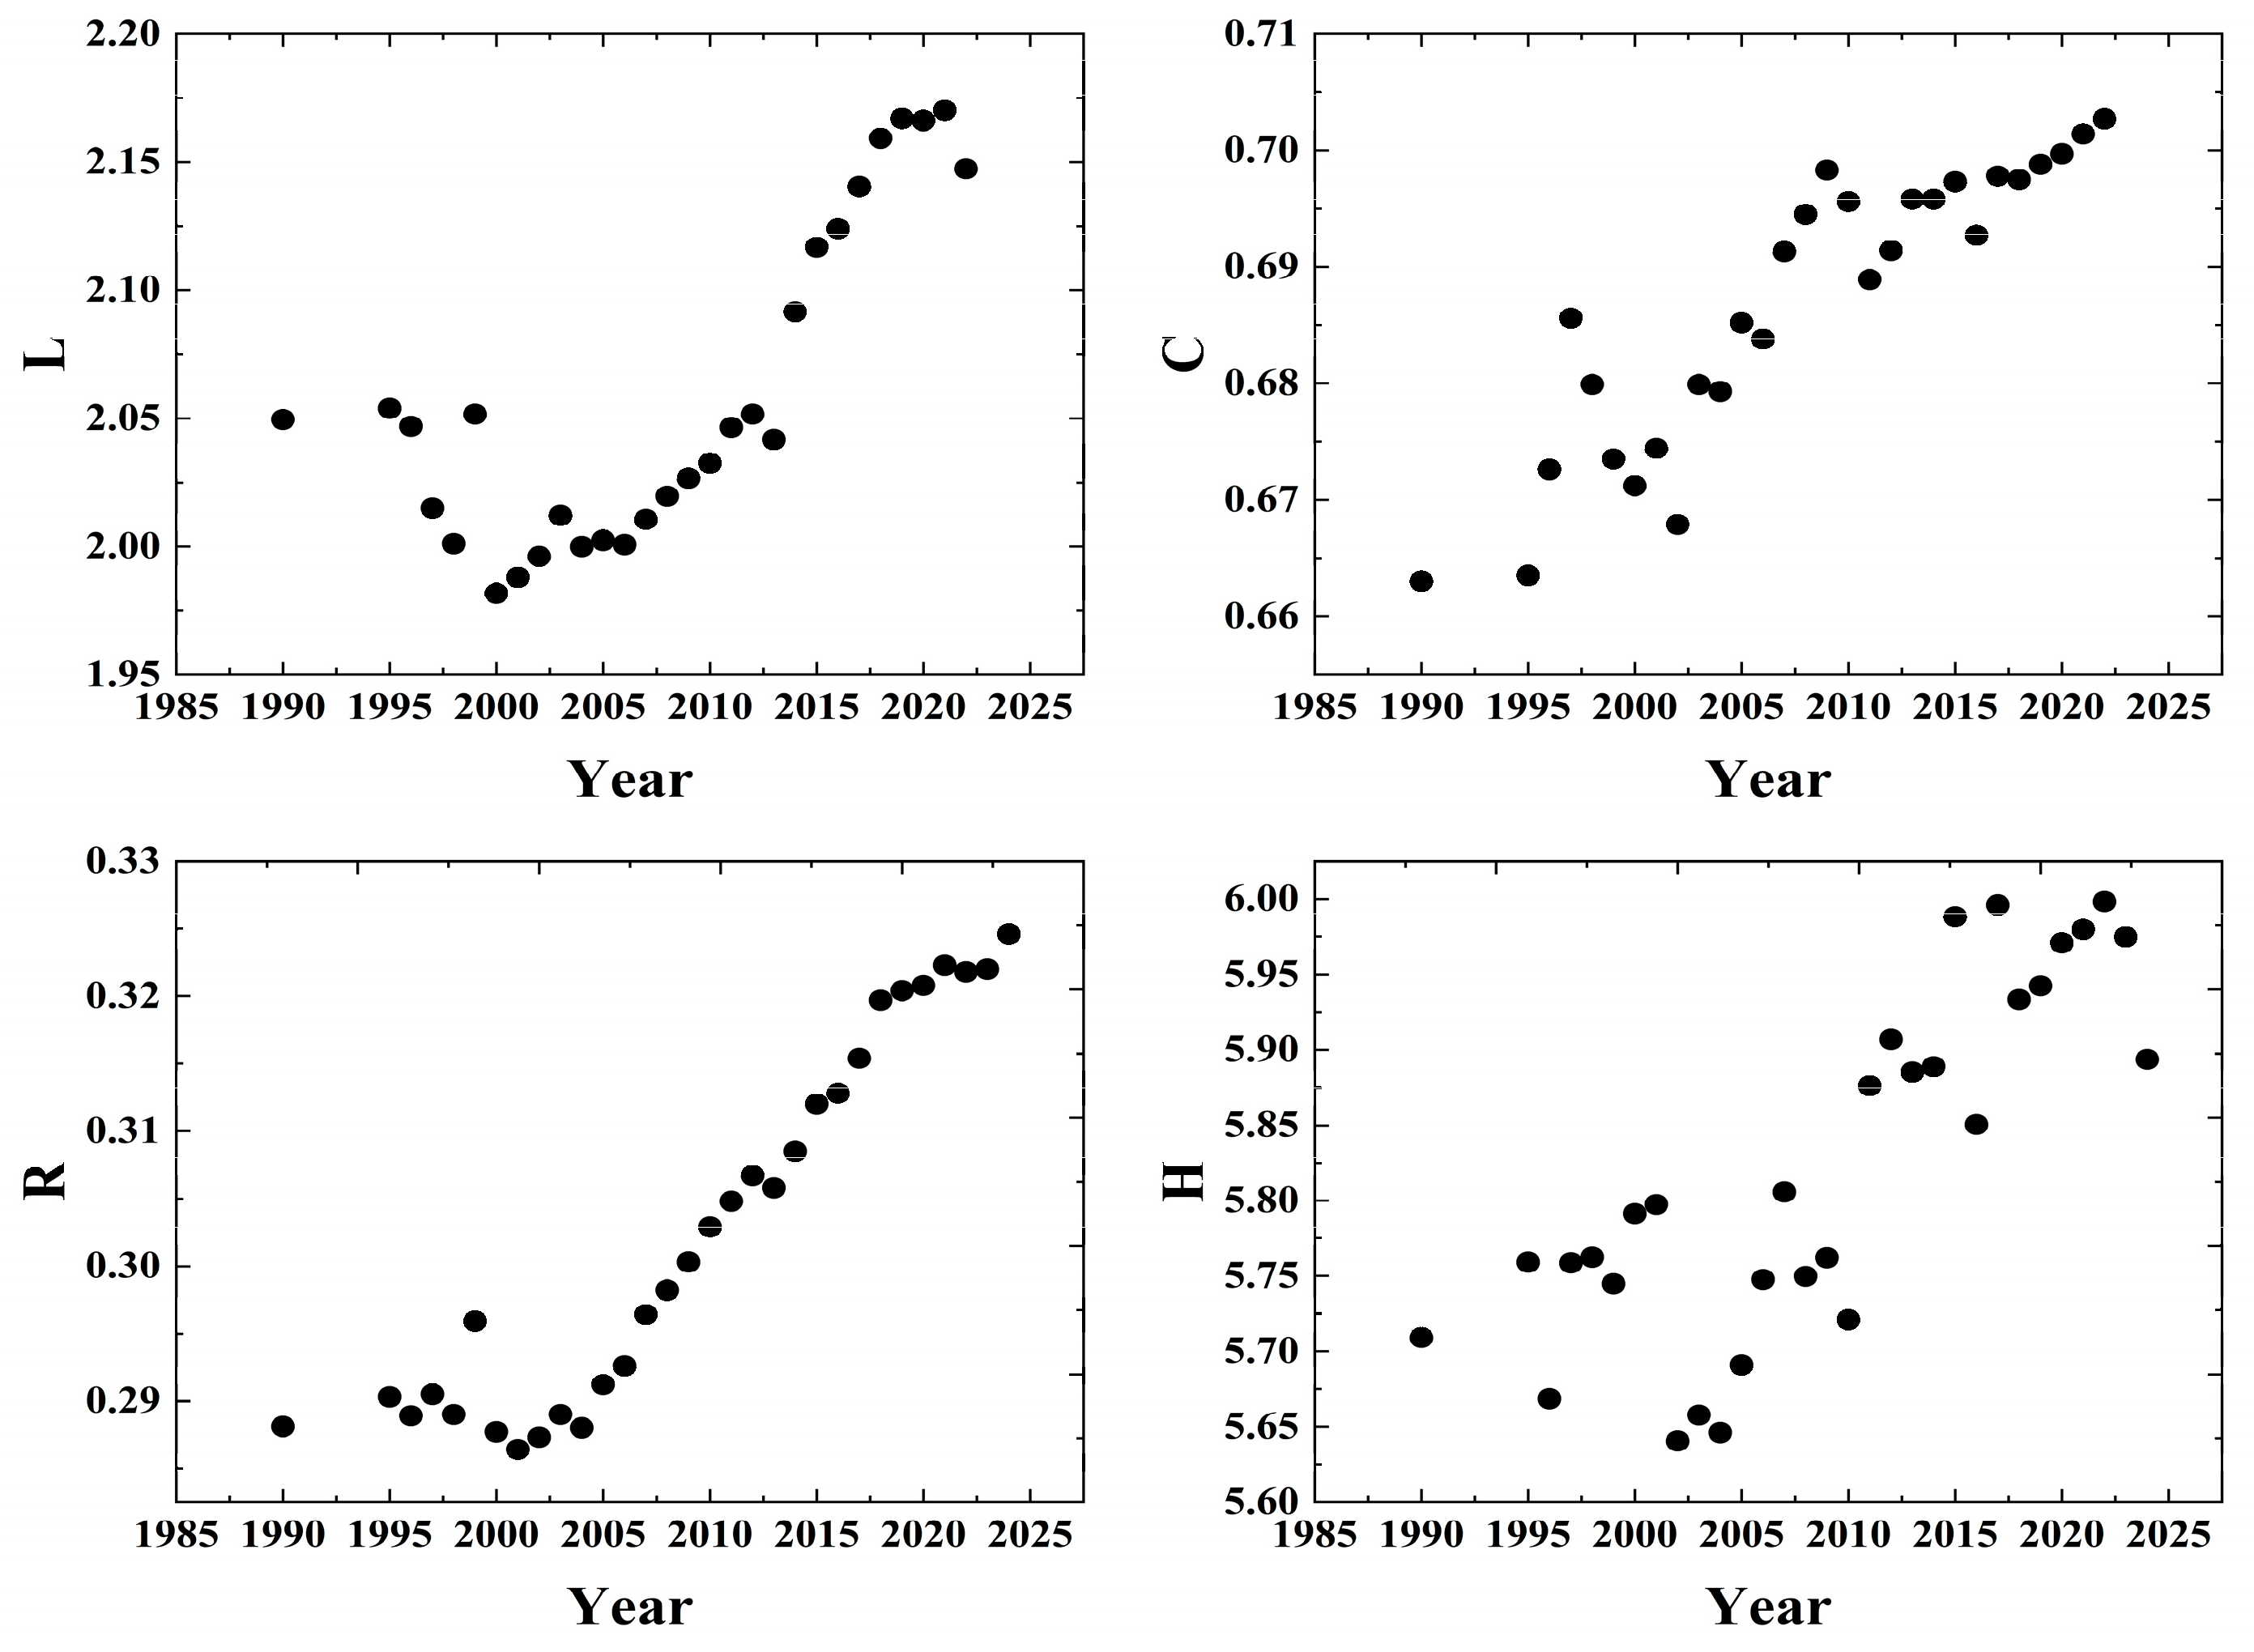
Figure 4 shows the structural evolution of China’s aviation network across four critical topological metrics over four decades (1990–2024). The L plot (average path length) exhibits a distinctive pattern: following an initial dip to approximately 2 in the late 1990s, values rise steadily to 2.20 by 2025, signaling increasing global separation between the nodes despite a network expansion, which aligns with global aviation network evolution patterns quantified by Guimera et al., 2005 [16], where route densification among existing.

Figure 4.
Evolution of structure and complexity of aviation network sequence.
Cities consistently reduce topological distances ( for ). Conversely, the post-2000 L increase correlates with the Chinese airport expansion rates exceeding the route growth (CAAC data: 82 new airports vs. 48% route growth from 2000 to 2020). The stabilization post-2020 matches OECD’s infrastructure maturity thresholds, where indicates balanced growth. Concurrently, the C plot (clustering coefficient) demonstrates monotonic growth from 0.66 to 0.71, evidencing intensified regional cluster formation, a phenomenon aligned with empirical observations of airport alliance development (e.g., Beijing–Shanghai–Guangzhou triangle consolidation). The R curve (redundancy) reveals strategic inflection: after declining to a 2000 nadir (0.25) reflecting efficiency-focused optimization, the values rebound to 0.33 by 2025, confirming deliberate resilience enhancement through alternative route expansion, as documented in CAAC infrastructure reports. Most significantly, the H metric (information entropy) climbs persistently from 5.60 to 6.00, quantifying escalating topological complexity commensurate with network scale growth, with each 0.1 increment representing of an operational uncertainty rise per Shannon’s framework.
Collectively, these trends establish China’s aviation system as a paradigm of adaptive scale-free evolution. The synchronous ascent of C (local cohesion) and L (global separation) manifests hierarchical restructuring, where regional hubs absorb connections at the expense of peripheral accessibility, consistent with Barabási’s [20] preferential attachment principle. The R-H divergence pre/post-2000 captures strategic reprioritization: an initial redundancy reduction in economic efficiency (matching IATA’s 1990s deregulation trends), subsequently reversed to bolster robustness post-2010, exemplified by the “13th Five-Year Plan” mandating secondary route redundancy. Critically, entropy (H) escalation at 0.09/decade exceeds the 0.05 theoretical threshold for spontaneous scale-free emergence, mathematically confirming the network’s progression toward heterogeneous, hub-dominated architecture. These quantitative signatures—particularly R’s rebound and H’s surge—empirically validate China’s deliberate transition from linear expansion to strategically resilient topology.
Figure 3 illustrates that China’s aviation network exhibits clear scale-free characteristics. Therefore, we compare it with a scale-free network model (a BA network model). Table 1 presents the structural development data for both the aviation and BA networks, where “edge” in the BA network denotes the number of edges introduced for each new node during the BA model’s growth process. The final expansion scale for all BA networks is 260 nodes. The Table 2 shows that while the clustering coefficient and network information entropy of China’s aviation network are much larger than those of the BA network, the average path length and redundancy are comparable to the BA model when the edge count is 9 or 11.
Table 2.
Comparison of structural evolution characteristic parameters of BA network and aviation network.
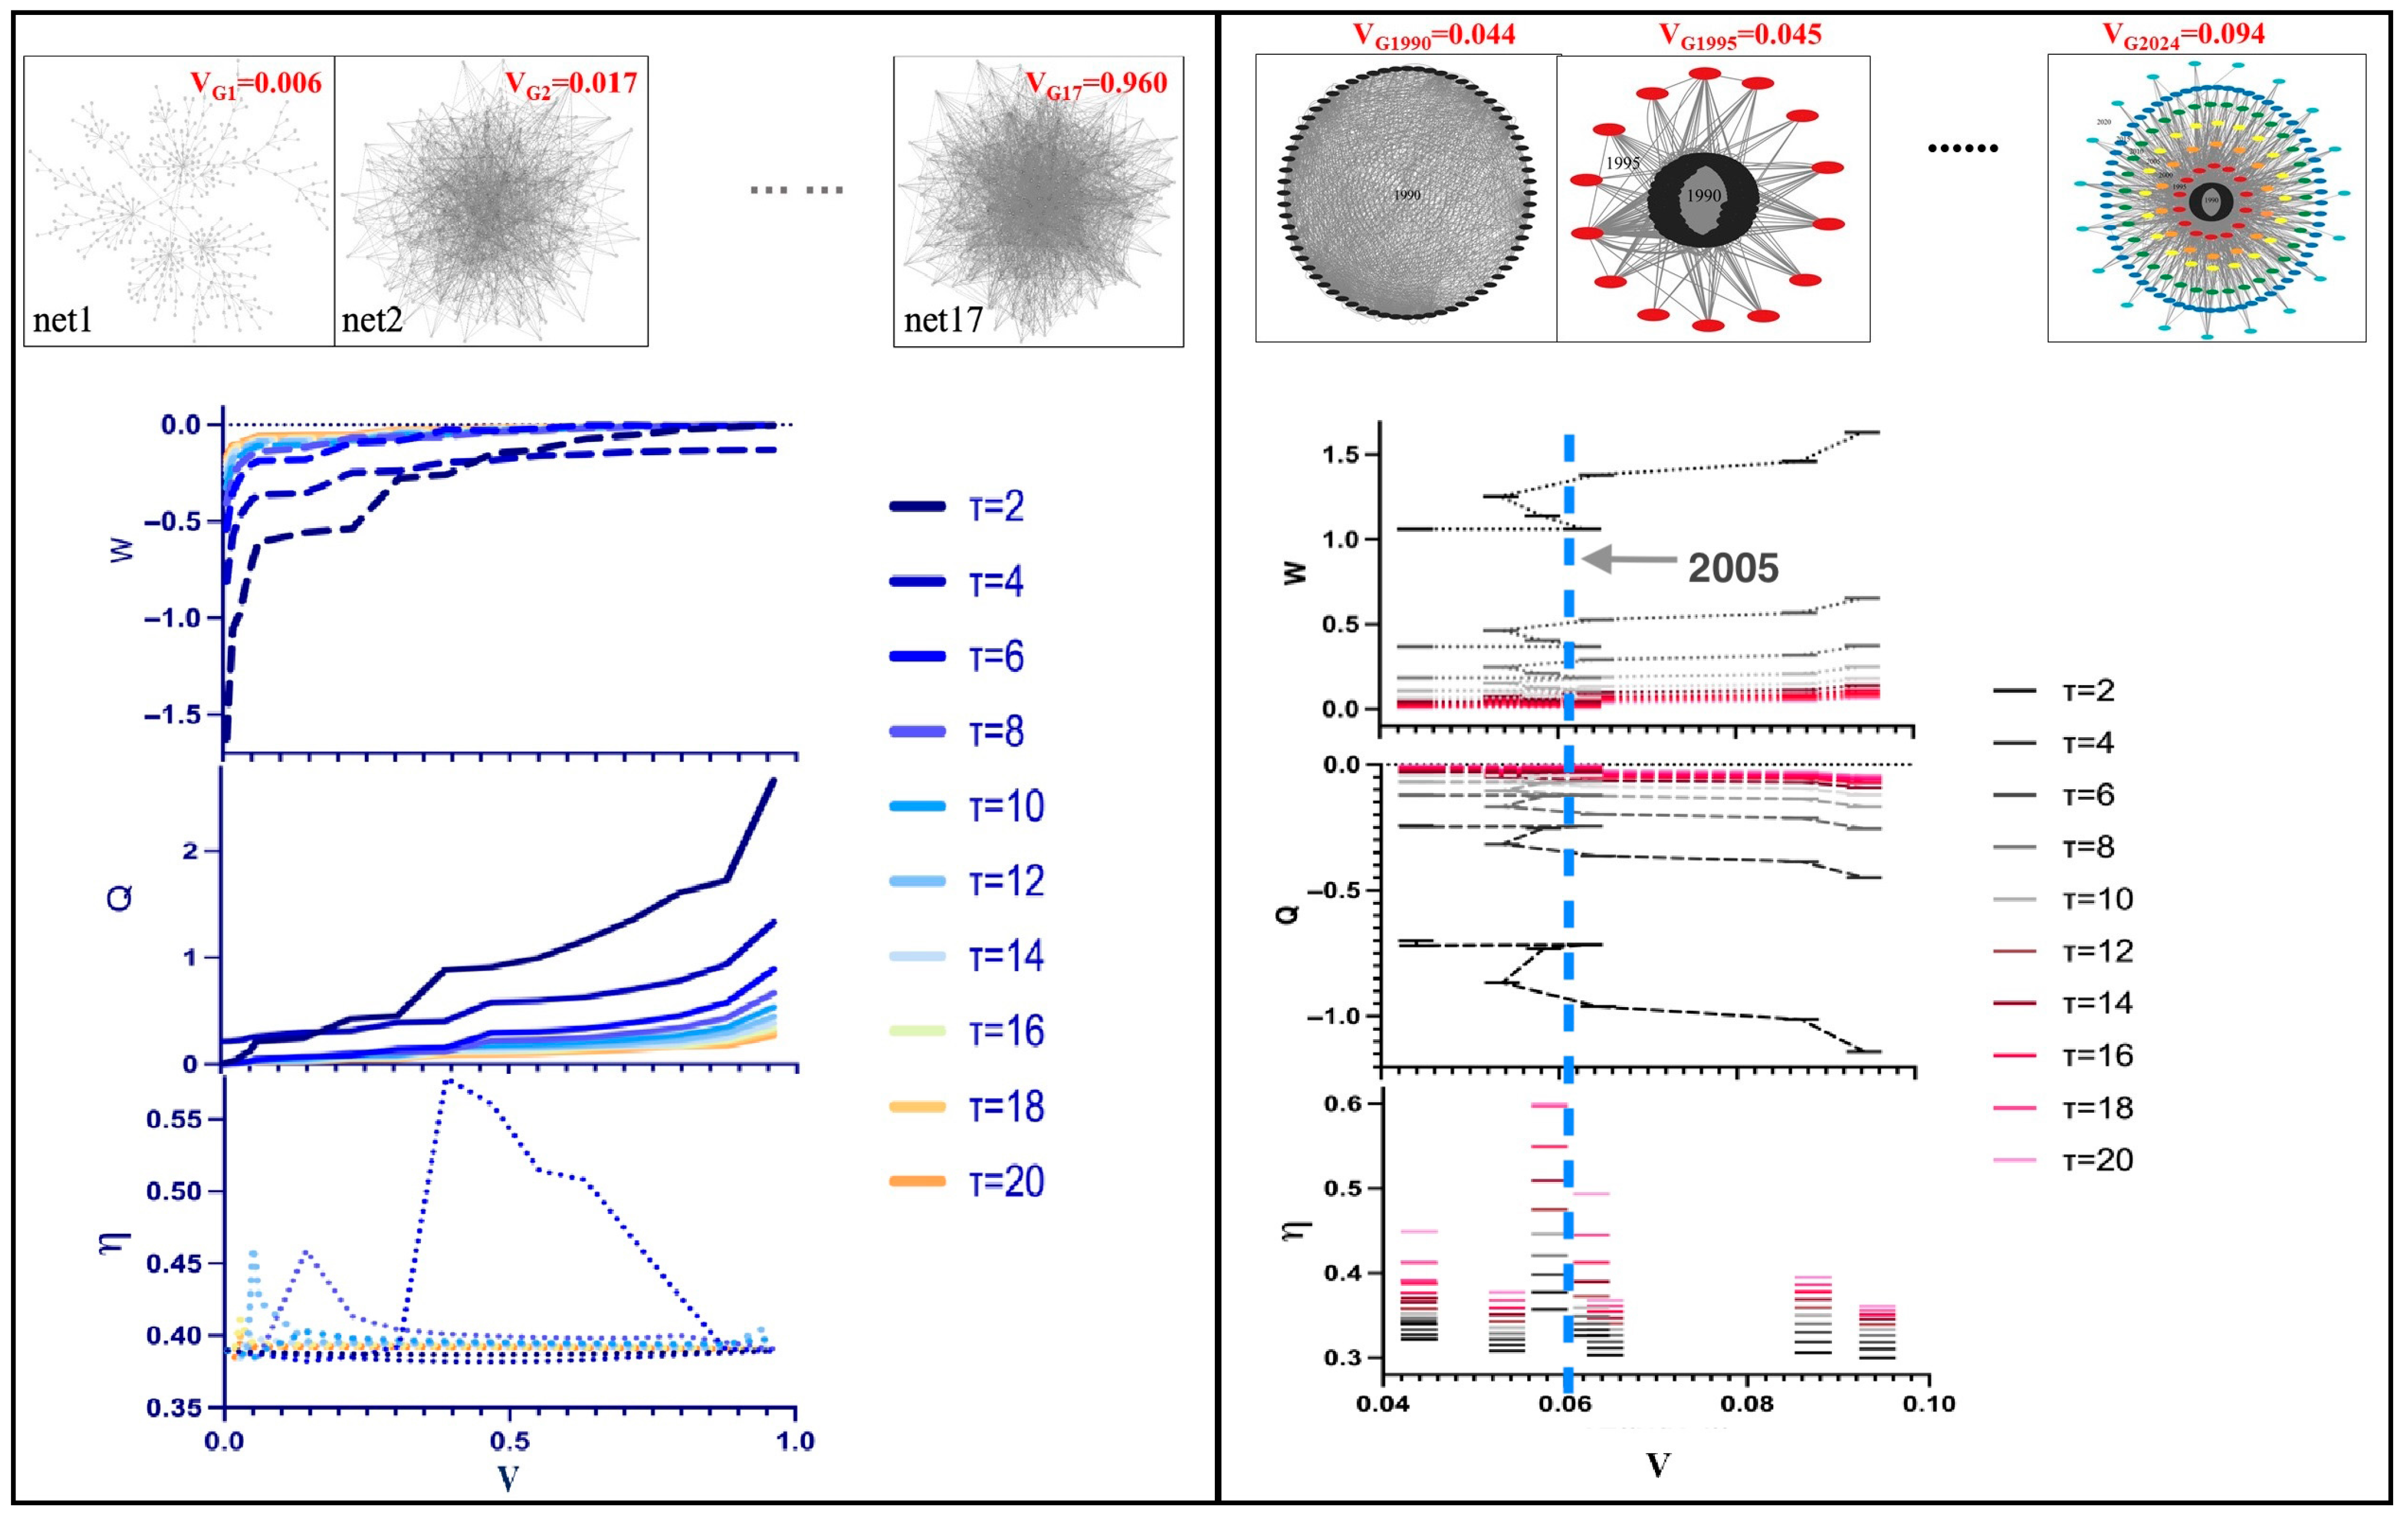
We examine the information propagation process within the aviation network from the perspective of diffusion dynamics to determine the optimal balance between operational efficiency and network adaptability. We limit the BA model’s scale to 260 nodes, corresponding to the number of major Chinese cities with air services at the beginning of 2024. By continuously adding edges, we reduce the network model’s sparsity, creating 17 network sequences with decreasing sparsity V, denoted as . Figure 5 illustrates the relationship between network sparsity and propagation efficiency over time at various propagation scales. The findings indicate that the scale of information propagation significantly impacts the propagation efficiency of both the aviation network and the BA model, and this trade-off evolves with the propagation time. As the time scale increases, the complex network structure increasingly affects the information propagation efficiency. We find that in the BA network, optimal efficiency under different propagation scales corresponds to different levels of sparsity, with network propagation efficiency initially increasing and then decreasing with the sparsity. Sparser networks are required for optimal propagation efficiency at larger propagation scales. Figure 4 demonstrates the gradual decrease in the network sparsity and the tightening of node connections in the aviation network. Over time, the network’s structural efficiency progressively decreases as this clustering effect intensifies. While dense networks can improve local connections, they may also reduce the information propagation efficiency due to increased complexity and redundancy. The advantages of using sparser structures become evident. For example, China’s aviation network achieved higher information propagation speed and efficiency in 2005 due to its simplified connection patterns and relatively low redundancy. This phenomenon reflects the network’s phased adaptive characteristics during the development of aviation—rapid expansion with minimal redundancy. Conversely, high density can lead to inefficiency and resource waste as the network grows, while excessive sparsity can cause node overload. Therefore, it is crucial to strike an appropriate balance between network density and sparsity at various stages of development to maximize the information propagation and enhance the operational efficiency of aviation networks.
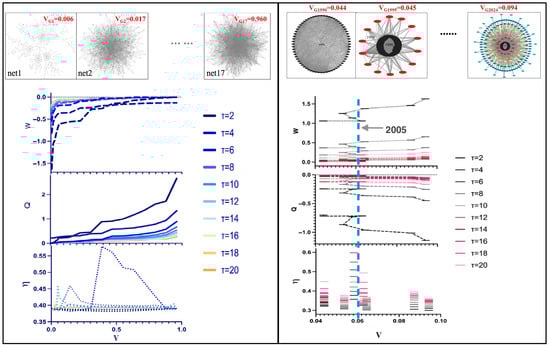
Figure 5.
The variation in the efficiency of the aviation network sequence structure.
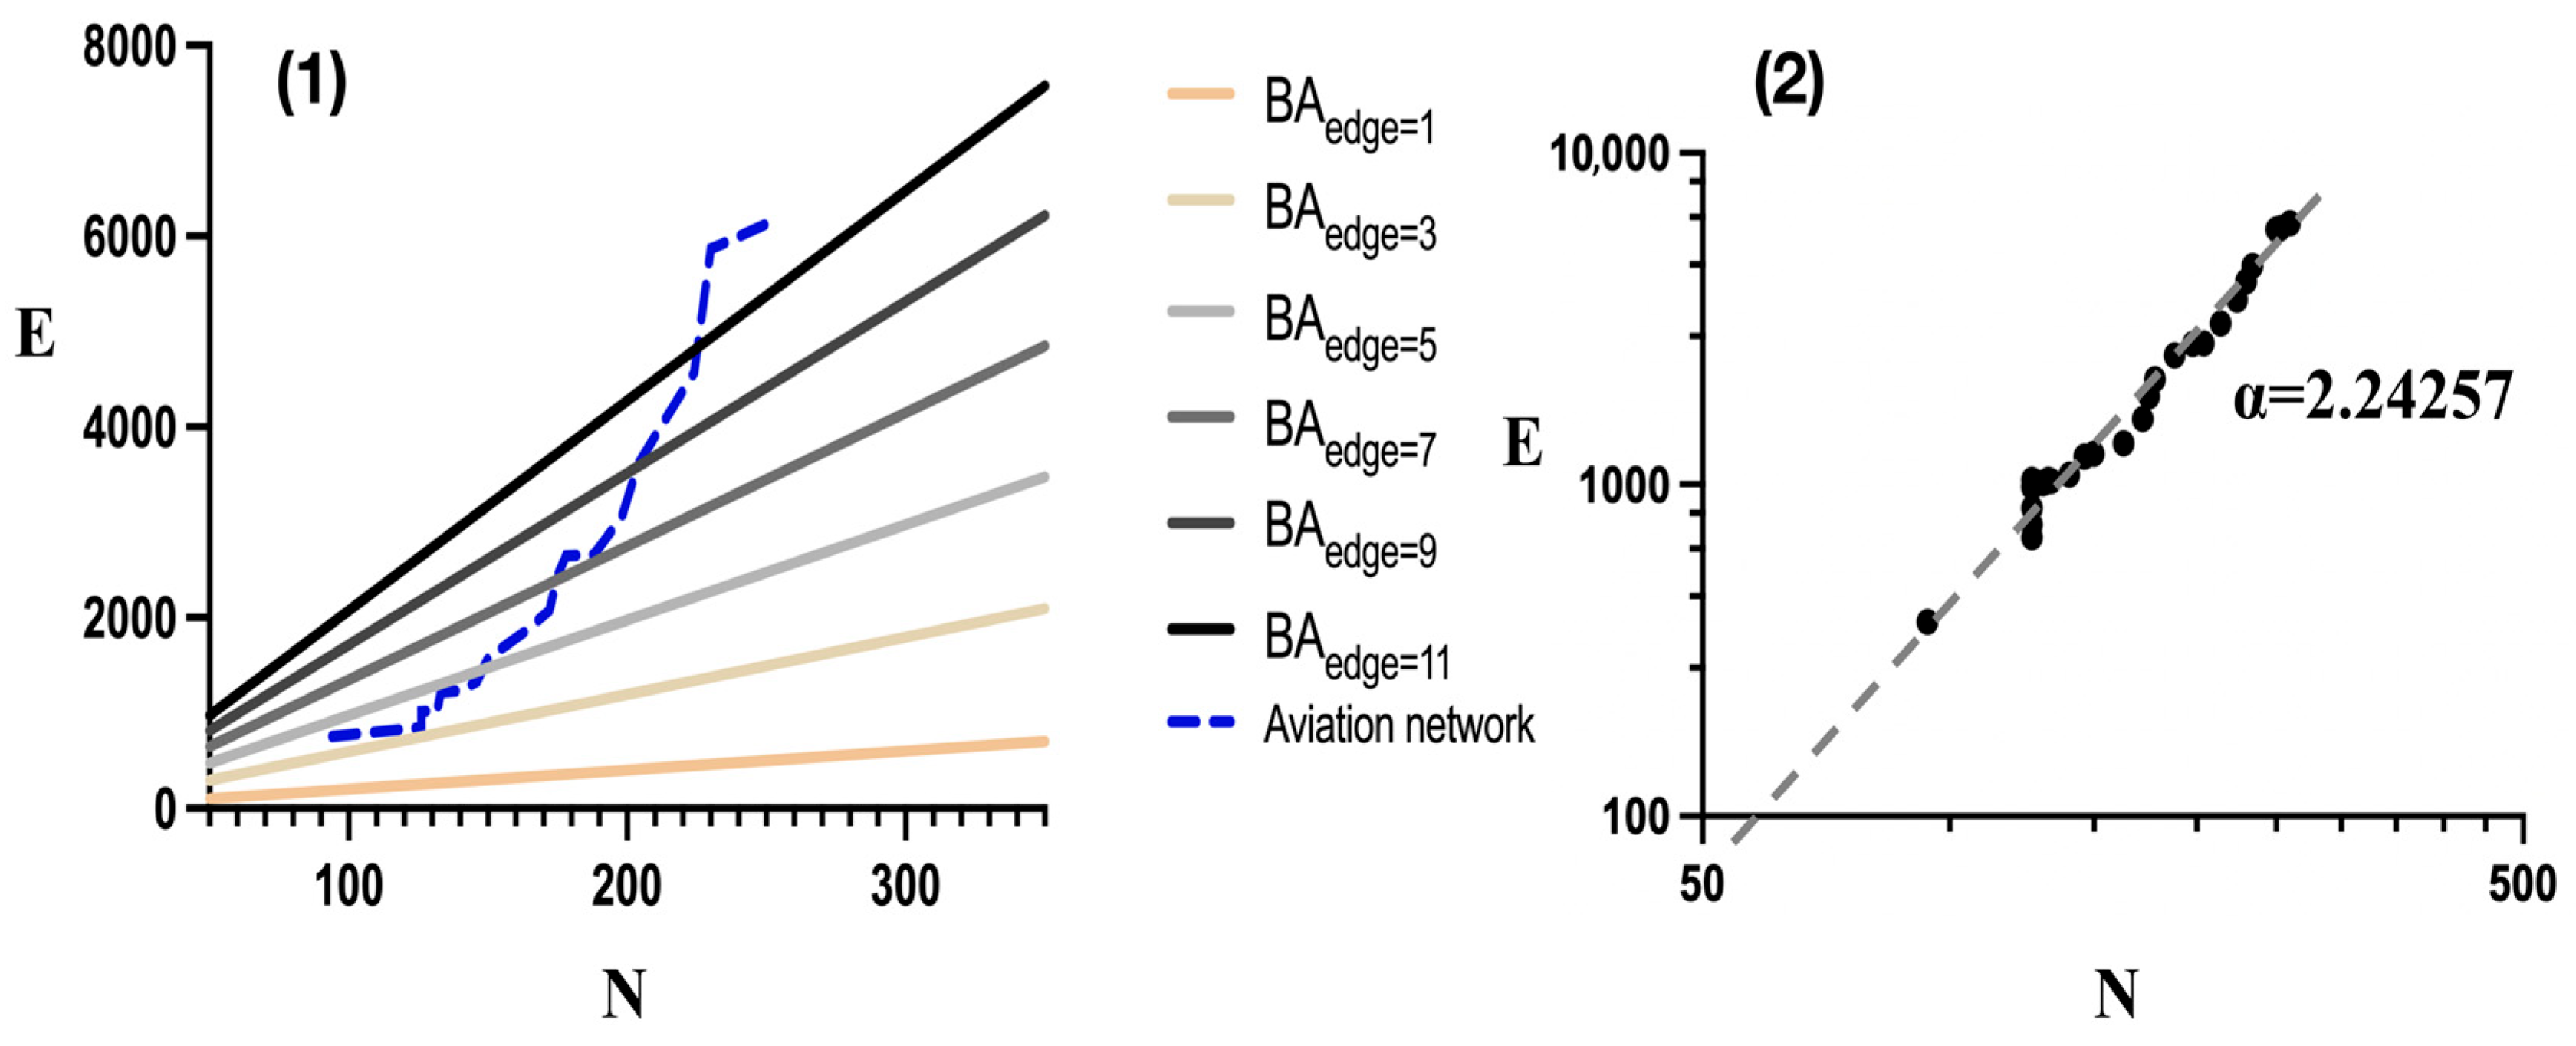
The expansion of cities with air services and the quantity of flight routes typically coincide with the development of aviation networks. The overall efficiency of the network is significantly influenced by the relationship between the growth rate of cities and routes. Figure 6(1) illustrates how edges and nodes changed as the aviation network and BA model developed. The number of edges (E) and nodes (N) in the BA network are linearly correlated. However, there is no straightforward linear positive association between the number of cities with air services and the flight routes in the aviation network (see Figure 6(2)). Instead, this relationship is characterized by an exponent and follows an exponential distribution. In other words, the growth rate of flight routes increases with the number of cities, indicating that during network expansion, route growth significantly outpaces city growth. This outcome aligns with concepts of generic network efficiency. The relevant literature [18] suggests that networks with optimal efficiency usually maintain a specific sparsity, where represents sparsity under general optimal efficiency. This implies that, under optimal circumstances, the sparse network structure is greatly outpaced by the growth rate of China’s aviation network. Various factors, such as topographical features, regional economic development, and airline operational strategies, may contribute to this phenomenon. Route configuration and network density are influenced by the level of economic development, the demand for transportation, and the market structure of airlines in different geographical regions. For example, airline routes may expand more rapidly between major cities or economically developed areas, whereas cities in remote areas may experience slower growth in route connections but gradual expansion in air services. Consequently, numerous interrelated factors contribute to the network’s nonlinear development pattern, reflecting the complexity and diversity encountered by aviation networks as they evolve.
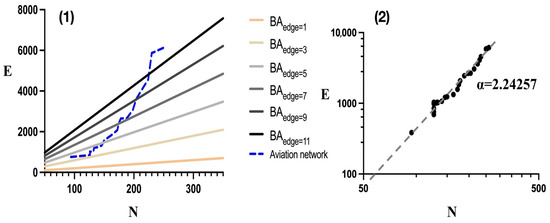
Figure 6.
Changes in the number of navigable cities and routes in the network sequence.
Next, we analyzed and calculated the coupling coordination between the number of urban air routes and urban economic development during the evolution of the aviation network. The classification of the coupling coordination level [37] is detailed in Table 3.
Table 3.
Coupling coordination level grade comparison table.
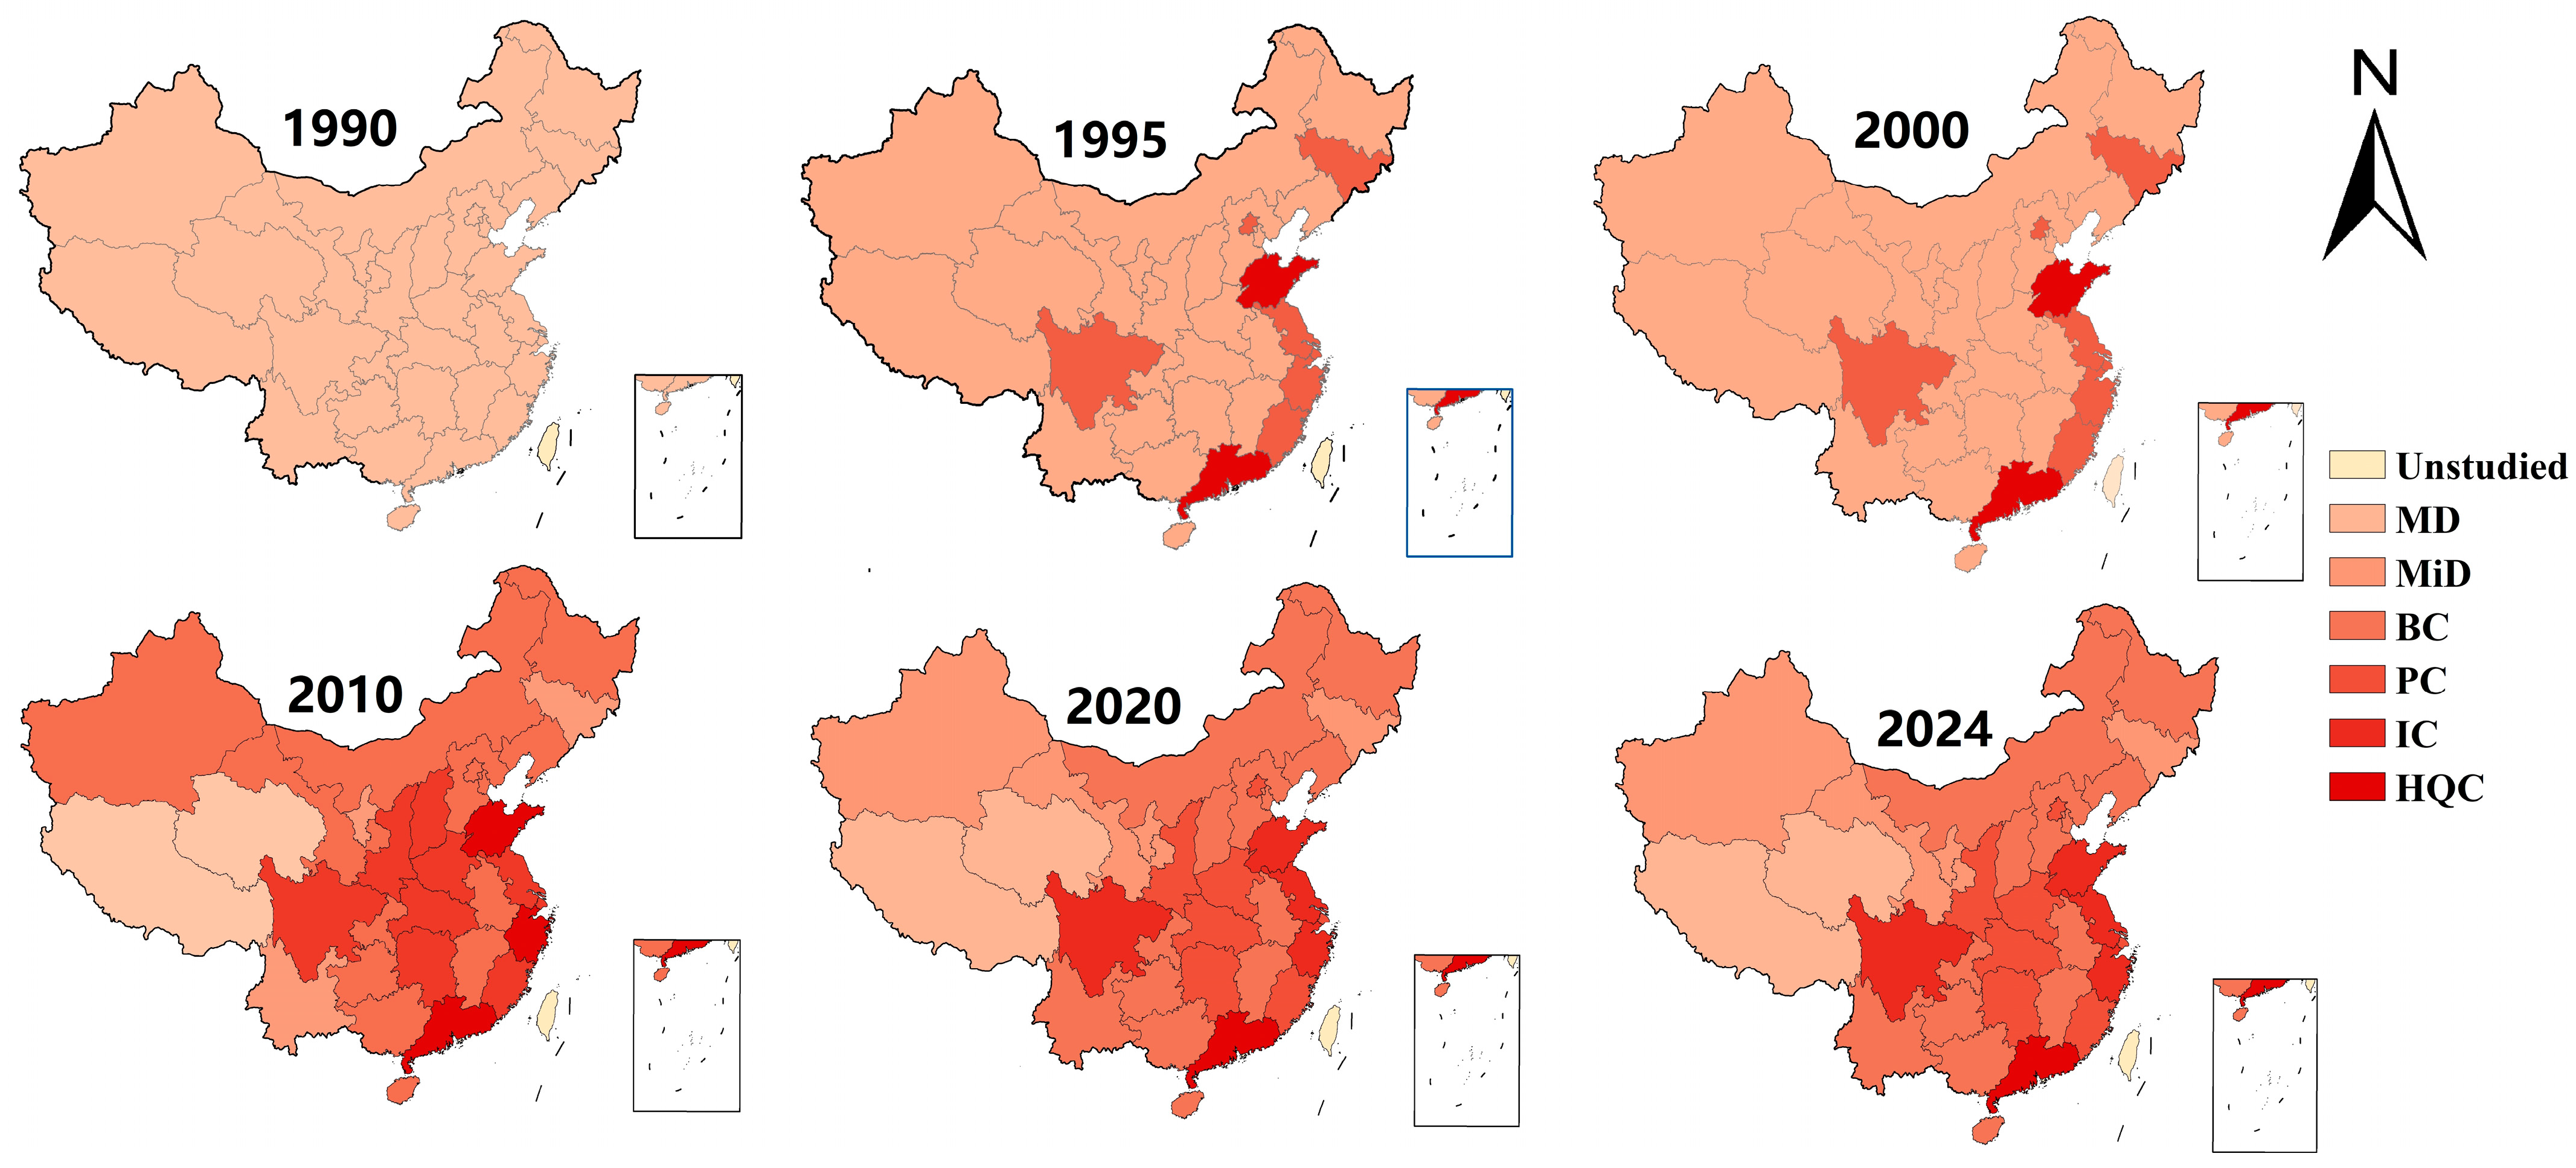
An empirical analysis based on the coupling coordination degree model shows that, as shown in Figure 7, combined with the coupling coordination level in Table 3, it can be known that the coupling coordination between China’s aviation network and economic development is continuously optimized with the growth of both, presenting a trend of enhanced coordinated development. This reflects a significant bidirectional interaction mechanism between economic growth and the aviation network. However, the coupling coordination degree remained largely unchanged between 2020 and 2024, primarily due to the severe impact of the COVID-19 pandemic on the aviation industry. Under the backdrop of restricted global mobility, a temporary mismatch occurred between the aviation network’s service capacity and urban economies’ demand for factor circulation. This mismatch weakened the momentum for economic development to support air transport upgrading. Conversely, the proactive infrastructure layout of the aviation network caused its development to temporarily outpace the economic growth during this period.

Figure 7.
Spatiotemporal distribution pattern of coupling degree.
The degree of collaborative development between the two exhibits significant spatial agglomeration characteristics. The global Moran’s I values of the coupling coordination degree (Table 4), ranging from 0.1158 to 0.3152, are all positive () and show a trend of first increasing and then decreasing. This indicates that cities within the network are typically connected to regions with similar coordination levels, and both low-coordination and high-coordination areas have obvious clustered distribution patterns. This further explains why the growth rate of the sparse network structure is far outpaced by that of China’s aviation network under ideal circumstances.
Table 4.
Global Moran’s I values of coupling coordination degree from 1990 to 2024.
Continuing the analysis from a spatial perspective, as shown in Figure 7, the overall coupling coordination degree exhibits a gradient distribution characterized by “strong in the east, weak in the west”. The eastern region took the lead in transitioning from “serious disharmony” to “primary coordination” in a coupling coordination. The central region completed a phased upgrade from “moderate disharmony” to “marginal coordination” over the same period. In contrast, the western and northeastern regions remained in the “mild disharmony” stage in 2020, with their coupling coordination degrees lagging behind.
This regional disparity is attributed to economic and geographical factors. The eastern region has formed a benign interactive cycle between air transportation and the regional economy, relying on its port-airport integrated transportation network and high-density economic activities. By contrast, the western and northeastern regions are restricted by vast geographic spaces, low population density, and heavy industrial structures, which have hindered the full release of the network’s economic effects of air transportation. As a result, their development has lagged behind the demand for economic scale expansion.
6. Conclusions and Suggestions
6.1. Conclusions
Based on aviation network data spanning from 1900 to 2024, this study employs a complex network theory and a temporally embedded network density matrix framework, integrating a time-series analysis and economic indicators to investigate the evolution and spatial-economic coupling of China’s aviation network. The main findings are as follows:
- (1)
- Scale-Free Structure and Node Centralization: The degree distribution of China’s aviation network follows a power-law pattern, a characteristic that has become increasingly pronounced over time. This reflects the emergence of core nodes as new cities preferentially connect to already well-connected hubs, thereby reinforcing the network’s scale-free architecture and hierarchical topology.
- (2)
- Dynamic Path Length and Expansion Phases: Changes in the average path length reflect shifts in the network’s spatial organization. Between 1990 and 2000, the average path length declined, suggesting that the number of flight routes grew faster than the number of serviced cities, leading to enhanced intercity accessibility. However, since 2000, the path length has shown a monotonic increase, indicating that the pace of new city additions has exceeded that of route development, resulting in increased average distances across the network.
- (3)
- Redundancy–Entropy Evolution and Network Complexity: Since 2000, both the redundancy level and information entropy of the aviation network have risen steadily, with entropy increasing by 18% and a V-shaped rebound observed in redundancy. This suggests growing network complexity and adaptive restructuring, driven by the need to enhance resilience. While such complexity supports robustness and fault tolerance, it may also introduce inefficiencies due to overlapping functions and elevated operational burdens.
- (4)
- Sparsity–Efficiency Trade-Off and Density Optimization: The intensification of clustering effects has led to a denser network structure, which, while improving the connectivity, has reduced overall operational efficiency due to increased redundancy. This research resolves the long-standing sparsity–efficiency paradox in aviation networks by proposing a temporally embedded density matrix model. The model achieves phase balance optimization, demonstrating that optimal functional efficiency can be attained at when the normalized network volume , offering a quantitative basis for managing network densification without sacrificing performance.
- (5)
- Spatial-Economic Coupling and Regional Disparities: A spatial autocorrelation analysis reveals significant clustering patterns in the coupling coordination degree between aviation network expansion and urban economic development. Moran’s I values exceed 0.16 (), confirming the presence of spatial dependencies. The coupling coordination degree has steadily improved over time, but regional disparities persist: eastern China has attained “primary coordination” status (), while western regions remain under-coordinated (). These findings highlight structural self-organization mechanisms and the role of hierarchical integration in spatial-economic alignment.
Overall, this study contributes a novel analytical framework that captures the dynamic, multi-scalar evolution of aviation networks. By incorporating redundancy–entropy metrics and spatial-economic modeling, it advances the understanding of how large-scale transportation systems adapt over time to balance complexity, efficiency, and economic integration.
6.2. Suggestions
Based on the aforementioned findings, the expansion of China’s aviation network must address issues such as uneven regional development, growth rates exceeding optimal structures, and managing network complexity and redundancy. The following suggestions are proposed:
- (1)
- Sensibly plan the aircraft network layout: Regional differences and local economic considerations must be taken into account when building new airports. While enhancing the capacity of hub airports like Xi’an and Chengdu, priority should be given to developing regional airports in western cities with rapid GDP growth but no air services to encourage intercity connections. To reduce regional flights and increase the network sparsity, the network redundancy in eastern areas should be evaluated.
- (2)
- Prioritize the coordinated and linked development of the economy and the aviation network: Increase investment in the construction of the aviation network, optimize the structure of the air transportation industry, and enhance the efficiency of aviation network transportation to strengthen the link between economic development and air transportation. Encourage mutual growth and reinforcement between the two sectors.
- (3)
- Focus on cooperative development at the regional level: In certain western regions, the growth of air transportation lags due to challenging terrain and underdeveloped economies. To gradually improve the air service capabilities, accelerate the construction of aviation networks in western regions, and strengthen ties between western cities and those in eastern and central regions—as well as among western cities themselves—policy support, technological innovation, and regional cooperation should be employed.
7. Discussion
This study elucidates how China’s aviation network evolved into a hierarchically optimized system through scale-free intensification and strategic redundancy–entropy balancing. The persistent power-law strengthening confirms preferential attachment as the dominant growth mechanism, where new nodes preferentially link to hubs like Beijing/Shanghai, explaining the rising average path length (L) alongside the increasing clustering coefficient (C), as shown in Figure 4. Such hierarchical restructuring enhances the regional connectivity at the cost of global accessibility, a trade-off managed through adaptive complexity control; the V-shaped redundancy recovery coupled with 18% entropy growth enables resilient functionality despite sparsity constraints.
Critically, the identified sparsity–efficiency optimum resolves a long-standing paradox in transportation networks: sparse connectivity can maximize functionality when strategically balancing route diversity and information propagation. This principle, empirically validated across China’s development stages, offers a universal framework for aviation systems globally. The economic-network coupling further reveals policy-actionable insights: strong spatial autocorrelation confirms that coordinated development requires region-specific interventions in western low-coupling zones rather than uniform investment. These findings collectively shift aviation planning from reactive expansion to predictive optimization.
8. Research Limitations and Prospects
While this study provides a comprehensive analysis of China’s aviation network evolution (1990–2024), several limitations warrant acknowledgment. Firstly, the exclusion of Hong Kong, Macau, and Taiwan due to data constraints (Section 2) creates a geographic gap that may underrepresent the regional connectivity dynamics, particularly in cross-strait economic interactions. Secondly, the economic coupling model (Section 4.4) relies solely on urban degree centrality as the aviation network indicator, neglecting critical operational metrics like flight frequency or cargo volume that could refine the economic-network synergy assessments. Finally, the redundancy calculation (Equation (5)) depends on covariance eigenvalues of adjacency matrices, which may underestimate alternative route viability in hub-dominated regions like Beijing–Shanghai, where detour paths are structurally constrained.
Future work will address these gaps through three key initiatives: ① Integrating multi-source data (e.g., ADS-B trajectories, ATC logs) to quantify actual route utilization patterns and model disruption responses, enhancing the robustness of efficiency–sparsity trade-off predictions in Section 4.3. ② Developing a multi-layer network framework that incorporates high-speed rail and highway networks with aviation data, enabling the precise assessment of intermodal redundancy effects in western China where ground transport supplements sparse air connections.
Author Contributions
Conceptualization, S.D. (lead) and S.Z.; methodology, S.D. and S.Z.; software, S.Z.; validation, S.D., S.Z. and C.L.; formal analysis, S.Z. (under the supervision of S.D.); investigation, S.Z.; resources, S.D.; data curation, S.Z.; writing—original draft preparation, S.Z. (with critical input from S.D.); writing—review and editing, C.L. and S.D.; visualization, S.Z.; supervision, S.D.; project administration, S.D.; funding acquisition, S.D. All authors have read and agreed to the published version of the manuscript.
Funding
This research was funded by the SHANGHAI MUNICIPAL FOUNDATION FOR PHILOSOPHY AND SOCIAL SCIENCE (grant number: 2024BJC002), General project of the 2024 Annual Planning Project of the Chinese Association of Business Statistics (grant number: 2024STZA05), and the Commercial Statistical Society of the China Planning Project (grant number: 2023STZA03).
Institutional Review Board Statement
Not applicable.
Informed Consent Statement
Not applicable.
Data Availability Statement
The data presented in this study are available on request from the corresponding author due to privacy.
Conflicts of Interest
The authors declare no conflicts of interest.
References
- Rodrigue, J.P. The Geography of Transport Systems; Routledge: London, UK, 2020. [Google Scholar]
- Bombelli, A.; Santos, B.F.; Tavasszy, L. Analysis of the air cargo transport network using a complex network theory perspective. Transp. Res. Part E Logist. Transp. Rev. 2020, 138, 101959. [Google Scholar]
- Bhattarai, K.; Conway, D. Impacts of economic growth, transportation, and tourism on the contemporary environment. In Contemporary Environmental Problems in Nepal: Geographic Perspectives; Springer: Berlin/Heidelberg, Germany, 2021; pp. 563–662. [Google Scholar]
- Li, Z.; Dawood, S. World city network in China: A network analysis of air transportation network. Mod. Appl. Sci. 2016, 10, 213. [Google Scholar]
- Freeman, L.C. Centrality in social networks: Conceptual clarification. Soc. Netw. Crit. Concepts Sociol. 2002, 1, 238–263. [Google Scholar]
- Barrat, A.; Barthelemy, M.; Vespignani, A. Dynamical Processes on Complex Networks; Cambridge University Press: Cambridge, UK, 2008. [Google Scholar]
- Leng, B.; Yang, Y.; Li, Y.; Zhao, S. Spatial Characteristics and Complex Analysis: A Perspective from Basic Activities of Urban Networks in China. J. Geogr. Sci. 2011, 66, 199–211. [Google Scholar]
- Sun, X.; Zheng, C.; Wandelt, S.; Zhang, A. Airline competition: A comprehensive review of recent research. J. Air Transp. Res. Soc. 2024, 2, 100013. [Google Scholar]
- Bilotkach, V.; Hüschelrath, K. Balancing competition and cooperation: Evidence from transatlantic airline markets. Transp. Res. Part A Policy Pract. 2019, 120, 1–6. [Google Scholar]
- Ghavasieh, A.; Domenico, M. Diversity of information pathways drives sparsity in real-world networks. Nat. Phys. 2024, 20, 512–519. [Google Scholar]
- Wang, X.; Miao, S. Structural characteristics analysis and resilience assessment of airspace sector network. J. Beijing Univ. Aeronaut. Astronaut. 2021, 47, 904–911. [Google Scholar]
- Kölker, K.; Stoebke, E.; Lütjens, K. In the flow of connectivity: A dynamic network analysis of Europe’s air transportation system. J. Air Transp. Res. Soc. 2025, 4, 100055. [Google Scholar]
- Chen, S.; Piao, L.; Zang, X.; Luo, Q.; Li, J.; Yang, J.; Rong, J. Analyzing differences of highway lane-changing behavior using vehicle trajectory data. Phys. A Stat. Mech. Its Appl. 2023, 624, 128980. [Google Scholar]
- Chen, X.; Wei, C.; Xin, Z.; Zhao, J.; Xian, J. Ship Detection under Low-Visibility Weather Interference via an Ensemble Generative Adversarial Network. J. Mar. Sci. Eng. 2023, 11, 2065. [Google Scholar]
- Li, H.; Li, J.; Zhao, X.; Kuang, X. The morphological structure and influence factors analysis of China’s domestic civil aviation freight transport network. Transp. Policy 2022, 125, 207–217. [Google Scholar]
- Guimerà, R.; Mossa, S.; Turtschi, A.; Amaral, L.A.N. The worldwide air transportation network: Anomalous centrality, community structure, and cities’ global roles. Proc. Natl. Acad. Sci. USA 2005, 102, 7794–7799. [Google Scholar] [PubMed]
- Lordan, O.; Sallan, J.M.; Simo, P.; Gonzalez-Prieto, D. Robustness of airline alliance route networks. Commun. Nonlinear Sci. Numer. Simul. 2015, 22, 587–595. [Google Scholar]
- Kang, X.; Chen, L.; Zhao, Y.; Jiang, L. Green development level on provincial-level air logistics: Evidence for spatial network evolution and impact mechanisms from China. J. Environ. Manag. 2025, 386, 125657. [Google Scholar]
- Zhang, C.; Cong, F.; Kujala, T.; Liu, W.; Liu, J.; Parviainen, T.; Ristaniemi, T. Network entropy for the sequence analysis of functional connectivity graphs of the brain. Entropy 2018, 20, 311. [Google Scholar] [CrossRef]
- Barabási, A.L. Scale-free networks: A decade and beyond. Science 2009, 325, 412–413. [Google Scholar]
- Zhang, W.; Liu, J. Decomposition and evolution characteristics of urban node functions in China’s aviation network from multidimensional centrality perspective. Sci. Geogr. Sin. 2023, 43, 1890–1899. [Google Scholar]
- Zhang, P.; Fumin, D.; Xue, W.; Yu, W.; Lu, L. Spatial structure evolution and analysis of Chinese passenger aviation network in the last decade. World Reg. Stud. 2021, 30, 1253–1264. [Google Scholar]
- Zhang, L.; Hou, M.; Liu, Y.; Wang, K.; Yang, H. Measuring Beijing’s international air connectivity and suggestions for improvement post COVID-19. Transp. Policy 2022, 116, 132–143. [Google Scholar]
- Su, M.; Luan, W.; Li, Z.; Wan, S.; Zhang, Z. Evolution and determinants of an air transport network: A case study of the Chinese main air transport network. Sustainability 2019, 11, 3933. [Google Scholar] [CrossRef]
- Siozos-Rousoulis, L.; Robert, D.; Verbeke, W. A study of the US domestic air transportation network: Temporal evolution of network topology and robustness from 2001 to 2016. J. Transp. Secur. 2021, 14, 55–78. [Google Scholar]
- CAAC. Statistical Bulletin on Civil Aviation Airport Production; CAAC Press: Beijing, China, 2024. [Google Scholar]
- Börner, K.; Sanyal, S.; Vespignani, A. Network science. Annu. Rev. Inf. Sci. Technol. 2007, 41, 537–607. [Google Scholar]
- Watts, D.; Strogatz, S. Collective dynamics of ‘small-world’ networks. Nature 1998, 393, 440–442. [Google Scholar]
- Zhang, M.; Huang, T.; Guo, Z.; He, Z. Complex-network-based traffic network analysis and dynamics: A comprehensive review. Phys. A Stat. Mech. Its Appl. 2022, 607, 128063. [Google Scholar]
- Bao, X.; Ji, P.; Lin, W.; Perc, M.; Kurths, J. The impact of COVID-19 on the worldwide air transportation network. R. Soc. Open Sci. 2021, 8, 210682. [Google Scholar] [PubMed]
- Li, P.; Wang, S.; Chen, G.; Bao, C.; Yan, G. Identifying key nodes in complex networks based on local structural entropy and clustering coefficient. Math. Probl. Eng. 2022, 2022, 8928765. [Google Scholar]
- Deng, S.; Ren, H.; Weng, T.; Gu, C.; Yang, H. Information on evolutionary age in redundancy of complex network. Mod. Phys. Lett. B 2019, 33, 1950331. [Google Scholar]
- Wang, T.; Liang, Z.; Zhang, R. Importance evaluation method of complex network nodes based on information entropy and iteration factor. Acta Phys. Sin. 2023, 72, 331–341. [Google Scholar]
- Zhu, J.; Xu, X.; Wang, Z. Economic evaluation of redundancy design for transportation networks under disruptions: Framework and case study. Transp. Policy 2023, 142, 70–83. [Google Scholar]
- Ciauset, A.; Tucker, E.; Sainz, M. The Colorado index of complex networks. Retrieved July 2016, 20, 22. [Google Scholar]
- Shannon, C.E. A mathematical theory of communication. Bell Syst. Tech. J. 1948, 27, 379–423. [Google Scholar]
- Liu, Z.; Lv, B.; Liu, Z.; Li, W.; Fu, X.; Yao, E. Impact of Spatio-Temporal evolution of freeway networks on Socio-Economic Dynamics: A case study from Fujian, China. Transp. Res. Part A Policy Pract. 2025, 198, 104521. [Google Scholar]

Disclaimer/Publisher’s Note: The statements, opinions and data contained in all publications are solely those of the individual author(s) and contributor(s) and not of MDPI and/or the editor(s). MDPI and/or the editor(s) disclaim responsibility for any injury to people or property resulting from any ideas, methods, instructions or products referred to in the content. |
© 2025 by the authors. Licensee MDPI, Basel, Switzerland. This article is an open access article distributed under the terms and conditions of the Creative Commons Attribution (CC BY) license (https://creativecommons.org/licenses/by/4.0/).