Article

Safety Analysis of Partial Downward Fire Evacuation Mode in Underground Metro Stations Based on Integrated Assessment of Harmful Factors

1
School of Architecture and Civil Engineering, Chengdu University, Chengdu 610106, China
2
School of Emergency Management, Chengdu University, Chengdu 610106, China
*
Author to whom correspondence should be addressed.
Systems 2025, 13(7), 549; https://doi.org/10.3390/systems13070549
Submission received: 24 May 2025 / Revised: 30 June 2025 / Accepted: 5 July 2025 / Published: 7 July 2025

Abstract

Underground metro stations are integral to urban transit infrastructure, and ensuring their safety during fire emergencies is crucial. This study proposes a novel evacuation strategy for underground metro stations wherein a segment of evacuees descends to the platform level via train, while the remaining individuals evacuate upward to the ground level through station exits. A novel safety assessment methodology is established to evaluate fire evacuation efficacy, incorporating the cumulative effects of smoke, elevated temperatures, carbon dioxide, and reduced oxygen levels. Employing an actual underground metro station in Guangzhou, China, as a case study, fire and evacuation models were developed to compare the traditional upward evacuation method with the proposed partial downward evacuation strategy. The analysis reveals that both evacuation strategies are effective under the assessed fire scenario. However, the partial downward evacuation is completed more swiftly—in 385.5 s compared to 494.8 s for upward evacuation—thereby mitigating smoke inhalation risks, as the smoke height remains above the critical threshold of 1.8 m for a longer duration than observed in the upward evacuation scenario. Simulations further indicate that neither high temperatures nor carbon monoxide concentrations reach hazardous levels in either evacuation mode, ensuring evacuee safety. The study concludes that, with appropriate training arrangements and under specific fire and evacuation conditions, the partial downward evacuation strategy is safer and more efficient than upward evacuation.

1. Introduction

Most metro stations are built underground to use less land and preserve the urban landscape. To avoid a negative impact on the foundations of existing buildings or to stagger different metro lines spatially, an increasing number of new metro stations and railways are deep-buried [1,2]. When a fire occurs in an underground metro station, especially in a deep-buried station, the smoke spreads upward quickly. Because most metro stations are relatively confined underground spaces with a limited number of exits, in the event of a fire, the exits become smoke discharge channels due to the so-called chimney effect. Figure 1 shows the spread of smoke at one of the exits of Jungangno Station in the Daegu Metro fire of 2003. In this case (in regular evacuation mode), the direction of the spread of the smoke was inconsistent with the direction of the evacuation of people from the station. As research has shown, the vertical spread speed of smoke is 3–5 m/s, which is greater than the average speed at which people can move up through the station to ground level [3]. It is clear, therefore, that in most situations, evacuees are likely to be affected by smoke.
In the event of a fire in a metro station, people are eager to escape and may even panic. With large numbers of people crowding toward a limited number of exits, pushing or even trampling is likely. Moreover, as shown in Figure 2, the direction of smoke spread and the direction of the evacuation may conflict with the firefighters’ entry into the station, creating unfavorable circumstances both for the evacuation and for the work of the fire rescue services.
In regular evacuation mode, smoke affects both passengers and firefighters, and it is therefore necessary to modify or replace that mode. Researchers have considered numerous ways to ensure safe and orderly evacuation: controlling the number of passengers in metro stations, using light and sound to guide passenger flow [4,5], optimizing evacuation paths and guiding schemes [6], and improving a station’s capacity to resist accidents in terms of fire ventilation, lighting, and other conditions [7,8].
The present study proposes a new mode of evacuation in which part of the crowd moves downward to the platform and leaves the station by train, while the rest of the crowd uses the regular evacuation route, moving upward to ground level. The safety of this new mode is evaluated using safety judgment and fire simulation methods.

2. Fire Evacuation Safety Assessment Method

2.1. Fire Evacuation Process

As shown in Figure 3, the fire evacuation process typically involves two key stages: pre-evacuation time Tpre-move and evacuation movement time Tmove. Talarm, detection and alarm time, is the time required for people to notice a fire or for the fire detection equipment to work; Tpre-evacuation includes the time required to confirm that a fire is taking place, Trecognition, and the time required for people to get prepared for evacuation, Tpreparation [9]. The required safe egress time (RSET) refers to the time required for detection, pre-evacuation, and movement, while the available safe egress time (ASET) represents the time until untenable conditions are reached. The RSET is calculated by summing Talarm, Tpre-evacuation, and Tmove. Talarm and Tpre-move are generally estimated using established methods, while Tmove is determined through drills, formulae, or simulations.
The fire site becomes hazardous when the temperature, smoke, and toxic gases lead to conditions such as burns, poisoning, or loss of movement. The available safe egress time (ASET) is the duration before the fire environment reaches such dangerous levels [10].

2.2. Evacuation Safety Judgment Method

The safety of an evacuation is assessed by comparing RSET with ASET, according to Equation (1). When the value of RSET is less than or equal to the value of ASET, people can leave the situation before the situation is classified as dangerous, and the evacuation can be completed safely [11].
RSET ASET

2.3. Factors Affecting Safety

In the event of a fire in an underground metro station, safe evacuation requires various harmful factors to be taken into account, notably the temperature, smoke height, concentration of carbon monoxide (CO), and toxic gases at the fire site, generally, and along the evacuation routes in particular. Research has shown that these factors seriously affect the speed of evacuation [12,13], and their potential impact on the people involved in an evacuation requires in-depth analysis. The present study analyzes the time-related influence of smoke height, high temperature, CO, and low oxygen on the human body, and then uses the results to establish a comprehensive fire evacuation safety judgment method.
(1) Smoke height. When a fire breaks out in a relatively closed space, because the hot smoke is less dense than air, the smoke first gathers at the top of the space and then gradually descends. This is called the ceiling effect [
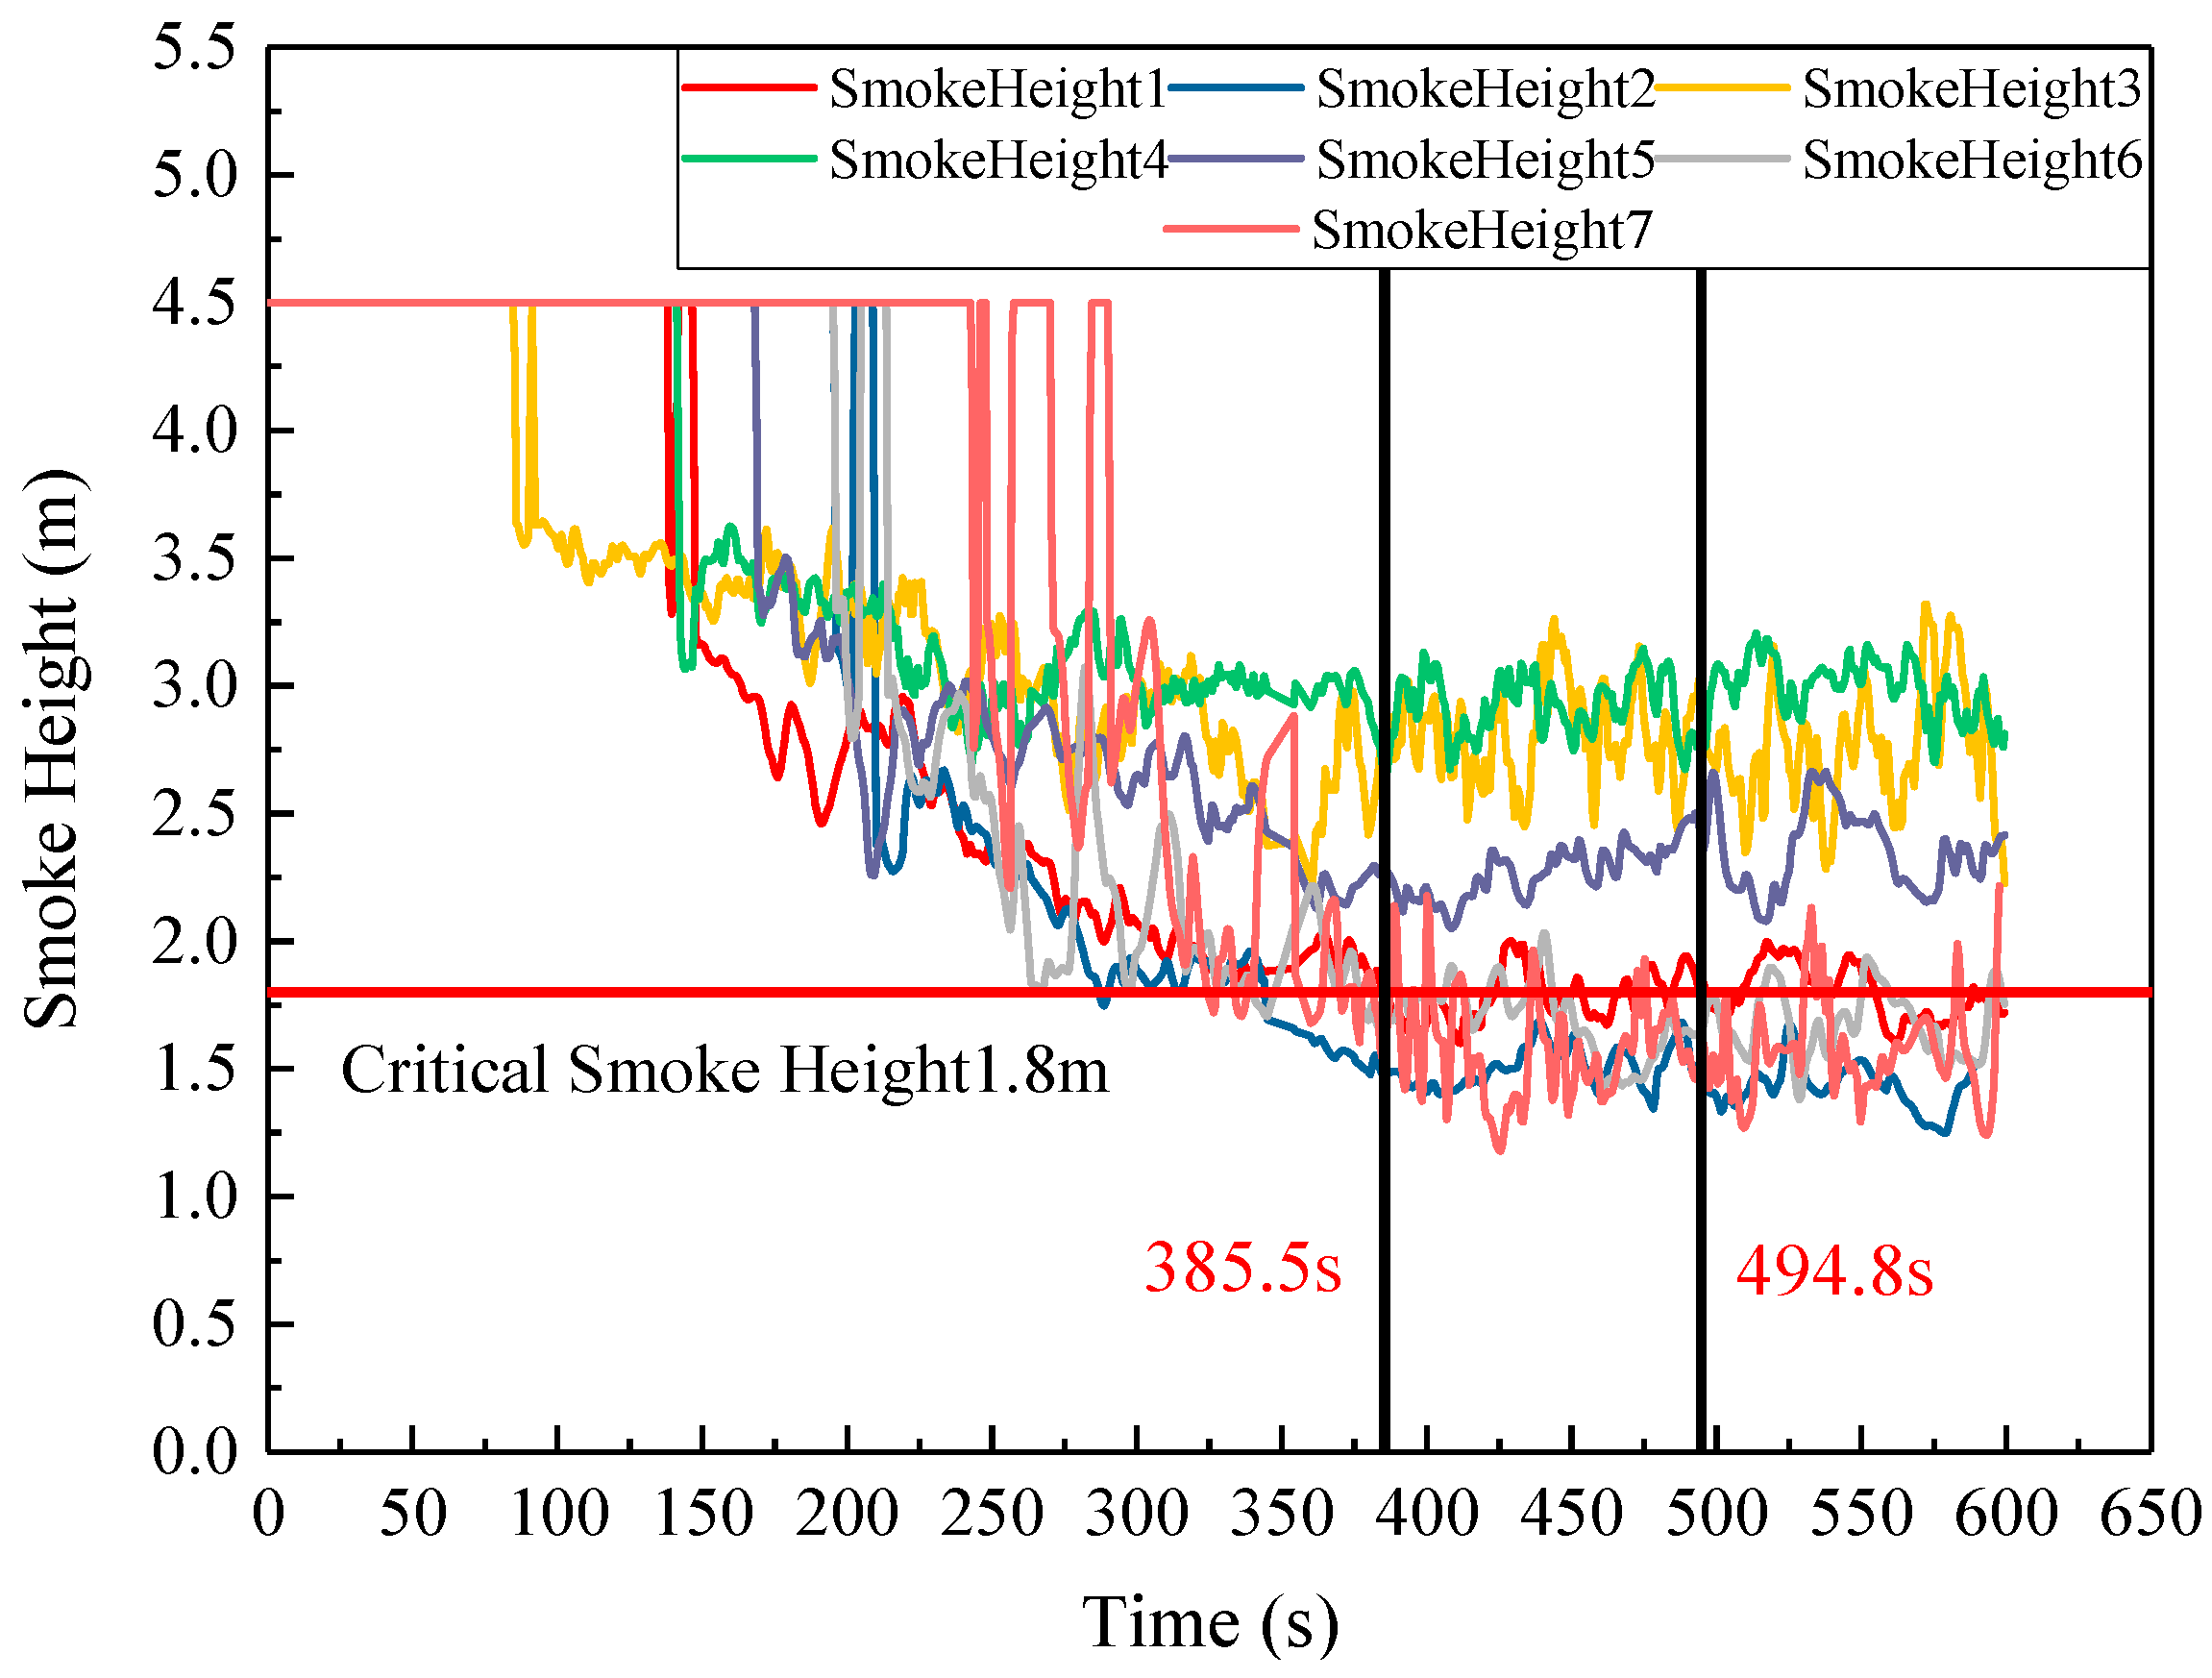
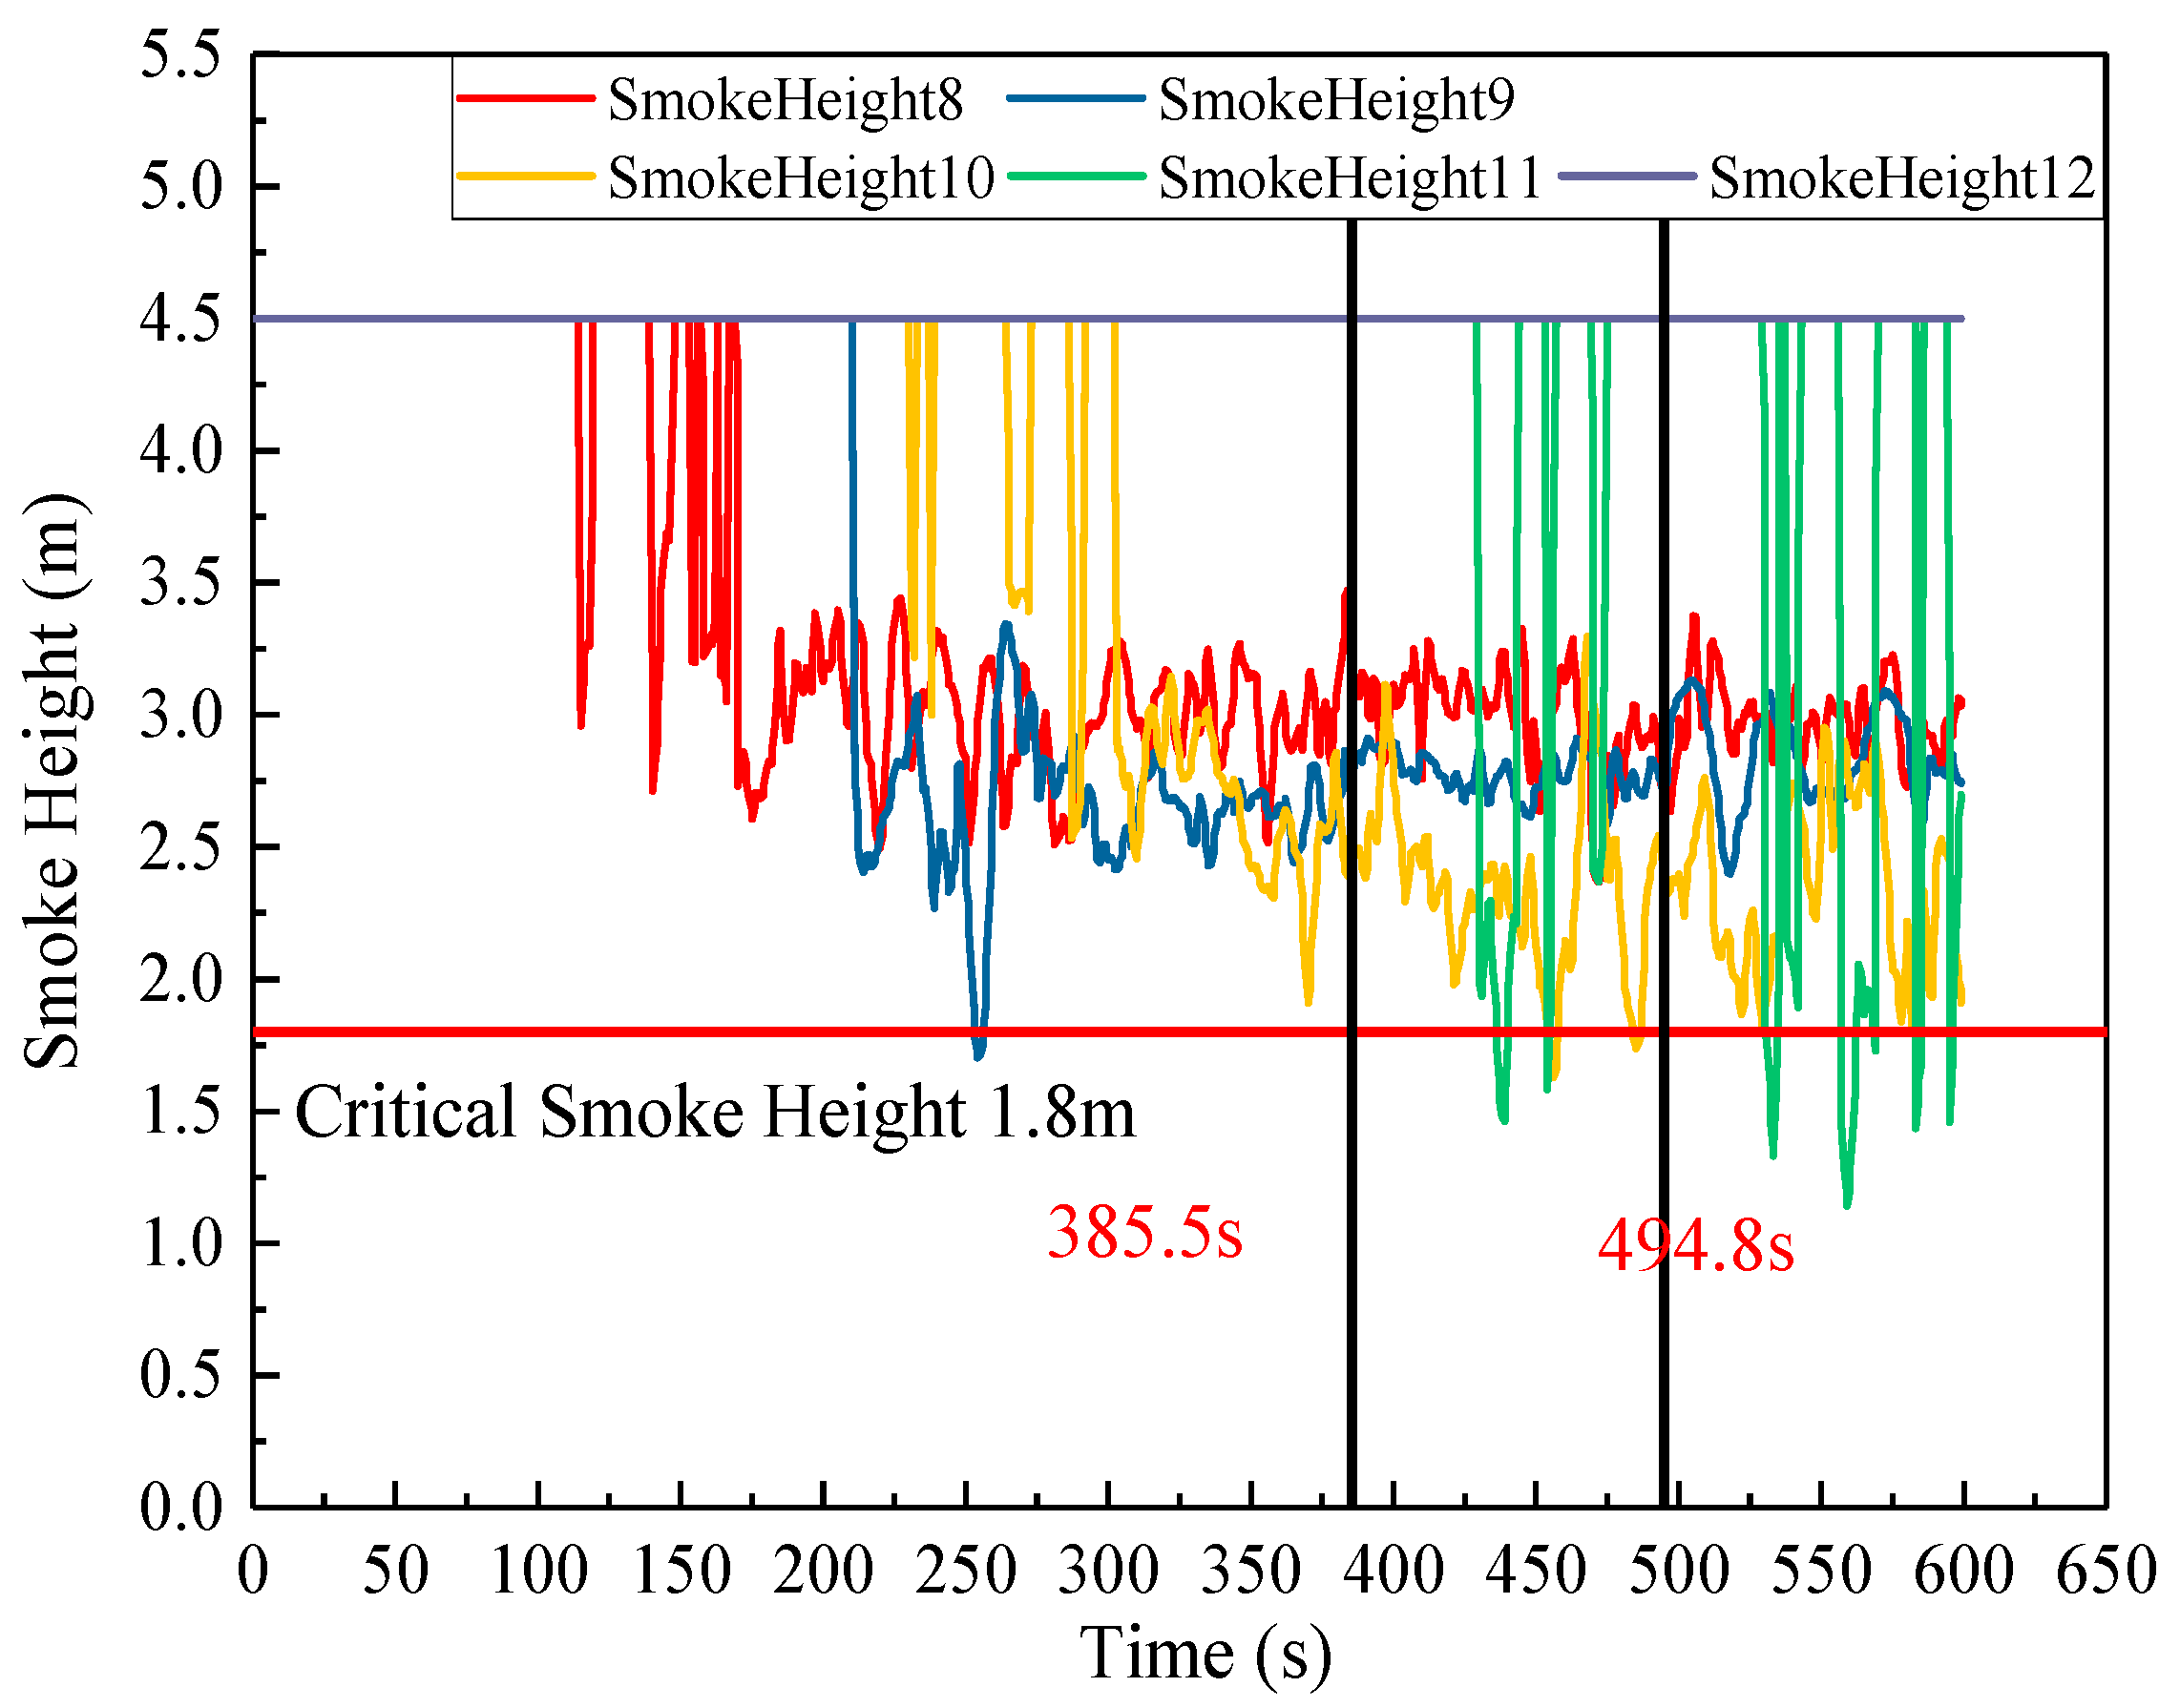
14]. The smoke produced by a fire has a high temperature, and people at the fire site who come into direct contact with the smoke may suffer high-temperature burns, obstructed vision, eye irritation, and other negative consequences. Therefore, only when the smoke remains above a critical safe height is the crowd at the scene of the fire likely to be able to evacuate safely [15,16] (National Fire Protection Association, 2017; International Code Council, 2017). For safe evacuation, the Life Safety Code (NFPA 101) consensus standard stipulates a smoke height greater than 1.8 m. Hence, the critical safe smoke height for the present study is 1.8 m.
The time necessary for the smoke to drop to a critical safe height is referred to as ASET determined by smoke. When ASET determined by smoke is less than RSET, the evacuation can be completed safely without the negative effects of smoke.
(2) Heat. Humans can tolerate a few minutes of ambient radiated heat less than 2.5 kW/m2. At higher levels of radiated heat, skin burns appear in a short time [17]. According to the SFPE Guide to Human Behavior in Fire [18], when the human body is exposed to fire in a moderately humid environment, the time required for heat radiation to cause severe burns or incapacitation is calculated as in Equation (2).
t i n j u r y = 5 10 22 T 11.783 + 3 10 7 T 2.9636
where T is the ambient temperature (°C).
The following three-step method of judging the influence of temperature on evacuation safety is therefore proposed.
Step 1: Determine the value of RSET.
Step 2: By fire test or fire simulation, obtain the average temperature in different zones 0–1 min, 1–2 min, …, (RSET − 1) − RSET, i.e., Taverage(0–1 min), Taverage(1–2),…, Taverage((RSET−1)−RSET). The length of time can be adjusted in practice.
Step 3: Put Taverage(0–1 min), Taverage(1–2),…, Taverage((RSET−1)−RSET) into Equation (2) to obtain the time to severe burns or incapacitations, i.e., tinjure(0–1), tinjure(1–2),…, tinjure((RSET−1)−RSET).
If all values are less than 1 min, the evacuation can be completed safely without the negative effects of temperature.
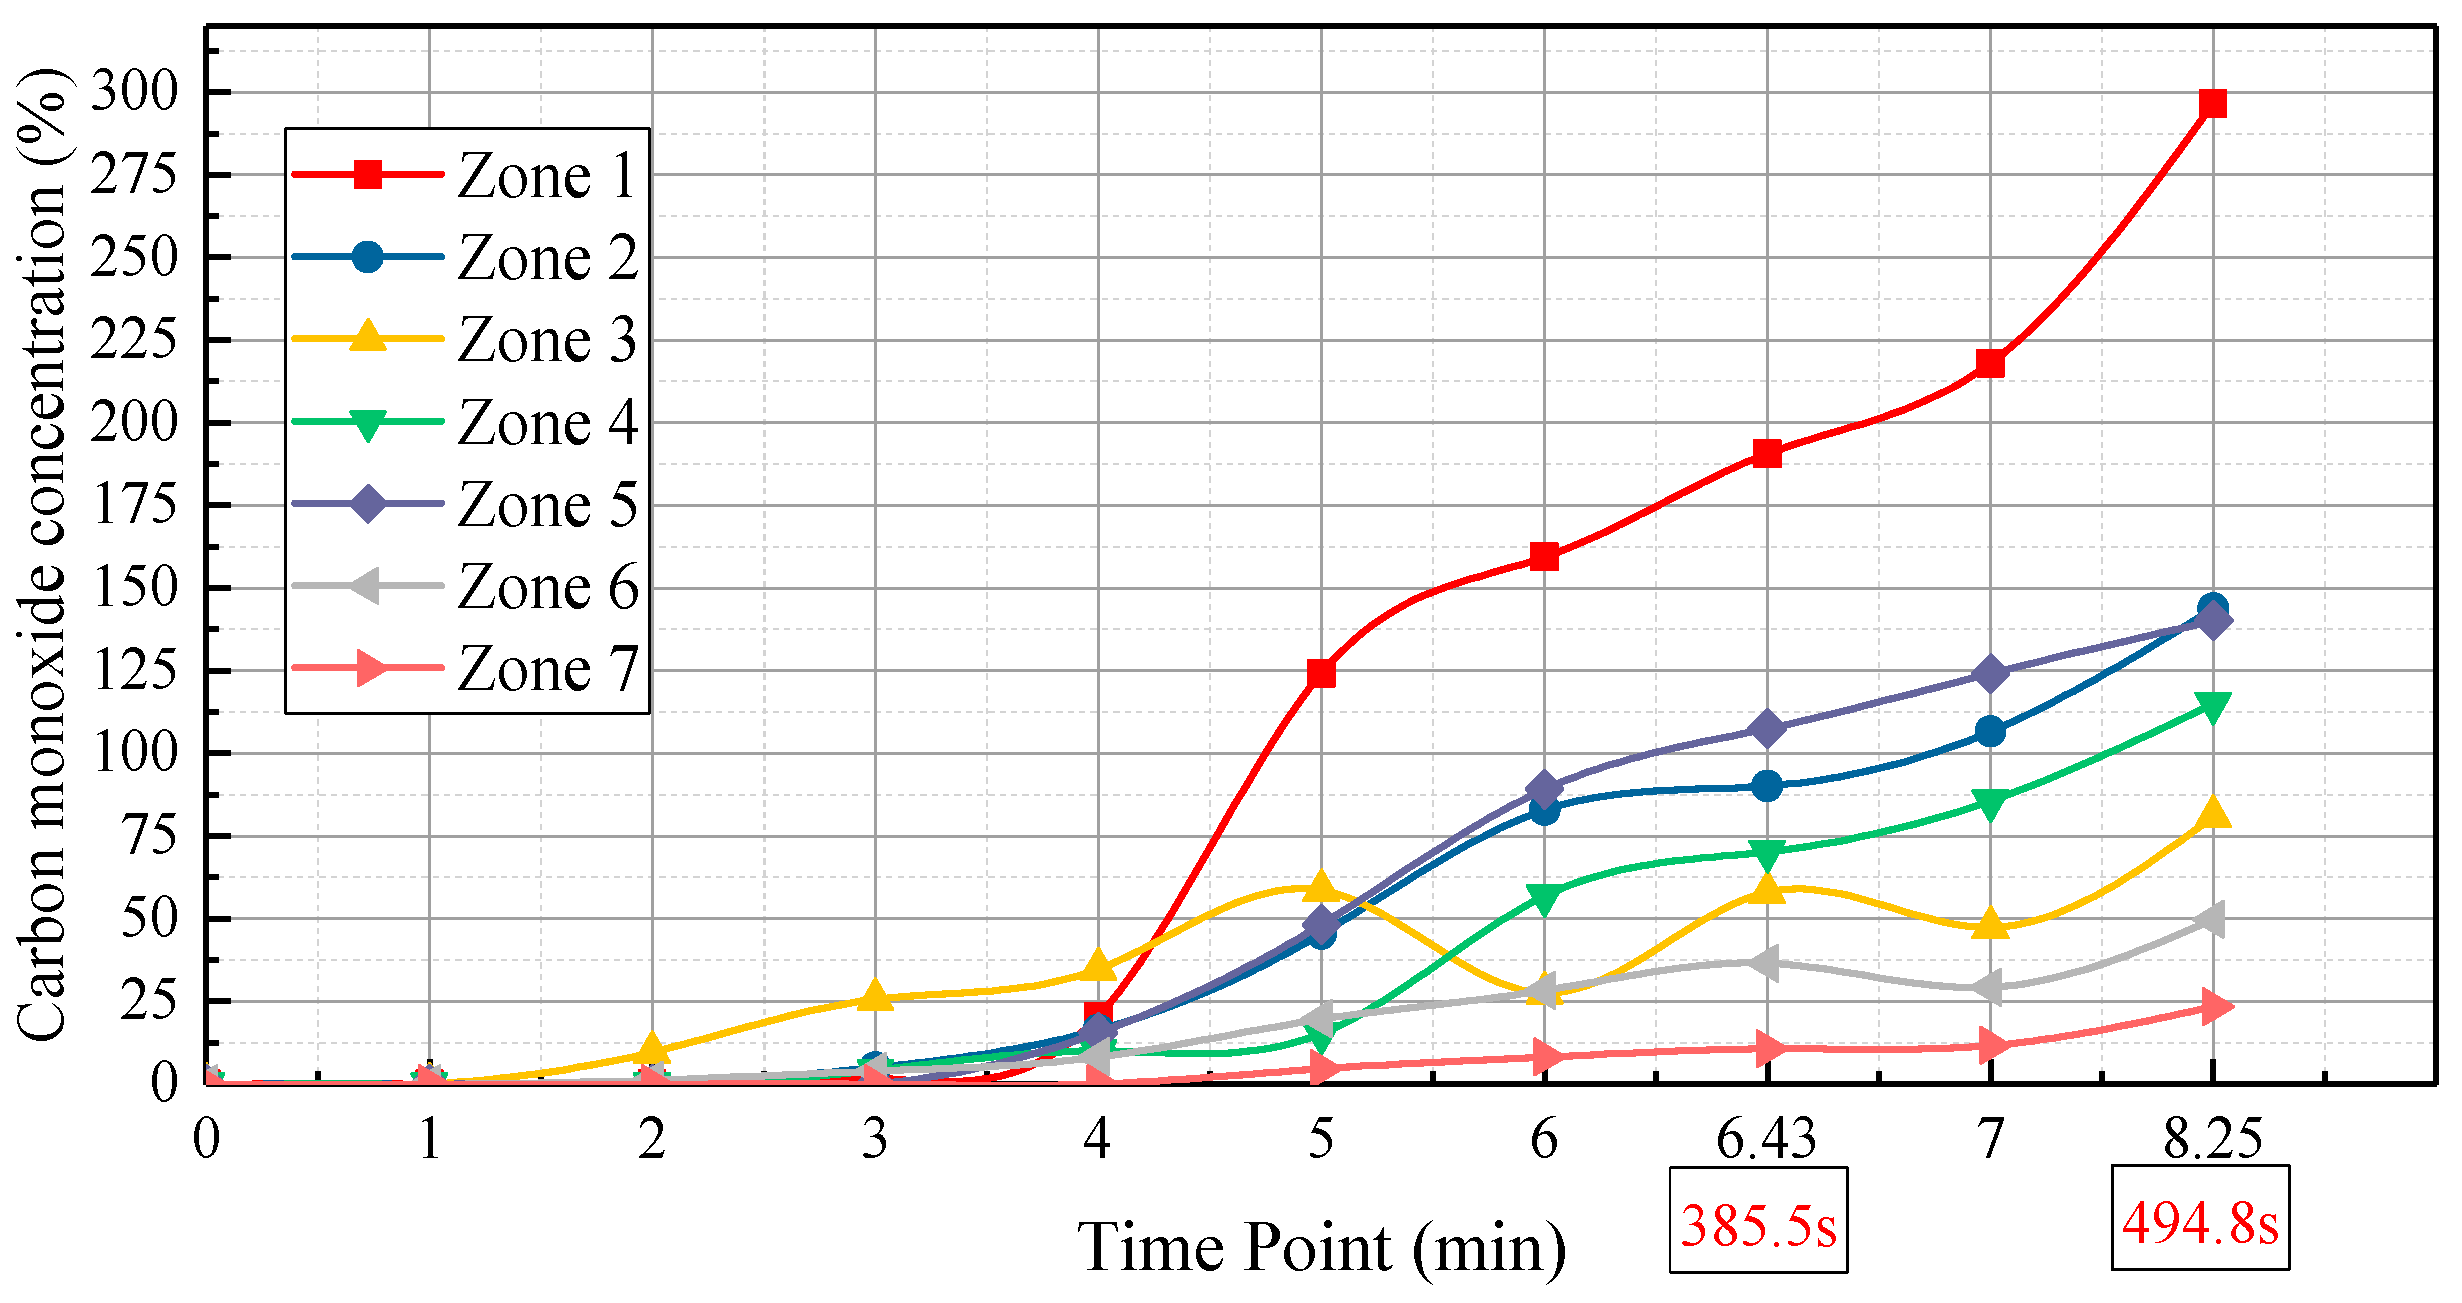
(3) Carbon monoxide. CO produced by the insufficient combustion of carbon-containing substances is very common in fires and is one of the most harmful poisonous gases to evacuees [19]. CO binds with hemoglobin in the blood to form carboxyhemoglobin (COHb), which reduces the binding of hemoglobin with oxygen and leads to insufficient oxygen in the blood. Lack of oxygen in the blood is detrimental to oxygen supply to brain tissue and can lead to coma, confusion, loss of consciousness, and even death [20]. Studies on humans and animals have established 30% as the safety-critical concentration of COHb in human blood [21,22,23,24,25].
According to the SFPE Guide to Human Behavior in Fire, for people exposed to air at a constant concentration of CO, the concentration of COHb in the blood can be calculated using what is known as the Stewart equation:
% COHb = 3.317 10 5 p p m C O 1.036 V E t
where % COHb denotes the accumulated concentration of COHb in the blood, ppmCO is the concentration of CO in the environment, and V E is the respiratory rate (L/min). For humans at rest or asleep, V E   = 8.5; when walking, V E   = 25; during strenuous exercises, such as jogging or climbing stairs, V E = 50. t denotes the duration of exposure (in minutes).
Equation (3) applies when the concentration of CO in the air remains constant. At a fire site, however, the concentration of CO tends to change over time. Thus, the following four-step modification to Equation (3) is required to form a CO safety judgment:
Step 1: Determine the value of RSET.
Step 2: Obtain the CO concentration curve during 0 − RSET through a fire test or fire simulation.
Step 3: Obtain the change function of CO concentration during 0 − RSET, p p m C O 0 R S E T through data fitting.
Step 4: Put p p m C O 0 R S E T into Equation (3) and then integrate in time to obtain the accumulated concentration of COHb in blood:
% COHb | 0 R S E T = 0 R S E T 3.317 10 5 p p m C O 0 R S E T 1.036 V E d t
If % COHb | 0 R S E T is less than 30%, the evacuation can be completed safely without the negative effects of CO.
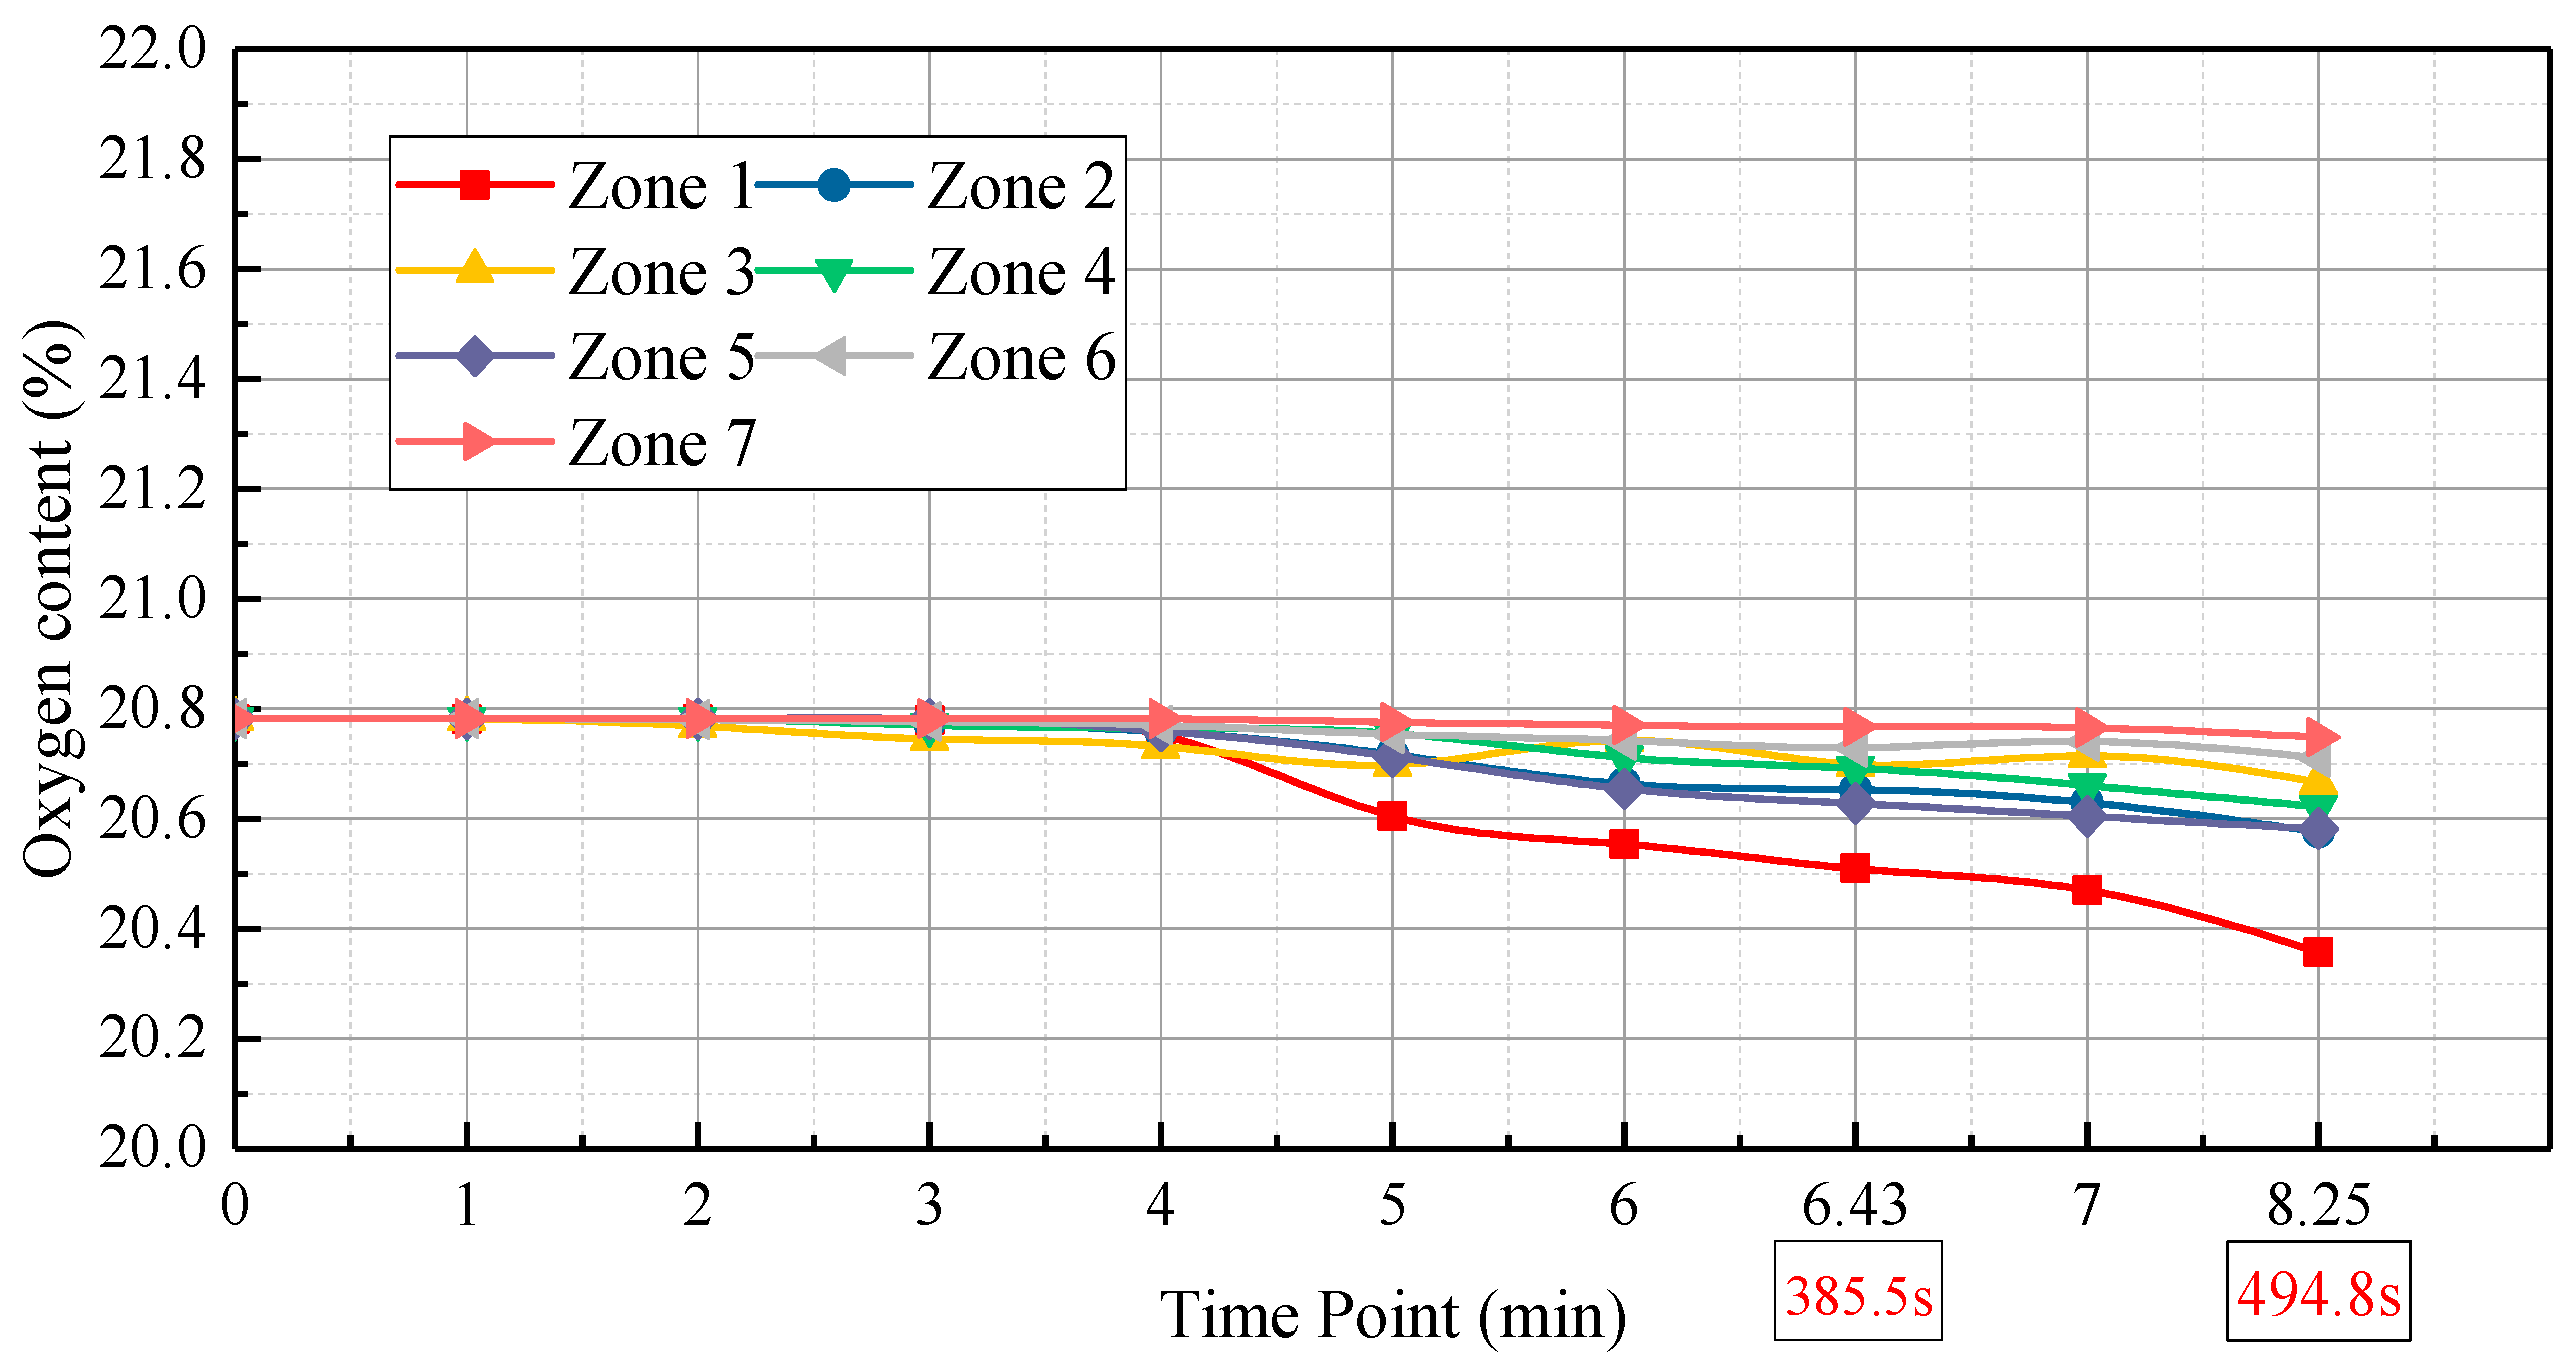
(4) Low oxygen. Low levels of oxygen at the fire site can cause a lack of oxygen in the human brain and may affect people’s ability to evacuate. When oxygen content drops below 10%, thinking and judgment are significantly affected; when it drops below 6%, there is a possibility of suffocation and death. Ref. [26] proposed the use of Equation (5) to calculate the time to unconsciousness or incapacitation in people exposed to constant hypoxia [27]:
t I 0 = e x p 9.13 0.54 20.9 % O 2
where % O 2 denotes the ambient oxygen content.
Equation (5) applies when the oxygen content in the environment is constantly low. At a fire site, however, the oxygen content tends to change over time. Thus, the following three-step modification to Equation (5) is required to form an oxygen safety judgment:
Step 1: Determine the value of RSET.
Step 2: Obtain the average oxygen content in different zones at 0–1 min, 1–2 min,…, (RSET − 1) − RSET, i.e., %O2average(0–1 min), %O2average(1–2),…, %O2average((RSET−1)−RSET) through a fire test or fire simulation. The length of time can be adjusted in practice.
Step 3: Put %O2average(0–1 min), %O2average(1–2),…, %O2average((RSET−1)−RSET) into Equation (5) to obtain the time to severe burns or incapacitation, i.e., t I 0 0 1 , t I 0 1 2 …, t I 0 R S E T 1 R S E T . If the time values are all less than 1 min, the evacuation can be completed safely without the negative effects of low oxygen.

2.4. Safety Judgment with Harmful Factors Integrated

Although each harmful factor is assessed independently, the final safety judgment considers the integrated outcome of all factors, ensuring that evacuation is only deemed safe when all criteria are simultaneously satisfied. Table 1 sets out the safety judgment method for fire evacuation derived from the considerations above. Smoke height, heat, CO, and low oxygen must be taken into account; only when all four criteria are satisfied can an evacuation be completed safely.
A review of the literature indicates that existing methods assess individual factors affecting evacuation safety. Although physical models integrating fire hazards exist, there remains a lack of dynamic, simulation-based evacuation assessment models that holistically evaluate smoke height, temperature, CO, and oxygen depletion in complex underground spaces. This article addresses this gap by developing a unified safety assessment approach that considers smoke height, heat, CO levels, and oxygen depletion, thereby offering a more holistic evaluation of evacuation safety in underground metro stations.
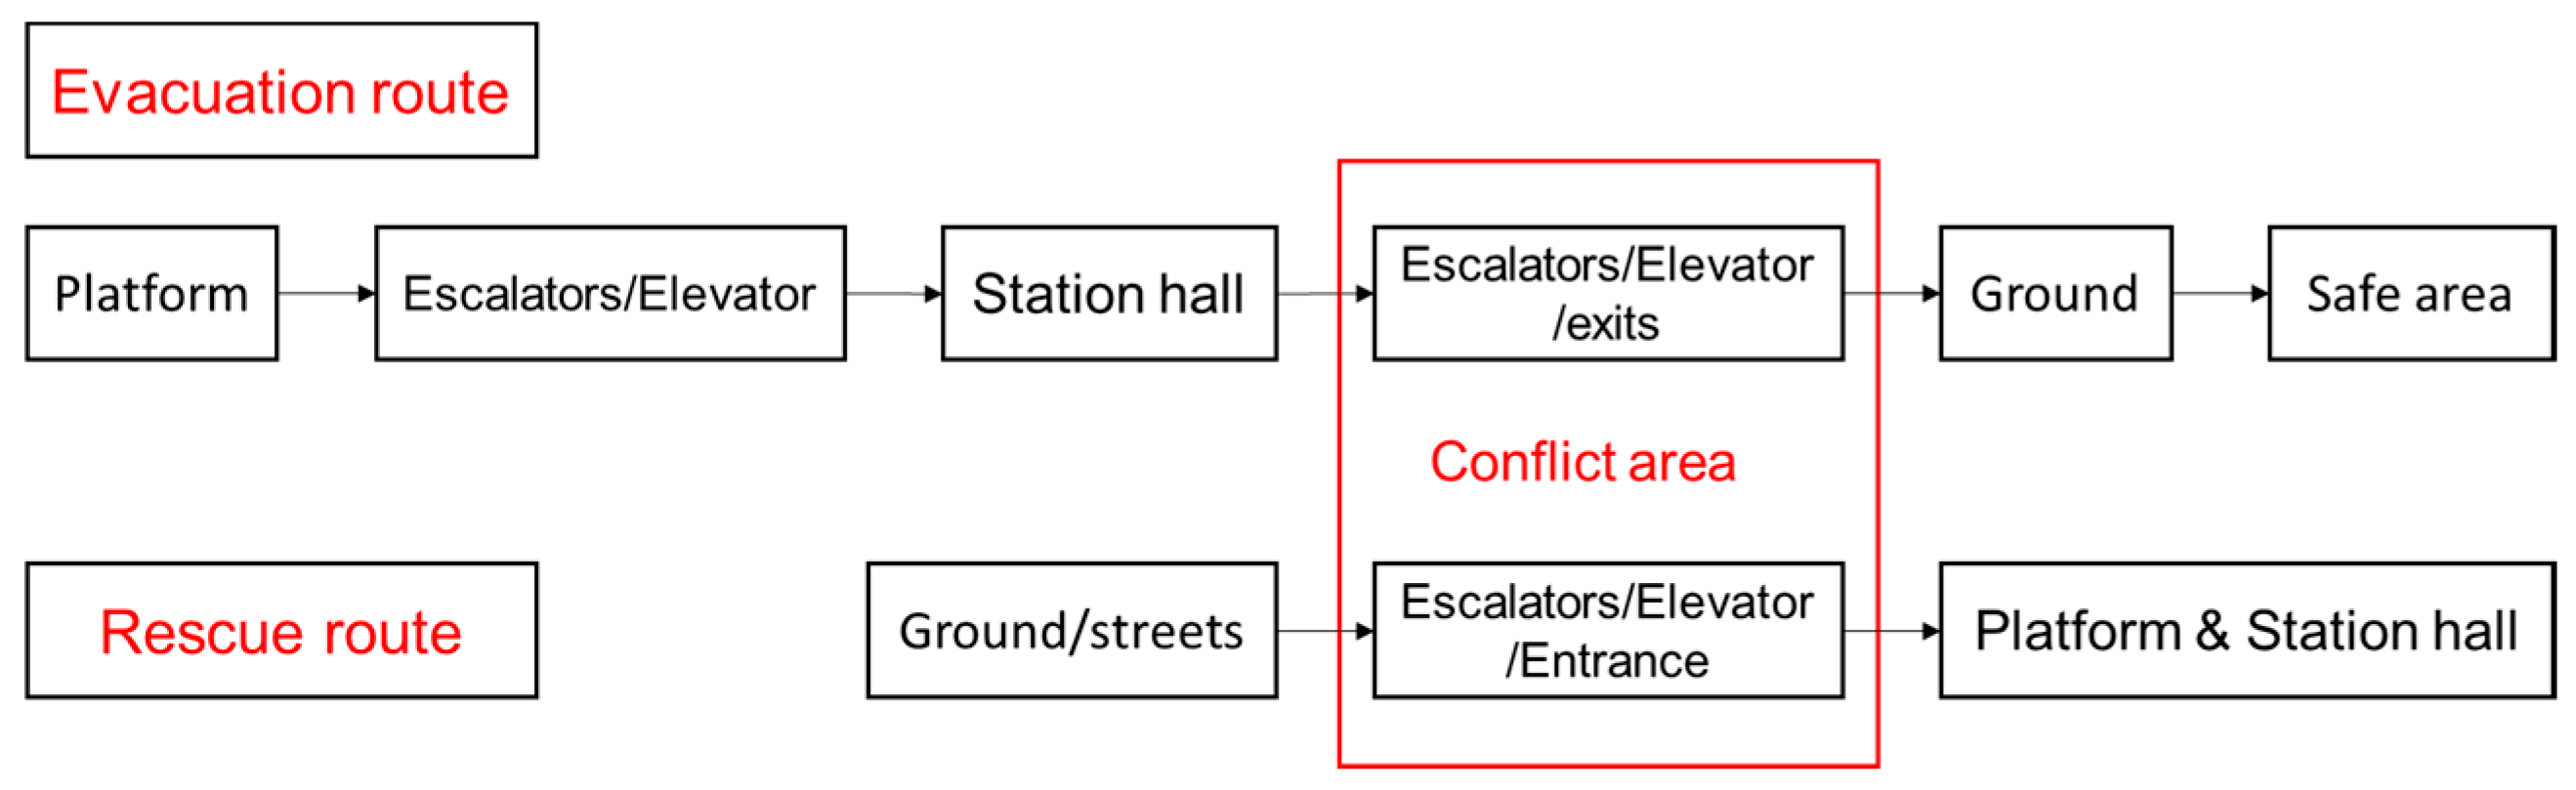
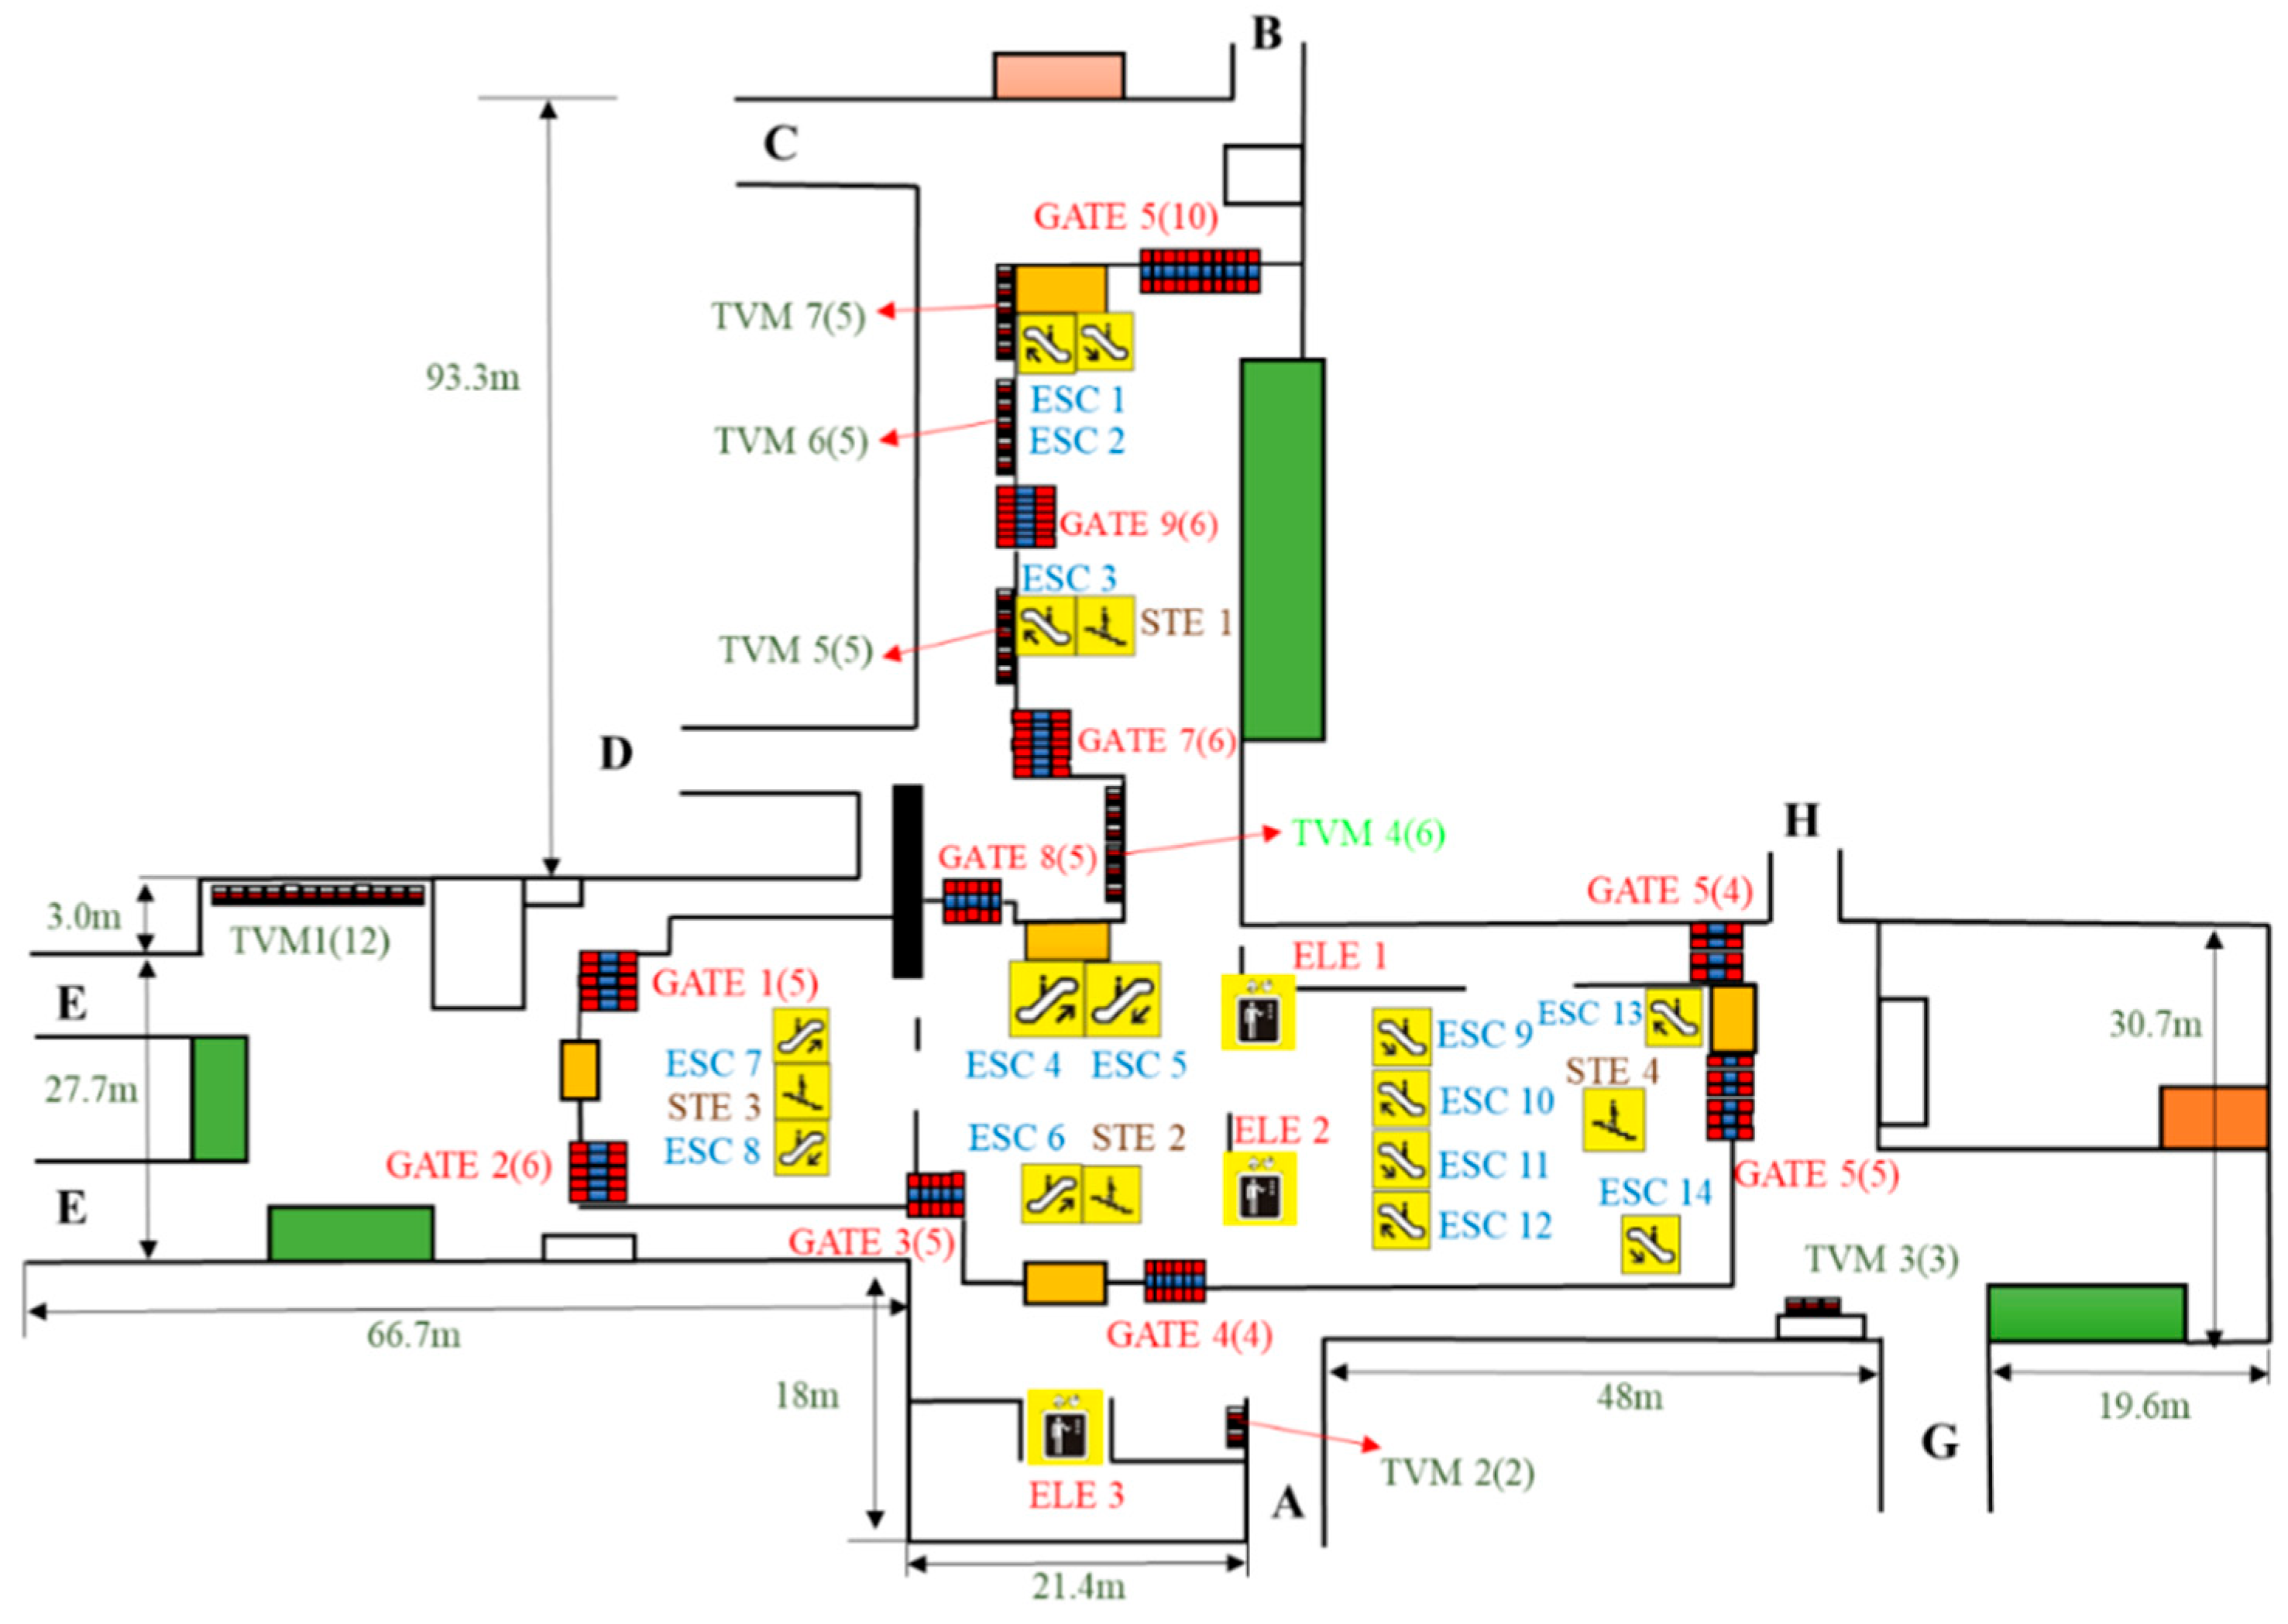
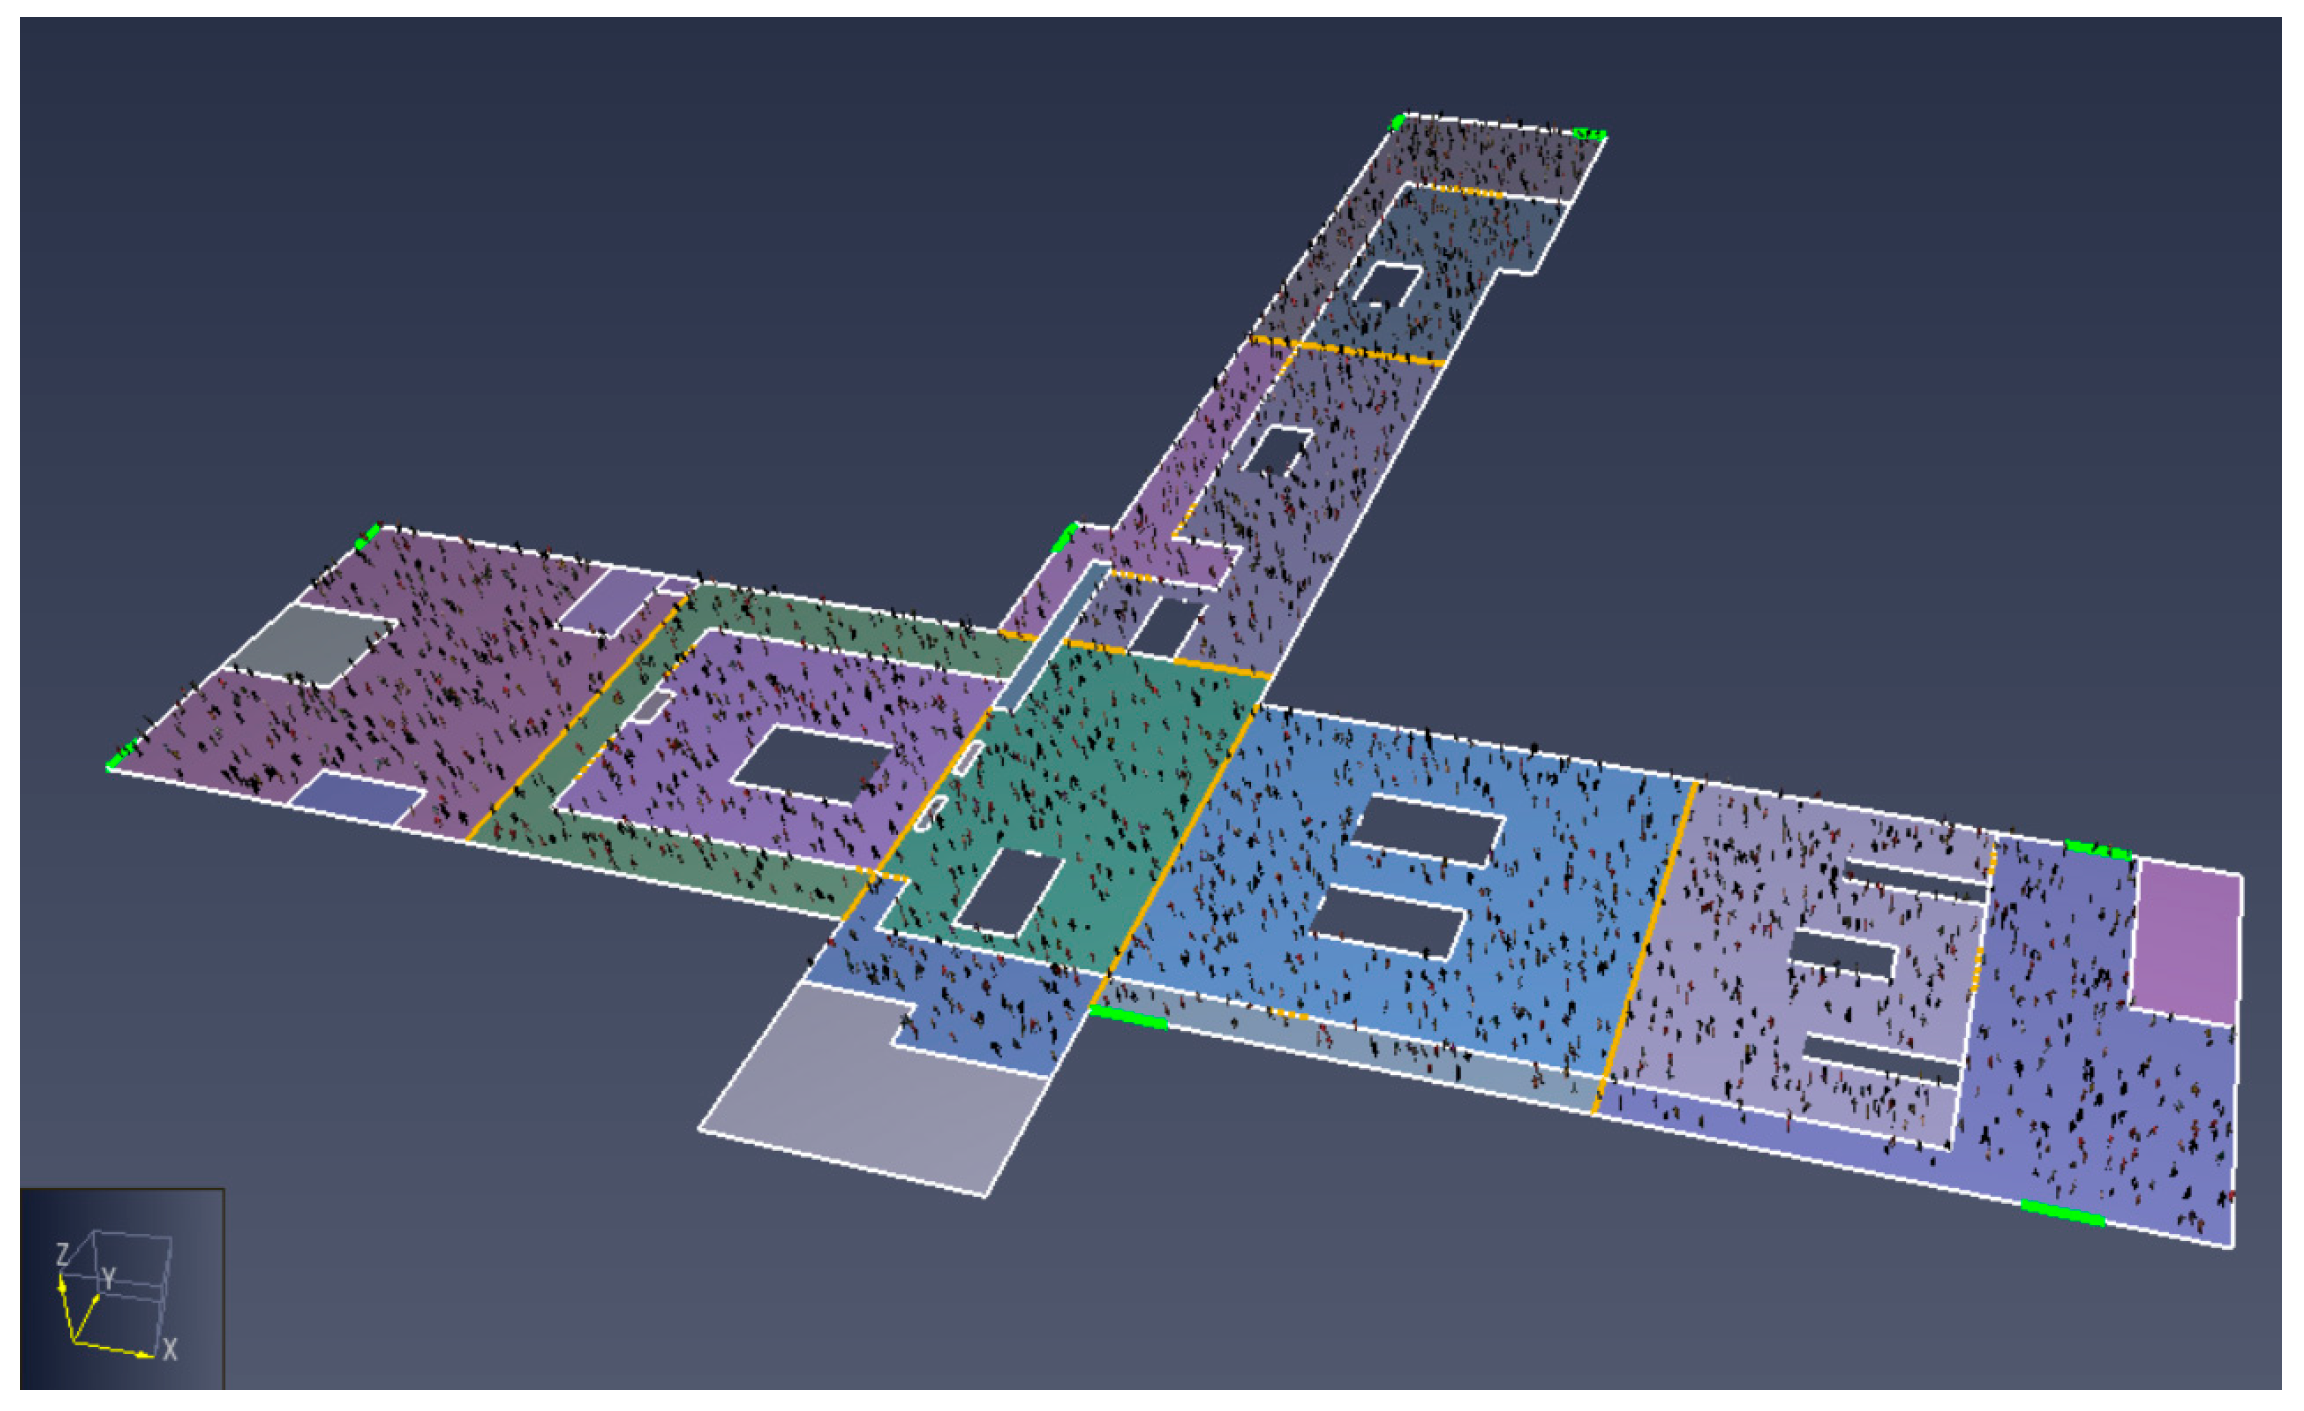
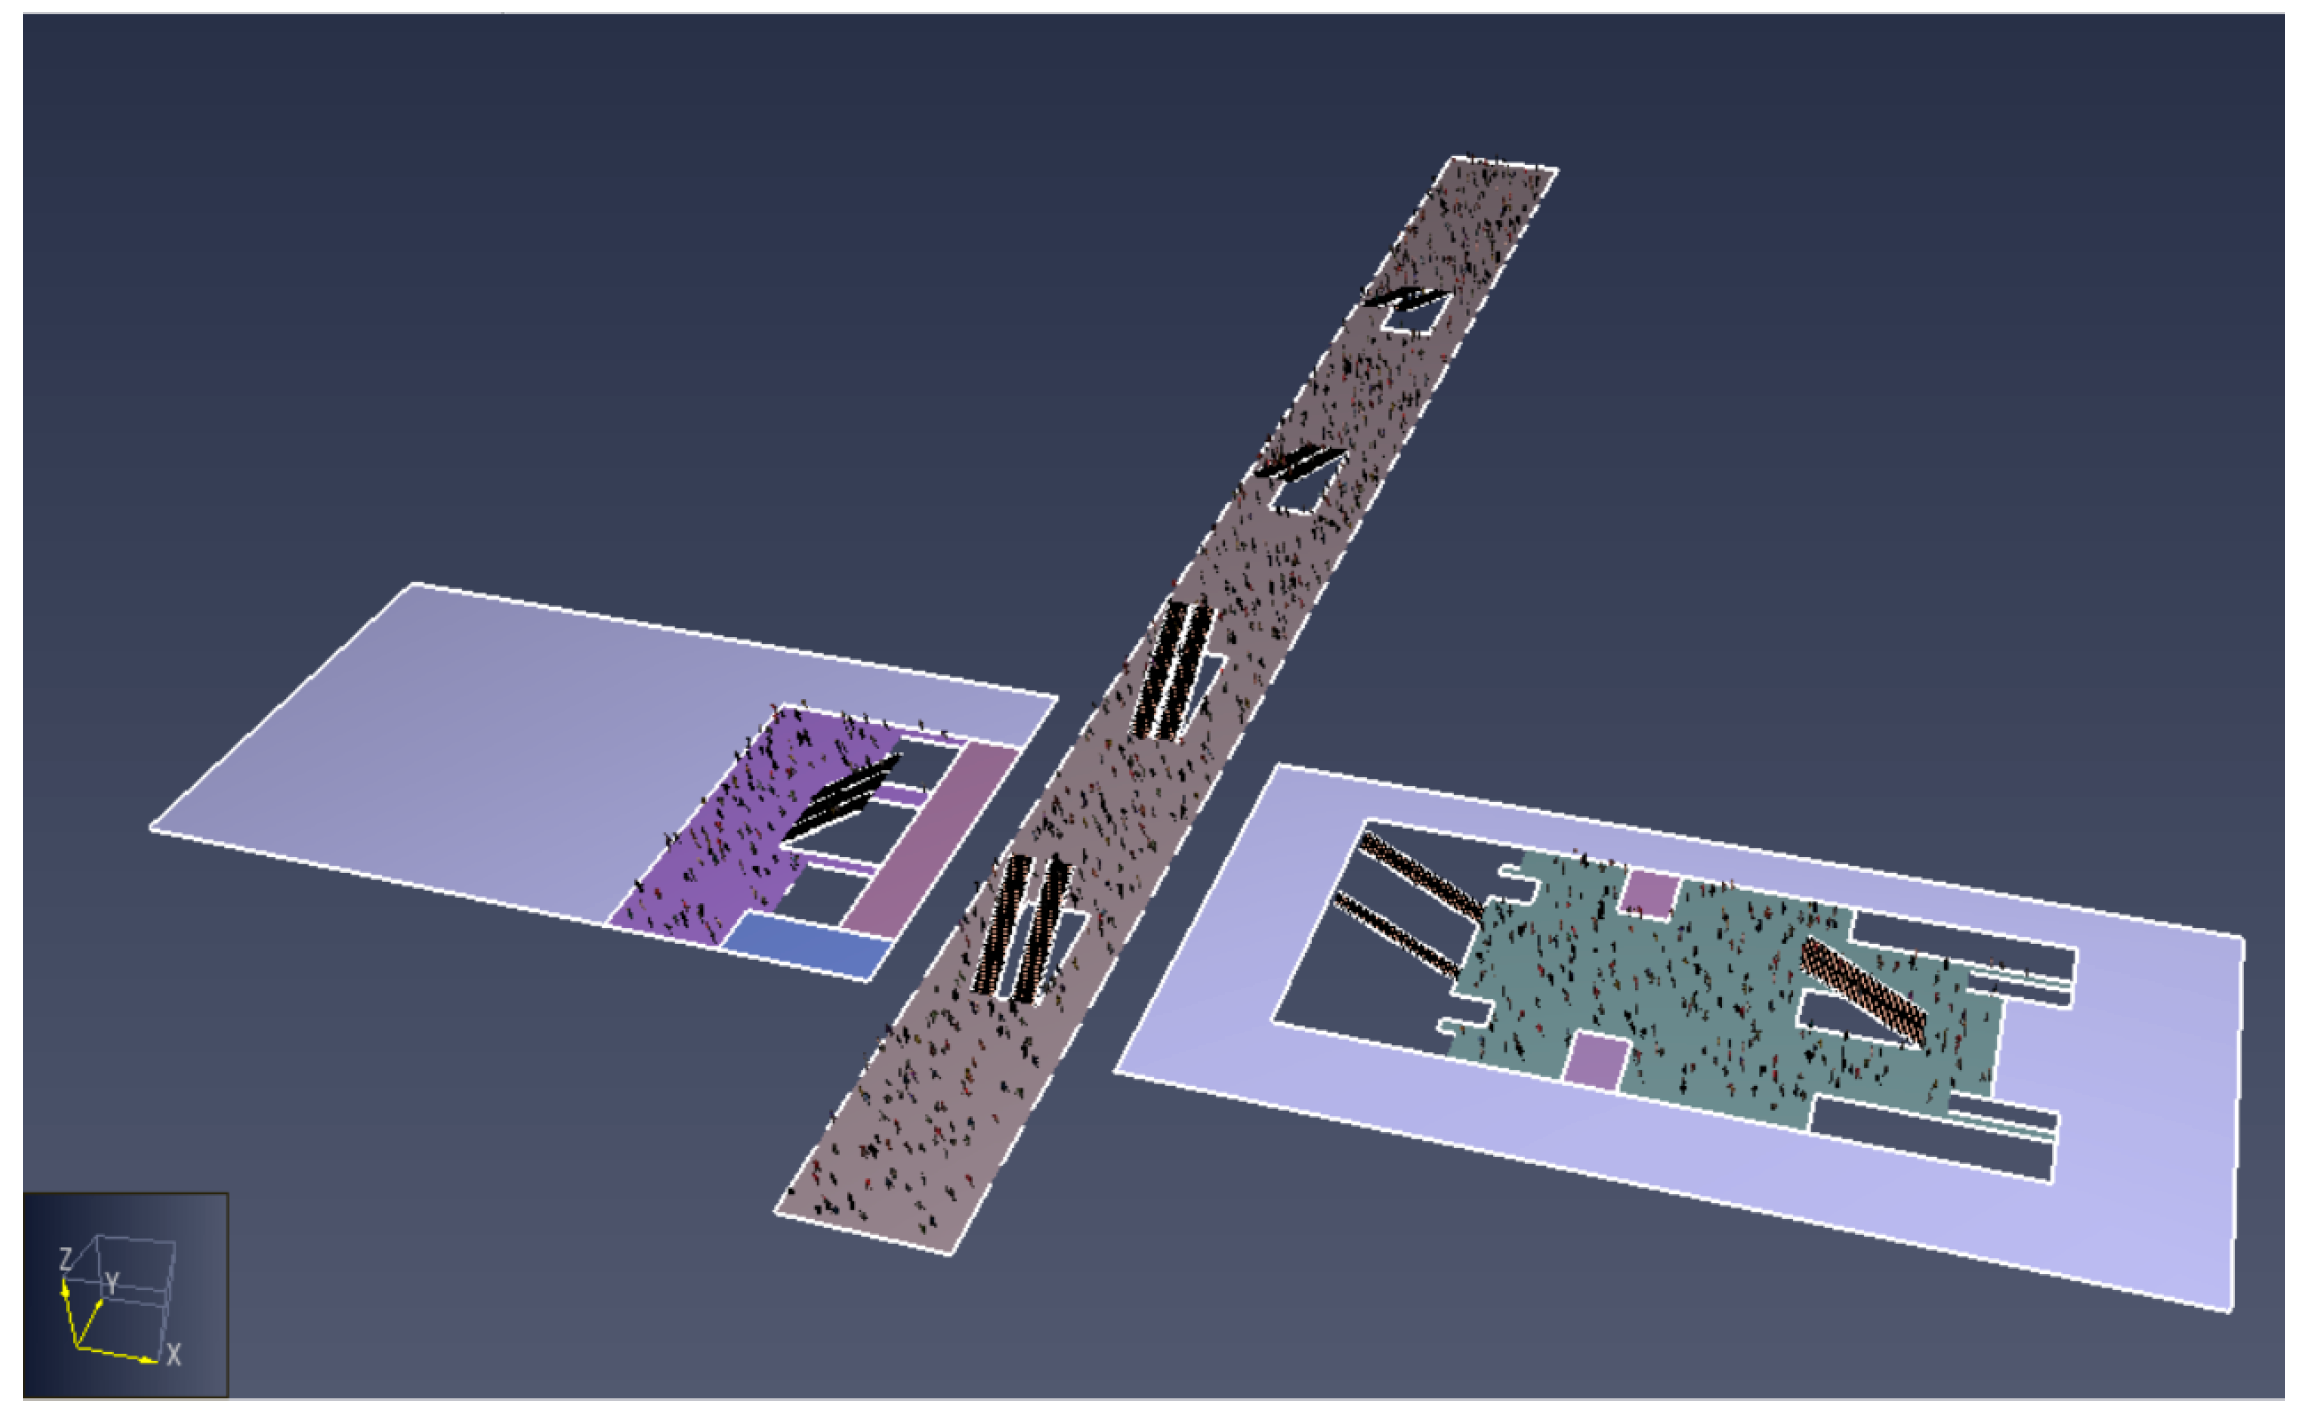
Following the safety assessment method proposed, a case study is presented to validate the proposed approach in a practical context. The case study involves an underground metro station in Guangzhou, China, which serves as a real-world testbed for applying and refining the integrated safety evaluation model. This case study is crucial as it provides empirical data to assess the effectiveness of the proposed evacuation strategies and safety criteria in an actual fire scenario. By analyzing specific factors such as smoke behavior, temperature variations, CO concentrations, and oxygen levels within this operational environment, the case study demonstrates the applicability and reliability of the theoretical model. It also highlights any potential limitations and areas for further refinement, ensuring that the safety assessment method is both practical and robust for real-world applications.

3. Fire and Evacuation Model for a Metro Station

3.1. Evacuation Simulation Software

This study employs PyroSim (2024.1 (Build 2401)) and Pathfinder (2024.1 (Build 2401)) to simulate fire dynamics and evacuation processes, respectively. PyroSim, based on the Fire Dynamics Simulator (FDS), enables detailed modeling of smoke spread, heat transfer, and toxic gas distribution in complex underground spaces. Pathfinder is an agent-based evacuation simulation tool that supports the analysis of individual movement, congestion, and evacuation strategies under emergency conditions. These two types of software were chosen for their reliability and wide use in metro fire safety research, allowing for a comprehensive and integrated safety assessment.

3.2. Structure of the Metro Station

The metro station under study is an underground interchange station for Lines 1 and 3 in Guangzhou, China. Table 2 summarizes its structure. The station halls for Lines 1 and 2 are located on the first layer underground, and they are connected. The platforms for Lines 1 and 3 are located on the second and fourth layers underground. The third layer underground contains mezzanines #1 and #2, which connect the platform and station hall of Line 3.
Figure 4 shows the connected station halls. The station hall of Line 1 has three entrances/exits: B (4.0 m wide), C (4.0 m wide), and D (4.0 m wide). The station hall of Line 3 has four entrances/exits: A (6.0 m wide), E (6.0 m wide), G (5.3 m wide), and H (5.0 m wide). TVM denotes a ticket vending machine, GATE means a gate machine, ESC an escalator, STE a set of steps, and E an elevator; the figures in brackets indicate how many facilities are present in the location.

3.3. Specification of the Fire Model

In the case study, PyroSim is selected for constructing the simulation model due to its advanced capabilities in fire dynamics and evacuation modeling. PyroSim offers detailed fire and smoke simulations and precise control over parameters, making it ideal for analyzing complex interactions in enclosed environments like underground metro stations. Its robustness ensures accurate replication of fire scenarios and effective evaluation of the proposed safety assessment methods, thus providing valuable insights into the practicality and efficacy of the evacuation strategies being tested.
The geometric model of the metro station matches the actual size and layout. Separation walls are included, whereas facilities such as handrails and fences that have no significant barrier effect on the spread of smoke are ignored. Figure 5 depicts the geometric models.

3.3.1. Fire Scenario

The fire source is located at the center of the station hall for Lines 1 and 3. The maximum heat release rate (HRR) of the fire source is set to 8.0 MW. The selected 8 MW HRR corresponds to a plausible severe fire involving combustible personal items such as polyurethane-filled luggage, plastic suitcases, rubber soles, and synthetic clothing. Polyurethane foam alone can yield peak HRR values exceeding 1000 kW/m2. Pile-up and radiative feedback effects in a confined space can lead to a combined HRR of 6 to 10 MW. The HRR of the fire source is set to a very fast growth rate and conforms to the t2 growth model; the growth coefficient α is 0.1878, and the HRR of the fire source reaches a stable level of 206.39 s after the fire begins.
Smoke exhaust systems are installed in the station halls and platforms, and the vents are located on the ceilings. There are 64 vents in the station halls for Lines 1 and 3, and the exhaust capacity of each vent is 1.125 m3/s. Vents are also installed on the platform ceilings of Lines 1 and 3. The smoke exhaust systems in the station halls begin to operate 30 s after the fire breaks out in the station hall, whereas those on the platform ceilings are not active. The airflow speed is set to 0 m/s, the temperature to 20 °C, and the visibility inside the station to 30 m. When the fire breaks out, the elevator is out of service, but the stationary escalators can be used as staircases.

3.3.2. Layout of Measuring Points

The locations of measurement points were selected based on their proximity to critical evacuation routes, potential smoke accumulation zones, and the fire source. Figure 6 shows the layout of the smoke height measuring points that allow changes in smoke height in different areas of the station hall to be monitored.
The connected station halls are divided into five zones, as shown in Figure 7. A series of measuring points for temperature, CO content, and oxygen content are arranged evenly over each area in the quantities shown in the figure.
This study employs a zonal safety assessment approach to evaluate tenability criteria (Table 1). While occupants move between zones during evacuation, dynamically modeling individual cumulative exposure to hazards (e.g., CO, heat) across spatially heterogeneous environments presents significant computational and practical challenges. Instead, we adopt a conservative paradigm: if all zones maintain conditions where an evacuee could theoretically remain stationary in the highest-hazard zone for the full RSET duration without exceeding critical thresholds, then actual transient exposure during movement—which typically involves lower cumulative doses—will inherently satisfy safety criteria.

3.4. Specification of the Evacuation Model

3.4.1. Crowd Parameters

After the geometric model of the metro station is established, the next step is to determine the composition and density of the crowd in the station. Table 3 sets out the parameters used. The age distribution is based on onsite observation and local metro passenger demographic reports.
According to the onsite survey, the average crowd density of the metro station during peak hours is about 2.78 m2/person. Therefore, the crowd density of each area of the station is set to that value. Figure 8, Figure 9 and Figure 10 show the distribution of the crowd in different areas of the station model. The total number of people to be evacuated is 4600 (2075 from the station hall and 2525 from other areas).

3.4.2. Evacuation Modes

The first evacuation mode is upward evacuation. When the fire breaks out, the people on the platform for Lines 1 and 3 and mezzanines #1 and #2 will move upward to the station halls. Together with the people already in the station halls, they evacuate through the exits, as shown in Figure 11.
The second evacuation mode is partial downward evacuation. When the fire breaks out, the people in the station hall of Lines 1 and 3 leave through exits A–H. People in other areas (including on the steps, escalators, mezzanines, and platforms) use the nearest staircases or stationary escalators to reach the platforms of Lines 1 and 3, and then leave by train.
The second evacuation model assumes that train access remains operational throughout the scenario. This includes uninterrupted power supply and smoke-free tunnels. In real fire situations, factors such as smoke backflow into tunnels or traction power failure could compromise the feasibility of deploying trains for evacuation. These limitations are acknowledged and warrant further operational risk assessment.

3.4.3. Calculated Evacuation Models

The evacuation movement time Tmove can be determined after the evacuation models are calculated, and Talarm can be determined using the relevant standards [28,29]. Accordingly, in the present study, Talarm = 75 s and Tpre-evacuation = 60 s.
In the partial downward evacuation mode, the length of time between the crowd arriving at the platform and boarding the evacuation train must be taken into account. In line with suggestions from station operators, the train waiting time is set to 120 s. Table 4 shows how the RSET values for both evacuation modes are determined. For the upward evacuation mode, RSETupward = 494.8 s, whereas for the partial downward evacuation mode, RSETdownward = 385.5 s.

4. Discussions

4.1. Smoke Height

Figure 12 shows the changes in smoke height in the station hall of Line 3. The smoke heights at seven of the measuring points dropped after the initial outbreak. At 385.5 s from the outbreak of the fire (corresponding to the RSET value for the partial downward evacuation mode), the smoke height at measuring point 2 is below the critical safety height, whereas the smoke height at other points is greater than 1.8 m. When partial downward evacuation is applied, the smoke height at measuring point 2 remains below 1.8 m for approximately 30 s. At 494.8 s into the fire (corresponding to the RSET value for the upward evacuation mode), the smoke height at measuring points 1, 2, 6, and 7 is less than 1.8 m for approximately 150 s.
In general, during the whole evacuation process of these two modes, the proportion of time that the smoke height remains above the critical safety height is greater in the partial downward evacuation mode compared to the upward evacuation mode. These results indicate the improved tenability of smoke height in the partial downward evacuation mode. In other words, when the partial downward evacuation mode is applied, the crowd in the station hall of Line 3 is less affected by the smoke.
Figure 13 shows the changes in smoke height at each measuring point in the Line 1 station hall. At both 385.5 s and 494.8 s from the outbreak of the fire, the smoke height is above the critical safety height, with a few exceptions.
In general, in the scenario under study, a partial downward evacuation can be completed in a shorter time than an upward evacuation, with the crowd less affected by the smoke.

4.2. Heat

Figure 14 shows the average temperatures in each area of the metro station in the minutes after the outbreak of the fire.
Table 5 and Table 6 give the heat safety judgments for the partial downward and upward evacuation modes. After the fire breaks out, the highest average temperatures appear at 6–6.43 min and 7–8.25 min; the times to loss of movement ability corresponding to the average temperature of each region are all greater than 0.43 min and 1.25 min, respectively. Similar results are obtained for 0–1 min, 1–2 min, 2–3 min, 3–4 min, 4–5 min, and 5–6 min, indicating that in both evacuation modes, there are no serious burns or loss of movement ability due to the influence of high temperature.

4.3. Carbon Monoxide

Figure 15 shows the average CO concentrations in each area of the station hall. Curve fitting is used to obtain the CO concentration growth function ppmCO for each area. The growth function is then substituted into Equation (5) to perform integral calculations over time, thereby obtaining the accumulation of COHb during the period after the fire breaks out.
The accumulation of COHb at 0–6.43 min is obtained through the calculation in Section 3.3, and the results are listed in Table 7. Zones 1 and 3 have the highest accumulated levels of COHb, at 0.247% and 0.140% respectively, comfortably below 30% in each case. Thus, partial downward evacuation can be completed safely without the negative effects of CO.
Table 8 reports the calculated CO safety judgments for the upward evacuation mode. At 0–8.25 min, Zones 1 and 5 have the highest accumulated levels of COHb, at 0.605% and 0.303% respectively, comfortably below 30% in each case. Thus, upward evacuation can be completed safely without the negative effects of CO.

4.4. Low Oxygen

The oxygen content at each measuring point is obtained from the fire model. Figure 16 shows the average oxygen content of each area in the station hall at different times.
As Table 9 shows, the average oxygen content in each area of the station hall remains at a high level, 6–6.43 min, and the corresponding time to loss of movement ability in each area is greater than 0.43 min. Thus, the oxygen concentration in each area at 6–6.43 min can be considered safe. Similar results for 0–1 min, 1–2 min, 2–3 min, 3–4 min, and 5–6 min support the conclusion that the oxygen content in each area remains at a safe level. Thus, downward evacuation can be completed safely without the negative effects of low oxygen content.
As Table 10 shows, for the period 7–8.25 min, the time to loss of movement ability is greater than 1.25 min in each area. Thus, the oxygen concentration levels in each area at 7–8.25 min are safe. Similar results for 0–1 min, 1–2 min, 2–3 min, 3–4 min, 5–6 min, and 6–7 min support the conclusion that the oxygen content in each area remains at a safe level. Thus, upward evacuation can be completed safely without the negative effects of low oxygen content.

4.5. Summary of Findings

If a fire with an HRR of 8.0 MW breaks out in the center of the hall of the metro station under study, the evacuation of 4600 people in either mode is not affected by high temperature, CO, or low oxygen content. In the upward evacuation mode, smoke height remains below the critical safety height of 1.8 m for about 150 s during the whole evacuation process, while in the partial downward evacuation mode, it remains below 1.8 m for about 30 s. Evacuees are therefore less likely to be affected by smoke in the partial downward evacuation mode. The evacuation model calculation results also show that the RSET value of the partial downward evacuation mode is lower. Therefore, partial downward evacuation is found to be effective in reducing RSET and minimizing smoke exposure, particularly when the fire is located in station halls and the platforms remain accessible. Its adoption depends on real-time confirmation of fire location, operational availability of trains, and tunnel ventilation integrity.
The findings from this study offer useful insights for fire safety management in underground metro stations. Authorities and urban planners might find it beneficial to consider the partial downward evacuation strategy, especially in situations with high heat release rates. This approach could potentially improve evacuation efficiency and safety by reducing smoke exposure and shortening evacuation times. Moreover, using safety assessment methods like PyroSim for comprehensive simulations could help in designing more effective evacuation plans and refining emergency response protocols. Adopting these practices could contribute to better safeguarding passengers and making evacuation processes more efficient in challenging scenarios.

4.6. Limitations and Practical Considerations

Although the partial downward evacuation mode shows promise in simulation, its real-world implementation requires overcoming significant practical challenges. These include ensuring train availability within short timeframes, managing risks associated with sending trains into fire zones, maintaining traction power integrity, and establishing accurate fire detection and localization systems. Furthermore, dynamic evacuation signaling and fail-safe communication systems would be essential to guide evacuees safely. These aspects merit further investigation before real-world deployment. Notably, when downward evacuation is infeasible due to operational constraints, enhancing traditional shelter-in-place protocols becomes critical. Emerging smart building technologies—such as QR code-enabled emergency notification systems that transmit real-time occupant locations to firefighters—have demonstrated potential to reduce rescue search times by 33% [30].
On the other hand, implementing partial downward evacuation in practice requires not only technical readiness but also public trust and staff preparedness. Passengers may be reluctant to board trains in proximity to the fire location, particularly if smoke is visible or alarms are sounding. Clear audio and visual guidance, trusted public messaging, and well-trained staff are essential to support confidence in downward evacuation. Behavioral research suggests that prior familiarity with such strategies can significantly improve compliance.

5. Conclusions

This study began by proposing a safety judgment method with integrated harmful factors considered for fire evacuation. The proposed method takes into account the influences of smoke height, high temperature, CO, and low levels of oxygen. Based on the dimensions, structure, and layout of a specific metro station, the fire scenario and crowd parameters were then set, and the fire and evacuation models were established. The safety and efficiency of the upward and partial downward modes of evacuation were compared, with the following results:
(1)
Regardless of whether the upward or downward evacuation mode is adopted in the fire scenario studied, evacuees will not become unconscious or incapacitated due to the influence of heat, CO, or low oxygen.
(2)
Partial downward evacuation reduced total evacuation time by 22.1% (385.5 s vs. 494.8 s for upward mode) when trains were available within 120 s, primarily due to a 63.7% reduction in movement time (130.5 s vs. 359.8 s).
(3)
Smoke height remained above the critical 1.8 m level for 355.5 s/385.5 s (92.2%) of partial downward evacuation versus 345 s/494.8 s (69.7%) for upward mode, cutting hazardous exposure duration by 80% (from 150 s to 30 s).
In general, under the fire scenario and evacuation conditions considered in this study, partial downward evacuation is safer and more efficient than upward evacuation. However, before partial downward evacuation can be trialed in practice, further research is required to determine the appropriate arrangements for the evacuation train and the factors involved in public acceptance of this mode of evacuation. Also, examining multiple fire locations and system failure modes to further validate the robustness of the proposed evacuation strategy deserves deeper research.

Author Contributions

Author Contributions: Conceptualization, H.Y.; methodology, H.Y. and H.H.; software, Y.H.; validation, H.Y., Y.H. and H.H.; formal analysis, H.Y.; investigation, H.Y. and Y.H.; resources, H.H.; data curation, H.Y.; writing—original draft preparation, H.Y.; writing—review and editing, H.Y., Y.H. and H.H.; visualization, H.Y.; supervision, H.Y.; project administration, H.Y.; funding acquisition, H.Y. All authors have read and agreed to the published version of the manuscript.

Funding

Heng Yu was supported by the Research Start-up Fund for Introduced Talents of Chengdu University (2091923043) to finish his research for this article.

Data Availability Statement

The data presented in this study are available on request from the corresponding author. The data are not publicly available due to privacy and ethical restrictions.

Conflicts of Interest

The authors declare no conflict of interest. The research was conducted in the absence of any commercial or financial relationships that could be construed as a potential conflict of interest.

References

  1. Gao, J.X.; Shi, C.L.; Zhong, M.H. Smoke Control Design of Deep Buried Metro Station. J. Saf. Sci. Technol. 2006, 2, 39–44. [Google Scholar]
  2. Zhong, M.; Shi, C. Reliability Analysis on Platform Fire Smoke Control in Deep Buried Island Metro Station. In Proceedings of the 9th International Conference on Probabilistic Safety Assessment and Management, Hong Kong, China, 18–23 May 2008; pp. 824–831. [Google Scholar]
  3. Zhang, L.; Wu, X.; Li, B.; Qin, Y.; Zhang, W. Fire Evacuation of Subway Station Based on Fire Dynamic Simulator and Pathfinder. Sci. Technol. Eng. 2018, 18, 203–209. (In Chinese) [Google Scholar]
  4. Yang, J.; Shi, X.L. Fire Evacuation and Emergency Rescue System Based on Laser-Guided Technology. J. Saf. Sci. Technol. 2012, 8, 134–137. [Google Scholar]
  5. Ronchi, E.; Nilsson, D.; Kojić, S.; Eriksson, J.; Lovreglio, R.; Modig, H.; Walter, A.L. A Virtual Reality Experiment on Flashing Lights at Emergency Exit Portals for Road Tunnel Evacuation. Fire Technol. 2016, 52, 623–647. [Google Scholar] [CrossRef]
  6. Xuan, X. Study of Optimization Algorithm for Evacuation Guidance Direction with Non-Uniform Pedestrian Distribution. J. Saf. Sci. Technol. 2011, 7, 34–37. [Google Scholar]
  7. Wang, W.; He, T.; Huang, W.; Shen, R.; Wang, Q. Optimization of Switch Modes of Fully Enclosed Platform Screen Doors during Emergency Platform Fires in Underground Metro Station. Tunn. Undergr. Space Technol. 2018, 81, 277–288. [Google Scholar] [CrossRef]
  8. Teodosiu, C.; Ilie, V.; Dumitru, R.; Teodosiu, R. Numerical Evaluation of Ventilation Efficiency in Underground Metro Rail Transport Systems. Energy Procedia 2016, 85, 539–549. [Google Scholar] [CrossRef]
  9. Purser, D. ASET And RSET: Addressing Some Issues In Relation To Occupant Behaviour And Tenability. Fire Saf. Sci. 2003, 7, 91–102. [Google Scholar] [CrossRef]
  10. Ramsay, G.C.; He, Y.; Taylor, P.; Horason, M.; Verghese, D. International Fire Engineering Guidelines; Western Sydney University: Canberra, Australia, 2005. [Google Scholar]
  11. Babrauskas, V.; Fleming, J.M.; Don Russell, B. RSET/ASET, a Flawed Concept for Fire Safety Assessment. Fire Mater. 2010, 34, 341–355. [Google Scholar] [CrossRef]
  12. Zarboutis, N.; Marmaras, N. Searching Efficient Plans for Emergency Rescue through Simulation: The Case of a Metro Fire. Cogn. Technol. Work 2004, 6, 117–126. [Google Scholar] [CrossRef]
  13. Kuligowski, E.D. Human Behavior in Fire. In SFPE Handbook of Fire Protection Engineering; Hurley, M.J., Gottuk, D., Hall, J.R., Harada, K., Kuligowski, E., Puchovsky, M., Torero, J., Watts, J.M., Wieczorek, C., Eds.; Springer: New York, NY, USA, 2016; pp. 2070–2114. ISBN 978-1-4939-2565-0. [Google Scholar]
  14. Brewer, R.; Morrison, L. Fire Alarm Detection in High-Ceiling Rooms. In Proceedings of the 35th Annual Conference of the Canadian Nuclear Society, Saint John, NB, Canada, 31 May–3 June 2015. [Google Scholar]
  15. National Fire Protection Association. NFPA 101: Life Safety Code; National Fire Protection Association: Quincy, MA, USA, 2018. [Google Scholar]
  16. International Code Council. NFPA 5000: Building Construction and Safety Code; International Code Council: Country Club Hills, IL, USA, 2017. [Google Scholar]
  17. Wieczorek, C.J.; Dembsey, N.A. Effects of Thermal Radiation on People: Predicting 1st and 2nd Degree Skin Burns. In SFPE Handbook of Fire Protection Engineering; Hurley, M.J., Gottuk, D., Hall, J.R., Harada, K., Kuligowski, E., Puchovsky, M., Torero, J., Watts, J.M., Wieczorek, C., Eds.; Springer: New York, NY, USA, 2016; pp. 2705–2737. ISBN 978-1-4939-2565-0. [Google Scholar]
  18. Society of Fire Protection Engineers. SFPE Guide to Human Behavior in Fire; Springer International Publishing: Cham, Switzerland, 2019; ISBN 978-3-319-94696-2. [Google Scholar]
  19. Hou, Y.; Hu, W.; Gui, Z.; Hu, Y. A Novel Co(II)–Based Metal-Organic Framework with Phosphorus-Containing Structure: Build for Enhancing Fire Safety of Epoxy. Compos. Sci. Technol. 2017, 152, 231–242. [Google Scholar] [CrossRef]
  20. Milke, J.A. Evaluating the Early Development of Smoke Hazard from Fires in Large Spaces. ASHRAE Trans. 2000, 106, 627–636. [Google Scholar]
  21. Stewart, R.D. The Effect of Carbon Monoxide on Humans. J. Occup. Med. 1976, 18, 304–309. [Google Scholar] [CrossRef] [PubMed]
  22. Sayers, R.R.; Davenport, S.J. Review of Carbon Monoxide Poisoning; United States Government Printing Office: Washington, DC, USA, 1930. [Google Scholar]
  23. Purser, D.A.; Woolley, W.D. Biological Studies of Combustion Atmospheres. J. Fire Sci. 1983, 1, 118–144. [Google Scholar] [CrossRef]
  24. Purser, D.A. Chapter 4: Asphyxiant Components of Fire Effluents. In Fire Toxicity; Woodhead Publishing Limited: Cambridge, UK, 2010. [Google Scholar]
  25. Purser, D.A.; McAllister, J.L. Assessment of Hazards to Occupants from Smoke, Toxic Gases, and Heat. In SFPE Handbook of Fire Protection Engineering; Hurley, M.J., Gottuk, D., Hall, J.R., Harada, K., Kuligowski, E., Puchovsky, M., Torero, J., Watts, J.M., Wieczorek, C., Eds.; Springer: New York, NY, USA, 2016; pp. 2308–2428. ISBN 978-1-4939-2565-0. [Google Scholar]
  26. Sundal, M.K.; Lilleng, P.K.; Barane, H.; Morild, I.; Vevelstad, M. Asphyxiation Death Caused by Oxygen-Depleting Cargo on a Ship. Forensic Sci. Int. 2017, 279, e7–e9. [Google Scholar] [CrossRef] [PubMed]
  27. Purser, D.A. Modelling Toxic and Physical Hazard in Fire. Fire Saf. Sci. 1989, 2, 391–400. [Google Scholar] [CrossRef]
  28. Proulx, G. Occupant Response to Fire Alarm Signals. In Proceedings of the 9th International Fire Protection Symposium, Munich, Germany, 25–26 May 2001; pp. 219–232. [Google Scholar]
  29. GB/T 31593.9-2015; Fire Safety Engineering Guide-Part 9: Guidelines for Evacuation Assessment. Standards Press of China: Beijing, China, 2015.
  30. Kuo, T.-W.; Lin, C.-Y. Smart Building Technologies for Fire Rescue: A QR Code-Enabled Notification System. Fire 2025, 8, 114. [Google Scholar] [CrossRef]
Figure 1. The chimney effect in the Daegu metro fire of 2003 (image source: Wikipedia).
Systems 13 00549 g001
Figure 2. Conflict between the evacuation route and the rescue route in a metro station fire.
Systems 13 00549 g002
Figure 3. Typical fire development and evacuation process.
Systems 13 00549 g003
Figure 4. Layout of the connected station hall.
Systems 13 00549 g004
Figure 5. Geometric models of the metro station (from left to right: overall model; Line 1 platform and mezzanines #1 and #2; Line 3 platform).
Systems 13 00549 g005
Figure 6. Position of the fire source and layout of the smoke height measuring points.
Systems 13 00549 g006
Figure 7. Station hall division and the number of measuring points.
Systems 13 00549 g007
Figure 8. Crowd distribution in the connected station halls.
Systems 13 00549 g008
Figure 9. Crowd distribution in mezzanines #1 and #2 and on the Line 1 platform.
Systems 13 00549 g009
Figure 10. Crowd distribution on the Line 3 platform.
Systems 13 00549 g010
Figure 11. Upward evacuation mode.
Systems 13 00549 g011
Figure 12. Changes in smoke height in the Line 3 station hall.
Systems 13 00549 g012
Figure 13. Smoke height changes in the Line 1 station hall.
Systems 13 00549 g013
Figure 14. Average temperatures, Zones 1–7.
Systems 13 00549 g014
Figure 15. Average CO concentrations, Zones 1–7.
Systems 13 00549 g015
Figure 16. Average oxygen content, Zones 1–7.
Systems 13 00549 g016
Table 1. Safety judgment for fire evacuation with harmful factors integrated.
FactorCriterionJudgment
Smoke heightThe smoke stays above the critical safe height during the evacuation.Yes/No
Heattinjure(0−1), tinjure(1−2),…, tinjure((RSET−1)−RSET) are all less than 1 min.Yes/No
COAccumulated COHb in the blood during the evacuation is less than 30%.Yes/No
Low oxygen t I 0 ( 0 1 ) ,   t I 0 ( 1 2 ) ,   t I 0 R S E T 1 R S E T are all less than 1 min.Yes/No
Table 2. Structure of the metro station.
LayerStructureFacilities
Ground levelStreetsEntrance/exits
First layer undergroundStation hall for Lines 1 and 3ATMs, ticket booths, ticket vending machines, and gate machines
Second layer undergroundLine 1 platformEscalators and lifts, waiting area, and benches
Third layer underground Mezzanines #1 and #2Escalators and lifts
Fourth layer undergroundLine 3 platformEscalators and lifts, waiting area, and benches
Table 3. Crowd parameters.
AgeProportionSpeed of Movement
Over 50 years old4%Male0.6–1.2 m/s
Female0.6–1.2 m/s
Between 30 and 50 years old25%Male1.40 m/s
Female1.27 m/s
Under 30 years old71%Male1.40 m/s
Female1.27 m/s
Table 4. Values of RSET in different evacuation modes.
Evacuation ModeNumber of EvacueesTmoveTrain Waiting TimeTalarmTpre-moveRSET
Upward4600359.8 s0 s75 s60 s494.8 s
Partial downward4600130.5 s120 s75 s60 s385.5 s
Table 5. Heat safety judgment for the partial downward evacuation mode.
ZoneAverage Temperature, 6–6.43 min t i n j u r y = 5 10 22 T 11.783 + 3 10 7 T 2.9636
Zone 128.27397,776 min > 0.43 min, safe
Zone 226.33915,597 min > 0.43 min, safe
Zone 326.091,022,033 min > 0.43 min, safe
Zone 423.613,312,192 min > 0.43 min, safe
Zone 525.111,603,812 min > 0.43 min, safe
Zone 622.525,764,242 min > 0.43 min, safe
Zone 720.5017,485,208 min > 0.43 min, safe
Table 6. Heat safety judgment for upward evacuation mode.
ZoneAverage Temperature, 7–8.25 min t i n j u r y = 5 10 22 T 11.783 + 3 10 7 T 2.9636
Zone 130.40169,581 min > 1.25 min, safe
Zone 227.84476,284 min > 1.25 min, safe
Zone 329.10282,592 min > 1.25 min, safe
Zone 424.821,834,476 min > 1.25 min, safe
Zone 525.941,093,782 min > 1.25 min, safe
Zone 622.535,749,193 min > 1.25 min, safe
Zone 720.9213,769,152 min > 1.25 min, safe
Table 7. CO safety judgment for partial downward evacuation mode.
ZoneCO Change Function, 0–6.43,
Obtained by Data Fitting, ppmCO
Accumulated COHb Concentration
Zone 10.739t3 + 2.505t2 − 12.78t + 3.739About 0.247%, safe
Zone 20.467t3 − 0.382t2 − 1.426t + 0.470About 0.116%, safe
Zone 3−1.021t3 + 9.131t2 − 10.08t + 0.76About 0.140%, safe
Zone 40.324t3 − 1.247t2 + 1.926t − 0.430About 0.051%, safe
Zone 51.215t3 − 5.089t2 + 4.747t − 0.153About 0.130%, safe
Zone 60.072t3 + 0.570t2 − 1.103t + 0.183About 0.490%, safe
Zone 70.064t3 − 0.170t2 − 0.097t + 0.102About 0.009%, safe
Table 8. CO safety judgment for the upward evacuation mode.
ZoneCO Change Function, 0–8.25 min,
Obtained by Data Fitting, ppmCO
Accumulated COHb Concentration
Zone 1−0.695t3 + 14.367t2 − 36.136t + 9.059About 0.605%, safe
Zone 2−0.267t3 + 6.114t2 − 15.068t + 3.889About 0.294%, safe
Zone 30.156t3 − 1.776t2 + 13.849t − 5.627About 0.227%, safe
Zone 4−0.057t3 + 3.445t2 − 10.439t + 3.549About 0.209%, safe
Zone 5−0.602t3 + 10.198t2 − 26.327t + 7.449About 0.303%, safe
Zone 6−0.077t3 + 1.709t2 − 3.079t + 0.492About 0.108%, safe
Zone 70.050t3 − 0.021t2 − 0.413t + 0.167About 0.034%, safe
Table 9. Oxygen safety judgment for the partial downward evacuation mode.
ZoneAverage Oxygen Content, 6–6.43 min t I 0
Zone 120.537563.92 min > 0.43 min, safe
Zone 220.668099.54 min > 0.43 min, safe
Zone 320.728378.24 min > 0.43 min, safe
Zone 420.708292.28 min > 0.43 min, safe
Zone 520.648025.75 min > 0.43 min, safe
Zone 620.748445.25 min > 0.43 min, safe
Table 10. Oxygen safety judgment for the upward evacuation mode.
ZoneAverage Oxygen Content, 7–8.25 min t I 0 = e x p 9.13 0.54 20.9 % O 2
Zone 120.417097.17 min > 1.25 min, safe
Zone 220.607860.83 min > 1.25 min, safe
Zone 320.698240.72 min > 1.25 min, safe
Zone 420.648026.40 min > 1.25 min, safe
Zone 520.597818.87 min > 1.25 min, safe
Zone 620.728399.31 min > 1.25 min, safe
Zone 720.768542.94 min > 1.25 min, safe
Disclaimer/Publisher’s Note: The statements, opinions and data contained in all publications are solely those of the individual author(s) and contributor(s) and not of MDPI and/or the editor(s). MDPI and/or the editor(s) disclaim responsibility for any injury to people or property resulting from any ideas, methods, instructions or products referred to in the content.

