Article

The Effects of Land Use Mix on Urban Vitality: A Systemic Conceptualization and Mechanistic Exploration

Law School, Ningbo University, Ningbo 315211, China
*
Author to whom correspondence should be addressed.
Systems 2025, 13(7), 542; https://doi.org/10.3390/systems13070542
Submission received: 8 May 2025 / Revised: 18 June 2025 / Accepted: 1 July 2025 / Published: 2 July 2025

Abstract

Urban vitality, a critical emergent property of complex urban systems, is pivotal for sustainable, human-oriented urbanization. While land use mix (LUM) is recognized as a key strategy for shaping these systems, the systemic mechanisms through which its multifaceted dimensions influence urban vitality across spatio-temporal scales remain underexplored. This study examines the complex and spatially heterogeneous impacts of land use mix on 24 h urban vitality in Ningbo, China, conceptualizing the city as a dynamic socio-spatial system. By integrating multi-source data (Baidu Maps, POI, and OSM) and employing OLS and geographically weighted regression (GWR) models, we unravel these systemic relationships. Key findings include the following: (1) LUM significantly enhances urban vitality, acting as a crucial urban system configuration for both daytime and nighttime activity. (2) The efficacy of LUM stems more from systemic interconnections—convenient access to adjacent spaces (proximity) and functional coordination among diverse land uses—than mere compositional diversity, emphasizing the importance of interrelated elements within the urban fabric. (3) The system’s response to LUM exhibits significant spatial and temporal heterogeneity; proximity’s impact is most variable, while diversity and coordination effects are more stable, underscoring the dynamic and context-dependent nature of these interactions. (4) System-adaptive strategies are crucial: newly developed urban areas benefit from foundational infrastructure and land use diversity (system inputs), while revitalizing older towns requires optimizing spatial accessibility and functional coordination (enhancing existing system linkages). These findings advance the theoretical systems-based theoretical understanding of the LUM–vitality nexus while offering practical insights for urban planners and policymakers.

1. Introduction

Over the past few decades, cities have undergone significant changes, such as rapid urbanization, socio-economic crises, and governance issues, etc., which pose severe challenges to the sustainability of city systems [1]. Take the built-up environment of a city as an example. The car-oriented development model has led many cities to expand to a rather unreasonable size. However, at the same time, some core areas have witnessed problems such as population shrinkage and density decline [2]. The social systems of cities are also confronted with problems such as unequal rights [3], widening wealth gaps [4], and reduced enthusiasm for political participation [5], which have become even more severe after the COVID-19 pandemic [6]. These are all results that government officials and other stakeholders do not want to see. Scholars and institutions from around the world are calling for more effective and resilient urban planning to promote the transformation of cities into sustainable ones [7]. Also, nowadays, the public has higher requirements for a happy and prosperous living place [8]. Against this backdrop, it is crucial to understand the dynamic evolution of cities. We distinguish between two main urban change models: urban development, which usually refers to a relatively orderly and controllable process aimed at improving urban functions, infrastructure, and quality of life through planning and policy guidance within the existing framework, and urban transformation, which is a more profound and sometimes even disruptive change, aiming to overcome social, environmental, and economic problems through thorough and systematic changes and ultimately moving towards sustainable and livable cities [9]. These two modes are not separate but are often intertwined. Some goals and plans have been set to guide urban transformation, such as “sustainable urban development” (SUD) [10]. Now, this can only be achieved in sufficient way with urban vitality. A city with full vibrancy is now believed to be able to attract investment and high-end talents, enhance the happiness of residents, and maintain the sustainability of the economic and social system [11]. Studies from different disciplines, such as urban planning and human geography, have discovered that urban vitality can enhance residents’ interactions and happiness, as well as improve social capital community engagement [12]. The importance of urban vitality has been widely shared. The World Bank Institute (WBI), the United Nations New Urban Agenda, and other institutions and planners worldwide have proposed to take urban vitality as an important part of their own urban development planning [13,14,15]. As one of the largest emerging economies at present, in the process of urbanization transformation, China’s urban communities and villages have been demolished and rebuilt on a large scale. In the process of urban physical space reconstruction, problems such as social isolation, population loss, and social capital decline are constantly emerging [16,17]. China’s latest national urbanization plan emphasizes a people-centered orientation, sustainability, and urban vitality to meet the above challenges [18].
Since Jane Jacobs creatively proposed the concept of urban vitality in the 1960s, the conceptualization, evaluation, and influence mechanisms of urban vitality have been a central focus of scholarly research. To understand and enhance the system-level phenomenon of urban vitality, it is necessary to deeply explore its driving mechanism. Urban vitality is not determined by a single factor but can be regarded as a dynamic socio-spatial system which is the result of complex interactions between the urban physical environment (the built environment subsystem) and human activities (the social subsystem). Jacobs advocates for understanding urban vitality in terms of the social interactions, activities, and livable streets of residents [19]. Montgomery conceptualized urban vitality as the “liveliness of a place”, including the number of people on the streets at different times of day and the diversity of street life [13]. Kevin Lynch, from the perspective of system resilience, regards vitality as the ability of urban systems to support the survival, development, and continuation of their internal elements [20]. With the development of urban vitality theory, scholars have refined the concept based on their respective national contexts. Based on the practice of urbanization in developing countries, Jin compares urban vitality to the course of life, including three components: urban form, urban function, and urban society [21]. Yue considered the specific characteristics of urban transformation and population flow and defined urban vitality as the ability of urban physical environment to promote urban social activities [22]. Correspondingly, the measurement of urban vitality has developed along two distinct dimensions. The human activity-oriented conceptualization of urban vitality requires location-based datasets, such as transportation records [23], mobile phone data [24], and geotagged social media data (e.g., Twitter, Facebook) [25,26]. For urban form, urban vitality encompasses multifaceted aspects of urban systems, including political, economic, and cultural dimensions, typically employing entropy weight methods for comprehensive multi-indicator evaluation. For example, Demet’s assessment of Istanbul’s urban vitality includes the number of homes, the number of people, the proportion of commercial areas, and the price per square meter of land [27]. Zeng uses a “DALD” framework to evaluate urban vitality, specifically including population density, road density, building density, mixed land use, the number of service facilities and so on [28].
With the maturation of urban vitality theory, a growing number of scholars have explored the determinant factors of urban vitality as to provide scientific guidance for the construction of healthy, vibrant, and livable cities. Among them, the most classic model is the 3D model proposed by Cervero and his colleagues This model attempts to explain how the key elements of the built environment subsystem (Density, Diversity, Design) systematically affect resident behavior and spatial vitality [29]. Subsequent research has expanded the 3D model by incorporating two additional dimensions, distance to transit and destination accessibility, resulting in a more comprehensive 5D model [30]. The “nD” model has rich connotations and strong applicability and has been widely used to explore the influence mechanism of urban vitality. Sung took Seoul, South Korea, as a case study to explore the relationship between the degree of mixed land use, density, block size, building age, and urban vitality [31]. Deng took a county in New York State to study the impact of housing years, distance from bus stops, and various public service facilities on urban vitality [32]. Zhang’s study examined the impact of factors such as the number of intersections, block density, building density, building height, accessibility to public services, and the degree of mixed land use on urban vitality in 15 Chinese metropolises. His research has confirmed that street accessibility, architectural arrangement, and mixed land use are important factors affecting urban vitality [33].
Among the many elements of the built environment, land use mix (LUM) is a basic urban planning concept and is closely related with urban vitality. When we talk about residents’ activities, it is inevitable to think of two basic and predominant land use strategies, that is, land use density and land use mix. There are numerous studies on the relationship between these two strategies and residents’ behaviors, including walking, traveling, and leisure [34]. In response to the declining vitality during urban transformation, scholars and government officials have committed to promoting sustainable urbanization through high-density land use and land use mix [34]. Land use density is straightforward to define and measure. The impact of high-density land use strategy, such as high land use intensity and building density, on urban vitality has been confirmed by scholars, and many useful conclusions have been provided [35,36]. However, only a limited number of studies have specifically examined how land use mix affects urban vitality. For instance, Dong’s research employed a coupling coordination model to preliminarily explore the relationship between land use mix and urban vitality, revealing that China’s major cities generally maintain coordination between these two factors [37]. Ma’s study primarily focused on how park land use mix influences vitality [38]. However, the specific influence mechanism of LUM on urban vitality remains a challenge in the study of complex systems. The difficulty in conceptualizing and measuring LUM is the main reason for the insufficient research on its relationship with urban vitality. Existing studies often simplify LUM to a single ‘diversity’ indicator when measuring it, which ignores the inherent complexity of LUM as a multi-dimensional concept. This simplification may lead to an insufficient understanding of the non-linear and spatially heterogeneous relationships between LUM and vitality. Also, this simplification has led to ambiguity as to the relationship between LUM and urban vitality, which may be positive, negative, or have no impact at all [39,40]. Therefore, it is necessary to systematically conceptualize and measure LUM, which will help us better understand urban vitality and introduce more insightful urban planning schemes. Nowadays, an important transformation in urban planning lies in fully encouraging the grassroots participation of people, which is regarded as closely related to building a resilient and vibrant socio-economic order [6]. Existing studies have failed to fully capture the spatial proximity relationships of different functions and the compatibility or coordination of interactions, as well as how these configurations match the needs and perceptions of residents—the system’s agents and the main body of the system. In the post-pandemic era, LUM should be given more attention by planners because it not only helps to make the urban form more compact but also promotes community cohesion and interaction among residents [41]. Paying more attention to the daily needs of residents is the most important aspect of improving the LUM concept, and it is also a direct requirement of the urban design concept after the COVID-19 pandemic. For example, it helps answer the question of how to enable residents to maintain their physical and mental health and carry out normal outdoor activities within a lockdown and control area [42]. However, current studies about LUM and urban vitality have largely neglected these critical dimensions. To gain a more systematic understanding (systematically) of the impact of LUM on urban vitality, this study aims to address two key deficiencies in existing research. The first is to construct a more comprehensive LUM measurement framework. We not only consider the traditional diversity (quantitative relationship) and proximity (distance relationship) but also innovatively introduce the ‘Coordination Degree’ index based on public perception. These structural configurations affect the overall functional performance of the urban system by influencing people’s activity patterns, and urban vitality is the measure of this functional performance, especially the emergent properties of the system’s ability to attract and maintain human activities. Therefore, the systematic approach of this study aims to reveal how the system structure of LUM ultimately affects the system output (urban vitality) by influencing the system process (human activities), which is more in line with the requirements of the new, people-oriented urbanization for the coordinated development of the social–technological system. The second aim is to capture the temporal dynamics of urban vitality. Distinguishing between daytime and nighttime vitality helps reveal the operational status and response mechanisms of urban systems at different time scales [43]. The urban system presents different activity patterns and functional requirements during the day and night, and the influence of LUM may also change accordingly.
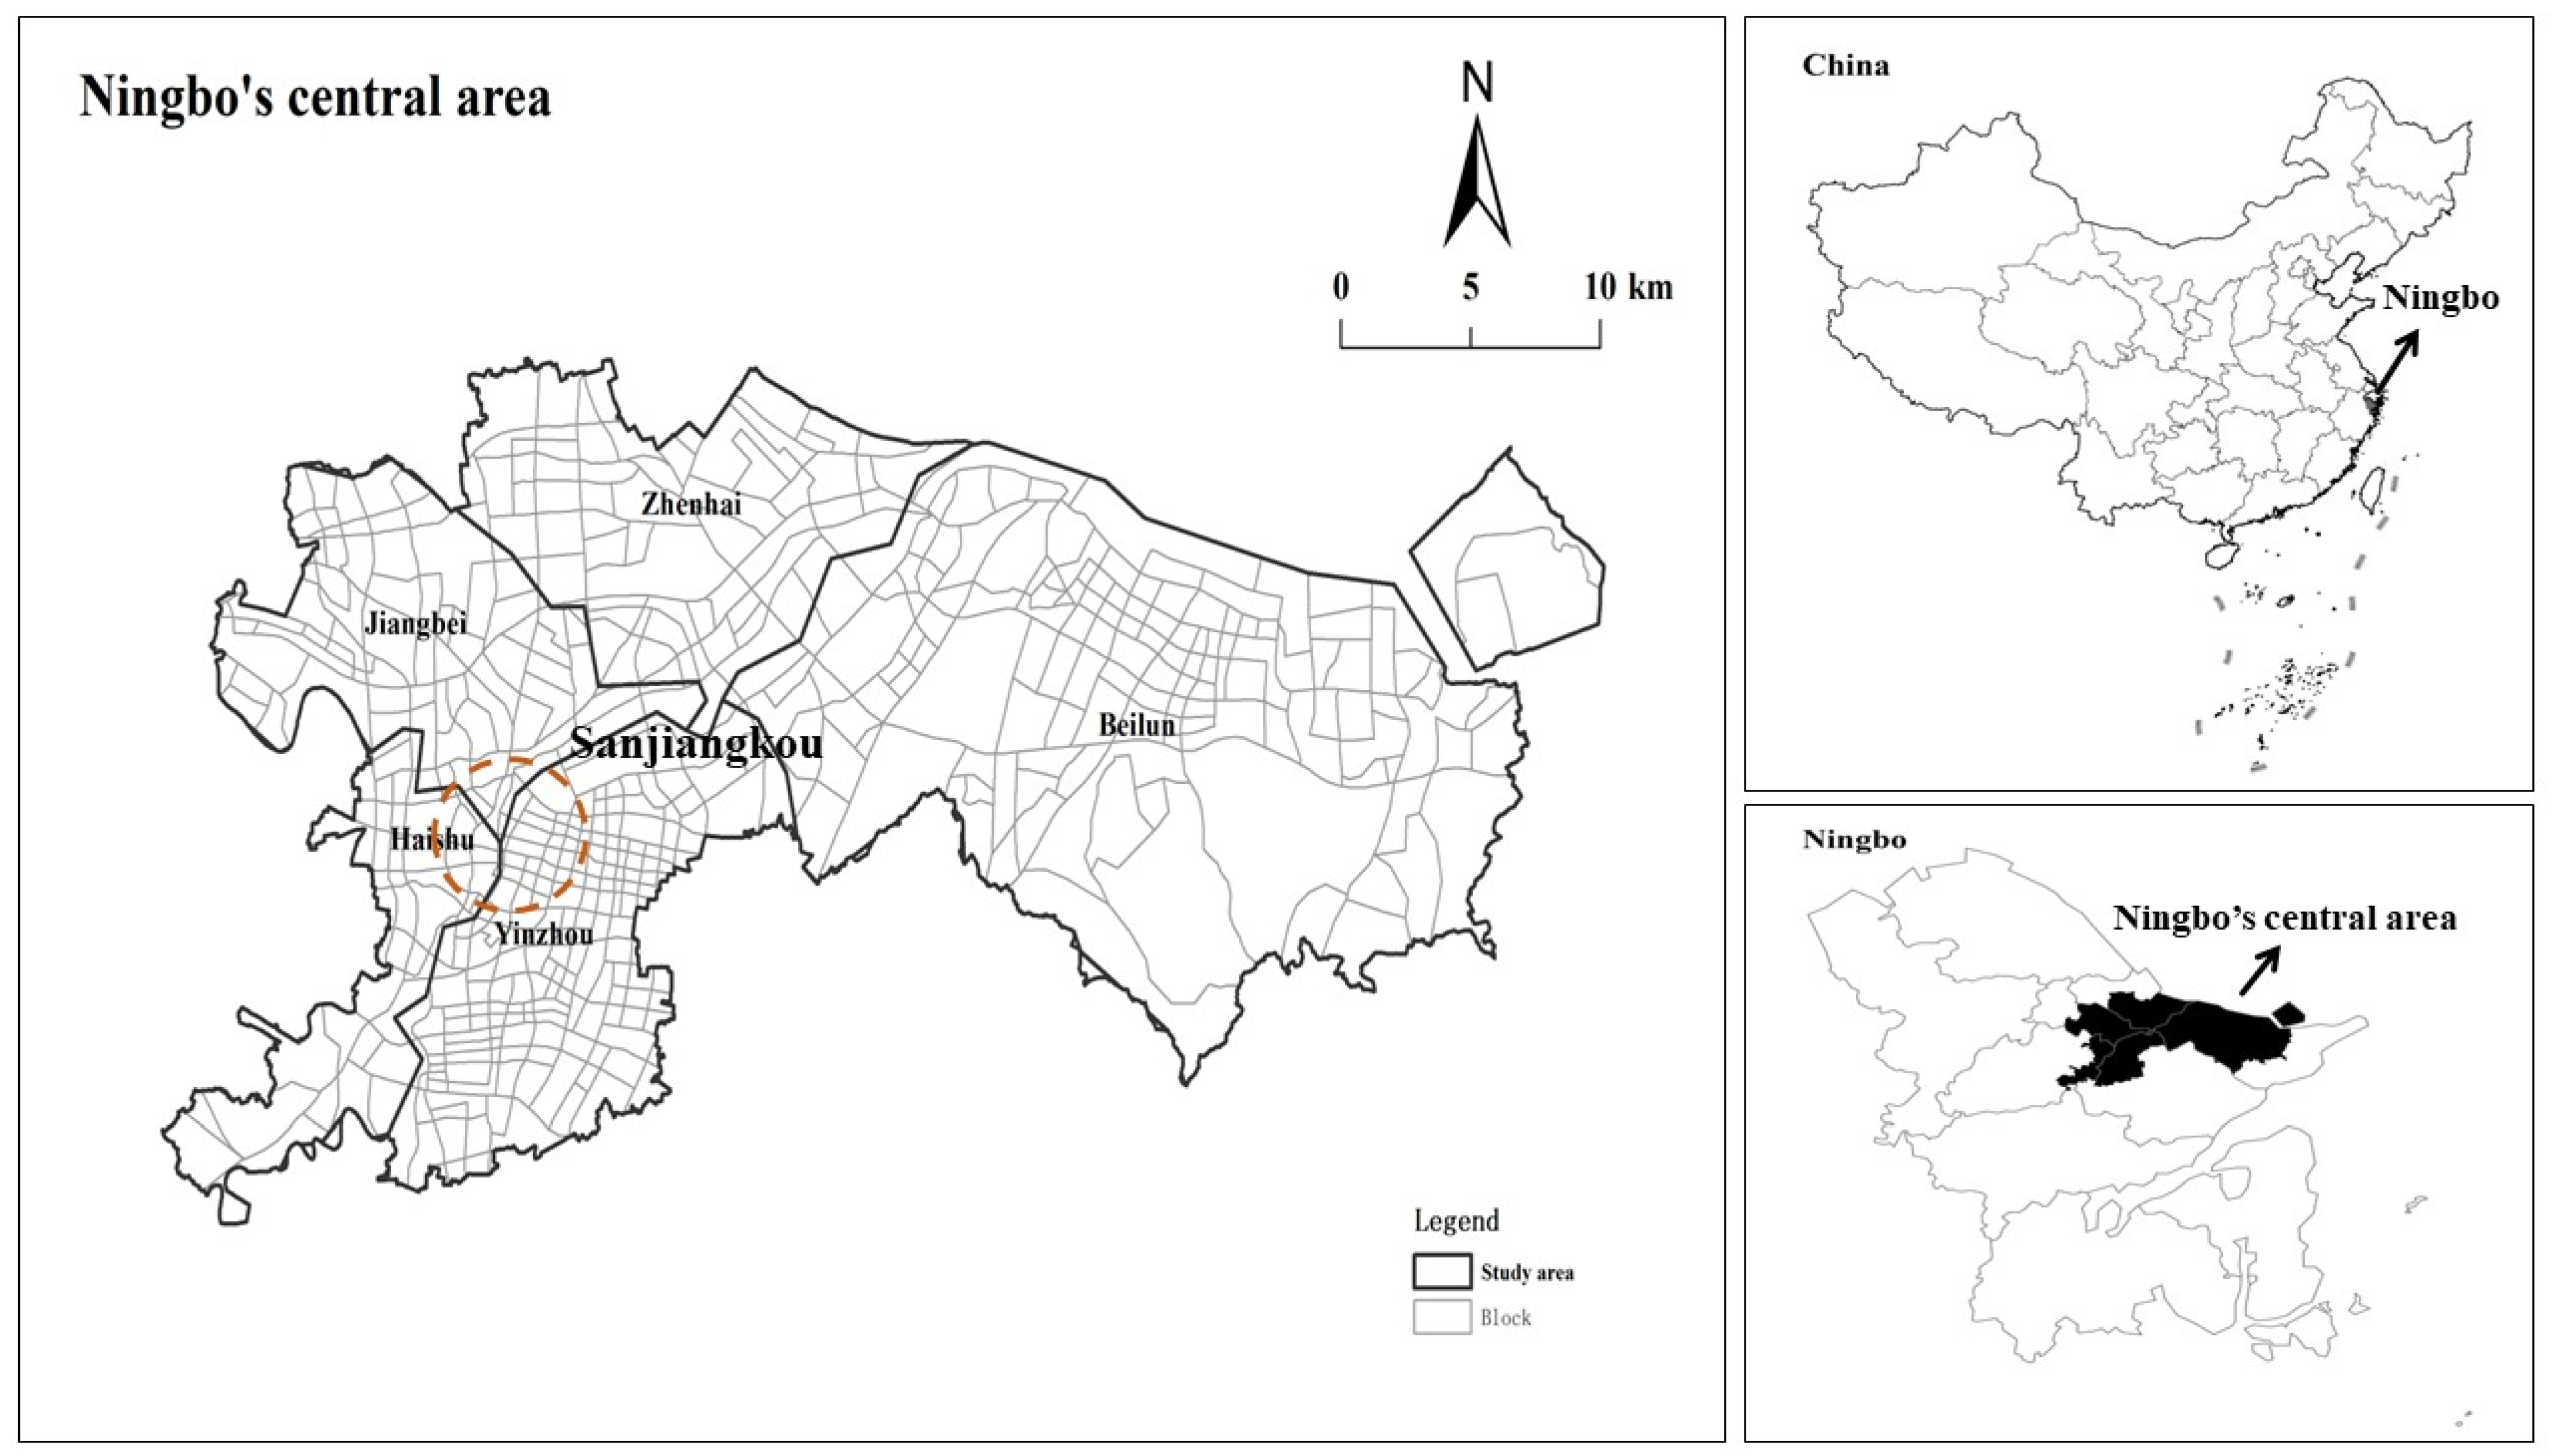
Based on this, this study selects the central urban area of Ningbo, China, as a case study. The rich land use practices in this area provide an ideal scenario for testing the effect of LUM in complex urban systems. We will integrate multi-source geospatial data to construct a multi-dimensional LUM index system that includes diversity, proximity, and coordination and measure urban vitality during the day and at night. By using the geographically weighted regression (GWR) model, we will deeply explore the internal mechanism of the multi-dimensional LUM’s influence on the spatially heterogeneous effects of urban vitality. This study aims to provide a more integrated and dynamic systems perspective to understand the relationship between LUM and urban vitality. Its findings can not only be beneficial to Ningbo City; they can also provide systematic and nuanced strategies for optimizing and revitalizing land use to other cities facing similar challenges, thereby promoting the sustainability and resilience of the urban social–spatial system.

2. Materials and Methods

2.1. The Study Area

This study selects Ningbo’s central urban area as the research region, specifically including the Sanjiangkou area (located at the junction of Jiangbei, Haishu, and Yinzhou), Zhenhai District, and Beilun District. Ningbo is in Zhejiang Province, China (28°51′ N–30°33′ N, 120°55′ E–122°16′ E), and it is an important financial and economic center and an international port city in Eastern China. Given the study’s focus on urban areas’ vitality, rural townships within these administrative districts were excluded from the analysis. In 2021, Ningbo was approved as part of China’s first batch of urban renewal pilot cities. In recent years, taking urban renewal action as the starting point, Ningbo has tried to improve urban vitality through many actions, such as residential space transformation and the revitalization and regeneration of inefficient industrial space. According to a report by the China Academy of Urban Planning and Design (CAUPD, 2024), Ningbo ranks 14th in urban vitality among Chinese cities and is one of the most representative urban centers in East China. Ningbo’s practices make full use of the land use mix strategy. Examples include the transformation of former industrial sites into mixed-use commercial plazas (e.g., Shifang Hesheng Youth Community and IPN fishing factory Plaza), which have provided residents with complete support for living facilities and have completed the in-depth development of inefficient space. The rich practice of mixed land use in Ningbo forms the basis of this study and can also provide a meaningful reference model for other urban renewal projects. The study area covers approximately 779.97 square kilometers, accounting for 8% of Ningbo’s total administrative area, and the size of the central urban area is similar to other cities [44]. More details can be found in Figure 1.
This study adopts the block as its basic research unit, deliberately selecting this unit over administrative boundaries for two principal reasons. First, China’s official cities are large administrative areas that cover vast unbuilt areas, such as rural areas, that are often much larger than the urban areas [45]. Second, from an urban vitality perspective, blocks are a more methodologically sound analytical unit. Blocks are usually separated by road networks, which usually have high accessibility and create more opportunities for community engagement [19,33]. Like many other studies, we used OpenStreetMap (OSM) road network data to separate our fundamental research units. The quality of OSM data for major Chinese cities is relatively robust, and the dataset has been applied in urban morphology and functional analyses [46]. Following the methodological framework developed by Long [47] and Li [48], we have carried out a series of treatments on the road networks of Ningbo’s central area. This includes removing suspension roads, extending open roads, generating buffers according to different road grades, extracting road center lines, and so on. Finally, 511 units in the study area were obtained.

2.2. Data Sources

The data used in this study mainly include Baidu heatmap data, Points of Interest (POI) data, OpenStreetMap (OSM) data, and built environment datasets. These datasets are basically obtained from open-source online platforms or official government. An overview of the main datasets is presented in Table 1 below, with additional datasets and more detailed descriptions available in Section 2.3.

2.3. Methods

2.3.1. Calculation of Urban Vitality

The urban vitality data was from Baidu. Baidu is one of the largest Internet companies in China, with a user base of over 100 million. We mainly collected data from Baidu Maps for two reasons: (1) greater accessibility and fewer privacy issues with mobile phone data; (2) high-resolution capture of residents’ activities rather than focusing on the built environment. Baidu Heatmap data is a reasonable data source for measuring urban vitality and has been used in many urban studies [49,50,51]. The Baidu Heatmap dataset employed in this study was collected in May 2024, with a temporal resolution of one-hour intervals. The dataset has over 9000 sampling points, each documenting four key attributes: time, longitude, latitude, and heat values. We employed ArcGIS’s Kernel Density Estimation (KDE) tool to calculate vitality values for each block [52]. Due to the differences in psychological and emotional factors and environmental factors, urban vitality needs to be classified into daytime vitality (DV) and nighttime vitality (NV) [53]. Specifically, a block’s daytime vitality refers to the average activity intensity during 7:00–18:00, while nighttime vitality represents the average from 19:00 to 23:00.

2.3.2. Calculation of Land Use Mix

Land use mix was primarily calculated using Point of Interest (POI) data obtained from Amap (https://www.amap.com, accessed on 1 May 2025), one of China’s biggest and leading digital mapping companies. The dataset has 164,451 POIs in total. After dropping duplicate and missing POIs, 156,973 valid POIs were saved. Each POI contains the latitude and longitude, name, address, category, and so on. The initial POI data of Amap adopts a three-level classification system. According to the basic living needs of urban residents, as well as the classification of POIs by reference to relevant studies [54], this study finally reclassified POIs into 5 categories, and more information on POIs is shown in Table 2.
Unlike simplifying the land use mix as “diversity”, we adopt the framework of “quantity-distance-attribute” to express land use mix more systematically [55]. Accordingly, we use diversity, proximity, and coordination indexes to express the conceptual framework. Firstly, the Shannon entropy index is used to represent the quantity dimension—that is, the diversity—of land use mix. Mixed diversity is the most popular way to measure land use mix due to its connotations, which are clearly distinguished from the functional zoning idea of the Industrial Revolution era [56]. The Shannon entropy index can be calculated by the following formula:
S = 1 n P i ln P i
where S represents the diversity of land use mix and P i   represents the proportion of a certain type of POI to all POIs in a block.
Secondly, we calculated the distance dimension. Previously, the measurement of the LUM distance dimension was mostly based on the distance between different buildings, such as measuring the actual distance between residences and shops [57]. Unlike this, we start from the perspective of residents’ daily lives and use a proximity index to express the distance dimension of LUM. The proximity index is closely related to “chrono-urbanism”, which means building more walkable and humane urban fabrics. This idea originally comes from Carlos Moreno. His design concept includes less reliance on cars and more walking and cycling activities; finally, the social fabric becomes even more closely knitted, and residents are made to interact and participate more in activities [58]. From this perspective, proximity measurement is based on the travel distance at which residents feel relaxed and comfortable, and LUM blocks are regarded as convenient neighboring areas, such as job spaces, public services, and public transportation. A cumulative opportunity model is used in this study to calculate the number of opportunity points that can be reached within a certain walking distance [59]. According to the 15 min city principle, the walking distance at which residents feel at ease is about 1 km. So, this distance is set to be 1 km. The proximity index can be described as
P = j O j t
where P   is mixed proximity, O j t   represents the sum of all POI facility points accessible within block j , and t   is the distance threshold.
The third dimension is the attribute dimension. This dimension is closely related to the second dimension. Both of them emphasize the importance of humanistic care in urban design. For this LUM attribute, we innovatively introduce awareness as a measurement indicator. In the past, researchers usually used the compatibility index to represent the attribute dimensions of LUM. For example, Tian and Zhuo attempted to depict the possible externalities among different land types, meaning minimizing the harm caused by industrial land [60,61]. However, this method has a rather obvious drawback. To a large extent, it is produced by the subjective judgment of experts and government officials while ignoring the real needs of urban residents. To make up for this deficiency, we use the survey data of urban residents. The survey was conducted by Chinese scholars in some cities. In this survey, urban residents expressed their preferences for different types of urban land use [62,63]. In addition, considering that area also has an important impact on the performance of urban functions, POI data is assigned an area attribute by the method of area correction. For specific area correction coefficients and public awareness, see Table 2. We used the coordination index to describe the comprehensive demand degree of urban residents for various types of land use in the block. The coordination index comes from the theory of coupling coordination, which started in physics and was later widely used in social science research to describe the strength and effects of the interactions of multiple systems. The theory believes that the interaction between different systems will generate a new, higher-level system. The new system has a more complex organizational structure and energy aggregation, which produces an effect greater than the superposition of individual systems, thus achieving “1 + 1 > 2” [64]. There are many examples of coordinated land use. For example, Jacobs mentioned that the existence of residential and office functions in a region can attract a large number of people and ensure the prosperity of the service industry, which in turn can provide convenience for the daily life of residential and office people, which helps to improve vitality [19]. The mixed mode of commercial and residential living in early Roman cities, such as “shop house” and “family workshop”, also shows that coordination between functions helps them to promote each other. The higher the degree of coordination between systems, the greater the goodness of the overall system, so it can meet the needs of residents to the greatest extent and promote the vitality of the region. Specifically, the degree of coordination can be expressed by the following formula:
D = C × T
C = u 1 , u 2 , · · · , u n u i + u j 1 n
T = α U 1 + β U 2 + γ U 3 + δ U 4 + θ U 5
α + β + γ + δ + θ = 1
U = i = 1 5 u i A i a i
In the formula, D   is the coordination index, which describes the coordination degree among the five systems of commercial, public service, job, residential, and green spaces in this study. C is the coupling coefficient; α, β, γ, δ, and θ are the weights to be determined. Considering that the commercial service industry, public service, employment, and office, residence, and green spaces are equally important for cultivating urban vitality, they are given equal weights. That is, α = β = γ = δ = θ = 1/5. U   is the value of the development level of each subsystem to be evaluated, A i   represents the public awareness of the corresponding POI type, and A a i represents the area correction factor of the corresponding POI.

2.3.3. Control Variables

To ensure the accuracy of the estimation results, based on previous studies, we have selected a series of control variables, which also have a significant impact on urban vitality. We mainly select control variables from two dimensions: the built environment dimension and the social–economic dimension. Although there are different opinions on the range of the built environment, scholars have reached a consensus that the built environment strongly affects urban vitality [65]. In his research, Ewing concluded that the built environment can be summarized by a 5D model: density, diversity, design, destination accessibility, and distance to transit [30]. Therefore, we mainly referred to existing studies and 5D models to select the remaining control variables. We selected construction density, block size, greening index, road network density, and the number of bus stops as the corresponding control variables, respectively. In addition to built environment characteristics, we also selected GDP and population density as control variables of economic and social conditions. More details can be found in Table 3.

2.3.4. OLS Model

The OLS model is the basic regression model of this study. It is mainly used to examine the global average impact of mixed land use on urban vitality. The basic form of the OLS regression model can be expressed by the following formula:
Y = b 0 + b 1 X 1 + b 2 X 2 + b 3 X 3 + + b n X n + ε
In the formula, Y   is the dependent variable of the study, which is the mean value of the daytime and nighttime vitality of the city in this paper. X 1   to X n   are the explanatory variable and control variable of the study, b 0   is the constant term, b 1   to   b n are the regression coefficients, and ε   is the residual term. Before running the regression model, we estimated the variance inflation factor of each regression variable based on Stata 16 in order to avoid multicollinearity problems in the model. The variance inflation factor of each variable is shown in Table 4.
The results show that the VIF value of each variable is significantly less than 10, so it can be considered that there is no collinearity problem between variables, and further analysis is reasonable.

2.3.5. GWR Model

As mentioned above, urban vitality has obvious spatial agglomeration characteristics, so there will be bias in the estimation of OLS regression models [68]. Therefore, the geographically weighted regression model considering spatial non-stationarity is used to estimate the effect of land use mix on urban vitality. Before running the GWR model, it is necessary to test the spatial characteristics of urban vitality. We use the global Moran index to judge whether there is spatial dependence on the vitality of Ningbo. The global Moran index can be expressed as
I = n i j w i j i j w i j x i x ¯ x j x ¯ i x i x ¯ 2
where n represents the number of observation points studied ( n = 511 in this paper), w i j   is the spatial adjacency weight matrix, x i   is the variable of observation point i , and x ¯   is the mean value of the variable.
In order to deal with the spatial heterogeneity of the variables, Fotheringham proposed the geographically weighted regression (GWR) model for the first time [69]. The GWR model introduces the spatial location of the data into the model parameters and estimates the regression coefficients using the locally weighted least squares method, so that variable coefficients at different spatial locations can be observed. The GWR model can show the spatial non-stationary characteristics of variables well, which makes the estimation results more accurate and more appropriate for the real world. Many studies have shown that the GWR model has unique advantages in dealing with the socio-economic problems of complex urban systems. For example, in the research of Walid Al-Shaar et al. on the solutions to water–soil–energy nexus in Île-de-France, the GWR model provides great explanatory power [70]. The research of Li et al. indicates that the GWR model is extremely excellent in explaining spatial heterogeneity. His research takes 289 cities in China as examples and uses the GWR model to explore the heterogeneous spatial influence of various determiners on urban form [71]. The formula of the geographical weighted regression model is as follows:
y i = β 0 u i , v i + i = 1 m β j u i , v i x j i + ε i
In the formula, i   represents the research unit (i.e., block), y i   represents the urban vitality value corresponding to the block, x j i   is the  j t h influencing factor of space unit i , m   represents the total number of space units, ε i   represents the random error term of space unit i , and u i , v i   represent, respectively, the longitude and latitude of space unit i . β 0 u i , v i   and β j u i , v i represent the intercept and local estimation coefficients of the model at position i , respectively. Bandwidth is an important parameter affecting GWR model performance. In this study, the Akaike Information standard (AIC) was used to select the optimal bandwidth parameter. This approach ensures that the selected bandwidth parameters are neither too large (which may cause the model to be too simple and miss important information in the data) nor too small (which may cause the model to be too complex and capture noise rather than underlying trends) and can ensure the robustness and validity of the study results [72].

3. Results

3.1. Daytime and Nighttime Urban Vitality Pattern

Figure 2 shows the daytime vitality (DV) and nighttime vitality (NV) of Ningbo’s central urban area. It can be seen that the vitality of Ningbo central city has obvious vitality poles, mainly located in the area of Sanjiangkou, and another area with high vitality is located in the Beilun urban area. The Sanjiangkou area is the core area of Ningbo City, with a history of more than 1200 years. In the area, there are Tianyi Square (the largest commercial square in Ningbo), the Old Bund (an early trade port), the CITIC Tower (an influential financial group), and other important facilities, so the vitality of the Sanjiang area is at a high level. As for the Beilun urban area, the industrial manufacturing industry is the pillar industry in this area, with large-scale industry centers such as Geely Automobile and Ningbo Iron and Steel, which provide convenient employment for residents. However, there is still a big gap between the Beilun urban area and the Sanjiangkou area (no blocks with the highest level of vitality). This is similar to the findings of many scholars, which indicate that old urban areas are more attractive than newly developed urban areas [36]. From the perspective of time, the overall urban vitality of the commuting period is higher than that of the rest period, mainly because most residents rest at home at night. Therefore, they have fewer opportunities to communicate and interact with each other outside and make an insufficient use of urban public space [73]. However, we found that some special areas have higher activity at night than during the day, and a representative area is Xiaogang Street (located between the Sanjiangkou area and the Beilun urban area). A possible reason is that Xiaogang Street, as a satellite city, provides overnight accommodation for migrant workers near the Sanjiangkou and Beilun urban areas. According to the statistics of the government of Beilun District, Xiaogang Street had a floating population of 129,600 at the end of 2022, accounting for about 20% of the total floating population in Beilun, and the youth group accounted for more than 52%. Therefore, it can be inferred that most people in this community are migrant workers. Thanks to the location advantages and convenient transportation, they can easily go to the Sanjiangkou and Beilun urban areas for work during the day, and they can return to the community for rest at night. Therefore, the vitality of the neighborhood shows a special situation: at night, it is higher than during the day.

3.2. Land Use Mix Pattern

Figure 3 shows the land use mix pattern in the central urban area of Ningbo. First of all, from the diversity of land use mix, it can be seen that the distribution of mixed diversity is relatively average, with the Shannon value in most areas being at a high level. As a representative city in East China, Ningbo’s urban planning and design since 2006 (Ningbo’s Overall urban Planning (2006–2020)) has emphasized a land use mix strategy in the whole region. The plan proposes to optimize land use and introduce various public service facilities while transforming residential areas, so the multifunctional use of land is more balanced in Ningbo. Only a few blocks, such as the northern strip and parts of the southern part of the study area, have low mixed-use diversity values. Based on electronic maps and remote sensing images, it is found that chemical enterprises and logistics warehousing, such as the petrochemical industry (Ningbo Zhenhai Petrochemical, Rongsheng Petrochemical, etc.) and wharfs (Ningbo Keyuan Wharf, Beilun Port Wharf, etc.), are the main enterprises in the narrow northern strip of the study area. Due to the negative externalities of these industries (air pollution from petrochemicals, noise from wharfs) and the characteristics of the land (large footprint), residential land and commercial land are squeezed out of the area, so the area reflects a low mixed use. As for the southern region, the low vitality is because the area is dominated by special land, such as many cemeteries (Ruyi Cemetery, Phoenix Cemetery, Qianlong Three Tomb, Tongtai Jialing, etc.) and facilities such as the Anti-Japanese War Memorial Hall in eastern Zhejiang. Therefore, the value of land use diversity in this area is low. The second finding is the proximity of land use mix in the central area of Ningbo. A high-value area of land use mix proximity is mainly located in the Sanjiangkou area. As the city core, Sanjiangkou has complete and various urban facilities, such as a comprehensive commercial square, a residential area, administrative offices, and various medium-sized and small enterprises. The high construction density makes the block show compact characteristics. In addition, all kinds of facilities in these blocks have good accessibility, and they can be easily used by nearby residents because of well-developed transportation, such as the city bypass, subways, and public transportation lines. Also, some areas near the Beilun urban area show a high degree of proximity. The third finding refers to the coordination of mixed land use. The distribution of coordination can be summarized as a basic law, that is, the land use coordination is the best in the surrounding areas adjacent to the city core, which means that the neighboring areas of the city core have better livability and can balance the various needs of urban residents for urban space. This spatial organization form of LUM is determined by the law of land rent. Alonso developed a model to illustrate the law of urban land prices, specifically stating that the city center is primarily occupied by facilities with strong payment capacity. In this regard, the priority order is commercial facilities > office facilities > residential facilities, and the further away from the city center, the relatively cheaper land rent becomes [74]. Taking the Sanjiangkou area in Ningbo as an example, this area gathers important commercial facilities such as the Hanshin Department Store, Raffles Square, and the Ningbo International Financial Center (IFC). The remaining residential spaces mainly attract high-end housing communities like Ningbo New World and Greentown, targeting high-net-worth residents. The housing prices here range from CNY 50,000 to 80,000 per square meter, two to three times the price of ordinary residential communities in Ningbo. Since residents need to balance work (typically involving long-distance commuting to the city center) and daily life (affordable rents, diverse public services, recreational facilities, etc.), blocks near the city center become the optimal choice. These neighborhoods allow residents to enjoy work and commercial conveniences in the city center through shorter commutes while avoiding extremely high land rents, thus balancing commuting costs and housing expenses. For example, in areas around Sanjiangkou Jiefang South Road–Zhongshan West Road, such as the Shuicang community, Yingfeng community, and Yanyue community, the blocks’ mixed coordination is the best. Through the electronic map, it is found that in addition to residential areas, these blocks usually have some small commercial facilities, such as a ten-minute express supermarket, Shengyangtai shopping mall (a market mainly selling food and miscellaneous products), as well as some groceries and convenience stores, which can meet the daily needs of residents. Similarly, the blocks with the best mixed coordination in Beilun are located in the area surrounding the Beilun core (rather than in the Beilun core). Blocks along Taishan Road and Hangshen Line, such as the Dongcheng Huayuan and Shuihua Home areas, show good mixed-use coordination, and these communities are equipped with living supermarkets (Dongcheng supermarket), vegetable markets (Phoenix vegetable market), schools (Beilun District Ren Ya School), and other facilities. On the contrary, the coordination of land use in the city center in terms of large comprehensive supermarkets is not good. The possible reason for this is that the high land rent only retains large commercial groups with a strong ability to pay and drives the residential communities and some other convenient facilities out of the city center [75].

3.3. Results of OLS Models

As mentioned above, this paper uses the OLS model as the benchmark model to initially estimate the overall impact of mixed land use on urban vitality. Firstly, the model shows a good overall fit. According to the results of the OLS model in Table 5, the R-squared values of the urban daytime vitality and nighttime vitality models are 0.771 and 0.814, respectively. This shows that the model is well fitted and has strong robustness and explanatory power. Secondly, the regression coefficients of the three dimensions of LUM are positive and pass the significance test. This is consistent with scholars’ speculations that implementing diverse land use strategies in an adjacent area can mobilize residents to interact with urban space, thereby maintaining block vitality. Thirdly, the effects of the proximity and coordination dimensions of LUM are stronger than those of the diversity dimension. Therefore, for the cultivation of urban vitality, it is more important to pay attention to the balance and interaction between mixtures than to the diversification of facilities. Our findings explain some of the previous research. In one study, mixed land use was summarized only by land use diversity, and subsequent results showed that the effect of mixed land use on the cultivation of urban vitality was not obvious, or the results were unstable [40,49]. This instability is largely due to the neglect of the possibility of interaction between the mixed land use systems. Fourth, after distinguishing between daytime and nighttime scenarios, the coordination dimension of LUM showed good explanatory power. Through the comparison of model (1) and model (2), we can find that the effect of diversity and proximity on urban night vitality is significantly smaller than that on daytime vitality, which means that they may not be the best choice for cultivating night vitality. On the contrary, the regression coefficient of land use coordination increased significantly in the night activity model, which means that mixed land use coordination has excellent performance in improving night activity. As for the control variables, our study found that block size, road network density, the number of public transportation stops, and population density have a significant impact on urban vitality. Among them, our study is consistent with the conclusion of most research results: a large block size is not conducive to residents’ activities, while smaller blocks are conducive to the cultivation of urban vitality [23,47]. Good location and traffic conditions can encourage residents to go out to communicate and socialize, so the density of the road network and the amount of public transportation can have a positive impact on vitality [76]. In terms of economic and social factors, population density contributes the most to vitality, because more residents generally means more possibilities for mobility and activity.

3.4. Results of GWR Models

Based on Formula (9), we used Stata to calculate Moran’s I of daytime and nighttime vitality, and the results can be seen in Table 6. It can be seen that the I values of daytime and nighttime vitality in Ningbo are 0.791 and 0.780, respectively. This means that both during the day and night, the vitality of the block is spatially interdependent, meeting the basic conditions for using the GWR model.
Before running the GWR model, we first tested the model parameters to ensure that the model selection was reasonable. We reported the AICc and R-square values of the OLS and GWR models, respectively, which can be found in Table 7. As can be seen from Table 7, the AICc value of the GWR model is significantly smaller than that of the OLS model, and the adjusted R square value of the GWR model is always higher than that of the OLS model, which proves that the GWR model has more advantages in terms of its authenticity and effectiveness.
Based on the results of the GWR model, we drew the influence pattern of mixed land use on urban daytime and nighttime vitality (found in Figure 4). From the model results, our study proves that mixed land use has an obviously spatially heterogeneous effect on urban vitality. First of all, from the overall geographical pattern of mixed land use, the areas where mixed land use has an effect on urban vitality are mainly located in and around Sanjiangkou. This is basically consistent with the distribution of urban vitality, indicating that land mixed use is an important factor affecting urban vitality. Secondly, after distinguishing between daytime and nighttime scenarios, it is found that the effect of land use mix during the daytime is stronger than that at night. The effects of land mix diversity, proximity, and coordination on urban vitality during the day were 32%, 27%, and 24% higher than those at night, respectively. Thirdly, from the internal systems of LUM, the effect of proximity and coordination is stronger than that of diversity. The local regression coefficients of diversity ranged from −23.5 to 87.1, while the local regression coefficients of proximity and coordination were more than twice those of diversity, ranging from −329.9 to 380.4 and −25.8 to 242.9, respectively. This is consistent with the results reported by the OLS model in this study. At the same time, this study also illustrates an important conclusion, that is, in the stage of high-quality urbanization, the connotation of land mixed use cannot be summarized only by the diversity of land use. Fourth, in terms of stability, the effect of diversity and coordination on urban vitality is relatively stable, while the effect of proximity fluctuates largely. This is closely related to the pattern of land use mix reported above for the Ningbo urban area. The strategy of multifunctional land use is adopted in the whole area of the Ningbo urban area, so the distribution of diversity is relatively uniform. However, the proximity of mixed land use has a high-value area (near the urban core area) and a low-value area (away from the core area).
In order to better summarize the rule, we made a boxplot using the relevant regression coefficients, as shown in Figure 5. Figure 5 visually shows how land use mix affects urban vitality during the day and at night. Firstly, regarding the overall effect of LUM on urban vitality throughout the day, the mixed use of land has a positive effect on most of the city’s blocks (75% and above), while only a few areas, such as the aforementioned dock area and tomb area and the relatively separate Daqi street (square block in the upper right corner of the study area), have a negative impact. Secondly, after distinguishing between daytime and nighttime scenarios, the results show that mixed diversity and proximity tend to play a negative role at night (the box keeps moving closer to the 0 axis). In particular, mixed proximity shows considerable fluctuations, with the long whiskers below the box far exceeding the short whiskers above. This means that in some areas of the city, at night, mixed proximity has an important negative effect on urban vitality. Thirdly, mixed coordination exerts a positive and stable influence on urban vitality at night. It can also be seen from the chart that the positive influence of mixed coordination at night shows an obvious spreading trend from the Sanjiangkou area to the surrounding areas.

4. Discussion

Urban vitality and land use mix are both important and traditional urban research topics. Among them, urban vitality is the goal of high-quality urbanization all over the world, and the mixed use of land is one of the basic principles of contemporary urban planning. Since the publication of Jacobs’ book The Death and Life of Great American Cities in the 1960s, scholars have called for land use mix strategies to improve vitality. However, whether and how land use mix can improve urban vitality is still a theoretical proposition to be tested. To this end, this study combines multiple sources of data to conduct a preliminary test of the theoretical proposition and finds many valuable research results.
Our research shows that the key point of land use mix is not “mixed” or “diverse” but that it focuses on the interrelationship between the land mix system. This is basically consistent with the connotations of the evolution of the idea of land use mix, from focusing on the quantitative relationship of land use to the distance and attribute relationships of land use systems [55]. In fact, focusing on land use diversity alone may not stimulate urban vitality. As scholars have said, mixed land use projects usually include residential, commercial, industrial, recreational, and agricultural land, but not all land use types are common destinations for residents’ activities [77]. Our research emphasizes constructing walk-friendly and attractive land use mix (LUM) spaces from the perspective of residents’ daily lives, thereby activating 24 h urban vitality. This study’s expansion on previous studies is mainly reflected in two aspects: (1) it places greater emphasis on residents’ life experiences; (2) it highlights the round-the-clock nature of urban vitality. Regarding the first point, past urban studies have predominantly focused on the physical layout of urban infrastructure, which is inherently linked to China’s institutional context. China’s unique land finance system and GDP-driven system have strongly influenced local government behavior, prompting them to prioritize large-scale infrastructure projects for high economic growth, thus overlooking residents’ interests. For instance, the 4 trillion plan in the 21st century encouraged local governments to heavily invest in transportation, urban infrastructure, and real estate [78]. Although China’s current emphasis on new-type urbanization highlights citizen participation in national strategies, urban residents still primarily engage in urban life as passive “subjects of management” [79]. By integrating “coordination” into the LUM framework, our study has demonstrated its positive impact on enhancing urban vitality, illustrating that considering residents’ subjective preferences is crucial for constructing dynamic and livable cities. Regarding the second point, we reaffirm the significance of time for daily life. Existing studies predominantly focus on the static vitality of cities, overlooking the temporal attributes of vitality. Time is crucial for daily life as it constitutes an integral part of social institutions. For example, work commuting hours—a social and institutional arrangement—largely determine people’s life rhythms [
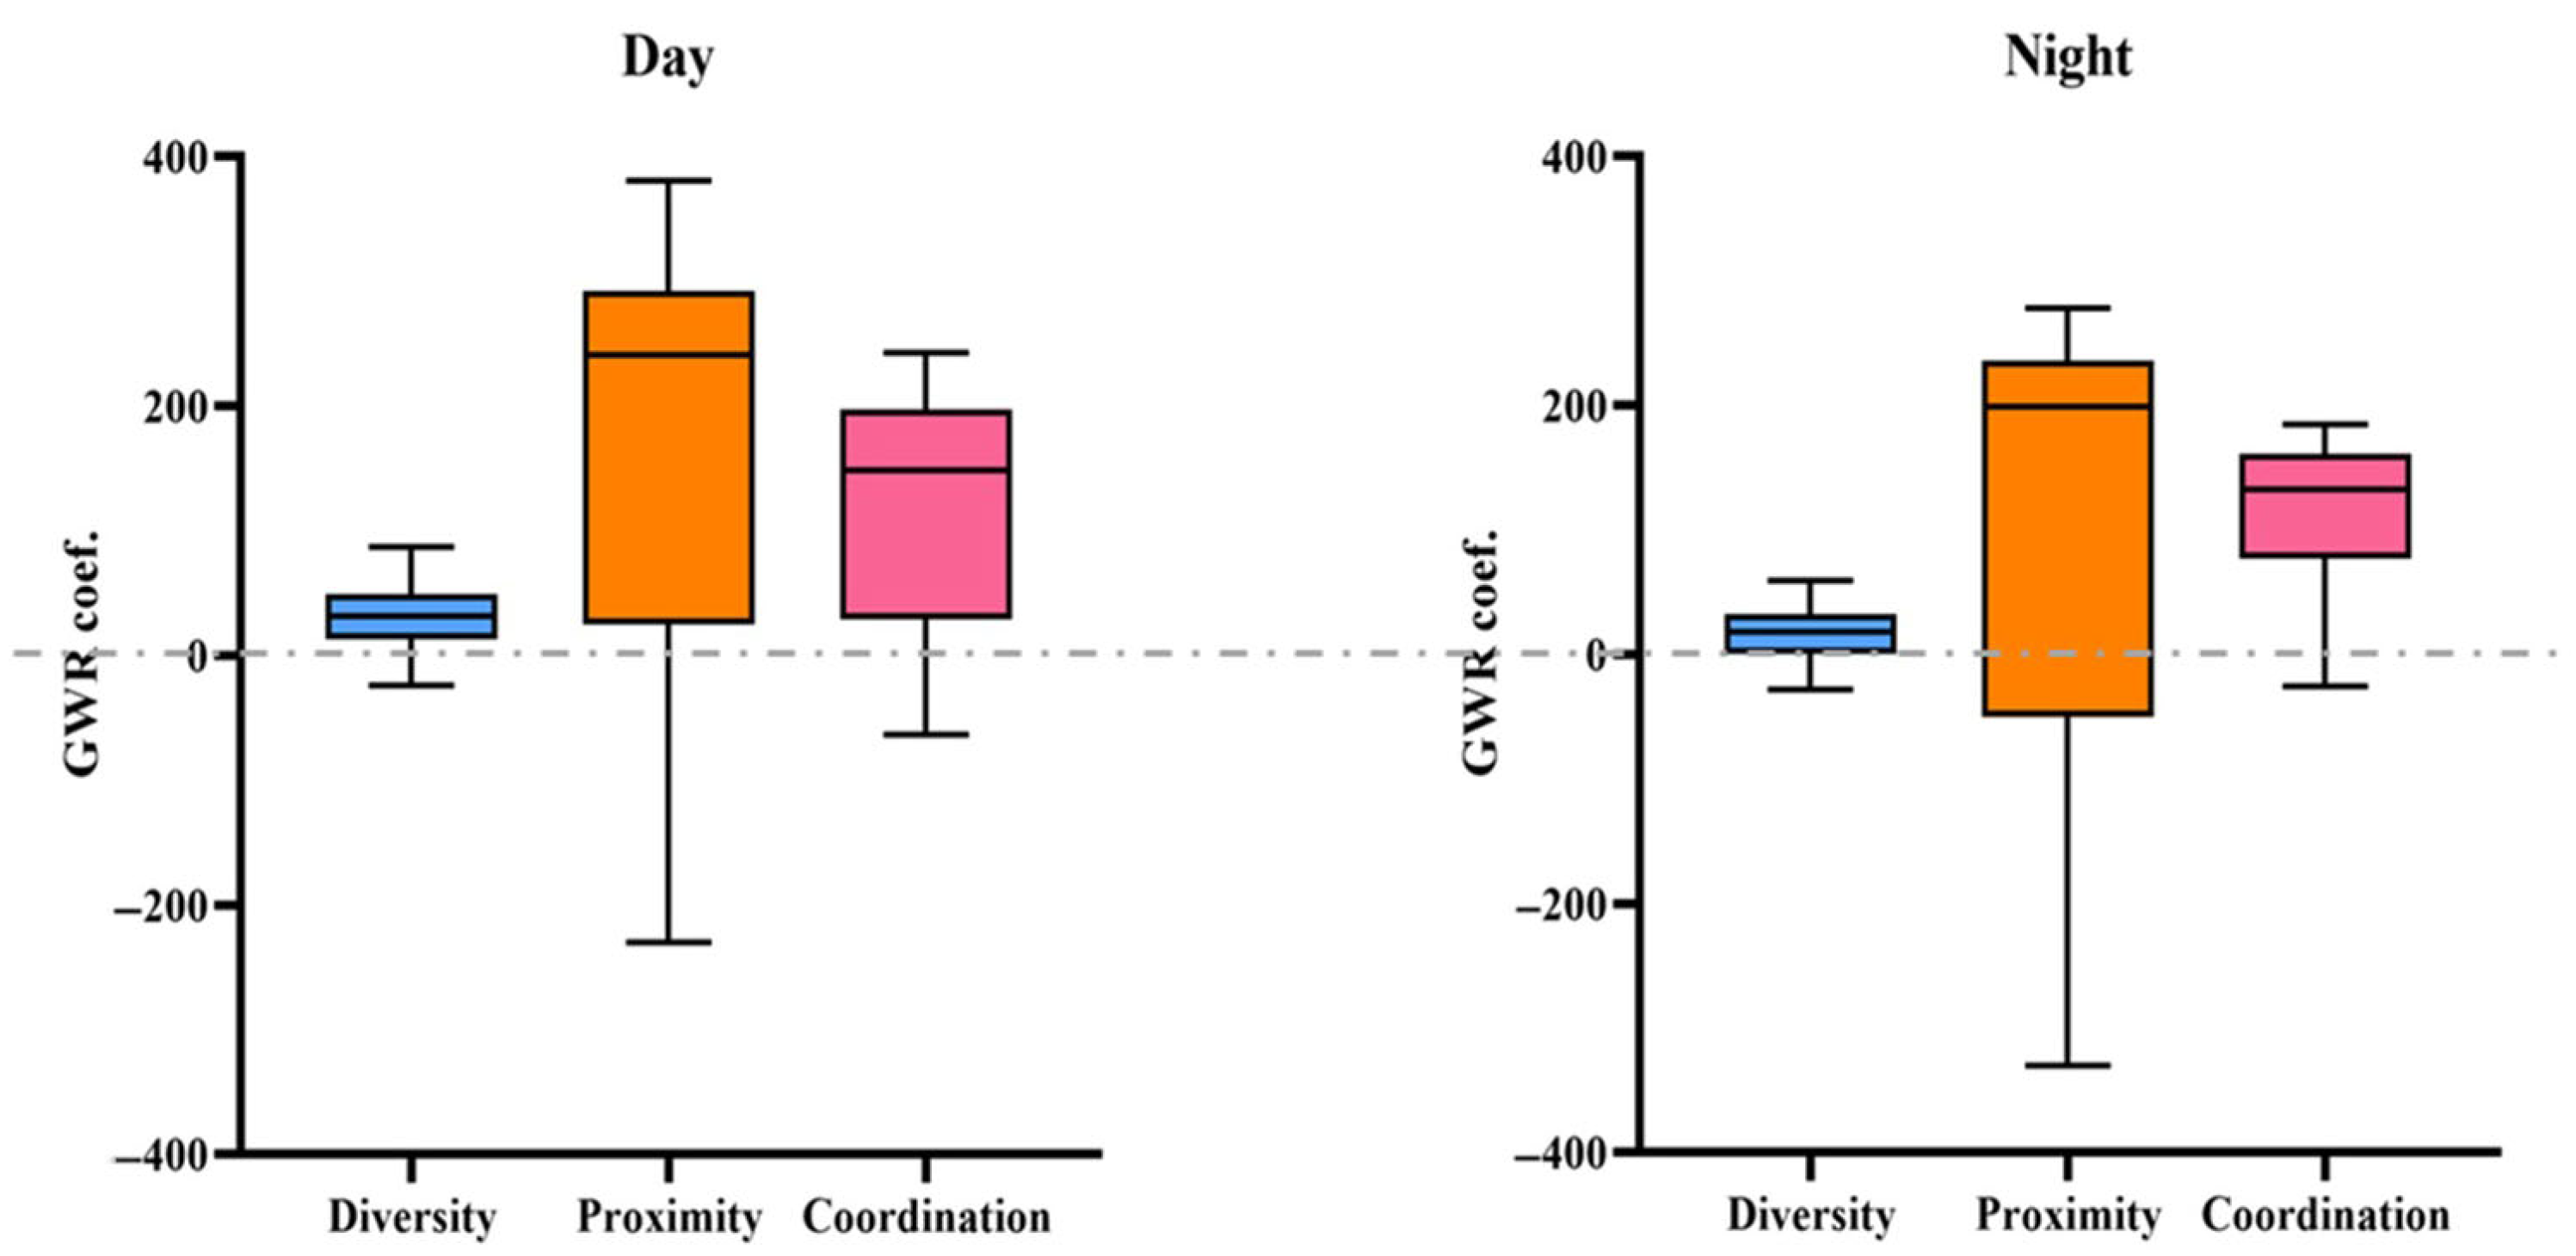
80]. Past research has largely ignored this aspect; hence, there has been minimal exploration of nighttime vitality. In fact, cities worldwide, such as the “24 Hour London” concept introduced by Sadiq Aman Khan in 2016 and Shanghai’s nighttime economy, are now advocating for the importance of nighttime periods. From the perspective of enhancing nighttime vitality, this study has demonstrated the need to pay special attention to coordination in land use mix (LUM). The primary reason for this phenomenon lies in the particularity of time under social institutional arrangements: daytime vitality relies on the “passive aggregation” of commuter flows, while nighttime vitality depends on residents’ “active choices”, requiring mutual coordination among residential, recreational, and leisure functions. This research conclusion aligns with Pan’s case survey, showing that nighttime vitality does not depend on the number of facilities but on whether these facilities can meet residents’ needs. One example is the formation of attractive spaces by combining shops, parks, residential buildings, and entertainment streets, etc. [81].
Secondly, it is necessary to avoid one-size-fits-all spatial planning policies, and LUM implementation plans must be formulated in combination with the status of each region. By comparing the proximity with high-vitality areas, we find that there is a certain degree of mismatching between them. The area with high proximity is mainly located in Yongjiang Science and Innovation Park (the street-like area above the Sanjiangkou); correspondingly, the block vitality of this area is basically at a medium or low–medium level. Yongjiang Science and Innovation Park is a comprehensive innovation park started in Ningbo City in 2022. Its main function is scientific and technological innovation and the integration of production and research. Since the park is in the early stage of construction and lacks infrastructure, the continuous introduction of medical, educational, and transportation facilities can form scale effects and better meet the needs of local enterprises and staff. Correspondingly, mixed diversity plays a significant role in promoting the vitality of blocks in this area. This means that in the early stage of development, the intensity of regional infrastructure construction is more important to enhance the attractiveness of the place. Correspondingly, it can be observed that LUM coordination has the most significant effect on enhancing the vitality of old urban areas, as coordination particularly emphasizes the balance of organizational structures within the LUM system. This mirrors China’s urbanization path at the regional level: an initial pursuit of quantitative growth followed by a later focus on readjusting internal structures [18].
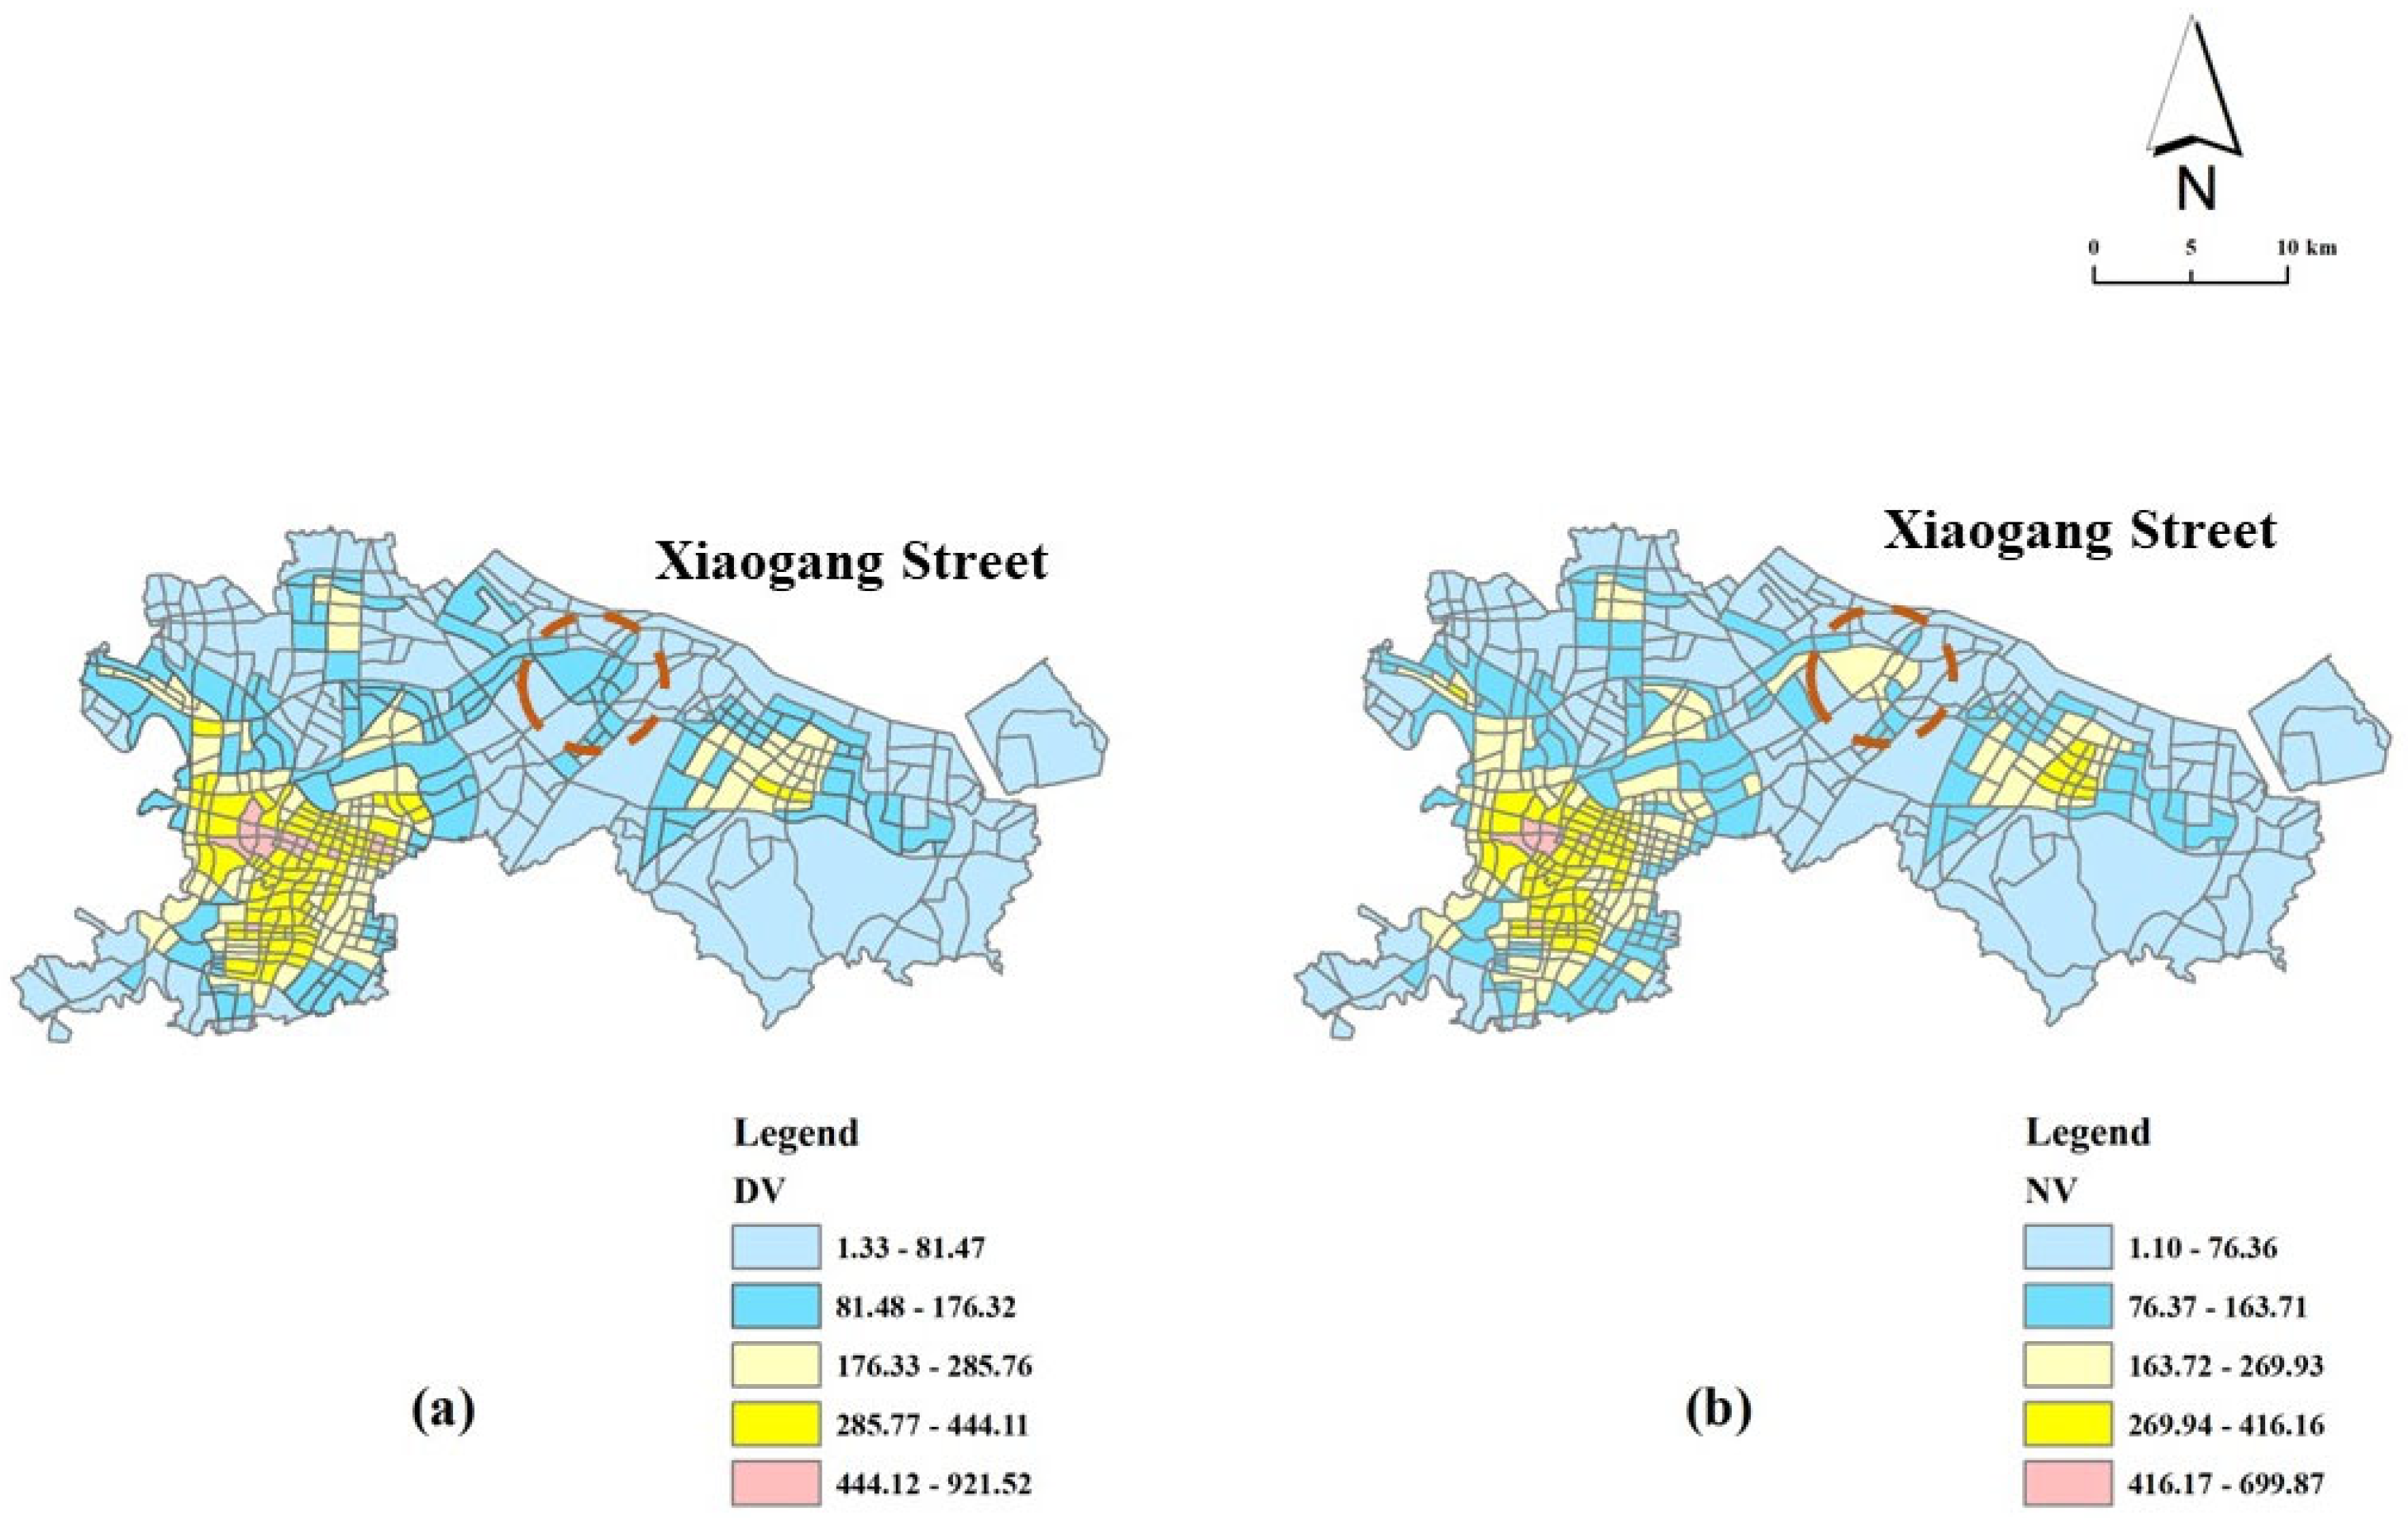
Our research findings also resonate strongly with important contemporary urban planning principles. First, the research findings seem to indicate that, compared with the monocentric urban organizational form, polycentricity is more conducive to urban vitality. Urban expansion, accompanied by the negative externalities of agglomeration, has brought unprecedented pressures and challenges to cities. Reshaping urban spatial structures to improve urban quality of life is regarded as a beneficial attempt, in which the polycentric city, as a planning concept, has gained attention. It is considered to possess positive agglomeration externalities and is also socially, economically, and environmentally friendly [82]. Overall, the urban spatial structure of Ningbo still bears the distinct characteristics of a monocentric model, and the Sanjiangkou area maintains an absolute competitive edge over other parts of the city. However, it is undeniable that the city’s sub-centers have started to take shape and function; examples include Beilun New Town, in our study, and Xiaogang Street, reported in other research papers (a satellite town, though it has not been officially recognized by municipal authorities). It should be noted that sub-centers are essentially different from urban centers under traditional functional zoning (such as employment centers, residential centers, etc.), as sub-centers must implement LUM schemes. Escamilla has particularly emphasized the importance of LUM for an urban center to attract crowds, encourage human mobility, and retain it [83]. Our research has preliminarily confirmed this: while some urban sub-centers (such as Beilun and Xiaogang Street) lack optimal LUM diversity, proximity, and coordination, they have begun to significantly influence the vitality of these areas. Thus, for urban vitality, a polycentric spatial organization may be preferable, as it provides the conditions for the positive externalities of the urban built environment, such as LUM, to come into play.
This study also resonates with another contemporary urban planning concept, namely the 15 min city. Compared to the polycentric model, 15 min city planning addresses a smaller scale, which is closely associated with blocks and neighborhoods and thus has a closer connection with people. The concept of the 15 min city was proposed by Carlos Moreno, who presented an ideal for urban planning: constructing more human-centered urban structures through rational spatial planning while maintaining urban resilience, vitality, and sustainability. He particularly emphasized a planning principle based on proximity, meaning that people should be able to access public services, leisure, entertainment, and various daily necessities within a 15 min walk or bicycle ride [58]. This design idea shares a high degree of consistency with LUM at the block level and is both rooted in humanism and oriented toward residents’ daily needs. This study finds that the LUM model, which emphasizes resident preferences, land use system balance, and proximity, significantly enhances urban vitality—a finding that demonstrates deep resonance with the 15 min city concept. The 15 min city advocates for proximal layouts of residential, commercial, and public services at micro-scales like blocks and neighborhoods to meet residents’ daily needs. Its planning logic, centered on walkability, essentially optimizes residents’ daily activity networks, reduces commuting costs, and thereby enhances block vitality, which is highly consistent with the objectives of LUM. Furthermore, the 15 min city’s close connection to residents verifies this study’s finding that “meeting resident preferences is key to enhancing vitality”—by creating convenient and human-centered living scenarios, it stimulates residents’ enthusiasm for participating in various activities. Moreover, this planning concept can be deeply integrated with the polycentric model. Future urban planning could adopt a nested system of “macro-structure (polycentric city)–meso-network (15 min city)–micro-unit (block)” to achieve a systematic enhancement of overall urban vitality [84].
The three-dimensional evaluation system of LUM proposed in this study, especially the “coordination” indicator, provides a quantitative tool for the “people-oriented” planning concept and may provide the following useful references for urban managers: Firstly, in terms of cultivating urban vitality, urban managers should pay attention to the use of mixed land use strategies and the design of reasonable urban forms, including the size of residential areas, the layout of roads, and the collocation of green spaces. Secondly, in terms of changes in the land management concept, although land use mix is considered by many planners to be an important strategy to improve vitality, mixed land use is not simply the diversification of land use. Urban designers should pay more attention to the accessibility of various facilities and their importance to residents’ lives. Finally, it is important to design land use mix schemes according to local conditions. For new areas that are yet to be developed, it is still an effective strategy to increase investment in facilities, including the construction of industrial and residential spaces, public services, land, and commercial facilities, so as to provide a more solid environment foundation for region’s vitality. For old towns with complete facilities, more attention should be paid to the coordination between facilities. Walking behavior can be promoted through a well-designed network of blocks. At the same time, old facilities can be replaced according to public preference, so as to improve the utilization rate of facilities in the block and finally improve the vitality of the city [85]. The influence of LUM degree on urban vitality discovered in this study can provide strategies for guiding urban development and adapting to urban transformation. Therefore, in future urban development planning, in cities in developing countries with rapid urbanization, the planning of new districts can draw on the conclusions of this study and focus on the construction of the diversity and proximity foundation of LUM. In cities in developed countries that are facing contraction or transformation, specific areas can be activated by optimizing the LUM ‘coordination’ of the existing built environment.
However, due to the limitations of the study data and the ability of the researchers, there is a lot of room for improvement. First of all, under the permission of data conditions, the full-cycle dynamic data, including urban vitality, POIs, roads and buildings, should be collected to achieve a dynamic monitoring and management of urban vitality. Second, this study is based on Ningbo, a newly designated first-tier city in China with a population exceeding 9 million and an extensive infrastructure, yet many cities in China—particularly those in Central and Western regions—remain underdeveloped, and urban vitality may exhibit distinct responses to LUM. A notable example is the heterogeneity in the LUM–urban vitality relationship observed in Ningbo’s Sanjiangkou (a well-developed area with complete facilities) and Yongjiang Science and Innovation Park (a newly emerging underdeveloped zone), implying that this nexus varies across cities—though multi-case comparisons were not incorporated in this study. It is particularly noteworthy that future research could classify cities by integrating urban resource endowments and human living habits (e.g., preferences for comfortable climates). For instance, in tourism-dependent cities, population dynamics are substantially governed by seasonal patterns: many residents of Southern China migrate to northern regions in summer to escape the heat, while northern cities like Harbin and those in Liaoning Province, enabled by their cold climates, develop ice–snow industries [86]. The summer influx of southern visitors triggers pronounced seasonal fluctuations in urban vitality, which, moreover, highlights the importance of LUM types. Future studies with robust data support could explore how specific LUM types (e.g., ice–snow land uses) influence urban vitality. Such analyses would undoubtedly foster a more comprehensive understanding of urban vitality and inform tailored LUM strategies, yet data constraints and research scope precluded this inquiry in the present study. Third, although this study attempts to introduce public awareness of land use mix to build a bridge between urban land and residents, it is only a preliminary attempt. Future research should consider establishing a comprehensive indicator system for human–land coordination in terms of multiple dimensions, including urban characteristics, individual resident traits, and even economic, social, and political institutions to deepen the understanding between LUM and urban vitality. Forth, our study preliminarily found that the vitality of different urban areas, such as new and old urban areas, cemetery areas, and science and innovation areas, has different responses to the mixed use of land. Future studies can further diagnose the deep mechanisms affecting urban vitality by taking the idea of zoning research and combining it with field research.

5. Conclusions

On the basis of multi-source data fusion, the OLS and geographically weighted regression models were used to explore the influence of urban land use mix on urban vitality. Our research led to the following conclusions: (1) The vitality of the central urban area of Ningbo is unevenly distributed. Like many cities in China, the vitality pole of Ningbo is located in the old urban area (Sanjiangkou), while the vitality of the newly developed area (such as the Beilun urban area and Yongjiang Science and Technology Innovation Park, etc.) is low. Future urban planning should strengthen the integration of the newly developed area and the old core area. (2) As for the pattern of mixed land use, the land use diversity of the whole area of Ningbo urban area is relatively balanced; only a few areas, such as the northern industrial zone and the southern cemetery area, are single land use forms. The mixed proximity shows obvious center–edge characteristics, and areas near the Sanjiangkou and Beilun urban areas have high proximity. Mixed coordination is highest in the area surrounding the city core (rather than within the city core). (3) Compared with OLS, the GWR model can better estimate the effects of various factors on urban vitality. This study focuses on the spatial heterogeneity of the effects of mixed land use on urban vitality, and the results show that the effects of mixed land use on urban vitality are spatially non-stationary. In addition, this study also found that land use mix has different effects on urban vitality during the day and at night, and mixed coordination is better for improving nighttime vitality. In addition to mixed land use, the size of blocks, the road network and traffic conditions, and population density are also important factors affecting urban vitality. (4) In the context of new urbanization, the connotation of mixed land use can no longer be summarized only by land use diversity. Proximity and accessibility and the relative importance of land types to residents’ daily life are more important factors. (5) Land use mix strategies can effectively enhance urban vitality but should be combined with regional characteristics. The coordination of land use is the key to affecting the urban vitality of old towns, while diversity and proximity have a more obvious impact on the urban vitality of newly developed areas. Therefore, policymakers and planners should selectively use mixed land use schemes combing regional characteristics.

Author Contributions

Conceptualization, Y.Z. and G.L.; data curation, H.H.; methodology, H.H. and Y.Z.; software, H.H.; validation, Y.Z. and G.L.; formal analysis, G.L.; investigation, H.H.; resources, H.H. and Y.Z.; writing—original draft preparation, Y.Z. and H.H.; writing—review and editing, G.L. All authors have read and agreed to the published version of the manuscript.

Funding

This research was funded by the Zhejiang Provincial Social Science Foundation of China (Grant No. 22NDJC068YB, Grant No. 25NDJC036YB), the National Natural Science Foundation of China (NSFC No 42171254), and the Natural Science Foundation of Ningbo Municipality (Grant No. 2022J112, Grant No. 2023J097).

Data Availability Statement

The data presented in this study are available on request from the corresponding author. The data are not publicly available due to the necessity of further research and the potential for increased publication opportunities by retaining the data.

Acknowledgments

We are grateful to the editors and the anonymous reviewers for their constructive guidance.

Conflicts of Interest

The authors declare no conflicts of interest.

References

  1. Yigitcanlar, T.; Teriman, S. Rethinking Sustainable Urban Development: Towards an Integrated Planning and Development Process. Int. J. Environ. Sci. Technol. 2015, 12, 341–352. [Google Scholar] [CrossRef]
  2. Ewing, R.; Hamidi, S.; Tian, G.; Proffitt, D.; Tonin, S.; Fregolent, L. Testing Newman and Kenworthy’s Theory of Density and Automobile Dependence. J. Plan. Educ. Res. 2018, 38, 167–182. [Google Scholar] [CrossRef]
  3. Brøgger, D. Unequal Urban Rights: Critical Reflections on Property and Urban Citizenship. Urban Stud. 2019, 56, 2977–2992. [Google Scholar] [CrossRef]
  4. Kuddus, M.A.; Tynan, E.; McBryde, E. Urbanization: A Problem for the Rich and the Poor? Public Health Rev. 2020, 41, 1. [Google Scholar] [CrossRef] [PubMed]
  5. Putnam, R.D. Bowling Alone: America’s Declining Social Capital. In The City Reader; Routledge: Oxfordshire, UK, 2015; pp. 188–196. [Google Scholar]
  6. Sharifi, A.; Khavarian-Garmsir, A.R. The COVID-19 Pandemic: Impacts on Cities and Major Lessons for Urban Planning, Design, and Management. Sci. Total Environ. 2020, 749, 142391. [Google Scholar] [CrossRef] [PubMed]
  7. McCormick, K.; Anderberg, S.; Coenen, L.; Neij, L. Advancing Sustainable Urban Transformation. J. Clean. Prod. 2013, 50, 1–11. [Google Scholar] [CrossRef]
  8. Ma, Q.; Shi, F. New Urbanization and High-Quality Urban and Rural Development: Based on the Interactive Coupling Analysis of Industrial Green Transformation. Ecol. Indic. 2023, 156, 111044. [Google Scholar] [CrossRef]
  9. Kabisch, S.; Koch, F.; Gawel, E.; Haase, A.; Knapp, S.; Krellenberg, K.; Nivala, J.; Zehnsdorf, A. Urban Transformations; Springer: Cham, Switzerland, 2018. [Google Scholar]
  10. United Nations. Transforming Our World: The 2030 Agenda for Sustainable Development; United Nations: New York, NY, USA, 2015; A/RES/70/1. [Google Scholar]
  11. Brenner, N. Implosions/Explosions; Jovis Verlag GmbH: Berlin, Germany, 2014. [Google Scholar]
  12. Chen, Y.; Yu, B.; Shu, B.; Yang, L.; Wang, R. Exploring the Spatiotemporal Patterns and Correlates of Urban Vitality: Temporal and Spatial Heterogeneity. Sustain. Cities Soc. 2023, 91, 104440. [Google Scholar] [CrossRef]
  13. Montgomery, J. Making a City: Urbanity, Vitality and Urban Design. J. Urban Des. 1998, 3, 93–116. [Google Scholar] [CrossRef]
  14. Freire, M.; Stren, R.E. The Challenge of Urban Government: Policies and Practices; World Bank Publications: Washington, DC, USA, 2001; ISBN 0-8213-4738-1. [Google Scholar]
  15. Caprotti, F.; Cowley, R.; Datta, A.; Broto, V.C.; Gao, E.; Georgeson, L.; Herrick, C.; Odendaal, N.; Joss, S. The New Urban Agenda: Key Opportunities and Challenges for Policy and Practice. Urban Res. Pract. 2017, 10, 367–378. [Google Scholar] [CrossRef]
  16. Batty, M. Empty Buildings, Shrinking Cities and Ghost Towns; SAGE Publications Sage UK: London, UK, 2016; Volume 43, pp. 3–6. ISBN 0265-8135. [Google Scholar]
  17. Liu, J.; Yang, L. The Risk of China’s Urbanization and Governance Transformation. Chin. Public Adm. 2014, 4, 45–50. [Google Scholar]
  18. Wang, X.-R.; Hui, E.C.-M.; Choguill, C.; Jia, S.-H. The New Urbanization Policy in China: Which Way Forward? Habitat Int. 2015, 47, 279–284. [Google Scholar] [CrossRef]
  19. Jacobs, J. Death and Life of Great American Cities, 1961; The Yale Law Journal Company, Inc.: New Haven, CT, USA, 1992. [Google Scholar]
  20. Lynch, K. Good City Form; MIT Press: Cambridge, MA, USA, 1984; ISBN 0-262-62046-4. [Google Scholar]
  21. Jin, X.; Long, Y.; Sun, W.; Lu, Y.; Yang, X.; Tang, J. Evaluating Cities’ Vitality and Identifying Ghost Cities in China with Emerging Geographical Data. Cities 2017, 63, 98–109. [Google Scholar] [CrossRef]
  22. Yue, W.; Chen, Y.; Zhang, Q.; Liu, Y. Spatial Explicit Assessment of Urban Vitality Using Multi-Source Data: A Case of Shanghai, China. Sustainability 2019, 11, 638. [Google Scholar] [CrossRef]
  23. Gan, X.; Huang, L.; Wang, H.; Mou, Y.; Wang, D.; Hu, A. Optimal Block Size for Improving Urban Vitality: An Exploratory Analysis with Multiple Vitality Indicators. J. Urban Plan. Dev. 2021, 147, 04021027. [Google Scholar] [CrossRef]
  24. Jia, C.; Liu, Y.; Du, Y.; Huang, J.; Fei, T. Evaluation of Urban Vibrancy and Its Relationship with the Economic Landscape: A Case Study of Beijing. ISPRS Int. J. Geo-Inf. 2021, 10, 72. [Google Scholar] [CrossRef]
  25. De Nadai, M.; Staiano, J.; Larcher, R.; Sebe, N.; Quercia, D.; Lepri, B. The Death and Life of Great Italian Cities: A Mobile Phone Data Perspective. In Proceedings of the Proceedings of the 25th International Conference on World Wide Web, Montréal, QC, Canada, 11–15 April 2016; pp. 413–423. [Google Scholar]
  26. Ouyang, J.; Fan, H.; Wang, L.; Zhu, D.; Yang, M. Revealing Urban Vibrancy Stability Based on Human Activity Time-Series. Sustain. Cities Soc. 2022, 85, 104053. [Google Scholar] [CrossRef]
  27. Gülden Demet, O.; Giritlioğlu, C. The Evaluation of Urban Quality and Vitality of the Istanbul Historical Peninsula-Eminönü District. Evaluation 2008, 5, 97–117. [Google Scholar]
  28. Zeng, P.; Wei, M.; Liu, X. Investigating the Spatiotemporal Dynamics of Urban Vitality Using Bicycle-Sharing Data. Sustainability 2020, 12, 1714. [Google Scholar] [CrossRef]
  29. Cervero, R.; Kockelman, K. Travel Demand and the 3Ds: Density, Diversity, and Design. Transp. Res. Part Transp. Environ. 1997, 2, 199–219. [Google Scholar] [CrossRef]
  30. Ewing, R.; Cervero, R. Travel and the Built Environment: A Meta-Analysis. J. Am. Plann. Assoc. 2010, 76, 265–294. [Google Scholar] [CrossRef]
  31. Sung, H.; Lee, S. Residential Built Environment and Walking Activity: Empirical Evidence of Jane Jacobs’ Urban Vitality. Transp. Res. Part Transp. Environ. 2015, 41, 318–329. [Google Scholar] [CrossRef]
  32. Deng, C.; Ma, J. Viewing Urban Decay from the Sky: A Multi-Scale Analysis of Residential Vacancy in a Shrinking US City. Landsc. Urban Plan. 2015, 141, 88–99. [Google Scholar] [CrossRef]
  33. Zhang, A.; Li, W.; Wu, J.; Lin, J.; Chu, J.; Xia, C. How Can the Urban Landscape Affect Urban Vitality at the Street Block Level? A Case Study of 15 Metropolises in China. Environ. Plan. B Urban Anal. City Sci. 2021, 48, 1245–1262. [Google Scholar] [CrossRef]
  34. Yang, Y. Land Use Density, Land Use Mix, and Walking: Insight from a Simple Theoretical Model. medRxiv 2023. [Google Scholar] [CrossRef]
  35. Ye, Y.; Li, D.; Liu, X. How Block Density and Typology Affect Urban Vitality: An Exploratory Analysis in Shenzhen, China. Urban Geogr. 2018, 39, 631–652. [Google Scholar] [CrossRef]
  36. Xia, C.; Yeh, A.G.-O.; Zhang, A. Analyzing Spatial Relationships between Urban Land Use Intensity and Urban Vitality at Street Block Level: A Case Study of Five Chinese Megacities. Landsc. Urban Plan. 2020, 193, 103669. [Google Scholar] [CrossRef]
  37. Dong, L.; Zhang, L. Spatial Coupling Coordination Evaluation of Mixed Land Use and Urban Vitality in Major Cities in China. Int. J. Environ. Res. Public Health 2022, 19, 15586. [Google Scholar] [CrossRef] [PubMed]
  38. Ma, G.; Pellegrini, P.; Wu, H.; Han, H.; Wang, D.; Chen, J. Impact of Land-Use Mixing on the Vitality of Urban Parks: Evidence from Big Data Analysis in Suzhou, Yangtze River Delta Region, China. J. Urban Plan. Dev. 2023, 149, 04023045. [Google Scholar] [CrossRef]
  39. Wu, W.; Niu, X. Influence of Built Environment on Urban Vitality: Case Study of Shanghai Using Mobile Phone Location Data. J. Urban Plan. Dev. 2019, 145, 04019007. [Google Scholar] [CrossRef]
  40. Li, X.; Li, Y.; Jia, T.; Zhou, L.; Hijazi, I.H. The Six Dimensions of Built Environment on Urban Vitality: Fusion Evidence from Multi-Source Data. Cities 2022, 121, 103482. [Google Scholar] [CrossRef]
  41. Nabil, N.A.; Abd Eldayem, G.E. Influence of Mixed Land-Use on Realizing the Social Capital. HBRC J. 2015, 11, 285–298. [Google Scholar] [CrossRef]
  42. Lai, K.Y.; Webster, C.; Kumari, S.; Sarkar, C. The Nature of Cities and the Covid-19 Pandemic. Curr. Opin. Environ. Sustain. 2020, 46, 27–31. [Google Scholar] [CrossRef] [PubMed]
  43. Jiang, Y.; Zhang, Y.; Liu, Y.; Huang, Z. A Review of Urban Vitality Research in the Chinese World. Trans. Urban Data Sci. Technol. 2023, 2, 81–99. [Google Scholar] [CrossRef]
  44. Lu, S.; Shi, C.; Yang, X. Impacts of Built Environment on Urban Vitality: Regression Analyses of Beijing and Chengdu, China. Int. J. Environ. Res. Public Health 2019, 16, 4592. [Google Scholar] [CrossRef] [PubMed]
  45. Whittemore, A.H.; BenDor, T.K. Talking about Density: An Empirical Investigation of Framing. Land Use Policy 2018, 72, 181–191. [Google Scholar] [CrossRef]
  46. Liu, X.; Long, Y. Automated Identification and Characterization of Parcels with OpenStreetMap and Points of Interest. Environ. Plan. B Plan. Des. 2016, 43, 341–360. [Google Scholar] [CrossRef]
  47. Long, Y.; Huang, C.C. Does Block Size Matter? The Impact of Urban Design on Economic Vitality for Chinese Cities. Environ. Plan. B Urban Anal. City Sci. 2019, 46, 406–422. [Google Scholar] [CrossRef]
  48. Li, Q.; Cui, C.; Liu, F.; Wu, Q.; Run, Y.; Han, Z. Multidimensional Urban Vitality on Streets: Spatial Patterns and Influence Factor Identification Using Multisource Urban Data. ISPRS Int. J. Geo-Inf. 2021, 11, 2. [Google Scholar] [CrossRef]
  49. Lv, G.; Zheng, S.; Hu, W. Exploring the Relationship between the Built Environment and Block Vitality Based on Multi-Source Big Data: An Analysis in Shenzhen, China. Geomat. Nat. Hazards Risk 2022, 13, 1593–1613. [Google Scholar] [CrossRef]
  50. Dong, Q.; Cai, J.; Chen, S.; He, P.; Chen, X. Spatiotemporal Analysis of Urban Green Spatial Vitality and the Corresponding Influencing Factors: A Case Study of Chengdu, China. Land 2022, 11, 1820. [Google Scholar] [CrossRef]
  51. He, S.; Zhang, Z.; Yu, S.; Xia, C.; Tung, C.-L. Investigating the Effects of Urban Morphology on Vitality of Community Life Circles Using Machine Learning and Geospatial Approaches. Appl. Geogr. 2024, 167, 103287. [Google Scholar] [CrossRef]
  52. Tu, W.; Zhu, T.; Xia, J.; Zhou, Y.; Lai, Y.; Jiang, J.; Li, Q. Portraying the Spatial Dynamics of Urban Vibrancy Using Multisource Urban Big Data. Comput. Environ. Urban Syst. 2020, 80, 101428. [Google Scholar] [CrossRef]
  53. Wu, C.; Zhao, M.; Ye, Y. Measuring Urban Nighttime Vitality and Its Relationship with Urban Spatial Structure: A Data-Driven Approach. Environ. Plan. B Urban Anal. City Sci. 2023, 50, 130–145. [Google Scholar] [CrossRef]
  54. Yue, Y.; Zhuang, Y.; Yeh, A.G.; Xie, J.-Y.; Ma, C.-L.; Li, Q.-Q. Measurements of POI-Based Mixed Use and Their Relationships with Neighbourhood Vibrancy. Int. J. Geogr. Inf. Sci. 2017, 31, 658–675. [Google Scholar] [CrossRef]
  55. Zhuo, Y.; Jing, X.; Wang, X.; Li, G.; Xu, Z.; Chen, Y.; Wang, X. The Rise and Fall of Land Use Mix: Review and Prospects. Land 2022, 11, 2198. [Google Scholar] [CrossRef]
  56. Song, Y.; Merlin, L.; Rodriguez, D. Comparing Measures of Urban Land Use Mix. Comput. Environ. Urban Syst. 2013, 42, 1–13. [Google Scholar] [CrossRef]
  57. Handy, S.L.; Boarnet, M.G.; Ewing, R.; Killingsworth, R.E. How the Built Environment Affects Physical Activity: Views from Urban Planning. Am. J. Prev. Med. 2002, 23, 64–73. [Google Scholar] [CrossRef] [PubMed]
  58. Moreno, C.; Allam, Z.; Chabaud, D.; Gall, C.; Pratlong, F. Introducing the “15-Minute City”: Sustainability, Resilience and Place Identity in Future Post-Pandemic Cities. Smart Cities 2021, 4, 93–111. [Google Scholar] [CrossRef]
  59. Zheng, H.; Zhuo, Y.; Xu, Z.; Wu, C.; Huang, J.; Fu, Q. Measuring and Characterizing Land Use Mix Patterns of China’s Megacities: A Case Study of Shanghai. Growth Chang. 2021, 52, 2509–2539. [Google Scholar] [CrossRef]
  60. Tian, L.; Liang, Y.; Zhang, B. Measuring Residential and Industrial Land Use Mix in the Peri-Urban Areas of China. Land Use Policy 2017, 69, 427–438. [Google Scholar] [CrossRef]
  61. Zhuo, Y.; Zheng, H.; Wu, C.; Xu, Z.; Li, G.; Yu, Z. Compatibility Mix Degree Index: A Novel Measure to Characterize Urban Land Use Mix Pattern. Comput. Environ. Urban Syst. 2019, 75, 49–60. [Google Scholar] [CrossRef]
  62. Zhao, W.; Li, Q.; Li, B. Extract Hierarchical Landmarks Using Urban POI Data. J. Remote Sens. 2011, 15, 973–988. [Google Scholar]
  63. Zhang, J.; Yuan, Y.; Zhou, M.; Yang, Y.; Zhu, L. Research on Fine Identification and Distribution Characteristics of Street Types Based on POI: A Case Study of the Main Urban Area of Fuzhou. J. Xi Univ. Archit. Technol. Nat. Sci. Ed. 2022, 54, 406–413. [Google Scholar]
  64. Yang, M.; Gao, X.; Siddique, K.H.; Wu, P.; Zhao, X. Spatiotemporal Exploration of Ecosystem Service, Urbanization, and Their Interactive Coercing Relationship in the Yellow River Basin over the Past 40 Years. Sci. Total Environ. 2023, 858, 159757. [Google Scholar] [CrossRef] [PubMed]
  65. Doan, Q.C.; Ma, J.; Chen, S.; Zhang, X. Nonlinear and Threshold Effects of the Built Environment, Road Vehicles and Air Pollution on Urban Vitality. Landsc. Urban Plan. 2025, 253, 105204. [Google Scholar] [CrossRef]
  66. Tolan, J.; Yang, H.-I.; Nosarzewski, B.; Couairon, G.; Vo, H.V.; Brandt, J.; Spore, J.; Majumdar, S.; Haziza, D.; Vamaraju, J. Very High Resolution Canopy Height Maps from RGB Imagery Using Self-Supervised Vision Transformer and Convolutional Decoder Trained on Aerial Lidar. Remote Sens. Environ. 2024, 300, 113888. [Google Scholar] [CrossRef]
  67. Chen, Y.; Xu, C.; Ge, Y.; Zhang, X.; Zhou, Y. A 100 m Gridded Population Dataset of China’s Seventh Census Using Ensemble Learning and Big Geospatial Data. Earth Syst. Sci. Data 2024, 16, 3705–3718. [Google Scholar] [CrossRef]
  68. Getis, A. A History of the Concept of Spatial Autocorrelation: A Geographer’s Perspective. Geogr. Anal. 2008, 40, 297–309. [Google Scholar] [CrossRef]
  69. Fotheringham, A.S.; Brunsdon, C.; Charlton, M. Geographically Weighted Regression. Sage Handb. Spat. Anal. 2009, 1, 243–254. [Google Scholar]
  70. Al-Shaar, W.; Bonin, O.; de Gouvello, B.; Chatellier, P.; Hendel, M. Geographically Weighted Regression-Based Predictions of Water–Soil–Energy Nexus Solutions in Île-de-France. Urban Sci. 2022, 6, 81. [Google Scholar] [CrossRef]
  71. Li, S.; Zhou, C.; Wang, S.; Gao, S.; Liu, Z. Spatial Heterogeneity in the Determinants of Urban Form: An Analysis of Chinese Cities with a GWR Approach. Sustainability 2019, 11, 479. [Google Scholar] [CrossRef]
  72. Jin, A.; Ge, Y.; Zhang, S. Spatial Characteristics of Multidimensional Urban Vitality and Its Impact Mechanisms by the Built Environment. Land 2024, 13, 991. [Google Scholar] [CrossRef]
  73. Xia, C.; Zhang, A.; Yeh, A.G. The Varying Relationships between Multidimensional Urban Form and Urban Vitality in Chinese Megacities: Insights from a Comparative Analysis. Ann. Am. Assoc. Geogr. 2022, 112, 141–166. [Google Scholar] [CrossRef]
  74. Alonso, W. Location and Land Use: Toward a General Theory of Land Rent. Harv. Univ. Press Google Sch. 1964, 2, 16–22. [Google Scholar]
  75. Capozza, D.R.; Helsley, R.W. The Fundamentals of Land Prices and Urban Growth. In The Economics of Land Use; Routledge: Oxfordshire, UK, 2017; pp. 183–194. [Google Scholar]
  76. Fang, C.; He, S.; Wang, L. Spatial Characterization of Urban Vitality and the Association with Various Street Network Metrics from the Multi-Scalar Perspective. Front. Public Health 2021, 9, 677910. [Google Scholar] [CrossRef] [PubMed]
  77. Duncan, M.J.; Winkler, E.; Sugiyama, T.; Cerin, E.; Dutoit, L.; Leslie, E.; Owen, N. Relationships of Land Use Mix with Walking for Transport: Do Land Uses and Geographical Scale Matter? J. Urban Health 2010, 87, 782–795. [Google Scholar] [CrossRef] [PubMed]
  78. Qin, Y. China’s Transport Infrastructure Investment: Past, Present, and Future. Asian Econ. Policy Rev. 2016, 11, 199–217. [Google Scholar] [CrossRef]
  79. Li, H.; de Jong, M. Citizen Participation in China’s Eco-City Development. Will ‘New-Type Urbanization’ Generate a Breakthrough in Realizing It? J. Clean. Prod. 2017, 162, 1085–1094. [Google Scholar] [CrossRef]
  80. Mulíček, O.; Osman, R.; Seidenglanz, D. Urban Rhythms: A Chronotopic Approach to Urban Timespace. Time Soc. 2015, 24, 304–325. [Google Scholar] [CrossRef]
  81. Pan, W.; Du, J. Impacts of Urban Morphological Characteristics on Nocturnal Outdoor Lighting Environment in Cities: An Empirical Investigation in Shenzhen. Build. Environ. 2021, 192, 107587. [Google Scholar] [CrossRef]
  82. Parr, J. The Polycentric Urban Region: A Closer Inspection. Reg. Stud. 2004, 38, 231–240. [Google Scholar] [CrossRef]
  83. Escamilla, J.M.; Cos, C.C.; Cárdenas, J.S. Contesting Mexico City’s Alleged Polycentric Condition through a Centrality-Mixed Land-Use Composite Index. Urban Stud. 2016, 53, 2380–2396. [Google Scholar] [CrossRef]
  84. Urrutia-Mosquera, J.; Flórez-Calderón, L.; Paredes, D. 15-Min Cities: The Potential of a Medium-Sized Polycentric Latin American City. J. Urban Health 2023, 100, 725–744. [Google Scholar] [CrossRef] [PubMed]
  85. Balsas, C.J. Exciting Walk-Only Precincts in Asia, Europe and North-America. Cities 2021, 112, 103129. [Google Scholar] [CrossRef]
  86. Sun, K.; Tian, X.; Xia, J.; Ou, M.; Tang, C. The Market Responses of Ice and Snow Destinations to Southerners’ Tourism Willingness: A Case Study from China. Sustainability 2023, 15, 13759. [Google Scholar] [CrossRef]
Figure 1. Study area.
Systems 13 00542 g001
Figure 2. Urban vitality during the day and night of Ningbo’s central urban area ((a). the daytime vitality (DV); (b). the nighttime vitality (NV)).
Systems 13 00542 g002
Figure 3. Spatial distribution of land use mix patterns in Ningbo.
Systems 13 00542 g003
Figure 4. GWR coefficient of land use mix.
Systems 13 00542 g004
Figure 5. Boxplot of regression coefficient.
Systems 13 00542 g005
Table 1. Data sources.
DataData SourceTime
Baidu HeatmapBaidu map2024
POI dataAmap2024
Road networksOpen Street Map2024
Administrative boundariesMNR.gov2024
Table 2. POI information.
POI TypesCountsPercentageAreaAwareness
CommercialFood services25,98816.56%100.46
Shopping services42,76927.25%150.25
Life services23,62515.05%100.1
Hotel services31692.02%100.33
Entertainment services25461.62%100.4
Sports and fitness services18421.17%100.74
Public ServiceScience and education73864.71%300.5
Medical services52703.36%200.62
Transportation services12,5578.0%150.3
JobCompanies21,08813.43%300.39
Factories and industrial parks17091.09%700.43
Insurance services24961.59%300.3
Office buildings11010.70%300.39
ResidentialResidential communities28891.84%800.3
Villa communities210.01%800.3
Dormitories12420.79%800.3
Green SpaceParks3510.22%950.6
Scenic spots9240.59%950.6
Sum 156,973100%
Table 3. Description of the study variables.
DimensionVariableDescription
Dependent variableDaytime vitalityAverage vitality of the block from 7:00 to 18:00
Nighttime vitalityAverage vitality of the block from 19:00 to 23:00
Independent variableDiversityThe diversity of POIs in the block
ProximityEase of access to POIs in the block
CoordinationThe comprehensive importance of POI to residents in a block
Control variableFacilities densityNumber of facilities in the block/block area
Block sizeArea of the block
Green indexThe average height of the tree canopy in the block [66]
Road network densityTotal length of the road network in the block/block area
Number of public transportation stopsTotal number of public transit and subway stations in the block
GDPAverage GDP of each block (Chinese Academy of Sciences, https://www.resdc.cn, accessed on 1 May 2025)
Population densityAverage data per block from the 7th Chinese census [67]
Table 4. VIF of each variable.
VariableVIF1/VIF
Diversity1.240.808
Proximity2.540.394
Coordination2.180.458
Block area1.800.556
Road network density1.530.654
Number of public bus and subway stops1.240.806
Facilities density1.460.683
Population density2.900.345
GDP1.370.728
Green index1.370.733
Mean VIF1.76
Table 5. OLS model regression results.
Model (1)Model (2)
VariableDVNV
Diversity50.57 ***34.48 ***
(14.73)(11.14)
Proximity300.2 ***232.0 ***
(33.02)(24.98)
Coordination69.18 **78.08 ***
(31.49)(23.82)
Block area−5.939 ***−5.400 ***
(1.351)(1.022)
Road network density0.00252 ***0.00120 **
(0.000768)(0.000581)
Number of transportation stations9.411 ***8.259 ***
(2.659)(2.012)
Facility density0.0422 *−0.0533 ***
(0.0228)(0.0173)
Population density0.988 ***0.763 ***
(0.0776)(0.0587)
GDP0.0003000.000471 ***
(0.000191)(0.000144)
Green space0.06030.0794 **
(0.0407)(0.0308)
Constant−26.4329.98 *
(20.96)(15.85)
Observations511511
R-squared0.7710.814
Standard errors in parentheses. *** p < 0.01, ** p < 0.05, * p < 0.10.
Table 6. Moran’s I test.
Izp-Value
Day Vitality0.79142.6320.000 ***
Night Vitality0.78041.9850.000 ***
Note: *** p < 0.01.
Table 7. Parameters of OLS model and GWR model.
Parameters/ModelsAICc R-Squared
DVNVDVNV
OLS5774.2675489.0980.7710.814
GWR5616.895383.260.8690.880
Disclaimer/Publisher’s Note: The statements, opinions and data contained in all publications are solely those of the individual author(s) and contributor(s) and not of MDPI and/or the editor(s). MDPI and/or the editor(s) disclaim responsibility for any injury to people or property resulting from any ideas, methods, instructions or products referred to in the content.

