Article

Research on Spatial–Temporal Coupling and Driving Factors of Regional Economic Resilience and Port Logistics: Empirical Evidence from Southern Guangxi, China

1
School of Economics and Management, Beibu Gulf University, Qinzhou 535011, China
2
Beibu Gulf Ocean Development Research Center, Qinzhou 535011, China
3
Department of Economics, University of Manchester, Booth St W, Manchester M13 9NX, UK
4
Beibu Gulf Research Institute of the New Land-Sea Corridor, Qinzhou 535011, China
*
Authors to whom correspondence should be addressed.
Systems 2025, 13(7), 524; https://doi.org/10.3390/systems13070524
Submission received: 14 May 2025 / Revised: 19 June 2025 / Accepted: 26 June 2025 / Published: 30 June 2025
(This article belongs to the Section Systems Practice in Social Science)

Abstract

Based on a comprehensive evaluation index system for regional economic resilience and port logistics development, this study employs multiple methodologies including coupling coordination degree model, kernel density estimation, gravity center model, spatial autocorrelation model, and geographic detector model to explore the spatial–temporal evolution patterns and driving factors of coupling coordination between regional economic resilience and port logistics in the Guangxi Beibu Gulf Economic Zone from 2012 to 2022. The results indicate that: (1) The coupling coordination degree between the two systems showed an upward trend during the study period, although with stage-specific bipolar differentiation that weakened in the later stages. (2) The spatial distribution pattern of coupling coordination evolved from a “single-core” driven by Nanning to a “dual-core” led by Nanning and Yulin, forming a distinct concentric layer structure; the gravity center of coupling coordination exhibited a “southeast–northwest” dynamic migration pattern. (3) Spatial autocorrelation analysis revealed significant positive spatial dependence of coupling coordination within the study area, with spatial agglomeration values showing a “core–transition–depression” differentiation pattern. (4) Information technology level emerged as the dominant driving factor, forming a “technology–finance–infrastructure” ternary collaborative driving model with financial development level and logistics infrastructure level, which became the main force promoting the coordinated development of the coupled systems.

1. Introduction

In the post-pandemic era, global industrial chains are undergoing rapid reorganization, exacerbated by unforeseen events such as the Russia–Ukraine conflict and US–China trade tensions. These concurrent challenges have tested the resilience of regional economic systems (Elsamadony et al., 2025; Xuebo et al., 2024) [1,2]. In this context, China’s southwestern region is accelerating the development of the New Western Land–Sea Corridor, actively promoting a “corridor community with a shared future” that links nations and territories along the Belt and Road Initiative (BRI) (Xu et al., 2024) [3]. This strategic initiative aims to enhance the region’s capacity to withstand external shocks.
A key component of this expansion is the Guangxi Beibu Gulf Economic Zone, which serves as both a gateway for the BRI’s outreach to ASEAN and a central fulcrum of the New Western Land–Sea Corridor (Feng et al., 2024) [4]. The vital role of its port logistics system is to facilitate the flow of trade between China and ASEAN (Banomyong et al., 2008) [5], and it is a major “driver” for improving regional economic resilience (Koray et al., 2025) [6]. Its international economic and trade exchanges are significantly impacted by the coordination imbalance between port logistics and economic resilience, which has been made worse by frequent shocks to the region’s economic system amid the ongoing “long-tail effects” of the COVID-19 pandemic and more volatile global risks (Chen and He, 2024; Zhang et al., 2021) [7,8].
Most of the current research in this area focuses on the functional links and joint assessment of regional economic growth and logistics sector development (Lean et al., 2014; Delfin-Ortega, 2025) [9]. Regional economic resilience and certain logistics components continue to receive little attention. Systematic research on port logistics—a critical component at maritime–land junctures—is especially deficient. Although some researchers have recognized the impact of port logistics on regional economic recovery (Yeon et al., 2024) [10], in-depth research of multi-scale spatial interactions, dynamic evolution patterns, and driving mechanisms between these two systems is still restricted. Recent studies have expanded this research domain, with Monios and Wilmsmeier (2022) [11] looking at how port systems contribute to regional economic resilience by facilitating trade continuity during crises, and Wang and Zhang (2023) [12] looking at the bidirectional effects of port logistics efficiency on urban economic adaptive capacity.
Therefore, it is essential to develop strategies that enhance regional economic system adaptive recovery, and transformational capacities under uncertain shocks by fostering synergistic development between economic resilience and port logistics. Systematically elucidating their spatial temporal evolution and the underlying drivers will strengthen the shock resistance of the Guangxi Beibu Gulf Economic Zone as a strategic node in the New Land–Sea Corridor. Moreover, these findings will provide insightful information for decision-makers for the Belt and Road Initiative on optimizing open-economy frameworks and configuring resilient logistics networks.
Based on the considerations above, this study aims to: (1) construct evaluation index systems for regional economic resilience and port logistics development level based on economic resilience theory and input–output theory, combined with existing research findings, and quantify their coordination level through a coupling coordination degree model; (2) building on this foundation, employ kernel density estimation to reveal the dynamic distribution characteristics of coupling coordination degree, combine gravity center model to track the evolution of spatial agglomeration directions, and supplement with spatial autocorrelation analysis to examine the agglomeration degree of coordination from both global and local spatial perspectives, thereby systematically analyzing the spatial–temporal evolution pathways of coupling coordination between regional economic resilience and port logistics in the Guangxi Beibu Gulf Economic Zone from 2012–2022; and (3) conduct in-depth analysis of the driving factors behind this spatial–temporal evolution, utilizing the geographic detector model to identify key driving factors and their interaction effects influencing the coupling between regional economic resilience and port logistics, with the aim of providing transferable development paradigms for underdeveloped coastal regions in formulating systematic coupling planning.
The remaining structure of this study is organized as follows: Section 2 reviews the literature on regional economic resilience and port logistics; Section 3 describes the study area, selected indicators, methodologies, and data sources; Section 4 presents the empirical results; and Section 5 and Section 6 provide discussion and conclusions with policy implications, respectively. The research framework of this paper is structured in Figure 1.

2. Literature Review and Theoretical Framework

2.1. Literature Review

Scholars both domestically and internationally have conducted in-depth discussions on regional economic resilience from perspectives of concept definition, quantitative measurement, and influencing factors. The concept of “resilience” originated from physics, defined as “the ability of an object to recover to its initial state after experiencing an external shock” (Martin and Sunley, 2015) [13]. Through the application and extension by scholars such as Reggiani and Graaff (2022) [14], this concept was gradually introduced into the field of economics, viewing regional economic resilience as the ability of regional economic systems to resist and recover to a stable state when facing uncertain external risks (Zhengyun et al., 2023) [15].
Building on this foundation, Martin (2012) [16] systematically summarized four dimensions for studying regional economic resilience: resistance capacity, recovery capacity, structural adaptation, and path innovation capacity, which has been further developed in subsequent studies (Yuling and Yuting, 2024) [17]. Empirical research on regional economic resilience has expanded widely, with early studies primarily focusing on developed regions in Europe and America driven by post-industrial structural crises (Cellini and Torrisi, 2014; Davies, 2011) [18,19]. Research on regional economic resilience in China started relatively later but has gradually become a research hotspot (Song et al., 2023) [20]. Content-wise, research mainly includes measurement of regional economic resilience from a spatial–temporal correlation perspective and exploration of its influencing factors (Hundt and Holtermann, 2020; Martin et al., 2016) [21,22], with measurement methods encompassing core variable methods using sensitive indicators and index system methods (Munda and Saisana, 2011) [23].
The theoretical foundations of regional economic resilience have been further enriched by evolutionary economic geography, which emphasizes the path-dependent nature of regional development trajectories and their ability to adapt to shocks (Boschma, 2015) [24]. Additionally, Fath et al. (2015) [25] proposed the “panarchy framework” that conceptualizes resilience through adaptive cycles across multiple scales, helping to understand how regional economies navigate through periods of growth, conservation, release, and reorganization. Bristow and Healy (2018) [26] highlighted the critical role of innovation in building economic resilience, suggesting that regions with diversified innovation capabilities demonstrate greater adaptive capacity when facing external shocks.
As an important node connecting land and sea and a key component of modern logistics, ports have continuously expanded and innovated their logistics functions from traditional loading and unloading services to comprehensive logistics services, playing a crucial role in global trade logistics networks (Hesse and Rodrigue, 2006; Ye et al., 2017; Guo and Yu, 2022) [27,28,29]. Existing research on port logistics predominantly approaches from perspectives of development level or efficiency measurement (Tan, 2012; Lim et al., 2019) [30,31], port–city integration development (Debrie and Raimbault, 2016; Lin, 2024) [32,33], and interactive effects between port logistics and hinterland economy (Li, 2024; Behdani et al., 2020) [34,35], employing methods such as entropy weight method, DEA model, and coupling coordination degree model for empirical analysis.
In recent years, as the global economy has frequently encountered challenges from extreme climate events, epidemics, and geopolitical conflicts, the risk resistance and recovery capacities of ports within economic systems have received increasing attention to reduce economic and social losses (Notteboom et al., 2021) [36]. Previous studies indicate that ports maintain economic vitality by providing various logistics services (Ng, 2006) [37], and port logistics can further strengthen regional economic resilience through interactions with regional industries (Yeon et al., 2024) [10]. Therefore, studying the relationship between regional economic resilience and port logistics from a resilience perspective holds significant importance.
The relationship between regional economic resilience and port logistics is complex and in a state of dynamic change. Direct research on these two aspects is currently limited, with most studies focusing on the collaborative evaluation and functional relationships between regional economic growth and logistics industry development. Chu (2012) [38] first investigated the long-term relationship between logistics investment and economic growth, employing conditional convergence models and system GMM estimation to conclude that logistics investment has a tremendous driving effect on China’s regional economic growth. Guarnieri et al. (2020) [39] studied the role of reverse logistics in promoting economic circulation and sustainable development in Brazil based on qualitative analysis. As the digital economy serves as an engine for high-quality economic growth, Karine et al. focused on its integrated development trend with logistics, constructing a coupling coordination model with rural areas in BRICS countries as the research object to verify the coupling coordination relationship between the two systems.
Specific to port logistics as a single logistics element, Cheung and Yip (2011) [40] studied seven major ports and port cities in China, demonstrating that the development of port city economies has a significant impact on changes in port throughput. Van der Lugt et al. (2014) [41] argued that port prosperity can enhance the attractiveness of its hinterland to foreign direct investment, thereby playing a positive role in the development of the port hinterland economy. Su et al. (2024) [42] utilized an obstacle degree model to identify the main factors hindering the coordinated coupling development of ports and regional economies, proposing opinions for the sustainable development of port logistics and regional economy in island regions.
More recently, the integration of digital technologies with port logistics has created new opportunities for enhancing regional economic resilience. Zhang and Li (2023) [43] examined how smart port initiatives contribute to economic shock absorption capacities in coastal regions, while Chen et al. (2022) [44] investigated the synergistic effects between port digitalization and regional innovation systems in building resilient economic structures. Furthermore, Rodriguez-Pose and Wilkie (2021) [45] highlighted the importance of institutional quality in mediating the relationship between infrastructure investments (including ports) and regional economic performance during crisis periods.
In conclusion, three fundamental constraints still exist even though the relationship between port logistics and regional economic resilience has attracted a lot of scholarly attention. First, from a theoretical perspective, existing research predominantly focuses on linear correlations between regional economic growth and the logistics industry, failing to adequately incorporate the resilience theoretical framework and integrate the four-dimensional framework of economic resilience with port logistics functions. In the current context of surging global volatility sources, with port logistics serving as a “driver” for regional economies, the coupling coordination mechanism between port logistics and emerging regional economic resilience has yet to be systematically explained. Second, from a methodological standpoint, existing research on regional economy and port logistics is largely based on static or linear models, neglecting the exploration of dynamic evolution patterns between the two systems across multiple spatial–temporal scales. Research on spatial interaction mechanisms also appears relatively weak, particularly regarding the heterogeneous driving mechanisms of coordinated development between port logistics and economic resilience, which remain unclear. Finally, from a research scale perspective, existing empirical studies primarily concentrate on developed European and American ports or China’s eastern coastal hubs, with insufficient attention to emerging strategic nodes along the Belt and Road Initiative (such as the Guangxi Beibu Gulf Economic Zone), making it difficult to reveal the coordination pathways of underdeveloped coastal regions under multiple risks.
The main innovations of this study are threefold: (1) At the theoretical level, this study is the first to integrate the four-dimensional framework of regional economic resilience with port logistics functions, constructing an “economic resilience–port logistics” coupling coordination model that addresses the inadequacy of approaching from a single traditional economic growth perspective. It also proposes a “digital–resilience–logistics” interactive system aimed at providing direction for future economic development in underdeveloped regions. (2) At the methodological level, it integrates coupling coordination degree models, spatial econometrics, and geographic detectors to reveal the spatial–temporal dynamic patterns and driving mechanisms of coupling between regional economic resilience and port logistics from multiple scales, breaking through the limitations of static analysis. (3) By selecting the Guangxi Beibu Gulf Economic Zone as the research object, it provides differentiated policy tools for risk governance and logistics network optimization at strategic nodes in emerging economies.

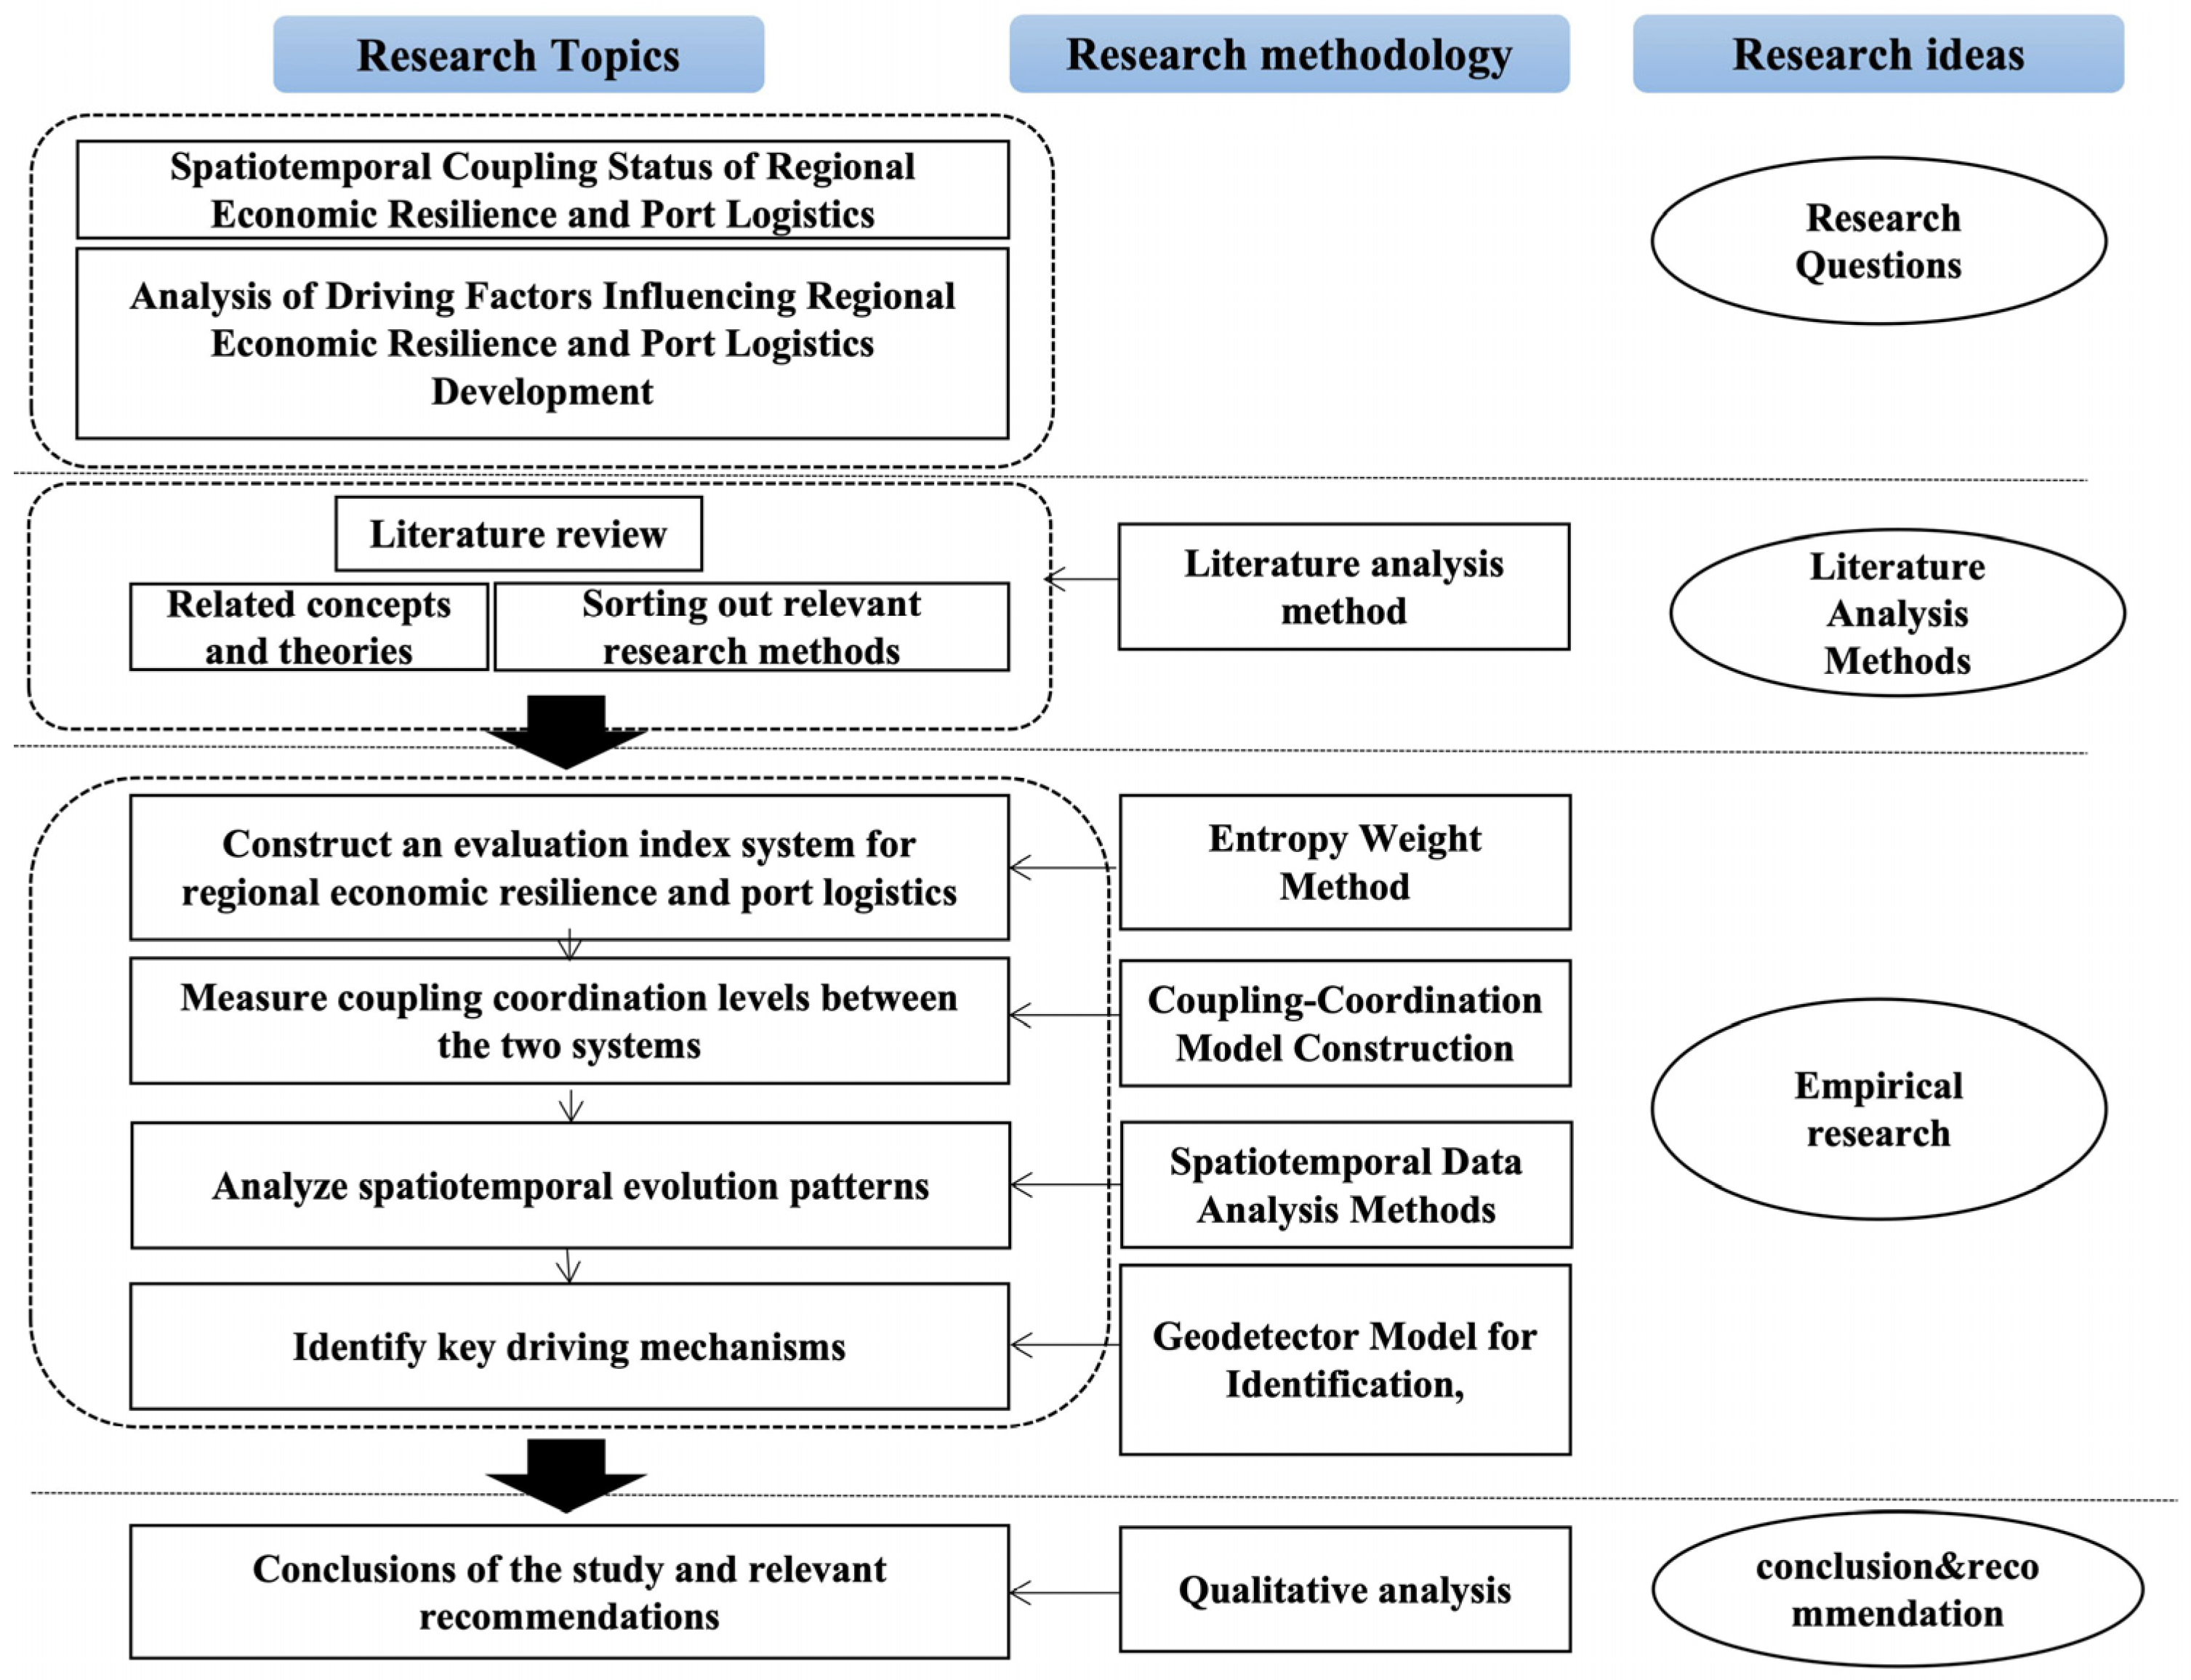
2.2. Theoretical Framework

Regional economic resilience and port logistics, as two complex systems, involve multiple theoretical aspects in their coupling coordination relationship. From the perspective of complex systems theory, in the system jointly formed by regional economic resilience and port logistics, various elements interact in nonlinear forms and achieve self-regulation and optimization through complex feedback pathways (Mitchell and Newman, 2002) [46]. During the cycle of spatial–temporal evolution of their coupling coordination, the early single-core driving reflects the positive feedback mechanism of the system, while the later dual-core pattern demonstrates structural reorganization achieved through system self-organization, essentially reflecting the nonlinear dynamic characteristics of complex systems. The spatial differentiation of coupling coordination reveals the non-equilibrium nature of interactions between subsystems. For example, the growth of port throughput directly enhances regional economic risk resistance capacity through industrial chain linkage effects, manifested as the diversified development of port-adjacent industries strengthening resilience against market fluctuations. Conversely, the enhancement of regional economic resilience can provide a stable source of goods, ensuring the sustainability of port operations. This dynamic coupling relationship endows the system with complex evolutionary characteristics, making traditional linear causal analysis frameworks inadequate for fully revealing its inherent patterns, while complex systems theory provides a more appropriate theoretical tool for deconstructing this multidimensional interaction (Ladyman et al., 2013) [47].
Infrastructure interdependence theory posits that modern infrastructure systems (such as transportation, energy, and communication) no longer operate in isolation but form interdependent networked systems through deep physical, institutional, and functional interconnections (Hickford et al., 2018) [48]. This interdependence produces two key effects: synergistic enhancement effects and risk transmission effects (Jovović and Popović, 2025) [49]. The coupling between regional economic resilience and port logistics essentially represents cross-network interconnection and interdependence of critical infrastructure, generating both synergistic effects and vulnerability transmission risks. In terms of synergistic effects, the networked integration of regional transportation facilities can further expand the economic hinterland scope of ports; the enhancement of port service capabilities, such as increased port infrastructure investment, can achieve dynamic matching with regional industrial structure upgrading; and regional policies regarding customs facilitation and multimodal transport have certain regulatory effects on reducing system friction and improving coupling efficiency. Regarding risk transmission effects, close physical connections in the system may amplify the scope of local failure impacts; functional adaptation specialization may lead to regional economies becoming overly dependent on certain cargo types, thereby reducing regional economic risk resistance capacity. Similarly, institutional coordination lag can also create governance gaps.
From the perspective of regional innovation systems, geographically interrelated system elements jointly constitute a complete regional organizational system that supports and generates innovation, with innovation capacity depending on the collaborative support of multiple factors including technology, logistics, finance, and institutions (Lawson and Lorenz, 1999) [50]. As a gateway for regional opening to the outside world, ports introduce advanced logistics technologies and management experiences that diffuse to hinterland industries through regional innovation networks in the form of industry–academia research collaboration, promoting knowledge flow and industrial synergy, and converting technological innovation into enhanced industrial resilience (Lambooy, 2002) [51]. Additionally, financial institutions can provide targeted support for smart port transformation through innovative financial instruments; innovations in cross-border transaction rules, such as digital currency settlement pilots, can significantly reduce institutional friction in international trade, improving customs clearance efficiency and regional industrial response speed.

3. Methods

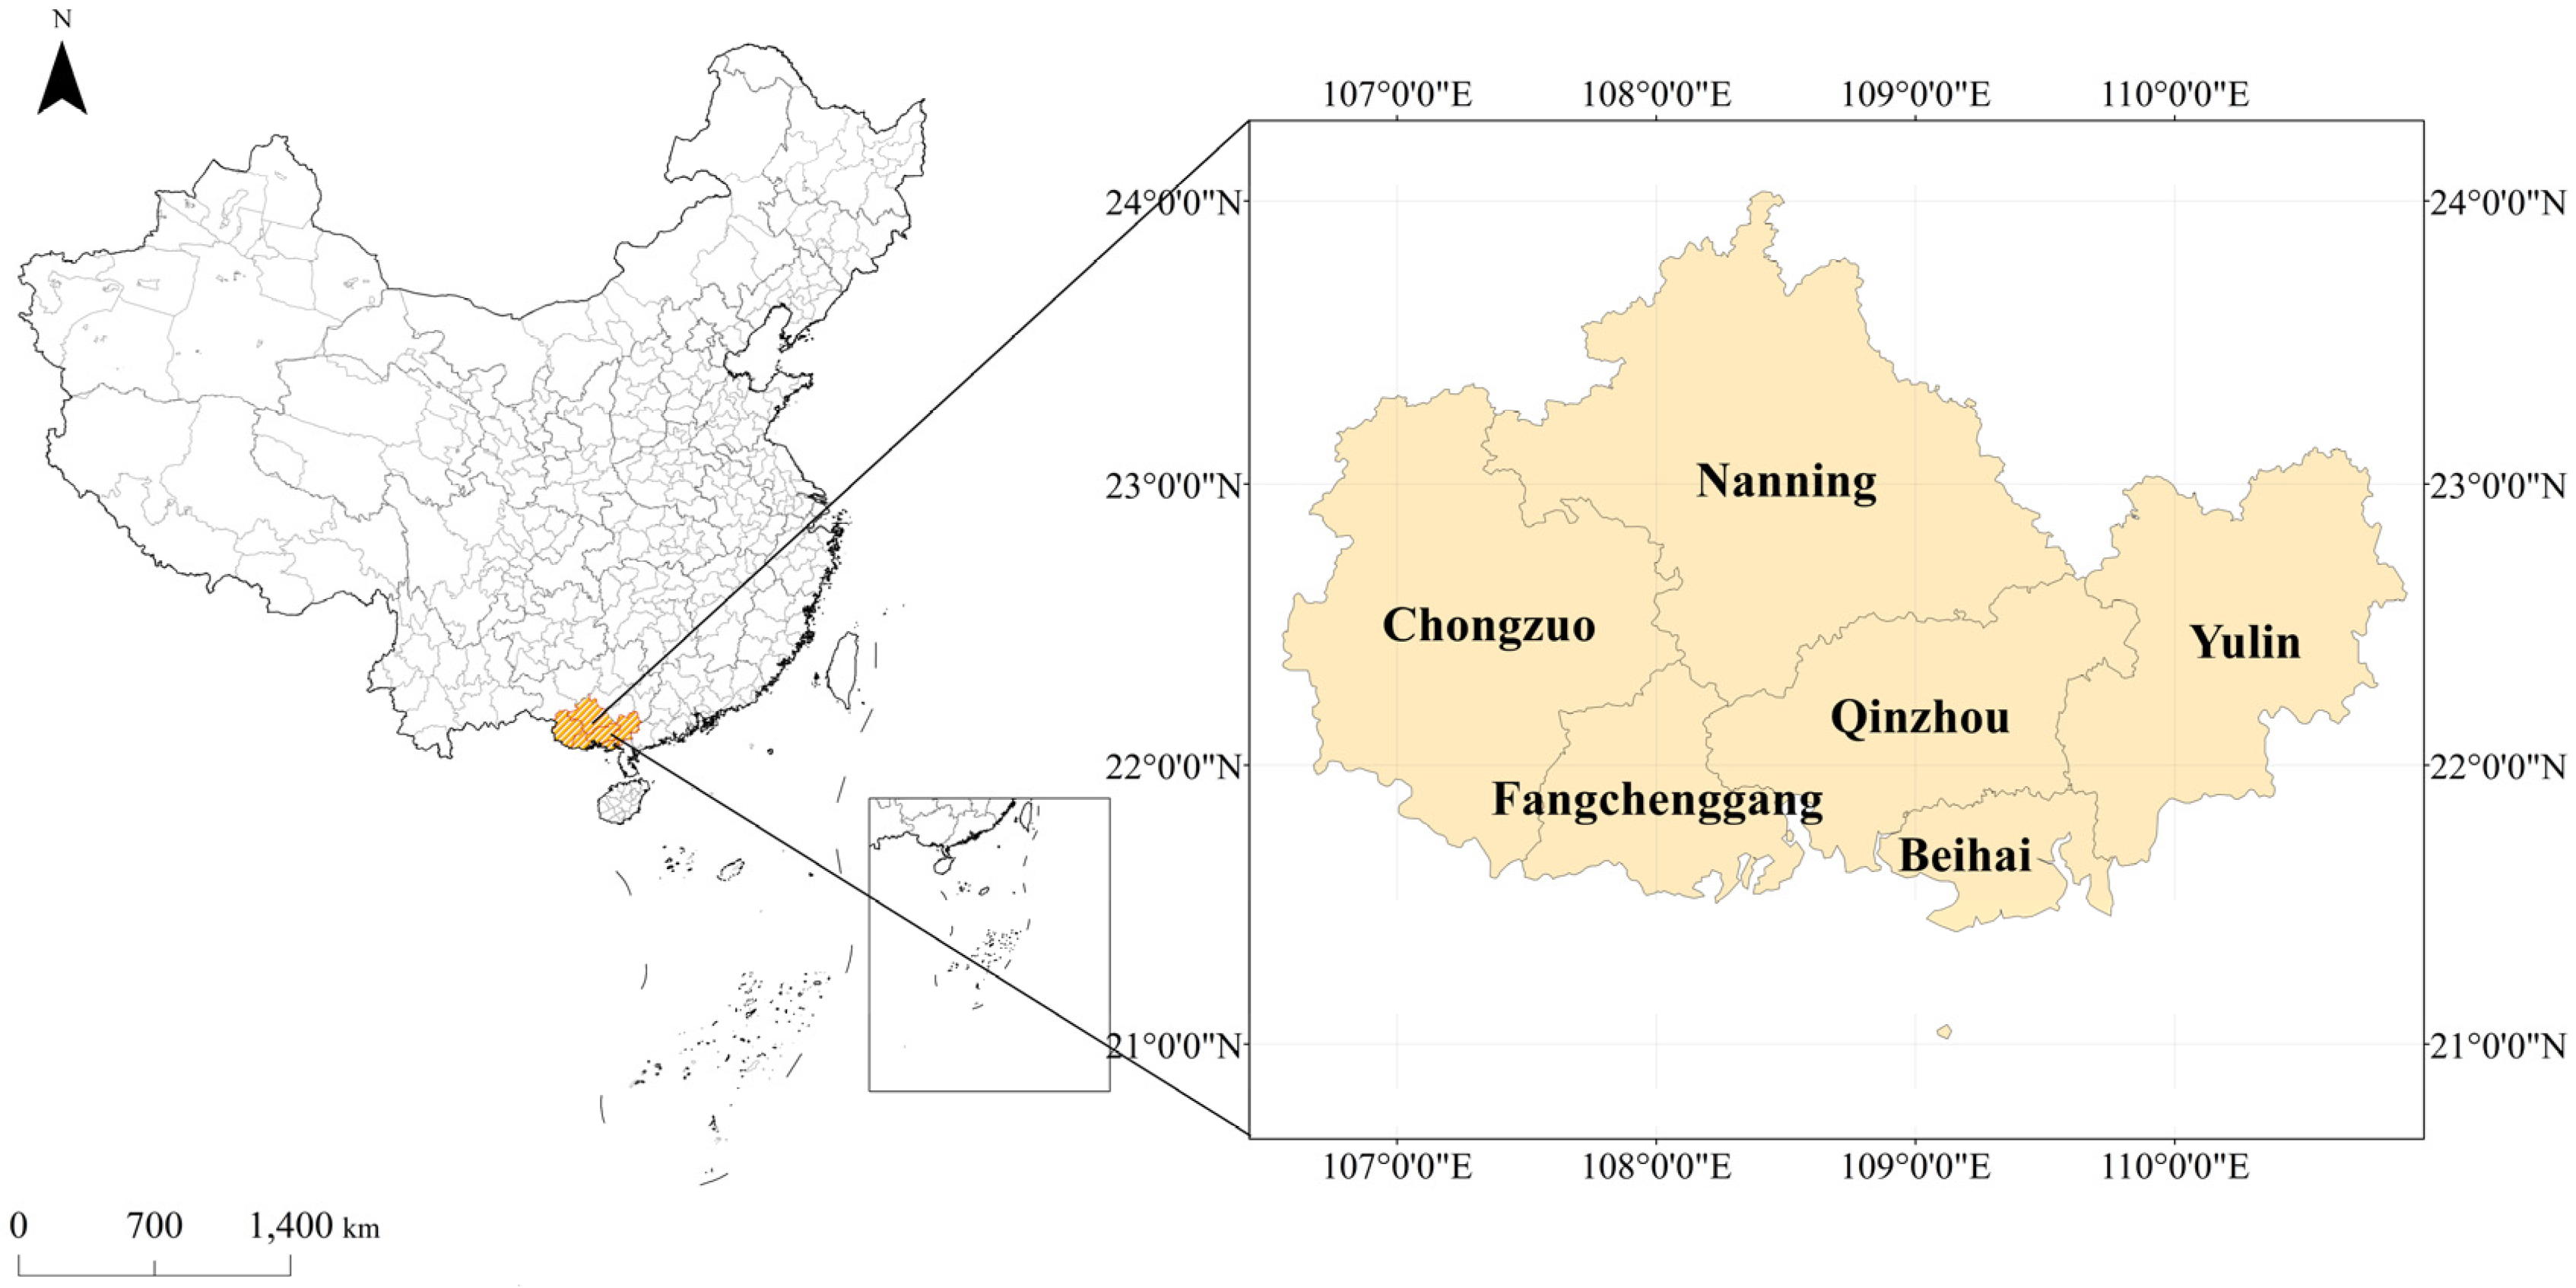
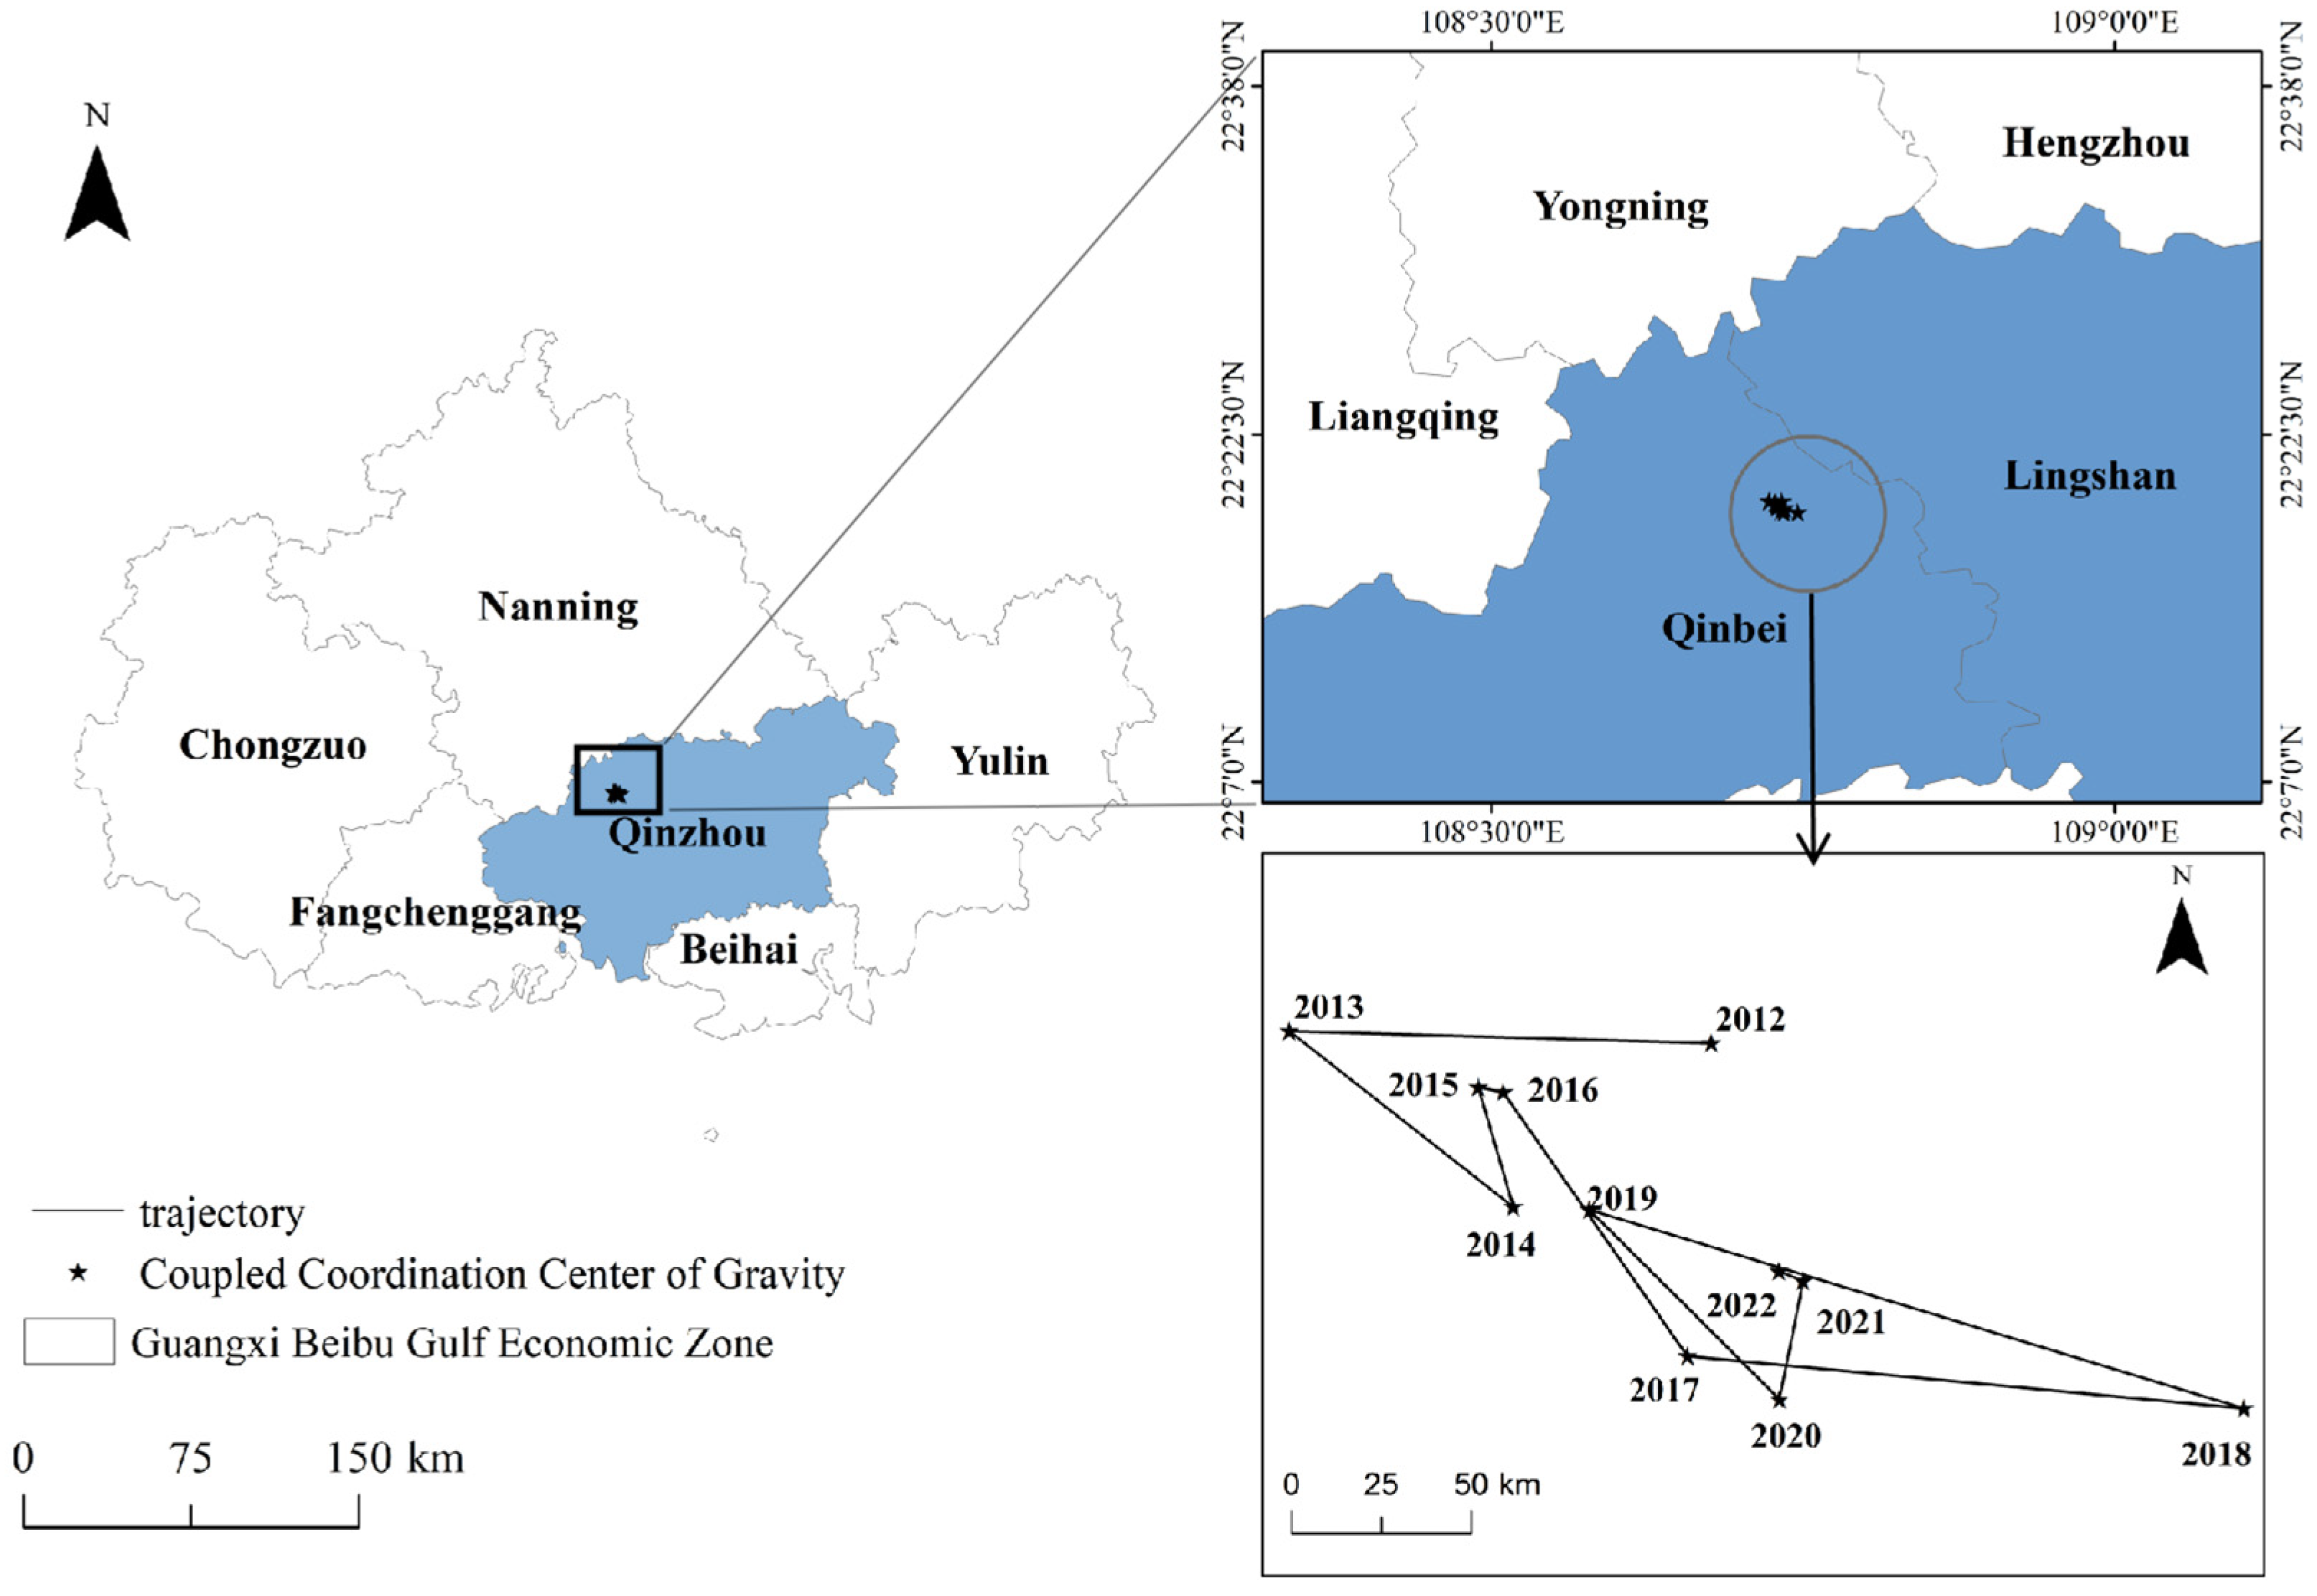
3.1. Study Area Overview and Data Sources

The Guangxi Beibu Gulf Economic Zone (latitude 21°35′–22°41′ N, longitude 107°27′–109°56′ E) is located in China’s southwestern coastal region, comprising six cities: Nanning, Qinzhou, Beihai, Fangchenggang, Yulin, and Chongzuo. Since its establishment in 2008, it has evolved from an economically underdeveloped region into an important international economic cooperation zone, serving as a strategic fulcrum of the New Western Land–Sea Corridor and a core hub for China’s opening to ASEAN (Liao, 2022) [52] (Figure 2).
The region has developed an economic resilience foundation centered on a multimodal port logistics transportation system and port industries such as petrochemicals and equipment manufacturing, leveraging the Beibu Gulf deep-water port group. By 2022, the region’s GDP exceeded CNY 900 billion, with port cargo throughput reaching 370 million tons and container throughput increasing by 16.8% year-on-year. However, the region still faces challenges such as low efficiency in multimodal transport connections and insufficient risk buffering capacity in port industrial chains, resulting in lagging coordination between economic resilience enhancement and logistics system upgrading. Therefore, this paper analyzes the dynamic evolution patterns and driving factors of economic resilience and port logistics coupling coordination in this region.
Data for this study primarily originates from the 2012–2022 “Guangxi Statistical Yearbook”, “China Port Yearbook”, and Guangxi’s annual national economic and social development statistical bulletins. R&D expenditure data, which has not been publicly released, was obtained through application to the Guangxi Science and Technology Department. Missing values for certain indicators in some years were processed using interpolation methods.

3.2. Index System Construction

Drawing on existing research achievements and referencing the authoritative literature such as Tan et al. (2012), Bingru et al. (2019), Xie et al. (2022), and Li et al. (2024) [31,35,53,54], this study constructs evaluation index systems for regional economic resilience and port logistics with the background of coupling coordinated development between the two systems, considering the locational characteristics of the Guangxi Beibu Gulf Economic Zone and principles of data availability, standardization, and scientific validity, as shown in Table 1 and Table 2.
Specifically, for regional economic resilience, 14 indicators were selected from three dimensions: resistance and recovery capacity, adaptation and adjustment capacity, and innovation and transformation capacity. Among these, gross regional product, per capita disposable income of urban residents, and fiscal expenditure on social security and employment reflect the economic foundation supporting a region’s risk resistance during crises (Chen et al., 2023) [7]. Urban registered unemployment rate, as a core indicator monitoring the labor market, effectively reflects the buffer capacity of regional economic systems against external shocks (Martin, 2012) [16]. Foreign trade dependence, generally represented by the ratio of total imports and exports to GDP, comprehensively reflects a region’s vulnerability threshold and sensitivity to external shocks (Ding et al., 2020) [55].
The ratio of general public budget revenue to general public budget expenditure represents regional fiscal self-sufficiency, fixed asset investment growth rate represents investment intensity, and the ratio of total retail sales of consumer goods to GDP indicates regional market scale. During external shocks, larger domestic demand forms a buffer zone absorbing impacts, higher fiscal self-sufficiency provides greater policy adjustment space, and rapidly formed investments can further influence economic restructuring (Zou et al., 2024; Bělohradský, 2024; Christl et al., 2024) [56,57,58]. The ratio of tertiary to secondary industry represents the degree of economic structure evolution toward high value-added services, R&D expenditure is the core driving force for transformation, patent grants reflect the actual effectiveness of innovation activities, and the number of students in regular higher education institutions measures innovative talent reserves (Aldrich et al., 2015; Bristow et al., 2018) [26,59].
From the two major dimensions of port input and output capacity, six indicators are selected to establish the port logistics evaluation index system. The number of production berths and the number of berths over 10,000 tons reflect the port’s capacity to handle shipping transportation tasks and respond to the trend of ship enlargement, respectively. These two indicators, as outcomes of port inputs, are important for reflecting port logistics input capacity (Zeng et al., 2022; Xie and Hu, 2024) [60,61], while infrastructure investment directly reflects the intensity of capital input in ports. Cargo throughput and container throughput, as basic indicators for evaluating port logistics, adequately reflect the port’s cargo handling capacity and logistics efficiency, while total import and export value, as an economic indicator, reveals the port’s contribution to the regional economy from a value dimension.

3.3. Research Methods

3.3.1. Entropy Weight Method

The entropy weight method, as an objective weighting approach, assigns weights to original indicators based on the principle of information differentiation, with each indicator’s weight determined by its information entropy, effectively avoiding the influence of subjective factors (Sepehri et al., 2019) [62]. This method is suitable for multi-indicator system evaluation and can effectively handle the complex indicator systems composed of regional economic resilience and port logistics in this study. This paper employs the entropy weight method to calculate the weight coefficients of each indicator for the aforementioned two systems, utilizing the range method to eliminate the influence of data dimensions, determining the final weights through calculating entropy values and difference coefficients, while using the weighted average method to calculate the comprehensive scores of each dimension for the two systems based on the weight coefficients. Due to space limitations, detailed calculation processes are not elaborated here; interested readers may refer to Stanković et al. (2021) [63].

3.3.2. Coupling Coordination Degree Model

Coupling coordination degree describes the relationship of mutual interaction, regulation, and coordination between two or more systems. Regional economic resilience and port logistics are two mutually dependent and influential systems; therefore, this paper introduces this method to evaluate their coupling coordination level. The formula is as follows:
C = 2 U 1 U 2 U 1 + U 2 T = α U 1 + β U 2 D = C T
where U 1 and U 2 represent the comprehensive scores of regional economic resilience and port logistics development level, respectively; C represents the coupling degree; T represents the comprehensive coordination index; and α and β are predetermined coefficients representing the weights of the two systems. Given that the study area has not yet published complete industrial linkage data for the two systems, we adopted symmetric weights as a baseline assumption by drawing on the theory of port–city mutual feedback (Akhavan, 2020) [64] and referencing studies on coupling between ports and regional economies (Hesse, 2018; Nguyen et al., 2019) [65,66], hence α = β = 0.5 ; D represents the coupling coordination degree, ranging from [ 0 , 1 ] . As D approaches 1, system coordination increases, indicating mutual promotion within the system; as D approaches 0, system coordination decreases, indicating mutual constraints between components (Xu and Li, 2023) [67]. Referencing Wang (2021) [68] and Bingru (2019) [53], combined with the actual situation of this region, the coupling coordination degree between regional economic resilience and port logistics is classified as: severe discord ( 0 , 0.4 ] ; imminent discord ( 0.4 , 0.5 ] ; antagonistic coordination ( 0.5 , 0.6 ] ; moderate coordination ( 0.6 , 0.7 ] ; good coordination ( 0.7 , 0.8 ] ; and high coordination ( 0.8 , 1 ] .

3.3.3. Kernel Density Estimation

Kernel density estimation is a non-parametric estimation method with the advantage of inferring evolution trends and distribution characteristics of overall data based on limited sample size. The formula is (Man, 2021) [69]:
f ( x ) = 1 n h i = 1 n   k X i x h
where f ( x ) represents the kernel density estimation value; k ( · ) represents the Gaussian kernel function; n represents the number of observations; h represents the bandwidth; X i represents independently distributed observations; and x represents the mean of observations.

3.3.4. Gravity Center Model

The gravity center model can intuitively depict the movement direction and distance of element centers within a research area in two-dimensional space, revealing their distribution and evolution patterns. The formula is (Ariken et al., 2024; Thompson et al., 2019) [70,71]:
X = i = 1 n   w i t x i i = 1 n   w i t , Y = i = 1 n   w i t y i i = 1 n   w i t d = k × X t + 1 X t 2 + Y t + 1 Y t 2
where ( X , Y ) represents the coordinates of the research area’s coupling coordination degree gravity center; ( x i , y i ) represents the geographic center coordinates of the ith city unit; wit represents the coupling coordination degree of the ith city unit in year t ; ( X t , Y t ) and ( X t   +   1 , Y t   +   1 ) represent the gravity center coordinates of the region in years t and t + 1 , respectively; d represents the gravity center movement distance ( k m ) within a specific time period; and k is a constant, representing the conversion rate when converting geographic coordinates to projection coordinates, valued at 111.111 k m .

3.3.5. Spatial Autocorrelation Model

The spatial autocorrelation model includes global autocorrelation and local autocorrelation, used to measure spatial association between geographic elements. This paper employs the global Moran’s I index to analyze whether there exists global autocorrelation in the coupling coordination degree between regional economic resilience and port logistics, and uses the local Moran’s I index to analyze whether there exist local association characteristics in the coupling coordination degree of the aforementioned two systems. For specific calculation processes, refer to Tsai (2009) [72].

3.3.6. Geographic Detector

Geographic detector is a spatial measurement method for geographic phenomena. This paper adopts a combination of factor detection and interaction detection methods from this analytical model to detect driving factors of pattern differentiation in the coupling coordinated development between regional economic resilience and port logistics, as well as the effects of two-factor interactions. The formula is (Abuduwaili et al., 2024) [73]:
q = 1 h = 1 L   N h σ h 2 N σ 2
where the q-value represents the explanation degree of each factor for the coupling coordination between the two systems; N and σ 2 represent the sample size and global discrete variance of the research area; h represents the number of factor stratifications; and N h and σ h 2 represent the sample data and variance of a specific layer, respectively. The domain of q is [ 0 , 1 ] , with higher q-values indicating stronger explanatory power. The judgment formula for interaction detection is shown in Table 3, classified into 5 types according to interaction effects (Wang and Xu, 2017) [74].

4. Results

4.1. Spatial–Temporal Pattern Evolution Analysis of Regional Economic Resilience and Port Logistics Coupling Coordination

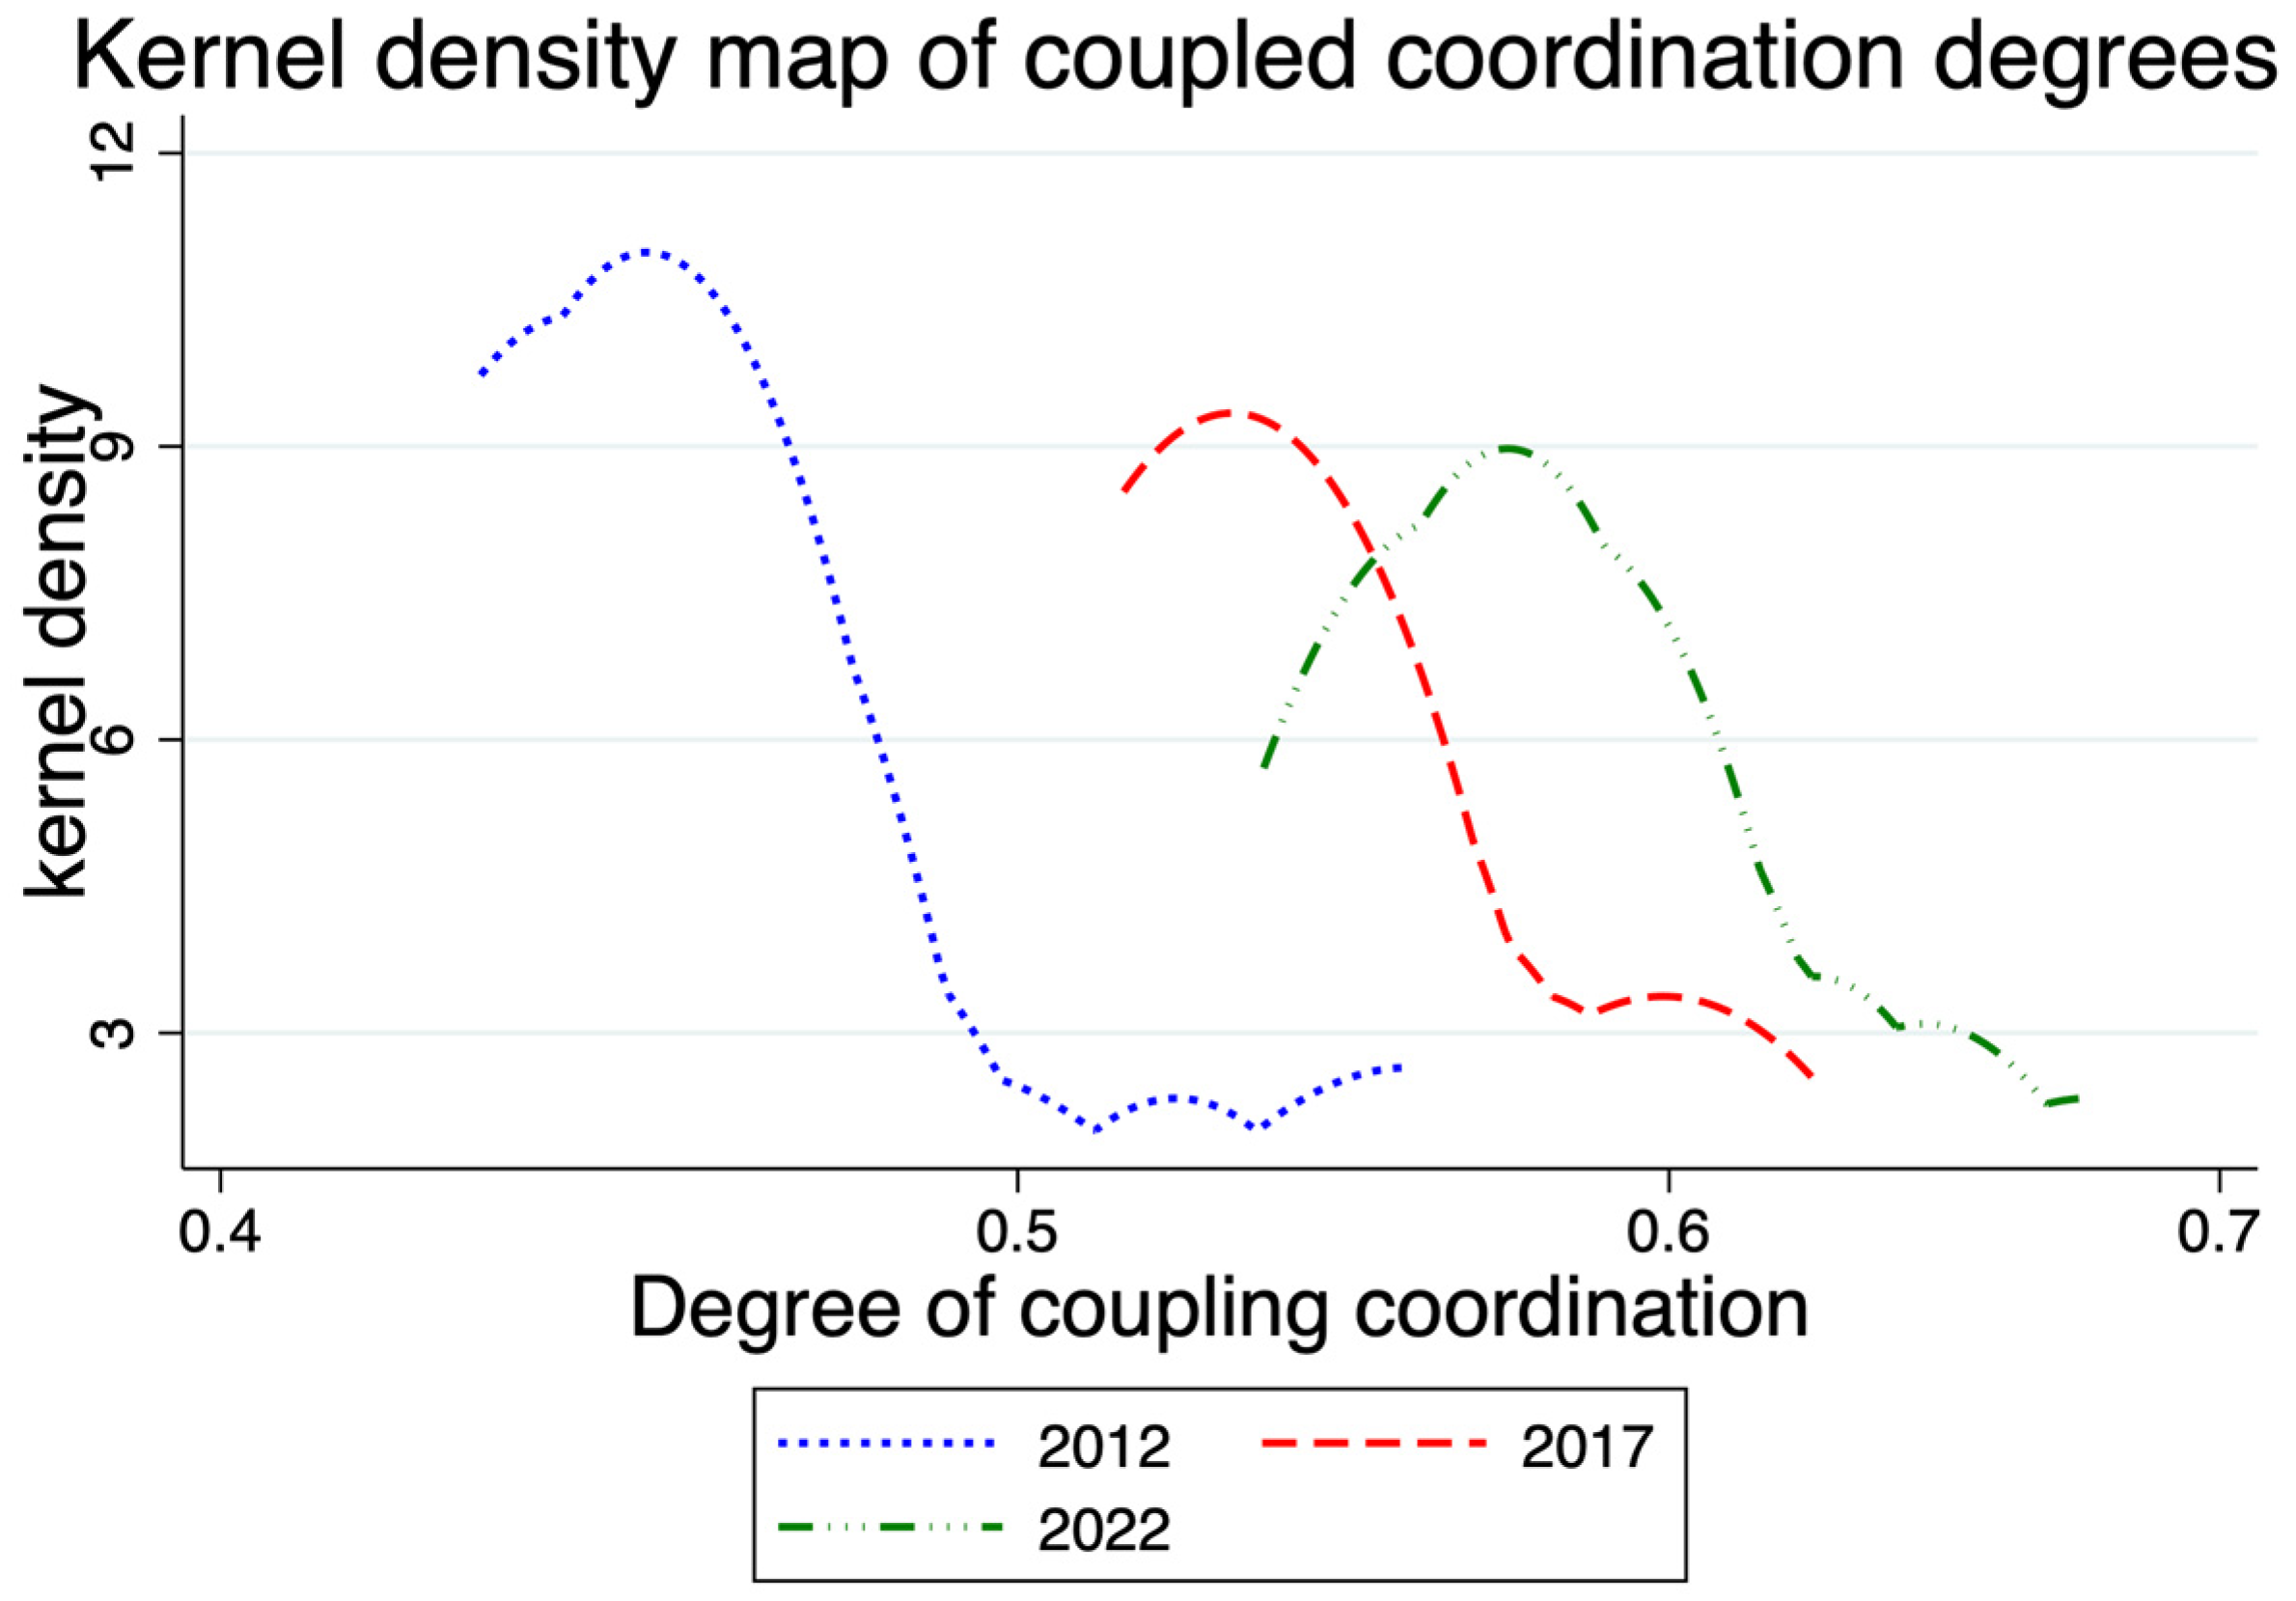
4.1.1. Temporal Change Characteristics of Coupling Coordination

Following the approach of Xu (2023) [75], we selected three time points and used the kdensity function in Stata17 to calculate the Gaussian kernel densities of the coupling coordination degree between economic resilience and port logistics in the Guangxi Beibu Gulf Economic Zone for 2012, 2017, and 2022, as shown in Figure 3. Overall, the kernel density curves show significant rightward shifts over the years, with mean coupling coordination degrees of 0.4686, 0.5468, and 0.5905 for 2012, 2017, and 2022, respectively, indicating that the two systems are developing in an orderly manner toward higher coordination; the 2012 kernel density curve peaks around 0.45, indicating that coupling coordination degrees were concentrated at this point during this period, with the highest degree of clustering throughout the sample period, while the peaks for 2017 and 2022 are distributed in the 0.5–0.6 interval.
The kernel density curves maintain a bimodal shape throughout the sample period, indicating the existence of bipolar differentiation in coupling coordination degrees within the study area. The 2012 curve shows the most significant difference between the two peaks, indicating that polarization in coupling coordination degree was most pronounced in this year. During 2017–2022, the curves gradually widened, indicating that the dispersion degree of coupling coordination among the six cities gradually expanded.

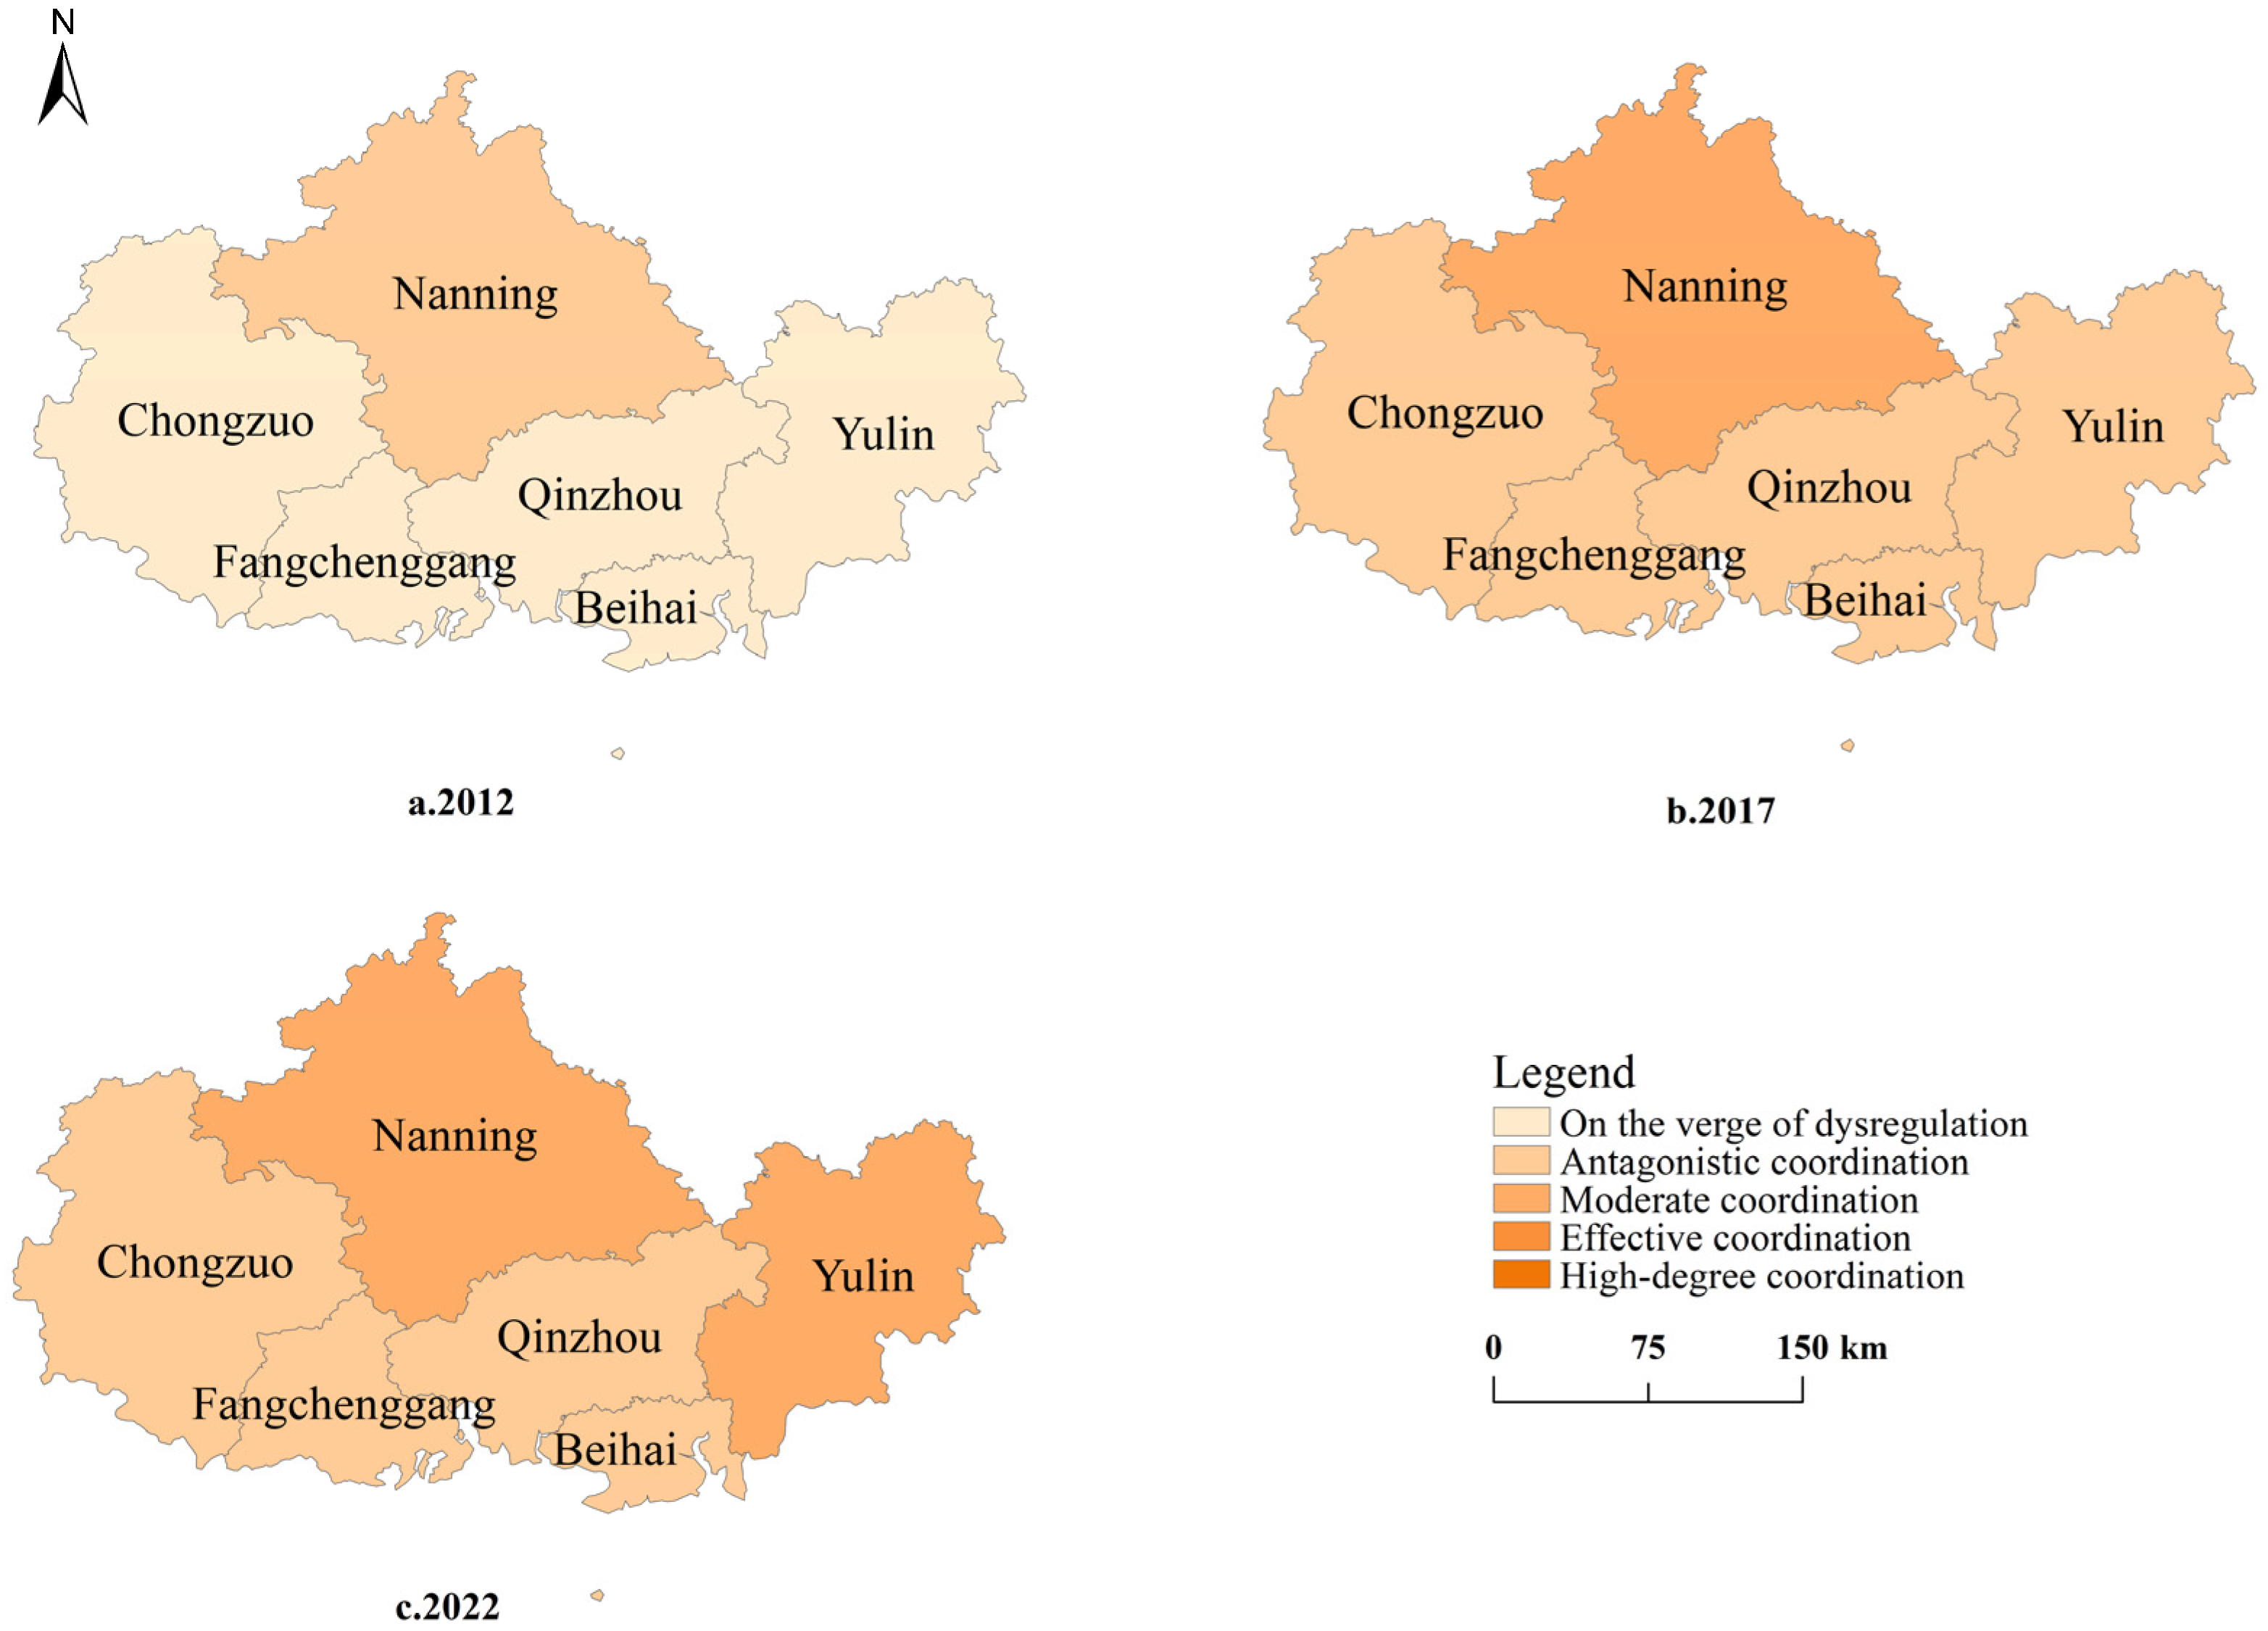
4.1.2. Spatial Change Characteristics of Coupling Coordination

Using ArcGIS 10.8 software, we generated spatial distribution maps of the coupling coordination degree between regional economic resilience and port logistics for 2012, 2017, and 2022, as shown in Figure 4. The coupling coordination degree exhibits significant spatial differentiation characteristics.
Overall, the coupling coordination between regional economic resilience and port logistics during 2012–2022 presents a “concentric layer” distribution, specifically manifested as a non-equilibrium step-by-step spatial pattern gradually decreasing from Nanning as the center to the periphery. In 2012, the coupling coordination between regional economic resilience and port logistics presented a “core–periphery” spatial structure, with the core being the antagonistic coordination area formed by Nanning city, and the periphery being the imminent discord area composed of the remaining five cities. In 2017, the coupling coordination between regional economic resilience and port logistics continued to maintain the aforementioned spatial structure, but with reduced structural intensity; Nanning city’s coupling coordination degree reached moderate coordination, while the remaining five cities entered antagonistic coordination. By 2022, the coupling coordination between regional economic resilience and port logistics in the study area evolved into a “dual-core” pattern, with Nanning city and Yulin city as cores of good coordination areas. The “dual-core” radiation effect was evident, effectively driving further improvement in the coupling coordination degrees of other cities in the region.
Using the coupling coordination degree between regional economic resilience and port logistics from 2012–2022, we plotted its gravity center movement trajectory in the ArcToolbox panel of ArcGIS 10.8 software under “Spatial Statistics Tools”, as shown in Figure 5. From 2012-2022, the gravity center of coupling coordination between regional economic resilience and port logistics in the study area fluctuated between 21°54′ N-22°28′ N and 108°40′ E–108°50′ E, all distributed within Qinbei District of Qinzhou city, generally exhibiting a distribution trend of “southeast shift, northwest return”.
The gravity center movement distance and speed varied significantly across different years, with 2012–2013 and 2017–2019 showing relatively larger movement distances and faster speeds. After 2019, the gravity center’s movement speed and distance gradually declined, indicating that the coupling coordination level between regional economic resilience and port logistics in the area was tending toward stability.

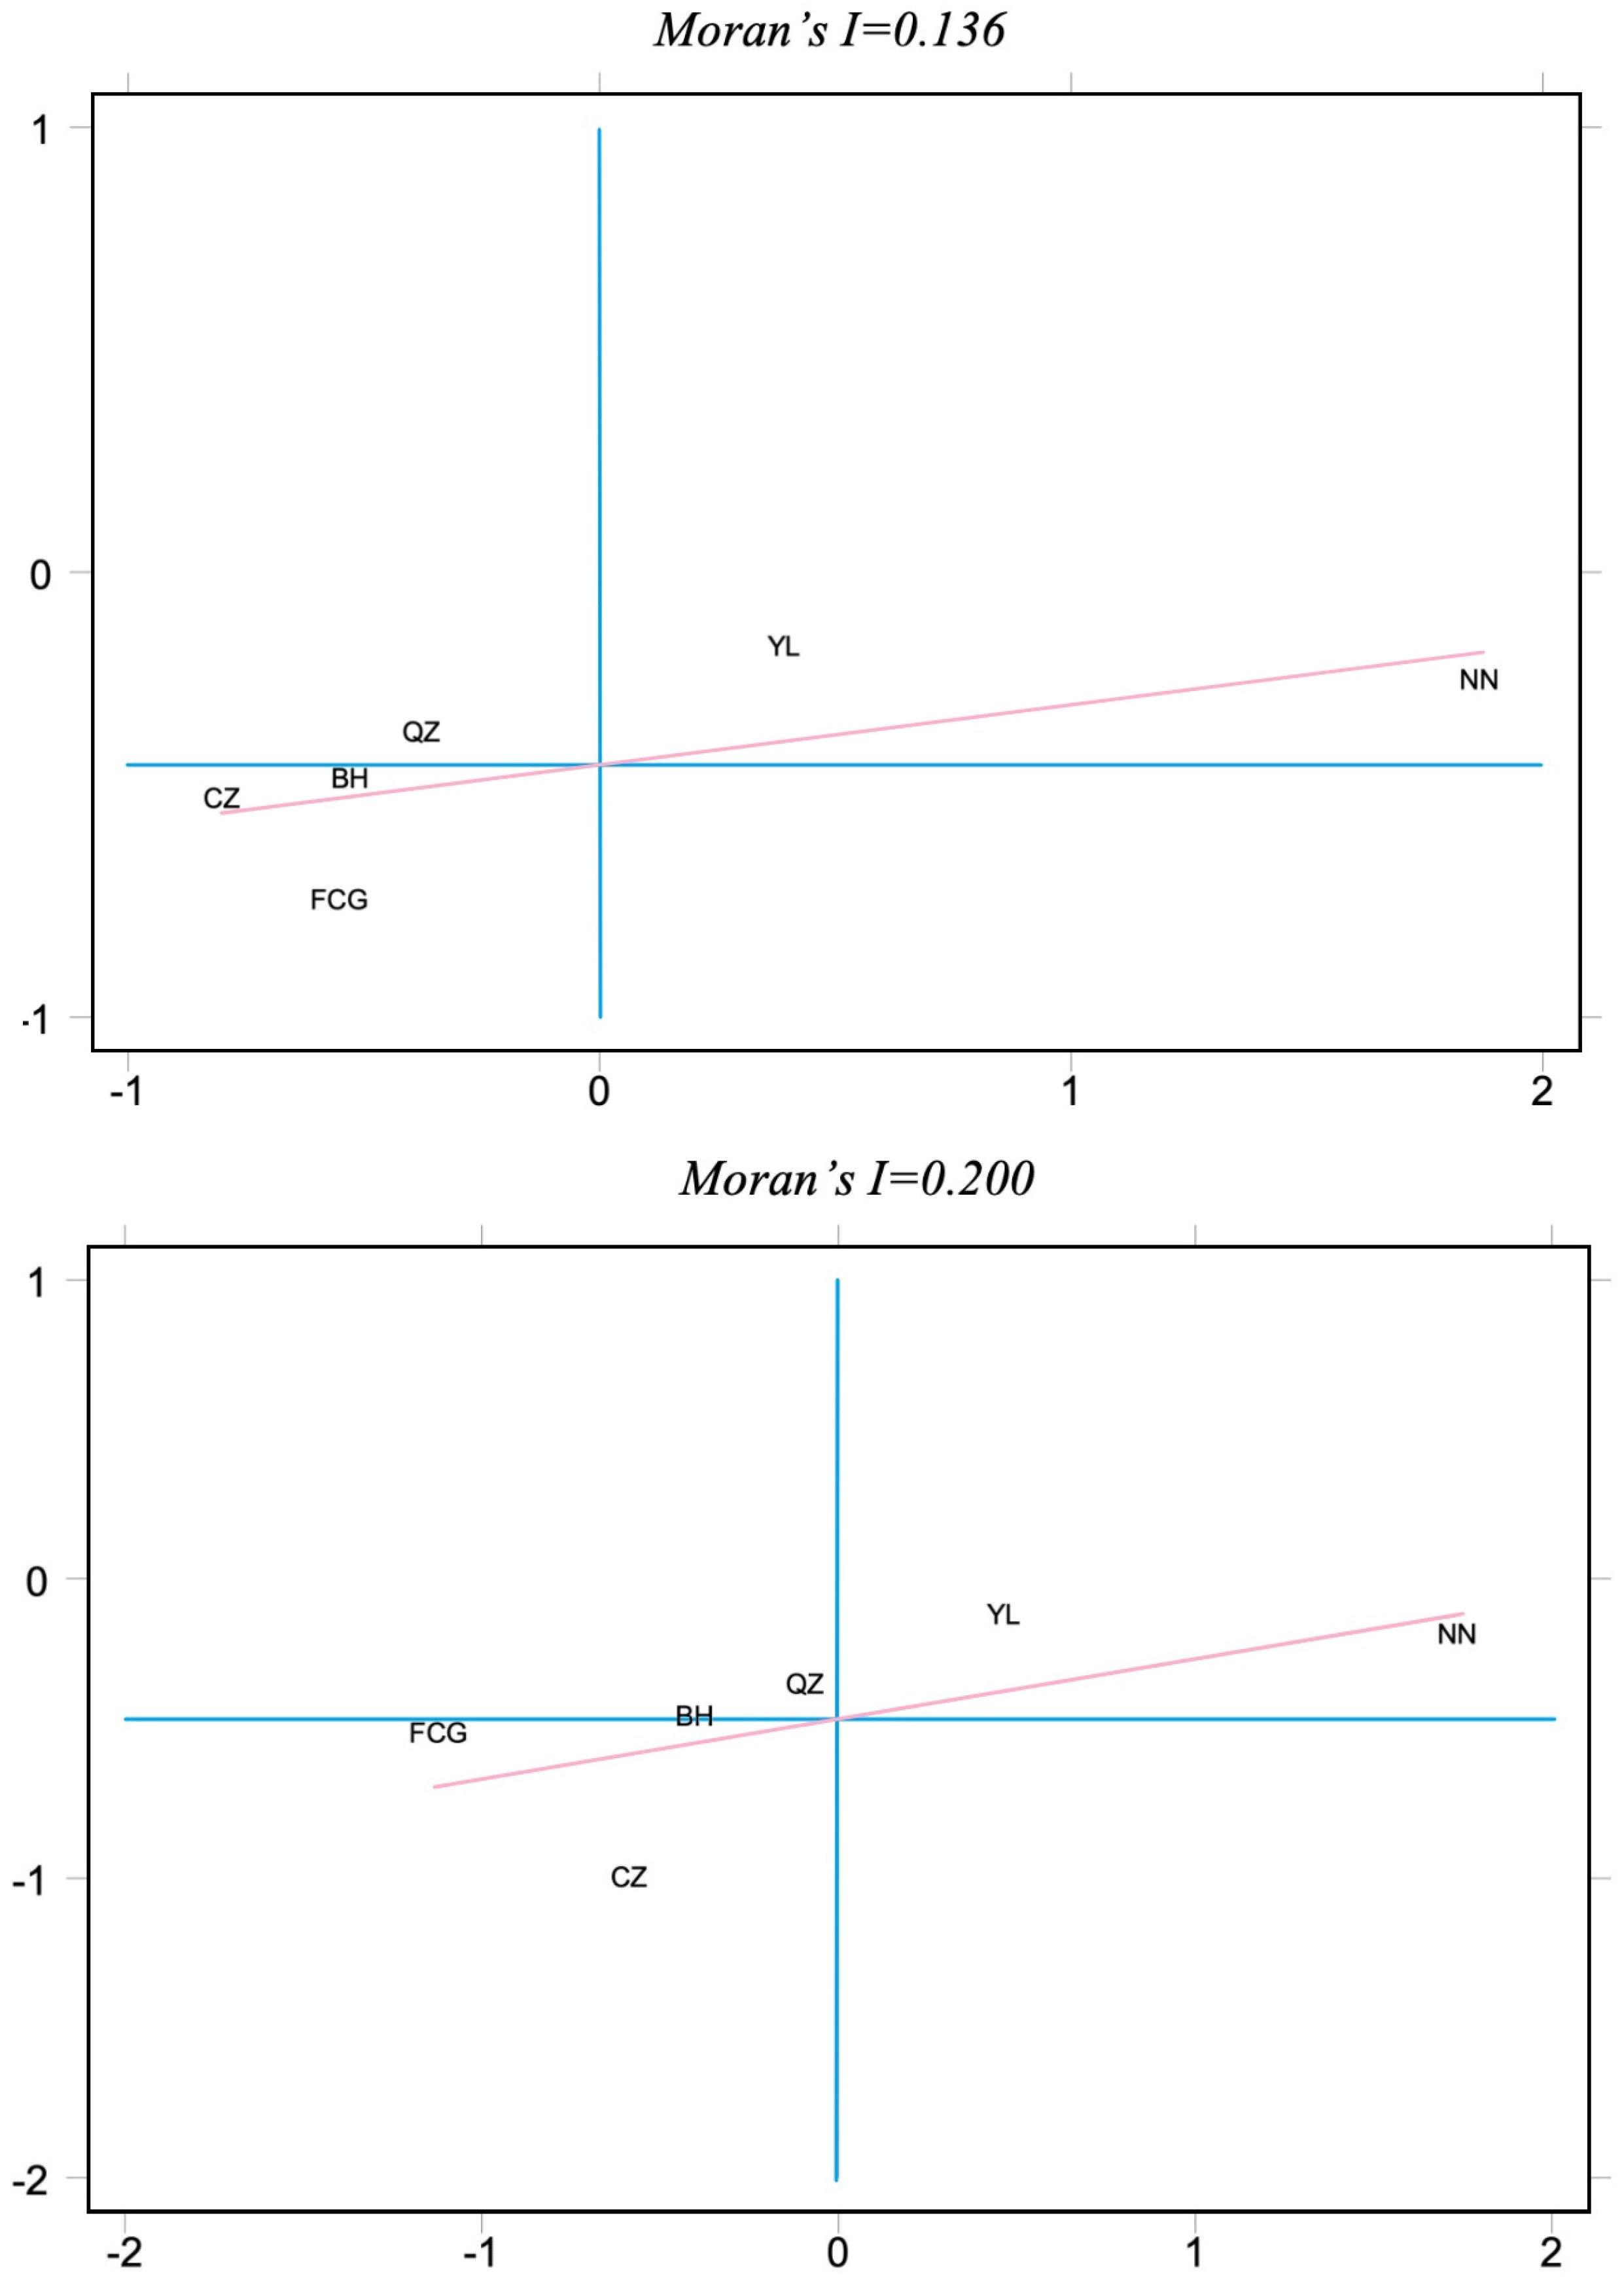
4.1.3. Spatial Association of Coupling Coordination

To further analyze the spatial evolution characteristics of coupling coordination between regional economic resilience and port logistics, we calculated the global spatial autocorrelation of their coupling coordination degree from 2012–2022, obtaining the global Moran’s I index, as shown in Table 4. Throughout the research period, all global Moran’s I indices were greater than 0, and except for 2014 when the p-value was slightly above 0.05, Moran indices for all other years showed significant positive correlation at the 5% level. This indicates that the coupling coordination between regional economic resilience and port logistics does not exist in isolation but has significant correlation.
From the overall trend, during 2012–2022, the global Moran’s I index showed a fluctuating upward trend, with the Moran value rising from 0.136 in 2012 to 0.200 in 2022, indicating that the spatial agglomeration degree of coupling coordination between regional economic resilience and port logistics strengthened during the sample period. Specifically, the Moran’s I index fluctuated within a relatively small range during 2012–2017, remaining relatively stable, but showed a significant increase in 2018, reaching a peak, and although it subsequently declined, it remained at a relatively high level.
Using Stata 17, we generated local Moran’s I scatter plots for the coupling coordination degree between economic resilience and port logistics in the study area to describe the local spatial clustering characteristics of this coupling coordination. The horizontal axis represents the value of the variable under study, i.e., the coupling coordination degree of each city, while the vertical axis represents the spatial lag value corresponding to the research variable, i.e., the weighted average of each observation value’s neighborhood, as shown in Figure 6.
Specifically, Nanning (NN) and Yulin (YL) are located in high–high agglomeration areas. Qinzhou (QZ) is in a “low–high” agglomeration area, indicating that Qinzhou itself has a relatively low coupling coordination degree, but there are high-value areas in neighboring regions. By 2022, its position gradually approached the origin, indicating that as the region’s overall coordination degree improved, Qinzhou port’s hub function was also further released. Fangchenggang (FCG) and Chongzuo (CZ) are located in the “low–low” quadrant, indicating that both themselves and surrounding cities have relatively low coupling coordination degrees. Beihai (BH) is at the boundary between the second and third quadrants, reflecting that its coordination degree is close to the regional average and shows a trend of transitioning toward the second quadrant.

4.2. Analysis of Driving Factors for Regional Economic Resilience and Port Logistics Coupling Coordination

4.2.1. Selection of Driving Factors

The coupling coordination between regional economic resilience and port logistics is influenced by multiple factors. Referencing the literature from Wang et al. (2024), Wu et al. (2024), Xu (2023), Wang (2020) [75,76,77,78], and others, combined with the actual situation of the Guangxi Beibu Gulf Economic Zone, we selected six indicators as influencing factors for their coupling coordination degree to conduct driving factor analysis, as shown in Table 5.

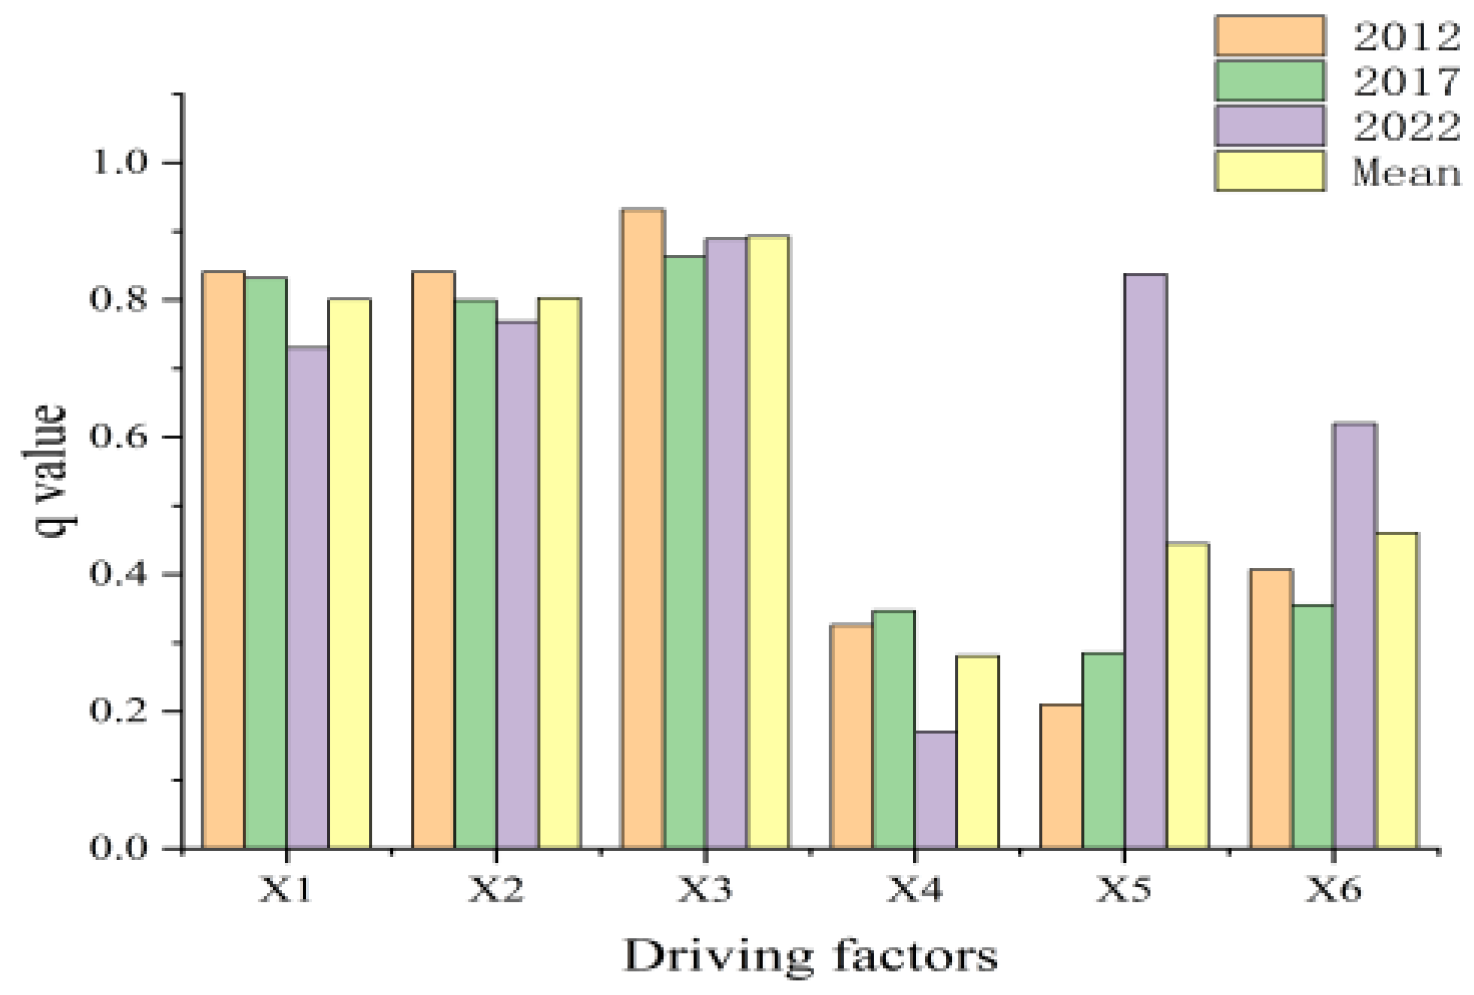
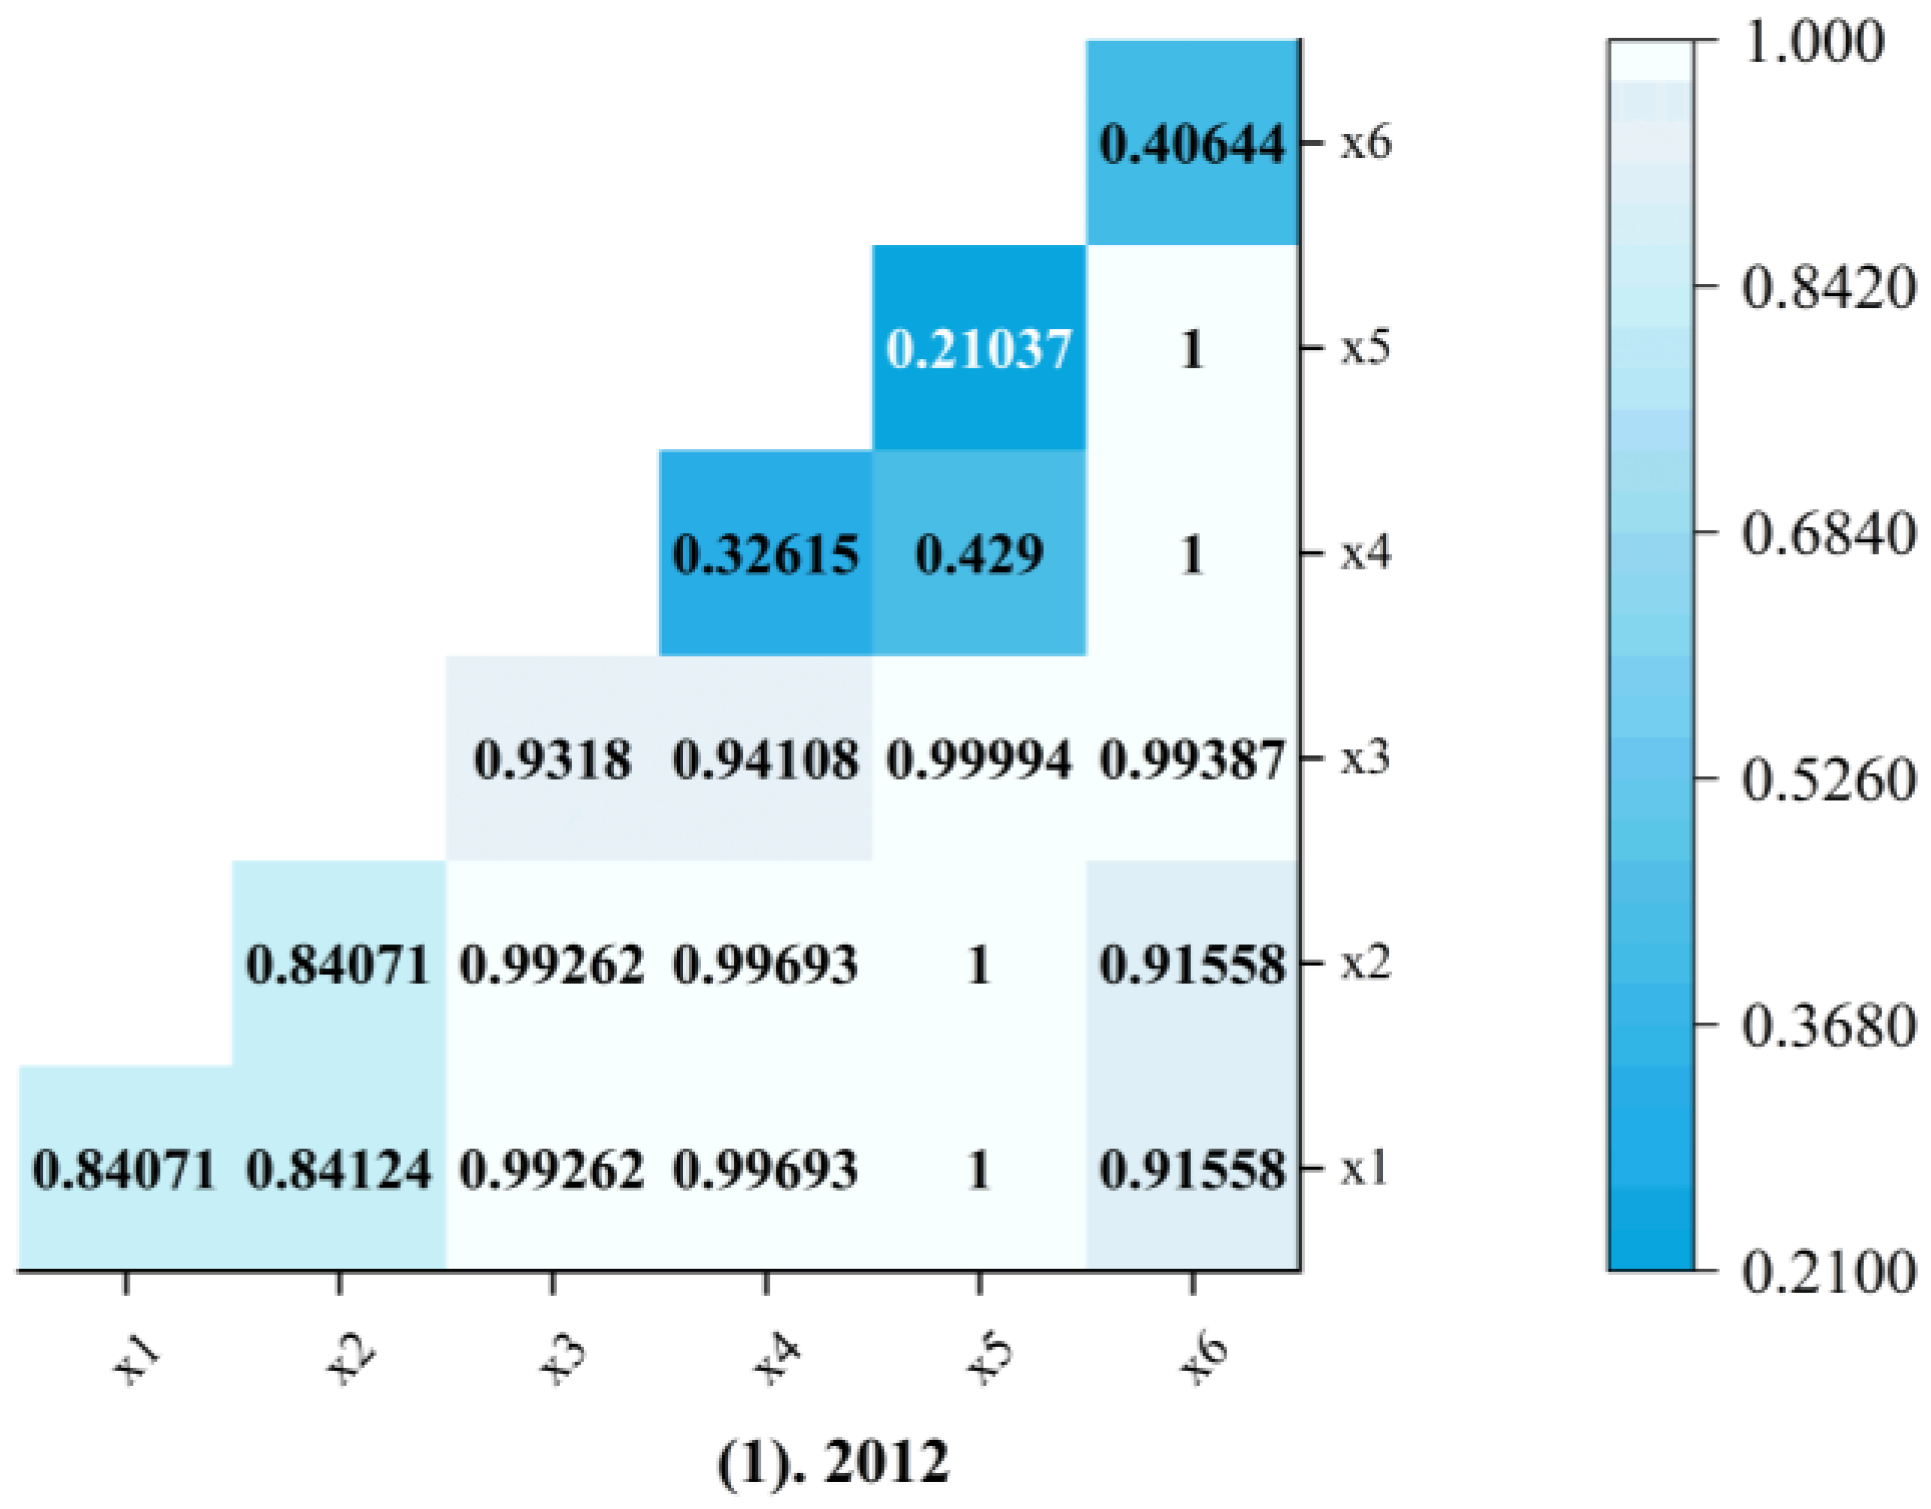
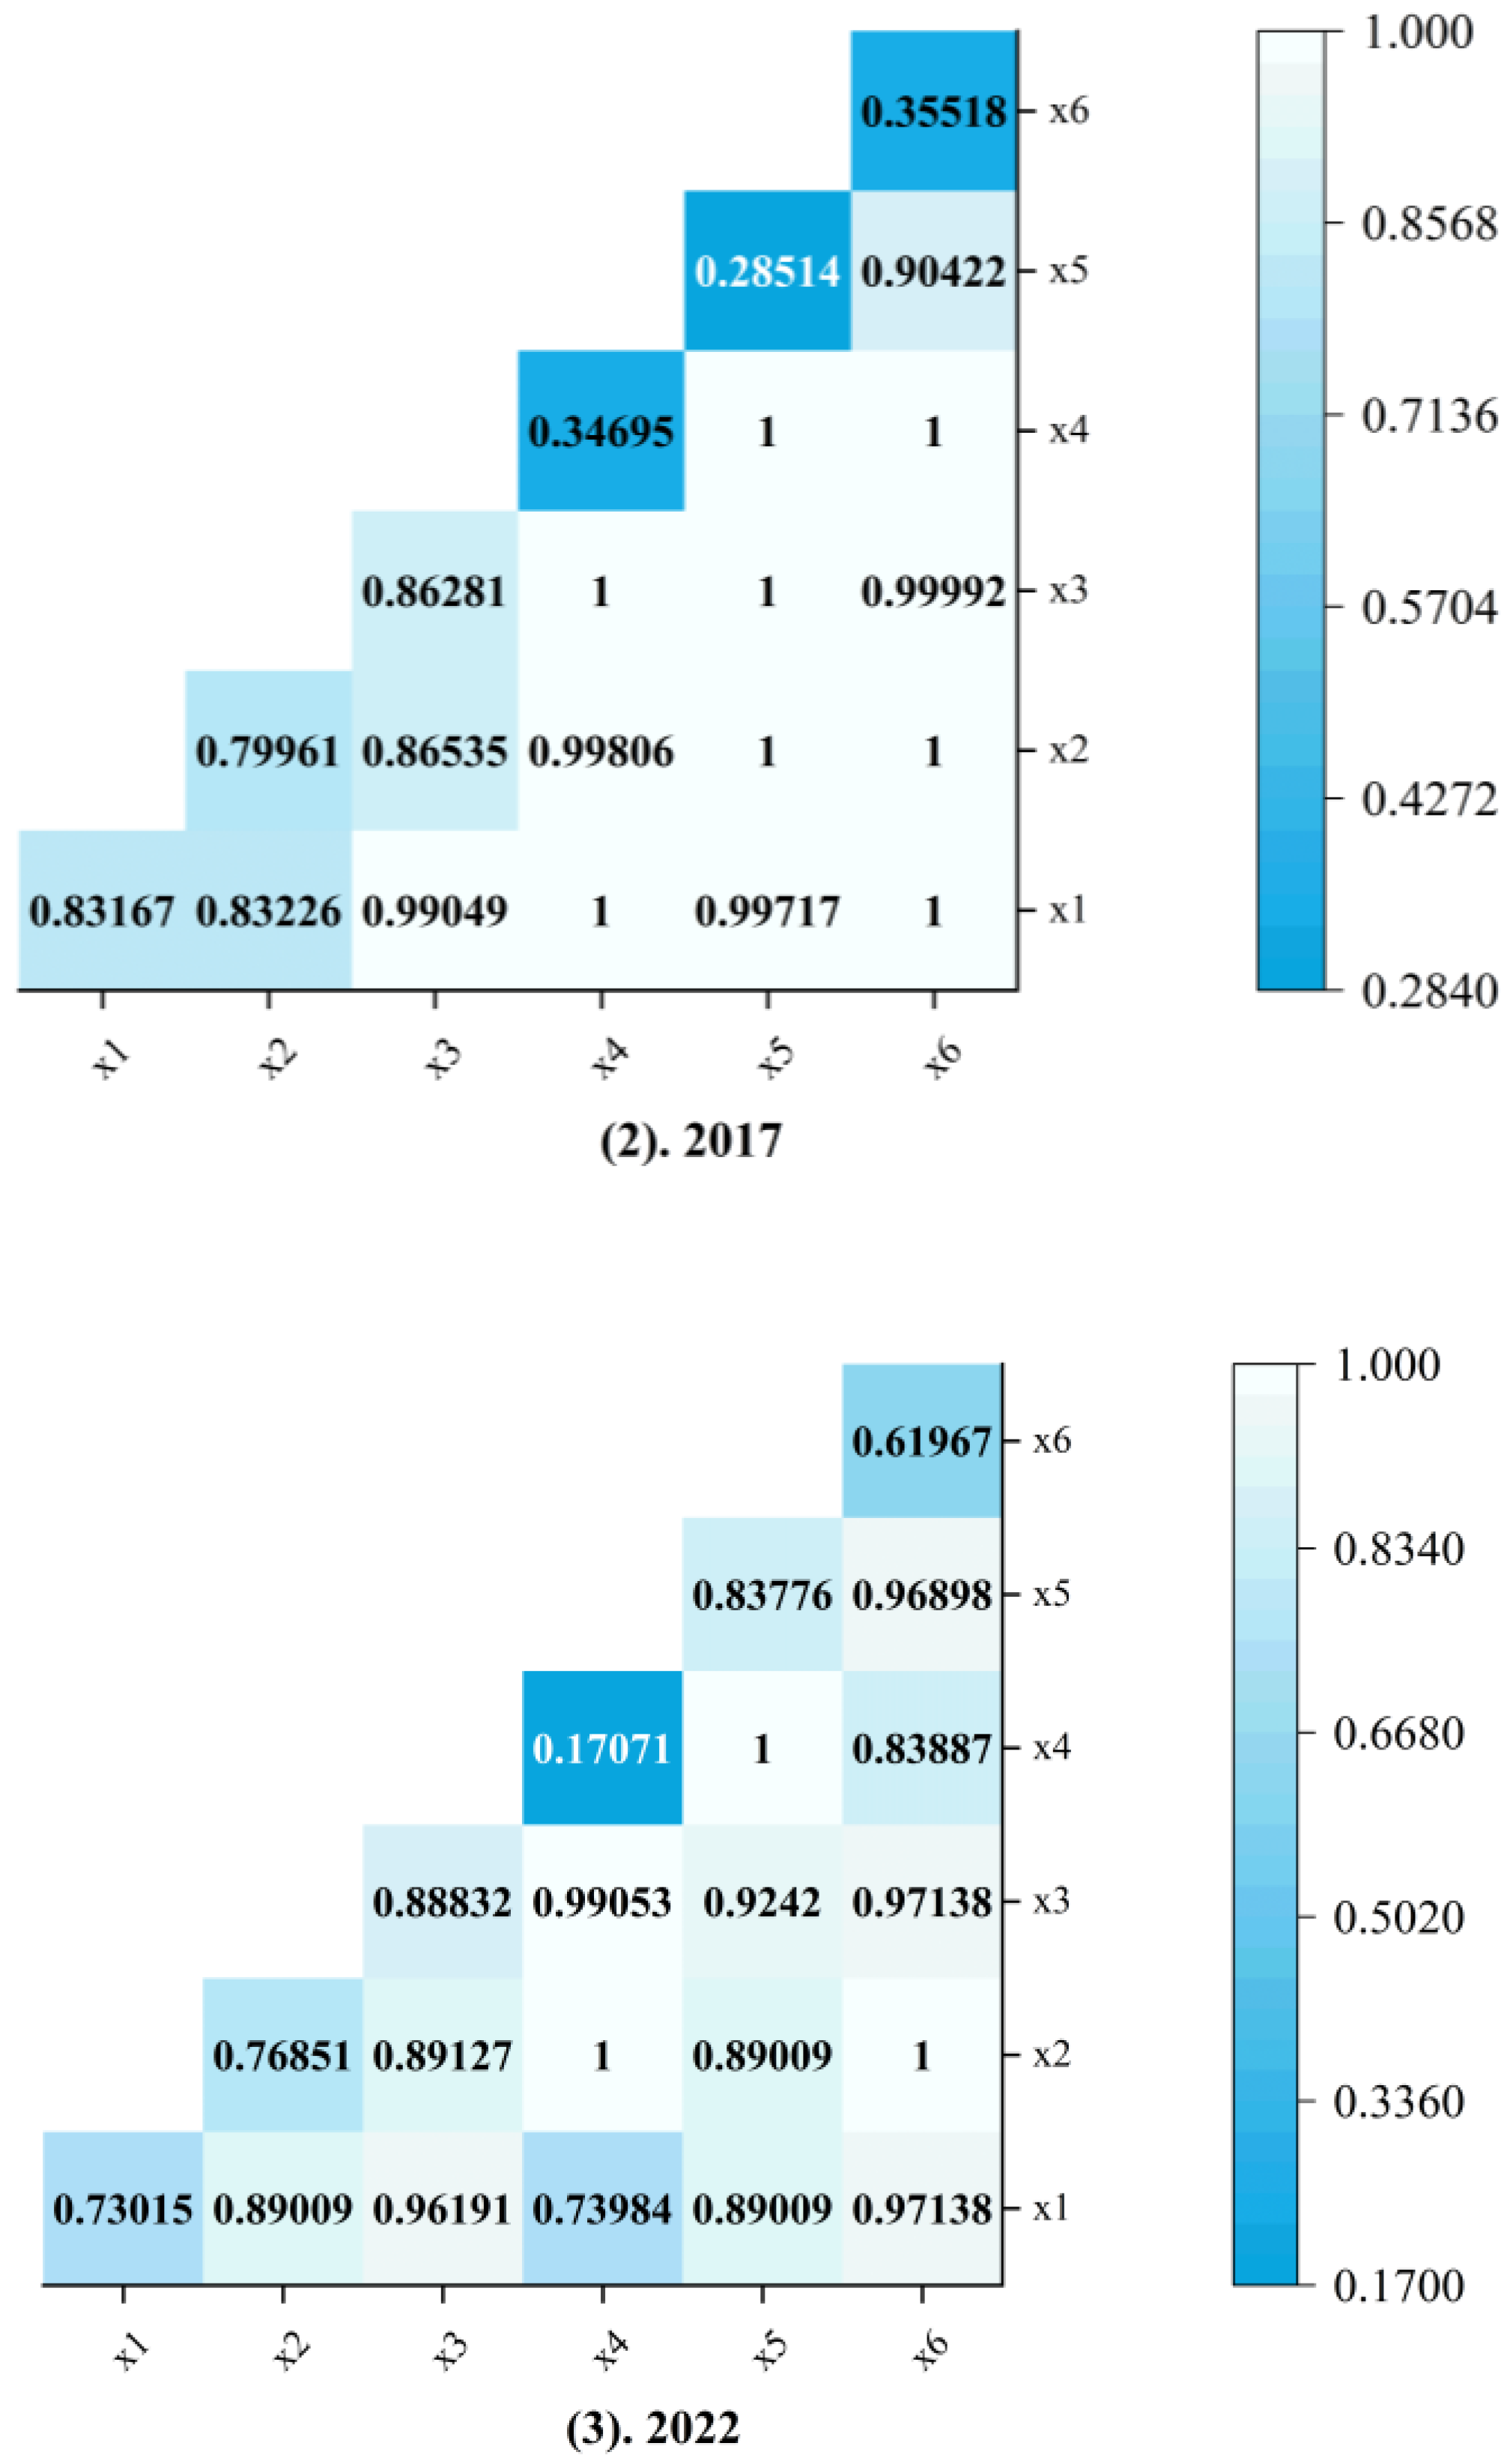
4.2.2. Analysis of Driving Factor Detection Results

We converted the above six driving factors into discrete variables using the natural breaks method in ArcGIS and entered them along with the explained variable into the geographic detector model, obtaining q-values and significance levels (p-values) for the study area in 2012, 2017, and 2022. All factors passed the significance test (p < 0.001), and by sorting the q-values, we obtained the results shown in Figure 7.
During 2012–2022, different driving factors exhibited varying patterns of influence on the coupling coordination between regional economic resilience and port logistics. Except for urbanization level ( X 5 ), which showed a continuous upward trend, all other factors displayed fluctuating states. Information technology level ( X 3 ) consistently occupied the primary driving position throughout the sample period (with a mean q-value of 0.89260), demonstrating the strongest explanatory power. This result is closely related to the construction of “smart port” and other engineering projects in the Guangxi Beibu Gulf Economic Zone. The mean q-values for logistics industry employees ( X 2 ) and financial development level ( X 1 ) ranked second and third, respectively, further revealing the development characteristics of this region’s transition from factor-scale driven to quality-efficiency driven, which aligns with the regional industrial upgrading strategy. The logistics infrastructure level ( X 6 ) had relatively weak explanatory power during 2012–2017, but showed significantly enhanced explanatory power in 2022. Combined with the background of the Pinglu Canal construction, this transformation aligns with infrastructure interdependence theory. Urbanization level ( X 5 ) saw its q-value significantly surge during the sample period, reflecting the driving role of the new-type urbanization strategy on coupling between regional economic resilience and port logistics. Government support ( X 4 ) remained at a relatively low level throughout the sample period, indicating a stage-specific structural mismatch between traditional policy tools and the coupling needs of regional economic resilience and port logistics in this region.
To further explore the influence of interactions between factors on the coupling coordination between regional economic resilience and port logistics, we analyzed data from 2012, 2017, and 2022 using the interaction detection method in the geographic detector, obtaining results as shown in Figure 8. Throughout the sample period, the q-values of all driving factors after interaction were higher than their independent q-values, indicating that the driving effects produced by different driving factors after interaction on the coupling coordination between regional economic resilience and port logistics were all higher than the degree of their independent influence, mainly manifested as two-factor enhancement. Specifically, three characteristics were observed:
The core driving role of information technology level ( X 3 ) was prominent, with its interactions with factors such as financial development level ( X 1 ) and logistics infrastructure ( X 6 ) consistently maintaining high-intensity explanatory power throughout the sample period; the interactive q-value between logistics infrastructure ( X 6 ) and urbanization level ( X 5 ) reached a peak in 2012, then fluctuated downward, recovering to 0.96898 in 2022, showing an overall “U” shape; interactions between government support ( X 4 ) and various factors generally showed a pattern of “initial strengthening followed by differentiation”, with overall q-values peaking in 2017 and differentiating in 2022, where interaction levels between government support ( X 4 ) and logistics industry employees ( X 2 ) continued to rise, while interaction levels with financial development level ( X 1 ) significantly weakened.

5. Discussion

5.1. Coupling Coordination Spatial–Temporal Evolution and Policy Response

This study finds that the temporal evolution path of coupling coordination between regional economic resilience and port logistics in the study area highly aligns with China’s regional development strategies, exhibiting significant policy responsiveness. The persistent bimodal distribution reflects path dependence caused by early regional economic and port layout planning, consistent with findings by Hein (2021) [79] and colleagues. The curve widening characteristic in the later period may result from adaptive adjustments formed through differentiated development strategies when the region responded to trade frictions and pandemic shocks, supporting the viewpoint of Van Oort (2021) [80] and suggesting that the region may mitigate external shocks through polycentralization.
Furthermore, from their spatial evolution, it can be observed that during 2012–2022, regional economic resilience and port logistics in the study area were mostly engaged in a weakly coordinated game, but their mutual promotion and coordination effects have gradually strengthened amid mutual checks and balances. Compared with existing research, this paper addresses the current limitation of relevant studies being confined to developed regions and ports through its analysis of coupling coordination degree between economic resilience and port logistics in the Guangxi Beibu Gulf Economic Zone. Additionally, examining from a spatial–temporal evolution perspective allows for a better grasp of the dynamic changes in coupling degree between the two systems, thereby providing more valuable basis for precisely coordinating the development of regional economic resilience and port logistics.

5.2. Spatial Dynamics and Agglomeration Characteristics

This research enriches the understanding of spatial dynamics in the coupling coordination between regional economic resilience and port logistics through gravity center migration analysis and spatial autocorrelation analysis. The gravity center migration analysis results show that during 2012–2022, all gravity centers were distributed within Qinzhou city, with the overall migration trend revealing a “southeast shift, northwest return” pattern. Moreover, influenced by the global political and economic environment, gravity center movement distances and speeds varied across different years.
Notably, the movement distances were larger and speeds faster during 2012–2013 (global economic recovery period) and 2017–2019 (around the US–China trade war). This may be attributed to the comprehensive implementation of the “Beibu Gulf Economic Zone Development Plan” around 2012 and the continuous deepening of the Belt and Road Initiative after 2017, which injected strong momentum into the region’s economic development, aligning with Cong’s (2021) [81] discussion on the impact of the Belt and Road Initiative on the region’s economy. Concurrently, Qinzhou port, as the core port, achieved rapid expansion and industrial modernization upgrades under policy dividends, significantly enhancing port logistics capabilities. The post-2019 stabilization of gravity center migration coincides with the global trade recovery cycle (Yang, 2024) [82], suggesting a potential correlation between the two phenomena.
The temporal variations in gravity center movement align with research by Xu and Wang (2022) [83], who highlighted how regional policy implementations create “spatial waves” of development affecting infrastructure-economy interactions. Similarly, Chen and Zhao (2023) [84] found that major trade policy shifts often precipitate reconfigurations in port–economy spatial relationships, with movement stabilization indicating maturation of regional coordination mechanisms.
From the global spatial autocorrelation analysis results, it can be seen that the coupling coordination degree between regional economic resilience and port logistics in this area shows an overall positive correlation, with increasing spatial agglomeration degree. This change may be due to the continuous release of policy dividends from the “New Land–Sea Corridor”, forming a positive interaction between logistics networks and economic activities within the region, enhancing self-adaptive capacity against external risks, and effectively maintaining stability in spatial associations (Cao and Ye, 2022) [85]. The local spatial autocorrelation analysis results indicate that high agglomeration areas are mainly distributed in Nanning (NN) and Yulin (YL), while low agglomeration areas are distributed in Fangchenggang (FCG), Chongzuo (CZ), and Qinzhou (QZ).
Nanning’s feature of being far from the origin highlights its position as the “engine” for regional coordinated development. Although Yulin is located in a “high–high” agglomeration area, it is relatively close to the origin, indicating that the improvement in its coupling coordination degree relies more on external driving forces, such as being influenced by Nanning’s spillover effects, while its own industrial foundation (machinery manufacturing, inland ports) has not yet fully transformed into logistics and economic resilience synergistic advantages.

5.3. Driving Mechanisms and Interactive Effects

The driving factor analysis conducted using the geographic detector is critical for in-depth research on potential drivers of coupling coordination between regional economic resilience and port logistics. The dominant role of information technology level ( X 3 ) supports the “digital resilience” theory (Boh et al., 2023) [86], suggesting that high-level information technology construction better enables the region to break through traditional port logistics physical transportation networks by leveraging the flow of digital elements, integrating into the “digital–economy–logistics” ternary symbiotic system, thereby achieving a dynamic balance between improved logistics efficiency and economic risk identification.
This paper further reveals the unique path of digital and logistics synergy distinct from developed regions using the Guangxi Beibu Gulf Economic Zone as an example, also providing an empirical case for the ternary symbiotic system of digital, economy, and logistics. The finding aligns with research by Zhu and Li (2023) [87], who documented how information technology integration transforms traditional logistics nodes into “digital resilience hubs” capable of rapid reconfiguration during supply chain disruptions. Similarly, Panayides and Wiedmer (2021) [88] demonstrated that ports with advanced digital infrastructure demonstrated 27% greater economic stabilization effects during the COVID-19 pandemic compared to traditional ports.
Logistics industry employees ( X 2 ) and financial development level ( X 1 ) also have important driving effects on the coupling coordination between the two systems, indicating that human capital and financial elements are foundational supports for coupling coordination between regional economic resilience and port logistics. The improvement in their coupling coordination degree does not simply rely on labor scale dividends and traditional financial credit expansion, but rather on structural upgrades of human capital and deepening financial service support. Yang and Chen (2023) [89] provide supporting evidence, showing that specialized logistics talent concentrations create “knowledge spillover corridors” between port operations and regional businesses, enhancing systemic resilience through improved communication channels and innovation diffusion.
The reason for the significant improvement in the explanatory power of logistics infrastructure ( X 6 ) may be that the excavation of the Pan-Land Canal drove the construction of related supporting infrastructure, gradually building a multimodal transport system, transforming physical channels into a “resilience skeleton” for regional risk-sharing. The substantial increase in the driving explanatory power of urbanization level ( X 5 ) may be attributed to the relatively rapid urbanization push in the region, where urban population agglomeration has triggered a surge in consumer logistics demand, subsequently driving port logistics to extend toward economic hinterlands, promoting port–industry–city integration, and achieving a resilient transition from mere geographic proximity to risk-sharing between cities and ports within the region.
This finding extends work by Morrissey (2021) [90], who theorized that urbanization creates “demand density thresholds” that transform logistics networks from simple transport mechanisms to integrated risk management systems. The identification of the “technology-finance-infrastructure” trinity reinforces Martin and Sunley’s (2020) [91] “resilience triangle” framework, though our findings suggest that in developing coastal regions, information technology plays a more pivotal role than previously documented in Western contexts.
To further study the influence of driving factors on research objects after interaction, interaction detection methods are often employed (Xu et al., 2021) [92]. From the obtained results, it can be observed that the region has been adapting to the trend of digital information transformation, continuously empowering industries such as logistics and finance through “digital+” approaches, promoting the coupling coordinated development between regional economic resilience and port logistics.
The interaction between logistics infrastructure ( X 6 ) and urbanization level ( X 5 ) reflects a characteristic transition from policy-driven to market-led approaches. In 2012, the initial implementation period of the “Guangxi Beibu Gulf Economic Zone Development Plan”, their interaction q-value reached a peak of 1, reflecting the extensive model of port–city simultaneous expansion under policy drive. Subsequent fluctuating decline exposed structural contradictions between the two in their development, while the final upturn reflects their gradual transition toward market-rule-based endogenous regulation, achieving structural matching between port and city development needs, thereby constructing a higher-level regional economic resilience system.
The interaction results between government support factors and other factors reflect the process of government support models transitioning from initial direct element input to talent and institutional supply, cultivating specialized talent teams for multiple systems including ports, accumulating certain human capital to enhance the self-adaptive capacity of economic systems under risk.

5.4. Limitations and Future Research

This research also has certain limitations: The paper confines the coupling coordination degree values within [0, 1], which may affect assessment precision to some extent. Additionally, regarding the measurement of regional economic resilience, although selected indicators have referenced the vast majority of authoritative literature, due to the complexity of regional economic resilience systems, there may still be deficiencies in indicator selection, potentially failing to fully reflect regional economic resilience conditions. Furthermore, regarding port logistics indicator selection, following the trend of port intelligence, incorporating indicators evaluating port digitalization in the evaluation index system and studying the relationship between digital port logistics and regional economic resilience represents a direction for future research. Finally, although this study detected certain spatial spillover effects during spatial econometric analysis, due to space limitations, this paper has not revealed spatial spillover pathways and distances, which will be a focus for future research.

6. Conclusions and Policy Implications

Taking the Guangxi Beibu Gulf Economic Zone as the research area, this paper constructs comprehensive evaluation index systems for regional economic resilience and port logistics, empirically studying their coupling coordination’s spatial–temporal evolution patterns, spatial autocorrelation, and driving factors. The research findings are as follows:
First, from a temporal change perspective, the coupling coordination level between regional economic resilience and port logistics in the study area showed an overall upward trend during 2012–2022, developing positively toward high coordination levels. Notably, significant bipolar differentiation occurred during the research period, most pronounced in 2012, with this phenomenon subsequently weakening.
Second, from a spatial change perspective, the coupling coordination degree between regional economic resilience and port logistics in the study area achieved a leap-forward improvement, evolving from a “single-core” with Nanning as an “antagonistic coordination city” to a “dual-core” situation with Nanning and Yulin as “good coordination cities”, forming an overall “concentric layer” distribution pattern. Regarding gravity center spatial migration, the research period exhibited an overall “southeast shift–northwest return” dynamic, with the coordination gravity center consistently within Qinzhou city. The dynamic evolution amplitude was relatively large before 2019, subsequently stabilizing.
Third, spatial autocorrelation analysis indicates that the coupling coordination degree between regional economic resilience and port logistics in the study area exhibits positive spatial autocorrelation. “High–high” agglomeration areas for coupling coordination degree are the Nanning and Yulin city areas, with Nanning serving as the “engine” for regional coordination and Yulin influenced by its spillover effects. “Low–low” agglomeration areas are the Fangchenggang and Chongzuo city areas, the “low–high” agglomeration area is the Qinzhou city area, and Beihai city is in a critical area, transitioning from a “low–low” agglomeration area to a “low–high” agglomeration area.
Fourth, the driving mechanism analysis model indicates that the explanatory level of various factors for coupling coordination between regional economic resilience and port logistics generally performs as information technology level > logistics industry employees > financial development level > logistics infrastructure level > urbanization level > government support. Among these, information technology level is the dominant driving factor for coupling coordination between the two systems, with significant enabling effects on their synergy. Regarding interactive effects, significant enhancement through interaction is evident and concentrated among three factors: information technology level, financial development level, and logistics infrastructure level, highlighting the value of “technology–finance–infrastructure” ternary integration. This leads to the conclusion that coupling coordination between regional economic resilience and port logistics results from multiple factors working in concert.
Based on the above research conclusions, we propose the following recommendations:
First, promote deep integration between regional economic resilience and port logistics. Research indicates that their coupling coordination degree remains some distance from optimal coordination and requires further strengthening in the future. Therefore, based on the “buffer–adaptation–transformation” framework of regional economic resilience theory, it is necessary to construct strategic buffer layers at the macro level, promote institutional integration between regional economic resilience and port logistics, and clarify the division of responsibilities among various departments in the complex system. Specifically, in terms of system adaptation, the economic resilience functions of port logistics should be expanded while broadening the application scenarios of port logistics in regional economic resilience development, such as jointly building port hinterland economic corridors and piloting “port logistics + crisis response” models in the three cities of Qinzhou, Beihai, and Fangchenggang. At the transformation level, green transformation of port-adjacent industries should be promoted, and long-term development mechanisms should be jointly constructed through methods such as building resilience assessment indicators and transformation financial instruments.
Second, strengthen regional collaborative development mechanisms and break through the “core–periphery” spatial pattern distribution. Based on core–periphery theory to correct spatial polarization traps, at the macro level, leverage the radiation driving effects of core cities such as Nanning and Yulin to promote industrial docking between core and peripheral cities, infrastructure sharing, and establishing mechanisms for benefit sharing and risk sharing. Focus policy inclination on “low–low” agglomeration areas, enhance economic penetration from high-value areas, plan and cultivate multi-center development nodes, and avoid resource siphoning effects from excessive agglomeration. At the specific micro level, establish cross-regional industrial flying lands in places like Qinzhou, Fangchenggang, and Beihai, coordinating with inland dry ports and industrial parks to improve their collection and distribution systems with hinterlands, thereby gradually reducing development gaps between regions.
Third, promote coordinated efforts among various driving factors to stimulate deep feedback effects between regional economic resilience and port logistics. On one hand, at the macro level, implement regional innovation system theory, fully leverage the key role of digital information technology in coupling coordination between the two systems, focusing on advancing deep integration of digital technology with regional economic resilience and port logistics systems. At the micro level, combining technology embedding theory, promote the specific application of 5G, Internet of Things, and other technologies in port intelligent scheduling, risk warning and other links, and constructing smart port management platforms and regional digital infrastructure sharing mechanisms. Simultaneously, use this as a nexus to promote interaction between digital information technology and finance and logistics industries, strengthening the enabling role of digital information technology for system coupling. On the other hand, strengthen talent cultivation efforts and formulate a “port logistics–regional resilience” compound talent cultivation strategy to achieve dynamic matching between human capital supply and industrial development demands. Specifically, “order-based” talent cultivation projects can be implemented in the Beibu Gulf Economic Zone, with targeted courses in port emergency management, smart logistics, and other areas. Meanwhile, promote port-centered integration of production and city development to foster spatial–temporal synergy between urbanization processes and logistics network expansion, promoting the construction of “port–industry–city” integration demonstration zones in cities such as Qinzhou and Fangchenggang, thereby facilitating sustained alignment between logistics channel capacity and economic resilience needs.

Author Contributions

Data curation, visualization, writing—original draft, formal analysis, H.Y.; Writing—review and editing, methodology, validation, Z.Z.; Funding acquisition, F.Z.; Supervision, L.P.; Visualization, X.W. All authors have read and agreed to the published version of the manuscript.

Funding

This research has received financial support from the National Science Foundation Project of China (grant number: 71662026), the Humanities and Social Sciences Research Fund of the Ministry of Education of China (grant number: 23XJCGJW001) and the Key Research Base of Humanities and Social Sciences of Universities in Guangxi Zhuang Autonomous Region “Beibu Gulf Ocean Development Research Center”.

Data Availability Statement

The raw data supporting the conclusions of this article will be made available by the authors, without undue reservation.

Acknowledgments

This paper was funded by the Key Research Base of Humanities and Social Sciences of Universities in Guangxi Zhuang Autonomous Region ‘Beibu Gulf Ocean Development Research Center’.

Conflicts of Interest

The authors declare that the research was conducted in the absence of any commercial or financial relationships that could be construed as potential conflicts of interest.

References

  1. Elsamadony, M.; Pileggi, S.F.; Liu, J.; Fujii, M. Crafting a Resilient and Sustainable Future amid Major Crises. J. Clean. Prod. 2025, 551, 145583. [Google Scholar] [CrossRef]
  2. Xuebo, Z.; Yaning, L.; Fenghua, S. Evolution and influencing factors’ heterogeneity of urban economic resilience in China. Econ. Geogr. 2024, 44, 64–74. [Google Scholar]
  3. Xu, X.; Wang, H.; Sui, S.; Gong, Z. Can the New Western Land-sea Corridor promote China’s high-quality economic development. In Proceedings of the 2024 International Conference on Economic Data Analytics and Artificial Intelligence, Guangzhou, China, 8–10 November 2024; pp. 154–158. [Google Scholar]
  4. Feng, T.; Yu, X.; Dong, R.; Zhang, F.; Li, C. Spatial-temporal evolution and influencing factors of the coordination degree of “production-living-ecological” functions in Guangxi Beibu Gulf Economic Zone from the coupling perspective. J. China Agric. Univ. 2024, 16, 303–316. [Google Scholar]
  5. Banomyong, R.; Cook, P.; Kent, P. Formulating regional logistics development policy: The case of ASEAN. Int. J. Logist. Res. Appl. 2008, 11, 359–379. [Google Scholar] [CrossRef]
  6. Koray, M.; Kaya, E.; Keskin, M.H. Determining Logistical Strategies to Mitigate Supply Chain Disruptions in Maritime Shipping for a Resilient and Sustainable Global Economy. Sustainability 2025, 17, 5261. [Google Scholar] [CrossRef]
  7. Chen, J.; Ma, H.; Yang, S.; Zhou, Z.; Huang, J.; Chen, L. Assessment of urban resilience and detection of impact factors based on spatial autocorrelation analysis and GeoDetector model: A case of Hunan Province. ISPRS Int. J. Geo-Inf. 2023, 12, 391. [Google Scholar] [CrossRef]
  8. Zhang, Y.; Zhang, J.; Wang, K.; Wu, X. An empirical perception of economic resilience responded to the COVID-19 epidemic outbreak in Beijing-Tianjin-Hebei urban agglomeration, China: Characterization and interaction. Int. J. Environ. Res. Public Health 2021, 18, 10532. [Google Scholar] [CrossRef]
  9. Lean, H.H.; Huang, W.; Hong, J. Logistics and economic development: Experience from China. Transp. Policy 2014, 32, 96–104. [Google Scholar] [CrossRef]
  10. Yeon, J.I.; Hwang, S.; Jun, B. Ports as catalysts: Spillover effects of neighbouring ports on regional industrial diversification and economic resilience. Reg. Stud. 2024, 58, 981–998. [Google Scholar] [CrossRef]
  11. Monios, J.; Wilmsmeier, G. Port systems as spatial networks: Evolution, resilience, and adaptability. Transp. Policy 2022, 125, 229–240. [Google Scholar]
  12. Wang, Y.; Zhang, Q. The bidirectional impacts between port logistics efficiency and urban economic adaptive capacity: A panel analysis of Chinese coastal cities. J. Urban Plan. Dev. 2023, 149, 04022042. [Google Scholar]
  13. Martin, R.; Sunley, P. On the notion of regional economic resilience: Conceptualization and explanation. J. Econ. Geogr. 2015, 15, 1–42. [Google Scholar] [CrossRef]
  14. Reggiani, A.; De Graaff, T.; Nijkamp, P. Resilience: An evolutionary approach to spatial economic systems. Netw. Spat. Econ. 2002, 2, 211–229. [Google Scholar] [CrossRef]
  15. Zhengyun, J.; Qingfang, L.; Jinping, S. Pattern characteristics and evolution mechanism of China’s regional economic resilience. Econ. Geogr. 2023, 43, 1–12. [Google Scholar]
  16. Martin, R. Regional economic resilience, hysteresis and recessionary shocks. J. Econ. Geogr. 2012, 12, 1–32. [Google Scholar] [CrossRef]
  17. Yuling, Z.; Yuting, F. Spatial-temporal characteristics and interaction between integration of culture and tourism and economic resilience in China. Trop. Geogr. 2024, 44, 1252–1265. [Google Scholar]
  18. Cellini, R.; Torrisi, G. Regional resilience in Italy: A very long-run analysis. Reg. Stud. 2014, 48, 1779–1796. [Google Scholar] [CrossRef]
  19. Davies, S. Regional resilience in the 2008–2010 downturn: Comparative evidence from European countries. Camb. J. Reg. Econ. Soc. 2011, 4, 369–382. [Google Scholar] [CrossRef]
  20. Song, Q.; Zhong, S.; Chen, J.; Yang, C.; Zhu, Y. Spatio-temporal evolution of city resilience in the Yangtze River Delta, China, from the perspective of statistics. Sustainability 2023, 15, 1538. [Google Scholar] [CrossRef]
  21. Hundt, C.; Holtermann, L. The role of national settings in the economic resilience of regions: Evidence from recessionary shocks in Europe from 1990 to 2014. Growth Change 2020, 51, 180–206. [Google Scholar] [CrossRef]
  22. Martin, R.; Sunley, P.; Gardiner, B.; Tyler, P. How regions react to recessions: Resilience and the role of economic structure. Reg. Stud. 2016, 50, 561–585. [Google Scholar] [CrossRef]
  23. Munda, G.; Saisana, M. Methodological considerations on regional sustainability assessment based on multicriteria and sensitivity analysis. Reg. Stud. 2011, 45, 261–276. [Google Scholar] [CrossRef]
  24. Boschma, R. Towards an evolutionary perspective on regional resilience. Reg. Stud. 2015, 49, 733–751. [Google Scholar] [CrossRef]
  25. Fath, B.D.; Dean, C.A.; Katzmair, H. Navigating the adaptive cycle: An approach to managing the resilience of social systems. Ecol. Soc. 2015, 20, 24. [Google Scholar] [CrossRef]
  26. Bristow, G.; Healy, A. Innovation and regional economic resilience: An exploratory analysis. Ann. Reg. Sci. 2018, 60, 265–284. [Google Scholar] [CrossRef]
  27. Guo, J.; Yu, S. Evolution of the spatial structure of coastal port logistics network and its influencing factors in China. Trop. Geogr. 2022, 42, 1640–1650. [Google Scholar]
  28. Hesse, M.; Rodrigue, J.P. Guest editorial: Transportation and global production networks. Growth Change 2006, 37, 599–609. [Google Scholar] [CrossRef]
  29. Ye, S.; Cao, Y.; Jiang, Z.R.; Wang, J. Coordination of port logistics development based on mechanical model: A case of the Yangtze River Delta port system. Sci. Geogr. Sin. 2017, 37, 1624–1631. [Google Scholar]
  30. Lim, S.; Pettit, S.; Abouarghoub, W.; Beresford, A. Port sustainability and performance: A systematic literature review. Transp. Res. Part D Transp. Environ. 2019, 72, 47–64. [Google Scholar] [CrossRef]
  31. Tan, L.; Li, W.; Yu, W. Research on synergetic development between efficiency of port logistics and its hinterland economy in Liaoning Province. Econ. Geogr. 2012, 32, 108–113. [Google Scholar]
  32. Debrie, J.; Raimbault, N. The port-city relationships in two European inland ports: A geographical perspective on urban governance. Cities 2016, 50, 180–187. [Google Scholar] [CrossRef]
  33. Lin, B.; Tang, J.; Dai, C.; Lu, B. Spatial effect of digital economy on the coordinated development of port cities. Res. Transp. Econ. 2024, 103, 101385. [Google Scholar] [CrossRef]
  34. Behdani, B.; Wiegmans, B.; Roso, V.; Haralambides, H. Port-hinterland transport and logistics: Emerging trends and frontier research. Marit. Econ. Logist. 2020, 22, 1–25. [Google Scholar] [CrossRef]
  35. Li, Y.; Yin, M.; Ge, J. The impact of port green competitiveness on the hinterland economy: A case study of China. PLoS ONE 2024, 19, e0311221. [Google Scholar] [CrossRef] [PubMed]
  36. Notteboom, T.; Pallis, T.; Rodrigue, J.P. Disruptions and resilience in global container shipping and ports: The COVID-19 pandemic versus the 2008–2009 financial crisis. Marit. Econ. Logist. 2021, 23, 179–210. [Google Scholar] [CrossRef]
  37. Ng, K.Y. Assessing the attractiveness of ports in the North European container transhipment market: An agenda for future research in port competition. Marit. Econ. Logist. 2006, 8, 234–250. [Google Scholar]
  38. Chu, Z. Logistics and economic growth: A panel data approach. Ann. Reg. Sci. 2012, 49, 87–102. [Google Scholar] [CrossRef]
  39. Guarnieri, P.; Cerqueira-Streit, J.A.; Batista, L.C. Reverse logistics and the sectoral agreement of packaging industry in Brazil towards a transition to circular economy. Resour. Conserv. Recycl. 2020, 153, 104541. [Google Scholar] [CrossRef]
  40. Cheung, S.M.S.; Yip, T.L. Port city factors and port production: Analysis of Chinese ports. Transp. J. 2011, 50, 162–175. [Google Scholar] [CrossRef]
  41. Van der Lugt, L.M.; Rodrigues, S.B.; Van den Berg, R. Co-evolution of the strategic reorientation of port actors: Insights from the Port of Rotterdam and the Port of Barcelona. J. Transp. Geogr. 2014, 41, 197–209. [Google Scholar] [CrossRef]
  42. Su, J.; Liu, J.; Zhang, A. Promoting regional coordinated and sustainable development of port, economy, and environment in archipelago: A case study of Zhoushan Port in China. Ocean. Coast. Manag. 2024, 257, 107324. [Google Scholar] [CrossRef]
  43. Zhang, Y.; Li, J. Smart port initiatives and regional economic resilience: A quantitative assessment of digital infrastructure contributions to shock absorption capacity. Marit. Policy Manag. 2023, 50, 365–382. [Google Scholar]
  44. Chen, Y.; Li, X.; Wang, S. Smart port initiatives and regional innovation systems: A multilevel analysis of their synergistic effects on economic resilience. Transp. Policy 2022, 116, 78–92. [Google Scholar]
  45. Rodriguez-Pose, A.; Wilkie, C. Institutions, infrastructure, and regional economic performance in post-COVID-19 recovery. Reg. Sci. Policy Pract. 2021, 13, 1049–1073. [Google Scholar]
  46. Mitchell, M.; Newman, M. Complex systems theory and evolution. Encycl. Evol. 2002, 1, 1–5. [Google Scholar]
  47. Ladyman, J.; Lambert, J.; Wiesner, K. What is a complex system? Eur. J. Philos. Sci. 2013, 3, 33–67. [Google Scholar] [CrossRef]
  48. Hickford, A.J.; Blainey, S.P.; Ortega Hortelano, A.; Pant, R. Resilience engineering: Theory and practice in interdependent infrastructure systems. Environ. Syst. Decis. 2018, 38, 278–291. [Google Scholar] [CrossRef]
  49. Jovović, J.; Popović, S. Investigating volatility spillovers: Connectedness between green bonds, conventional bonds, and energy markets. Res. Int. Bus. Financ. 2025, 76, 102850. [Google Scholar] [CrossRef]
  50. Lawson, C.; Lorenz, E. Collective learning, tacit knowledge and regional innovative capacity. Reg. Stud. 1999, 33, 305–317. [Google Scholar] [CrossRef]
  51. Lambooy, J.G. Knowledge and urban economic development: An evolutionary perspective. Urban Stud. 2002, 39, 1019–1035. [Google Scholar] [CrossRef]
  52. Liao, W.; Jiang, W.; Huang, Z. Spatiotemporal variations of eco-environment in the Guangxi Beibu Gulf Economic Zone based on remote sensing ecological index and granular computing. J. Geogr. Sci. 2022, 32, 1813–1830. [Google Scholar] [CrossRef]
  53. Bingru, C.; Xin, F. Research on coordinated development of port logistics and hinterland economy: A case study of Taicang Port. Geogr. Geo-Inf. Sci. 2019, 35, 126–132. [Google Scholar]
  54. Xie, S.; Sun, M.; Qin, H. Research on the space-time difference of green logistics leading the high-quality development of the Yangtze River Economic belt and the construction of leading strategy: Based on the perspective of resilient economy. China Bus. Mark. 2022, 36, 17–31. [Google Scholar]
  55. Ding, J.J.; Wang, Z.; Liu, Y.H.; Yu, F. Measurement of economic resilience of contiguous poverty-stricken areas in China and influencing factor analysis. Prog. Geogr. 2020, 39, 924–937. [Google Scholar] [CrossRef]
  56. Bělohradský, A. From investment attraction to economic resilience: A study of regional competitiveness. Reg. Stud. 2024, 58, 721–735. [Google Scholar]
  57. Christl, M.; De Poli, S.; Figari, F.; Hufkens, T.; Leventi, C.; Papini, A.; Tumino, A. Monetary compensation schemes during the COVID-19 pandemic: Implications for household incomes, liquidity constraints and consumption across the EU. J. Econ. Inequal. 2024, 22, 411–431. [Google Scholar] [CrossRef]
  58. Zou, X.; Dai, W.; Meng, S. The impacts of digital finance on economic resilience. Sustainability 2024, 16, 7305. [Google Scholar] [CrossRef]
  59. Aldrich, D.P.; Meyer, M.A. Social capital and community resilience. Am. Behav. Sci. 2015, 59, 254–269. [Google Scholar] [CrossRef]
  60. Xie, Y.; Hu, R. Assessing the technical efficiency performance of Chinese ports logistics: Evidence from the DEA and fsQCA. PLoS ONE 2024, 19, e0300655. [Google Scholar] [CrossRef]
  61. Zeng, S.; Fang, Z.; He, Y.; Huang, L. An integrated entropy-COPRAS framework for Ningbo-Zhoushan port logistics development from the perspective of dual circulation. Systems 2022, 10, 131. [Google Scholar] [CrossRef]
  62. Sepehri, M.; Malekinezhad, H.; Hosseini, S.Z.; Ildoromi, A.R. Assessment of flood hazard mapping in urban areas using entropy weighting method: A case study in Hamadan city, Iran. Acta Geophys. 2019, 67, 1435–1449. [Google Scholar] [CrossRef]
  63. Stanković, J.J.; Marjanović, I.; Papathanasiou, J.; Drezgić, S. Social, economic and environmental sustainability of port regions: Mcdm approach in composite index creation. J. Mar. Sci. Eng. 2021, 9, 74. [Google Scholar] [CrossRef]
  64. Akhavan, M. Port Geography and Hinterland Development Dynamics: Insights from Major Port-Cities of the Middle East; Springer Nature: Berlin/Heidelberg, Germany, 2020. [Google Scholar]
  65. Hesse, M. Approaching the relational nature of the port-city interface in Europe: Ties and tensions between seaports and the urban. Tijdschr. Voor Econ. Soc. Geogr. 2018, 109, 210–223. [Google Scholar] [CrossRef]
  66. Nguyen, L.C.; Notteboom, T. The relations between dry port characteristics and regional port-hinterland settings: Findings for a global sample of dry ports. Marit. Policy Manag. 2019, 46, 24–42. [Google Scholar] [CrossRef]
  67. Xu, C.Y.; Li, L. Study on the coordinated development of green logistics and green economy in the Yangtze River Economic Belt. East China Econ. Manag. 2023, 37, 31–39. [Google Scholar]
  68. Wang, S.J.; Kong, W.; Ren, L.; Zhi, D.D. Research on misuses and modification of coupling coordination degree model in China. J. Nat. Resour. 2021, 36, 793–810. [Google Scholar] [CrossRef]
  69. Man, W.; Wang, S.; Yang, H. Exploring the spatial-temporal distribution and evolution of population aging and social-economic indicators in China. BMC Public Health 2021, 21, 1–13. [Google Scholar] [CrossRef] [PubMed]
  70. Ariken, M.; Zhang, F.; Liu, K.; Fang, C.; Kung, H.T. Coupling coordination analysis of urbanization and eco-environment in Yanqi Basin based on multi-source remote sensing data. Ecol. Indic. 2020, 114, 106331. [Google Scholar] [CrossRef]
  71. Thompson, C.A.; Saxberg, K.; Lega, J.; Tong, D.; Brown, H.E. A cumulative gravity model for inter-urban spatial interaction at different scales. J. Transp. Geogr. 2019, 79, 102461. [Google Scholar] [CrossRef]
  72. Tsai, P.J.; Lin, M.L.; Chu, C.M.; Perng, C.H. Spatial autocorrelation analysis of health care hotspots in Taiwan in 2006. BMC Public Health 2009, 9, 1–13. [Google Scholar] [CrossRef]
  73. Li, M.; Abuduwaili, J.; Liu, W.; Feng, S.; Saparov, G.; Ma, L. Application of geographical detector and geographically weighted regression for assessing landscape ecological risk in the Irtysh River Basin. Cent. Asia. Ecol. Indic. 2024, 158, 111540. [Google Scholar] [CrossRef]
  74. Wang, J.F.; Xu, C.D. Geodetector: Principle and prospective. Acta Geogr. Sin. 2017, 72, 116–134. [Google Scholar]
  75. Xu, M.X. Research on the coordinated development of digital circulation and economic resilience in the Yangtze River Economic Belt. J. Commer. Econ. 2023, 23, 188–192. [Google Scholar]
  76. Wang, S.Q. Analysis of the drivers of differences in the level of regional logistics development. J. Commer. Econ. 2020, 8, 132–135. [Google Scholar]
  77. Wu, Y.J.; Yuan, Y.; Hou, L.R. Driving factors of coordinated development of green logistics and green economy in the Yellow River Basin. Sci. Technol. Manag. Res. 2024, 44, 57–66. [Google Scholar]
  78. Xiang, F.; He, W.; Li, Y.; Luo, L.; An, M.; Ramsey, T.S. Coupling coordination of the digital-energy system and its impact on energy efficiency: Evidence from the “2 + 26” cities of Beijing-Tianjin-Hebei, China. Energy Strategy Rev. 2024, 54, 101441. [Google Scholar] [CrossRef]
  79. Hein, C.; Schubert, D. Resilience and path dependence: A comparative study of the port cities of London, Hamburg, and Philadelphia. J. Urban Hist. 2021, 47, 389–419. [Google Scholar] [CrossRef]
  80. Van Oort, F.; Thissen, M. Networked shocks and regional resilience: Implications from Brexit and the Corona pandemic. Sci. Reg. 2021, 20, 3–23. [Google Scholar]
  81. Cong, X. Effect of the new western land-sea corridor and corresponding regional cooperation mechanism. Chin. Soft Sci. 2021, 36, 65–78. [Google Scholar]
  82. Yang, L. From isolation to revival: Trade recovery amid global health crises. Glob. Health 2024, 20, 38. [Google Scholar] [CrossRef]
  83. Xu, S.; Wang, J. Policy wave propagation and regional economic-infrastructure relationships: Evidence from China’s metropolitan regions. Reg. Stud. 2022, 56, 1826–1840. [Google Scholar]
  84. Chen, L.; Zhao, P. Spatial restructuring of port-economy networks under major trade policy shifts: Evidence from China’s coastal regions. Transp. Policy 2023, 134, 172–185. [Google Scholar]
  85. Cao, Z.Q.; Ye, Z.Y. Research on comprehensive evaluation and network construction of regional logistics system under “New Land-sea Corridor”: Guangxi for example. Chin. J. Syst. Sci. 2022, 30, 119–124. [Google Scholar]
  86. Boh, W.; Constantinides, P.; Padmanabhan, B.; Viswanathan, S. Building digital resilience against major shocks. MIS Q. 2023, 47, 343–360. [Google Scholar]
  87. Zhu, K.; Li, W. From logistics hubs to digital resilience nodes: Transformation patterns in China’s coastal port systems. J. Transp. Geogr. 2023, 107, 103547. [Google Scholar]
  88. Panayides, P.M.; Wiedmer, R. Digital transformation and port logistics resilience: Information technology capabilities and digital disruption readiness. Int. J. Oper. Prod. Manag. 2021, 41, 1021–1042. [Google Scholar]
  89. Yang, R.; Chen, W. Specialized logistics talent concentrations and regional economic resilience: An empirical study of China’s port city networks. J. China Univ. Econ. Bus. 2023, 41, 87–102. [Google Scholar]
  90. Morrissey, K. Urbanization, logistics demand, and regional economic resilience: A comparative analysis of coastal megacities. J. Transp. Geogr. 2021, 91, 102932. [Google Scholar]
  91. Martin, R.; Sunley, P. Regional economic resilience: Evolution and evaluation. In Handbook on Regional Economic Resilience; Edward Elgar Publishing: Cheltenham, UK, 2020; pp. 10–35. [Google Scholar]
  92. Xu, L.; Du, H.; Zhang, X. Driving forces of carbon dioxide emissions in China’s cities: An empirical analysis based on the geodetector method. J. Clean. Prod. 2021, 287, 125169. [Google Scholar] [CrossRef]
Figure 1. Research framework.
Systems 13 00524 g001
Figure 2. Study area.
Systems 13 00524 g002
Figure 3. Temporal evolution of coupling coordination degree.
Systems 13 00524 g003
Figure 4. Spatial distribution of coupling coordination degree.
Systems 13 00524 g004
Figure 5. Gravity center migration trajectory of coupling coordination degree.
Systems 13 00524 g005
Figure 6. Local Moran’s I scatter plot.
Systems 13 00524 g006
Figure 7. Factor detection results for regional economic resilience and port logistics coupling coordination.
Systems 13 00524 g007
Figure 8. Interactive factor detection results for regional economic resilience and port logistics coupling coordination.
Systems 13 00524 g008aSystems 13 00524 g008b
Table 1. Regional economic resilience evaluation index system.
System LayerCriteria LayerIndicator LayerIndicator DescriptionAttributeUnit
Regional Economic ResilienceResistance and Recovery CapabilityEconomic Development LevelRegional GDP+CNY 100 million
Residents’ Living QualityPer Capita Disposable Income of Urban Residents+CNY
Employment LevelUrban Registered Unemployment Rate%
Social Stability LevelFiscal Expenditure on Social Security and Employment+CNY 100 million
Foreign Trade DependenceTotal Import and Export/GDP%
Adaptation and Adjustment CapabilityFiscal Self-sufficiencyGeneral Public Budget Revenue/General Public Budget Expenditure+%
Investment IntensityFixed Asset Investment Growth Rate+%
Regional Market ScaleTotal Retail Sales of Consumer Goods/GDP+%
Innovation and Transformation CapabilityIndustrial Structure AdvancementTertiary Industry Added Value/Secondary Industry Added Value+%
Innovation InputR&D Expenditure+CNY 100 million
Innovation Output LevelNumber of Patent Authorizations+items
Talent Resource ReserveNumber of Students in Regular Higher Education Institutions+10,000 persons
Table 2. Port logistics development level evaluation index system.
System LayerCriteria LayerIndicator LayerAttributeUnit
Port LogisticsInput CapacityNumber of Production Berths+count
Number of 10,000-ton Class Berths+count
Infrastructure Investment+CNY 100 million
Output CapacityCargo Throughput+10,000 tons
Container Throughput+10,000 tons
Total Foreign Trade Import and Export+USD 10,000
Table 3. Classification of interactive factors.
Interaction TypeJudgment Condition
Nonlinear Weakening q ( X 1 X 2 ) < m i n ( q ( X 1 ) , q ( X 2 ) )
Uni-factor Nonlinear Weakening m i n ( q ( X 1 ) , q ( X 2 ) ) < q ( X 1 X 2 ) < m a x ( q ( X 1 ) , q ( X 2 ) )
Bi-factor Enhancement q ( X 1 X 2 ) > m a x ( q ( X 1 ) , q ( X 2 ) )
Independent q X 1 X 2 = q ( X 1 ) + q ( X 2 )
Nonlinear Enhancement q ( X 1 X 2 ) > q ( X 1 ) + q ( X 2 )
Table 4. Global Moran’s I index.
YearMoran’s Ip
20120.1360.047
20130.1010.047
20140.1140.06
20150.1260.05
20160.1250.034
20170.1560.054
20180.2480.029
20190.1600.047
20200.2170.033
20210.2040.042
20220.2000.037
Table 5. Selection of driving factors for regional economic resilience and port logistics coupling coordination.
Variable NameVariable Description
Dependent
Variable
Coupling Coordination Degree (Y)Calculated by the coupling coordination model
Independent VariablesFinancial Development Level (X1)Year-end Loan Balance of Financial Institutions/GDP
Logistics Industry Employment (X2)Number of Personnel in Transportation, Storage, and Postal Industries
Information Technology Level (X3)Total Postal and Telecommunications Business Volume
Government Support (X4)Government General Budget Expenditure/GDP
Urbanization Level (X5)Urbanization Rate
Logistics Infrastructure Level (X6)Highway Mileage/Regional Area
Disclaimer/Publisher’s Note: The statements, opinions and data contained in all publications are solely those of the individual author(s) and contributor(s) and not of MDPI and/or the editor(s). MDPI and/or the editor(s) disclaim responsibility for any injury to people or property resulting from any ideas, methods, instructions or products referred to in the content.

