Article

The Causal Impact of Data Elements on Corporate Green Transformation: Evidence from China

School of Economics and Management, Northeast Forestry University, Harbin 150040, China
*
Author to whom correspondence should be addressed.
Systems 2025, 13(7), 515; https://doi.org/10.3390/systems13070515
Submission received: 23 May 2025 / Revised: 21 June 2025 / Accepted: 24 June 2025 / Published: 26 June 2025
(This article belongs to the Special Issue Systems Analysis of Enterprise Sustainability: Second Edition)

Abstract

The positive impact of data elements on enterprise operation has been confirmed by many scholars, but few studies have paid attention to the effect of data elements on corporate green transformation, especially in the context of global climate change. In this study, we employ panel data from Chinese listing firms to identify the casual impact of data elements on corporate green transformation, using the staggered difference-in-differences method. We show that: (a) Data elements exert a significant positive influence on corporate green transformation. This finding holds up in a series of robustness checks; (b) The promoting effect of data elements on green transformation is mediated by alleviating financing constraints and elevating executive green attention; (c) Green governance resilience and green management innovation can strengthen the positive relationship between data elements and green transformation; and (d) The promoting effect is more pronounced in enterprises with larger boards of directors, those located in the eastern regions, and those characterized by higher carbon emission intensities. Overall, we not only provide empirical evidence of optimizing regional data-factor allocation and promoting green technological innovation but also offer theoretical guidance for refining the pathways of corporate green transformation.

1. Introduction

Climate change has emerged as a major challenge globally. The 2021 Sixth Assessment Report by the Intergovernmental Panel on Climate Change (IPCC) indicated that global warming is projected to exceed 1.5 °C relative to pre-industrial benchmarks and that there will be a marked increase in the frequency and intensity of extreme weather events, along with a significant rise in risks to ecosystems and human societies. Against this global backdrop, the signatories to the Paris Accord committed to capping global warming at 2 °C or less. Over the past four decades, China’s swift industrial progress has been characterized by a development pattern marked by “high input, high energy consumption, and high emissions”. This has exacerbated the conflicts among energy consumption, environmental degradation, and economic development [1]. As the world’s largest carbon emitter, China proposed the ‘double carbon’ goal in 2020, targeting a carbon peak in 2030 and carbon neutrality by 2060 [2]. In this policy context, the green transformation and low-carbon development of enterprises, which are at the core of the micro-market, have become a pivotal force in building the green economy and achieving the ‘dual-carbon’ goals.
Corporate green transformation results from the synergistic interplay of multiple factors. Existing studies have explored the antecedents of corporate green transformation from internal and external perspectives. Regarding internal factors, scholars have mainly focused on corporate endogenous motivations and stakeholder impacts. For instance, high-green-focused investors exert pressure on corporations through external channels like ESG-related discussions, incentivizing green transformation [3]. Supply chain finance promotes the green transformation of heavy polluters by optimizing resource allocation and enabling risk sharing [4]. Green financial policies promote the green transformation by increasing investor confidence and maximizing resource allocation [5,6]. Green financial instruments can significantly speed up the green transformation of non-polluting companies through productive property distribution. Regarding external factors, the green transformation of firms is immediately influenced by macro-environmental factors, industrial structures, and corporate financing capabilities [7]. Corporate ESG ratings play a significant role in promoting green technological innovation and low-carbon transformation in a number of ways, including easing financing restrictions, encouraging environmental protection investments, refining governance structures, and improving market reputation [8,9].
Data elements constitute a strategic productive force in the digital economy, integrating with conventional factors—labor, capital, technology, and land—to establish the operational foundation of modern economic systems [10]. Due to their inherent traits, such as non-exclusiveness, growing marginal utility, and high shareability, data elements have a unique role and enormous potential in the new economy [11]. Data elements have become a major driver of China’s economy thanks to the rapid advances of information technology. Their broad inclusion in various industries gives companies’ green transformation a new lease of life. In order to facilitate low-carbon transformations in production processes, the National Development and Reform Commission has further stressed the value of encouraging synergy between data elements and green industries. Additionally, current studies demonstrate that data elements are becoming more significant as a novel production factor and can increase green total factor productivity [12] through technological diffusion and industrial synergy. Furthermore, data factors play a crucial role in environmental governance by driving green technological innovation and optimizing energy structures, thereby significantly reducing carbon emission intensity [12]. Data elements, as a novel production factor, exert significant influence on an enterprise’s total factor productivity. This impact operates through dual mechanisms: direct enhancement of multidimensional capability architectures, and indirect mitigation of internal information asymmetries coupled with reduced supply chain concentration, ultimately elevating corporate innovation performance [13]. Current research also highlights that data elements may contribute to green transformation via pathways such as green process innovation [14].
To further advance the integration of data elements with the green economy, the Chinese government established the National Big Data Comprehensive Pilot Zone (NBDPZ). Among the eight locations designated for NBDPZ by the State Council are Guizhou, Beijing, Tianjin, Hebei, and the Pearl River Delta. The goals were to research the market-based allocation of data components, promote cross-industry data sharing, and promote green technological innovation. Most recent studies have generally assessed the NBDPZ’s impact on regional scientific and technological innovation capacity, urban green transformation, industrial economic growth, and carbon emissions [15,16,17]. The NBDPZ plan substantially increases urban land-use reliability thanks to a triple-intake system incorporating technological innovation, mitigation of resource misallocation, and industrial agglomeration. Additionally, there is an inward-moving trend regarding the policy effect [18]. Also, scholars have focused on how the efficiency of various pilot policies affects data-driven development capabilities, finding that data elements significantly drive regional scientific and technological innovation capacity [19]. Existing studies further indicate that the NBDPZ has gradually become a critical policy instrument for driving green transformation of business and enterprises by constructing a continuous mechanism between ‘data factors’ and ‘green innovation’. Through progressive, staggered, double-difference modelling from the perspectives of carbon emission growth rate and productivity [20], the NBDPZ policy effectively drives urban green transformation. The NBDPZ is a pioneer in the market-based reform of data factors, optimizing engineering resources via data trading businesses, assisting businesses in developing biological data software scenarios, and supporting regular industries in developing contemporary low-carbon models [21,22]. However, the literature does not adequately explore the casual relationship between data elements and corporate green transformation from the perspective of the NBDPZ policy.
Compared with existing studies, the marginal contribution of our study mainly lies in the following factors. First, using the NBDPZ policy as a quasi-natural experiment and applying the staggered difference-in-differences method, we identify the causal impact of data elements on corporate green transformation according to innovation-driven theory, which enriches the literature about data elements’ consequences and the factors influencing corporate green transformation. Second, integrating resource-based theory and hierarchical echelon theory, we bring financing constraints and executive green attention into the theoretical framework and adopt the mediating effect model to analyze how these factors work in the transmission mechanism between data elements and corporate green transformation, shedding light on the previously understudied “black box” of corporate greening driven by data elements. Third, based on resource orchestration theory and dynamic capability theory, we introduce green governance resilience and green management innovation as moderating variables in the empirical design and examine their impact on the relationship between data elements and corporate green transformation from an organizational management perspective, clarifying the boundary conditions under which data elements can empower corporate green transformation.

2. Institutional Background and Research Hypotheses

2.1. Institutional Background

In 2015, the State Council issued the Outline of Action for Promoting the Development of Big Data, acknowledging the worldwide movement to harness big data to advance economic growth, strengthen social governance, and elevate government service quality and oversight effectiveness [23]. The outline stressed the integration of government information platforms, the dismantling of data silos, and the systematic promotion of public data resource accessibility. Guizhou Province was designated to be China’s first NBDPZ that year, marking a shift in China’s big data strategy from central planning to localized pilots. In 2016, the second batch of pilots was launched, featuring two cross-regional zones: Beijing-Tianjin-Hebei and the Pearl River Delta. Additionally, four regional pilots were established in Shanghai, Henan, Chongqing, and Shenyang, along with a big data infrastructure integration-focused pilot in Inner Mongolia [16].
Adopting differentiated functional positioning based on regional endowments, the NBDPZ has made distinct contributions in institutional innovation, data sharing, and industrial integration. Guizhou has pioneered a data element circulation system by issuing eight foundational regulations, including the “Data Element Circulation and Transaction Rules (Trial)”, which clarify data ownership and transaction boundaries to inform national data element marketization [22]. Beijing’s “One District and Three Centres” platform provides access to 18,000 government datasets and integrates an intelligent database with a data factor platform. The Beijing-Tianjin-Hebei Pilot Zone has established a national integrated computing network hub, promoting cross-domain resource allocation driven by data flow [24].

2.2. Research Hypotheses

2.2.1. Data Elements and Corporate Green Transformation

Schumpeter’s innovation-driven theory highlights the significance of disrupting traditional path dependencies through innovation. Data elements, characterized by non-rivalry, reusability, and value derivativeness [25], can facilitate corporate green transformation by enhancing green innovation output and optimizing ESG performance.
Schumpeter’s ‘creative destruction’ offers a theoretical lens on the disruptive impact of data-driven knowledge reorganization and technology spillovers on established innovation constraints [25]. At the quantitative level, the flow of data elements enables the effective integration of green resources and enhances green innovation efficiency [26]. Specifically, data-sharing platforms significantly reduce the cycle time for green patent research and development [13]. This effect is particularly pronounced in energy-intensive industries, where data elements accelerate green patent development through technology diffusion [27], effectively addressing the challenge of ‘innovation islands’. At the qualitative level, data elements contribute to optimizing ESG performance in multiple ways. They enhance the quality of green transformation through innovation diffusion, optimize ESG governance using the Internet of Things (IoT) and machine learning technologies [28], and improve transformation quality by increasing transparency in information disclosure and rating systems. Greater transparency in these areas is also likely to positively impact transformation quality. Unlike traditional capital and labor resources, which are inherently competitive, data elements possess non-competitive characteristics that enable multiple actors to overcome resource constraints in green innovation. Data elements not only shorten green innovation cycles and boost output but also optimize ESG performance by reducing information asymmetry [29,30].
Based on the above theoretical analysis, we formulated the following hypothesis:
Hypothesis 1. 
Data elements play a positive role in facilitating corporate green transformation.

2.2.2. The Mediating Role of Financing Constraints and Executive Green Attention

Based on a Resource-Based View (RBV), an enterprise’s sustainable competitive advantage stems from its control over heterogeneous, scarce, and inimitable strategic resources [31]. Data elements, due to their reusability and derivability [25], can be dynamically integrated to form heterogeneous digital resources that address the intrinsic demand for scarce resources during corporate green transformation. According to RBV theory, as a strategic resource, data elements reshape enterprise financing methods and resource allocation modes through their scarcity and inimitability [32]. The present study used the SA index to measure financing constraints and found that digital finance has the ability to stimulate green investment by easing financing constraints [33]. Data elements reduce the cost of green technology financing by mitigating information asymmetry and optimizing risk assessments conducted by digital financial institutions [5]. Simultaneously, data elements not only enhance the availability of green R&D funding but also serve as transformable digital credit assets. As an example, by lowering the errors of green project investment returns, data elements enhance green project financing accessibility, which serves as an effective means of breaking the vicious cycle of ‘technology lock-in-financing dilemma’ [34]. Data elements decrease green financing constraints, which is conducive to reducing financing risks and achieving corporate green transformation.
Consequently, we propose the following hypothesis.
Hypothesis 2a. 
Data elements drive corporate green transformation by alleviating financing constraints.
According to Upper Echelons Theory (UET), an executive team’s background, cognitive patterns, and value orientations directly influence corporate strategic decisions [35]. The data element program addresses the limitations imposed by regular information confusion on executives’ other ideas through a dual system, comprising enhanced information accessibility and cognitive framing [36,37]. This cognitive reconstruction encourages senior executives to prioritize the allocation of resources toward green innovation. Data elements transform divided economic information into designed decision-making signals through active data collection. This approach increases executives’ “information entropy” and encourages active involvement in green innovation decision-making [38]. In addition, data elements increase the executive team’s focus on environmental information while lowering the cost and complexity of acquiring and processing environmental information [39]. In contrast to traditional decision-making that relies on professional experience, the data element-driven mental app enables professionals to quickly change green work strategies [40]. The direction of corporate resource allocation is directly influenced by an executive’s thinking and consideration of climate issues. Executives are more likely to prioritize green innovation and encourage the integration of data governance with green management [41]. In response, data components reshape the professional team’s emotional models to help make informed choices that promote a firm’s green transformation. Therefore:
Hypothesis 2b. 
Data elements facilitate corporate green transformation by increasing executive green attention.

2.2.3. The Moderating Role of Green Governance Resilience and Green Management Innovation

Based on Resource Orchestration Theory (ROT), corporations realize dynamic resource allocation and value creation through the processes of resource construction, bundling, and utilization [42]. When establishing new tools, businesses must gather information about green transformation and environmental governance. Businesses with stronger green governance resilience can convert fragmented data into actionable green strategies using a dynamic environmental monitoring system [43]. Additionally, these organizations can integrate fragmented monitoring data into data platforms to improve the accuracy and efficacy of information acquisition and prevention [44]. Companies with higher green governance resilience can significantly shorten the process innovation cycle by integrating production and environmental data digital systems significantly during the resource bundling stage [45]. The technical services provided by professional intermediaries can improve the open innovation ability of small and medium-sized enterprises [46]. At the level of resource availability, businesses with higher green governance resilience are better equipped to improve the flexibility of information elements through dynamic selection-creating when changing data element advantages into green transformation activities, which, in turn, drive green transformation actions [40]. Therefore:
Hypothesis 3a. 
Green governance resilience positively moderates the relationship between data elements and corporate green transformation.
Dynamic Capability Theory (DCT) emphasizes that a firm’s competitive advantage stems from its ability to integrate, reconfigure, and adapt to internal and external resources [47]. By being able to quickly implement policies and manage resources, green management innovation provides a vehicle for this goal. Digital transformation can activate dynamic capabilities through the acquisition of external resources and further promote green innovation of enterprises [48]. In particular, green management innovation can integrate multiple resources to achieve dynamic resource allocation, thereby reducing policy-related ESG risks [49,50]. Meanwhile, enterprises can expand their coverage needs into tangible control signals through an environmental data center and maintain the relationship between data elements and green transformation by leveraging resource reconstruction capabilities and environmental adaptability, which can promote the continuous deepening of policy effects [44]. Specifically, enterprises with high green management innovation are better positioned to effectively convert data element policies into a catalyst for their own green transformation.
On the basis of the above analysis, we propose the following hypothesis:
Hypothesis 3b. 
Green management innovation positively moderates the relationship between data elements and corporate green transformation.
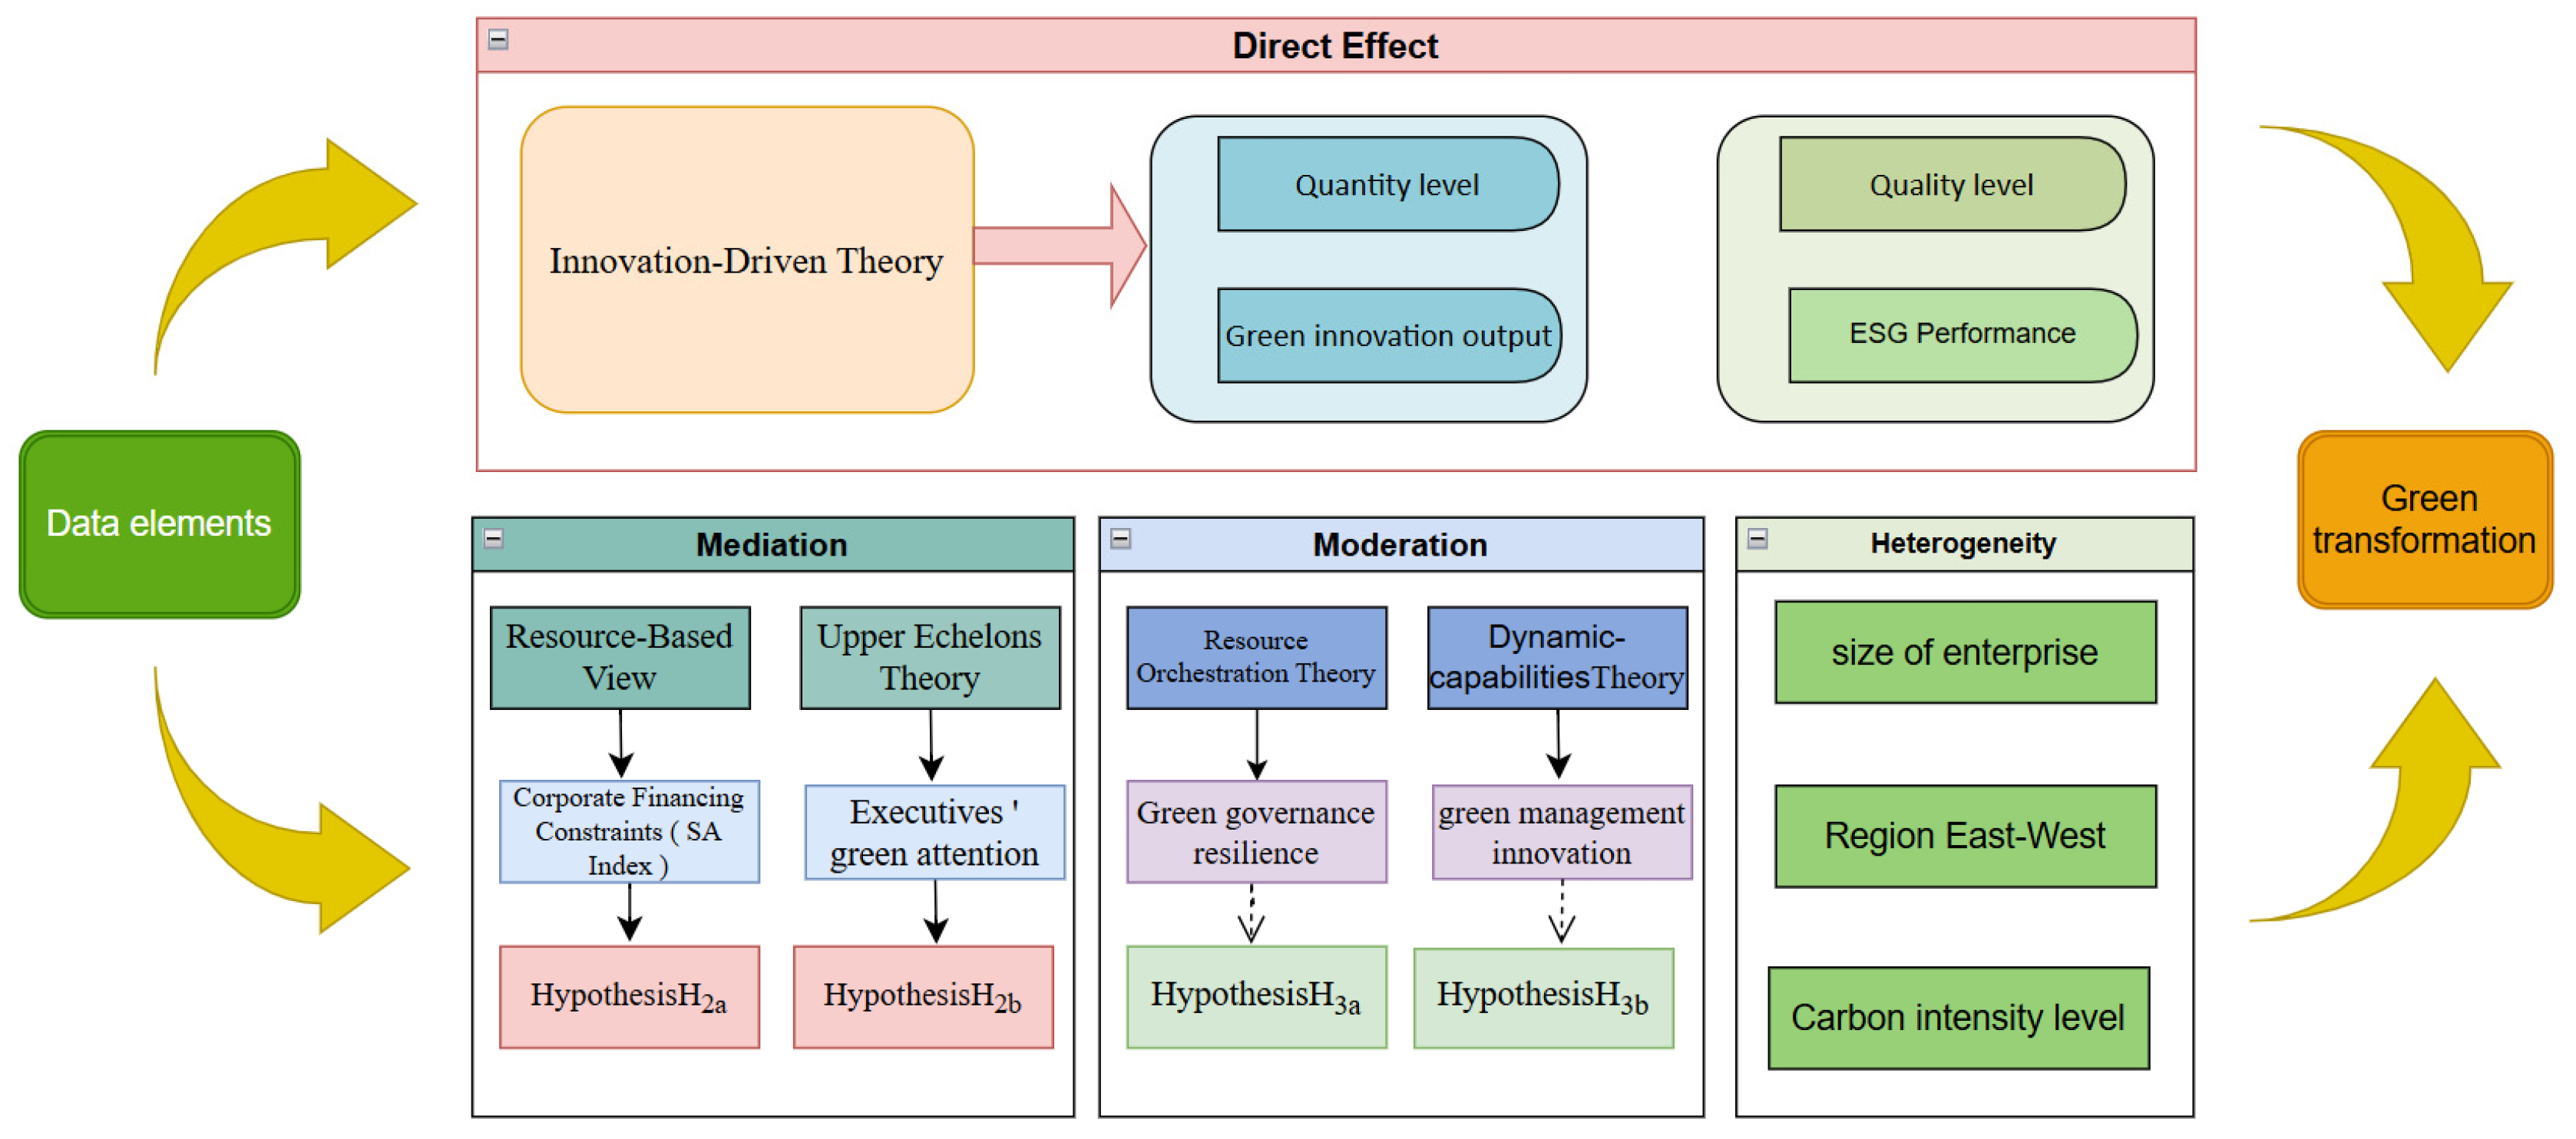
The research framework of our study is illustrated in Figure 1.

3. Methodology

3.1. Identification Strategy

The NBDPZ policy launched its initial pilot program in 2015 and expanded with a second pilot program in 2016. To empirically assess the influence of data elements measured with the NBDPZ policy on corporate green transformation, we employed the staggered difference-in-differences method. This approach facilitates the evaluation of multi-temporal policy shocks when policy implementation times are asynchronous. It is capable of identifying dynamic causal effects and can tackle biases stemming from the treatment of non-synchronous time points [51,52]. Specifically, corporations located within pilot policy adoption areas form the treatment group, and counterparts in non-pilot areas constitute the control group. The expression is as follows:
G T j i t = ϕ 0 + λ 1 t r e a t j × p o s t t + λ 2 c o n t r o l s j i t + λ i + u t + ε i t
where GTjit denotes green transformation of firm i in city j in year t; treatj represents a dummy variable for whether city j is located in the NBDPZ, taking the value of 1 if it is located there; Postt is a dummy variable for before and after the implementation of the NBDPZ policy; controlsjit denotes firm-level and region-level control variables; λi is the corporate fixed effect; ut is the year fixed effect; and εit represents a random disturbance term.

3.2. Variables

3.2.1. Dependent Variables

Based on existing studies [6,53], we used the ESG and GIO variables to evaluate corporate green transformation in terms of “quality” and “quantity”. The three ESG dimensions are social responsibility, environmental protection, and governance mechanisms. These essential elements serve as the fundamental reference indicators for assessing corporate sustainability. Furthermore, corporate ESG ratings can play a significant role in facilitating the green transformation of enterprises. Green innovation intensity is proxied by the natural logarithm of green patent counts augmented by unity, as formalized in prior research [54]. The WIPO-established International Patent Classification (IPC) provides the foundation for patent screening. To achieve automated validation and standardization of natural innovations, we matched the WIPO’s designated alternative technologies tree figures with the IPC essential classification figures of the listed businesses’ inventions.

3.2.2. Independent Variable

This study identified the data element as the key explanatory variable. Specifically, it used the implementation of the NBDPZ policy (denoted as treat×post) as a proxy. The variable treat×post was defined as 1 if the firm (i) was registered in an NBDPZ pilot city and the year (t) was on or after the policy implementation; otherwise, it equaled 0.

3.2.3. Mediating Variables

We defined the financing constraint index (SA) and the executive green attention (EGA) as mediating factors. The SA was measured using two exogenous indicators [55]. A higher general benefit of this library reflected a fund’s greater funding constraints. Following current research [44], we analyzed EGA by analyzing the average daily searches for the term “green transformation” between 2011 and 2022.

3.2.4. Moderating Variables

We employed green management innovation (GMI) and green governance resilience (GGR) as moderating variables. To assess GMI, we propose five specific indicators. Utilizing the environmental supervision and certification disclosure table from the CSMAR environmental database for publicly listed companies, we examined whether these firms had obtained ISO 14001 and ISO 9001 certifications [56,57]. Furthermore, we incorporated additional factors such as their environmental management systems, environmental education and training programs, and specialized environmental initiatives, as detailed in the management disclosure table. The aggregation of these elements resulted in a composite score that served as a proxy measure for corporate green management innovation [58,59]. For GGR, drawing upon relevant studies [60,61], we developed an index system for green governance resilience (GGR) encompassing five dimensions: compliance with pollutant emission standards, occurrence of sudden environmental incidents, instances of environmental violations, cases of environmental petitions, and recognition through environmental honors or awards. Using the Bipolar Resilience Indicator System, we computed a composite score to evaluate overall performance.

3.2.5. Control Variables

Referring to previous studies on the factors affecting corporate green transformation [62,63,64], we took into consideration a range of control variables, including corporate headcount (Peo), age (FA), leverage (Lev), total assets’ net profitability (ROA), return on equity (ROE), operating revenue growth rate (Growth), ratio of tangible assets (Par), total asset turnover/agency cost (Atr), and board size (ND).

3.3. Data and Sample

Our analysis investigated Chinese A-share listing firms in the 2011–2022 period, using firm data from the China Securities Regulatory Commission (CSRC). Control variables were sourced from the China Stock Market and Accounting Research (CSMAR) database and the Wind Financial Database (Wind). Patents related to green technology are submitted to the State Intellectual Property Office (SIPO) and the China Research Data Service Platform (CNRDS), with CNRDS (https://www.chindices.com, accessed on 20 June 2025), providing ESG ratings. The CSMAR database (https://data.csmar.com/, accessed on 20 June 2025) covers Chinese capital markets, macroeconomics, and corporate governance. Sustainability metrics were from firms’ statutory disclosures and the Wind database. The Wind database (https://www.wind.com.cn, accessed on 20 June 2025) offers extensive financial market data, including stocks, bonds, funds, and derivatives.
To ensure data quality, we conducted several data-cleaning procedures. First, we excluded firms with ST and ST* status, as well as those that were missing or had been delisted. Second, to mitigate the influence of outliers on the empirical outcomes, we performed two-sided trimming at the 1% level for all continuous variables. Finally, we addressed missing values through mean imputation and interpolation. After completing these data-cleaning and matching procedures, we obtained 20,999 firm-year observations. Table 1 shows the descriptive analysis results of all variables.

4. Results

4.1. Baseline Regression

To identify the causal impact of data elements on corporate green transformation, we employed the staggered difference-in-differences (DID) method. Baseline regression results are shown in Table 2. Columns (1) and (2) use GIO as the dependent variable, where Column (1) includes only core independent variables, while Column (2) adds control variables for model optimization. Columns (3) and (4) use ESG ratings as the dependent variables, where Column (3) shows results for core independent variables alone and Column (4) adds extra control variables. The coefficients of treat×post in Columns (1)~(4) are all significantly positive. This implies that, all other variables being equal, companies in cities that have been approved for NBDPZ policies have an increase in corporate GIO by 0.0945 units and ESG levels by 0.0391 units compared to those in cities that have not been approved for corresponding policies. Thus, data elements substantially drive corporate green transformation through both GIO and ESG performance, supporting hypothesis H1.

4.2. Robustness Checks

4.2.1. Parallel Trends Test

The parallel trend assumption is crucial for the validity of staggered DID estimates [65]. Drawing on relevant research, we constructed the following event study model for testing [66]:
G T j i t = α 0 + β k t r e a t × p o s t j i t + θ c o n t r o l s j i t + λ i + μ t + ε i t
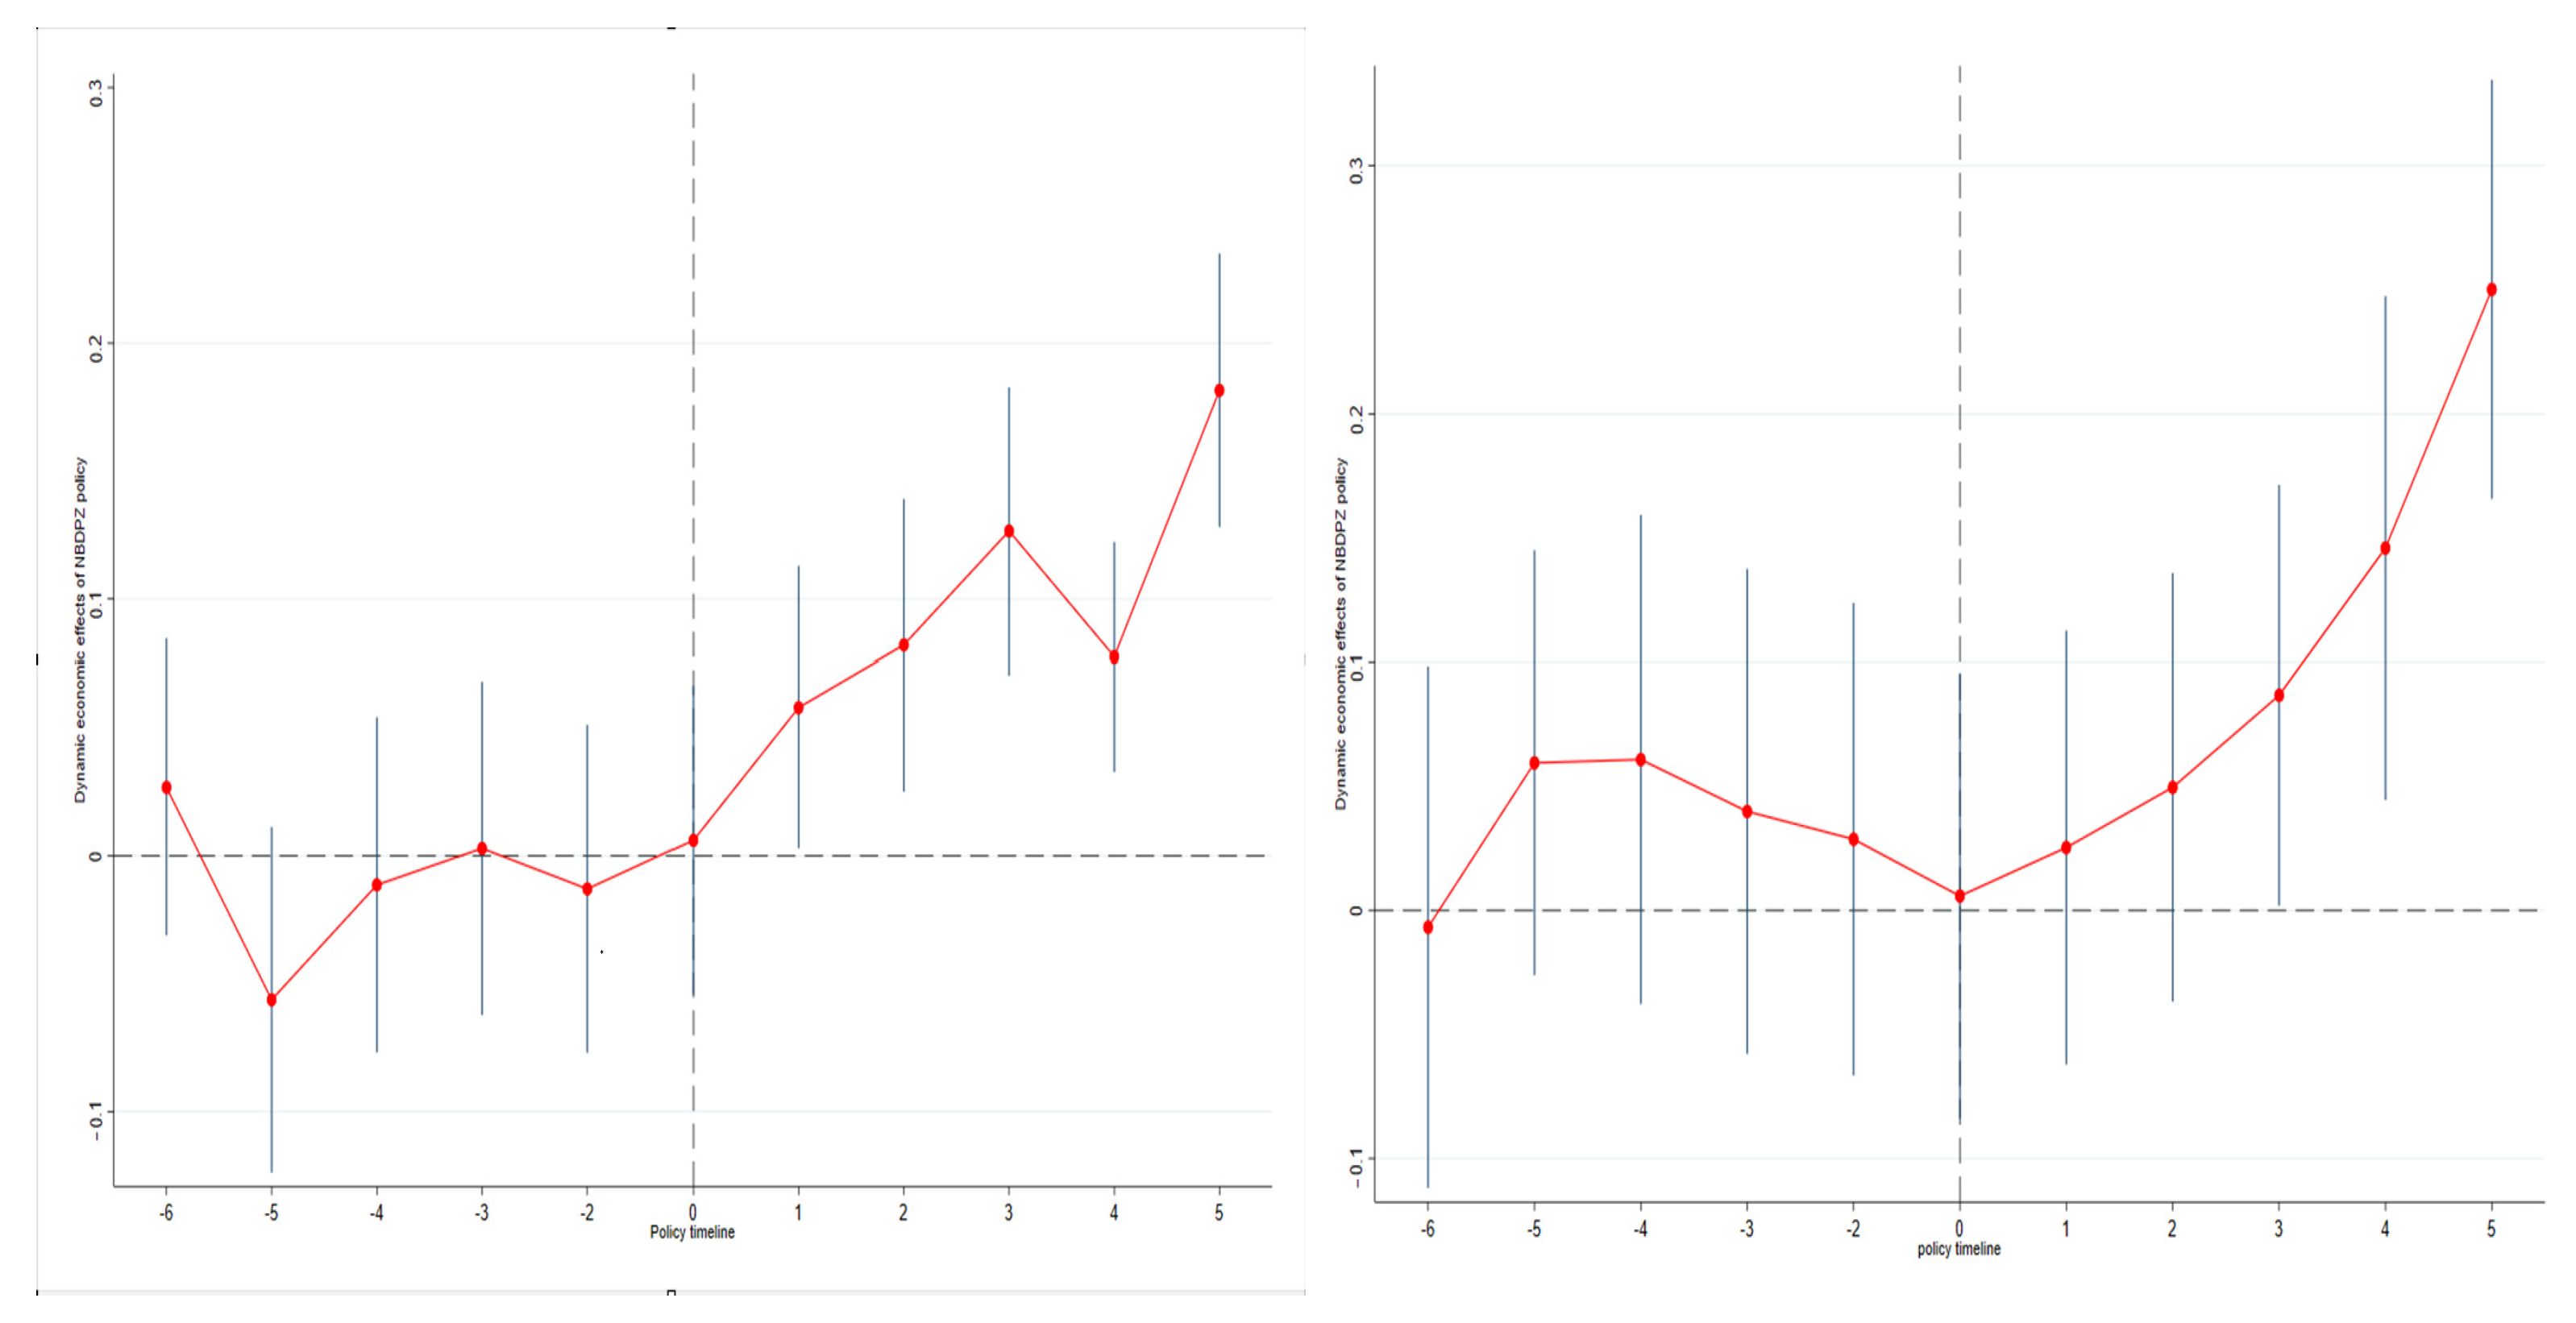
where t e r a t × p o s t j i t k represents a series of policy dummy variables, indicating the kth year before and after the implementation of the policy for enterprise i in city j. The reference period was set as the year before the policy implementation (k = −1). Figure 2 presents the results of the parallel trend test. Coefficient βk estimates for pre-implementation periods demonstrated no statistical significance. This empirical evidence confirmed that treatment and control groups exhibited parallel trends in GIO and ESG performance prior to the policy intervention, thereby satisfying the parallel trends assumption. Post-intervention, coefficients diverged notably from zero, validating the pre-existing trend’s similarity, with confidence intervals excluding zero. This suggests that the NBDPZ policy has significantly influenced the green innovation capabilities and ESG performance of firms in the treatment group post-implementation. Thus, the NBDPZ policy significantly fosters a constructive influence on corporate green transformation efforts.

4.2.2. Placebo Test

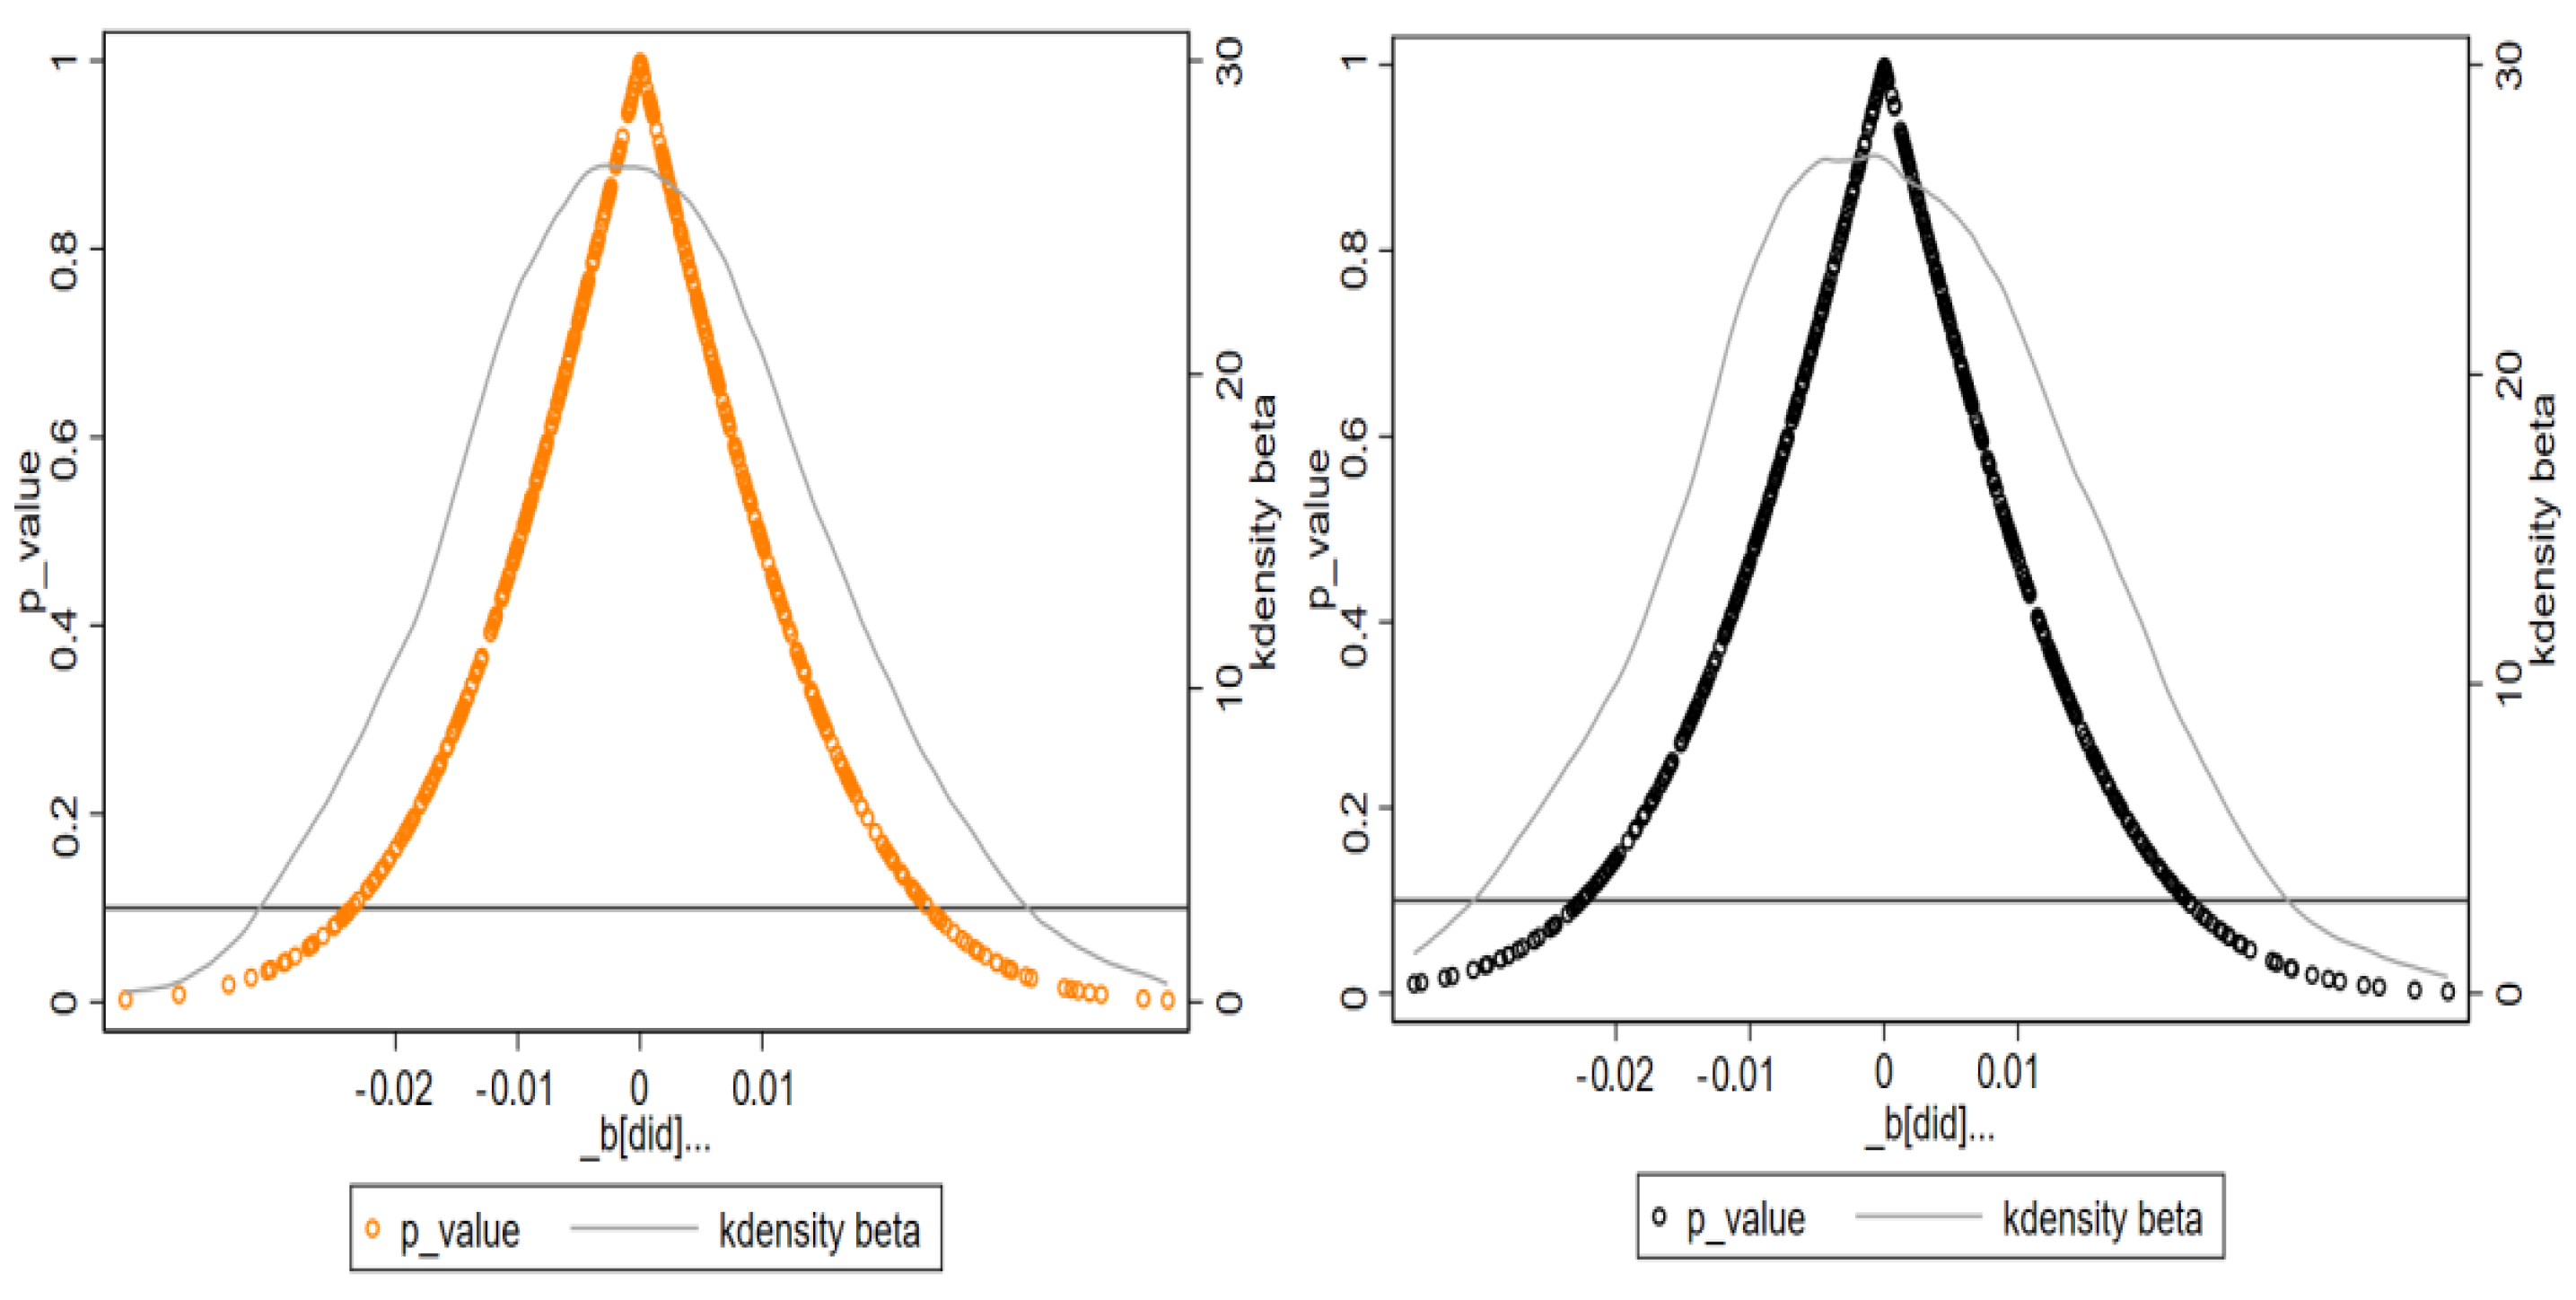
We conducted a placebo test by randomly generating treatment groups and policy timing variables to address the potential impact of unobservable factors. Specifically, we randomly selected firms in specific cities as ‘pseudo-pilot’ groups and assigned random policy implementation years to create dummy variables. Based on these random samples, we performed regression analyses and repeated the randomization 500 times to enhance confidence in our model parameters [67]. After multiple iterations, we summarized and plotted parameter estimates and significance levels for all virtual treatment groups. As shown in Figure 3, the estimated coefficients clustered around zero, and kernel density curves indicated zero-valued clustering without systematic deviations. Cross-axis probability distributions showed that most regressions had probabilities nearing 1, and p-values for dummy coefficients generally exceeded 0.1. These results suggest that the pseudo-treatment group’s intervention effect was not significant under fictional policy scenarios. Thus, the placebo test results indicated that corporate green transformation is not due to chance or model misspecification, reinforcing the robustness of baseline regression.

4.2.3. Counterfactual Scenario

The counterfactual test evaluates the authenticity of a policy effect in a benchmark regression by simulating hypothetical scenarios regarding policy timing or subjects. Assume that the pilot year for each city has been moved forward by two years. If the core explanatory variable remains significant during this adjusted period, it suggests that the green transformation of the corporation could potentially be attributed to other policy alterations or random elements. When combined with the findings in Columns (1)~(2) of Table 3, it is evident that under the simulated policy scenarios, data elements did not significantly affect firms’ green transformation. This indicates that the observed impact of the NBDPZ policy in the benchmark regression was not coincidental or due to model specification bias. Thus, the original benchmark regression results are robust, effectively excluding any ‘pseudo-policy effect’ interference. This further reduces concerns about potential influences from ‘pseudo-policy effects’.

4.2.4. PSM-DID

We compared treatment and control groups using the propensity score matching (PSM) approach to address sample self-selection bias and assess the robustness of legislation surprises. We conducted year-to-year neighborhood matching in a 1:1 ratio with previous studies [54,68]. As characteristics, appropriate variables were taken into account. The impact of information pieces on firms’ green transformation was ultimately estimated using the PSM-DID approach. The results are displayed in Columns (1)~(2) of Table 4. Our results improve the stability of baseline regression analysis, which show that data elements still significantly impact corporate green transformation, even after controlling for set partiality.

5. Further Studies

5.1. Mechanism Analysis

5.1.1. Mediating Mechanisms

In the section on research hypotheses, we proposed that executive green attention (EGA) and stakeholder attention (SA) may play the mediating roles in the relationship between data elements and corporate green transformation. We employed the mediating effect model to assess the roles of EGA and SA. The results are presented in Table 5. The findings in Columns (1)~(3) indicate that EGA exerted a partial mediating effect on the relationship between data elements and corporate green transformation. Similarly, the results displayed in Columns (4)~(6) demonstrate that SA also had a partial mediating effect within this context. These findings suggest that data elements can indirectly facilitate corporate green transformation by enhancing executive green attention and alleviating financing constraints; thus, Hypotheses 2a and Hypotheses2b are supported.

5.1.2. Moderating Mechanisms

Our empirical framework employed interaction terms to investigate the moderating roles of GGR and GMI on the relationship between data elements and corporate green transformation. The identification strategy specified two triple interaction variables: InteractionGGR (treat×post×GGR) and InteractionGMI (treat×post×GMI). We incorporated the two interaction terms into the model for regression analysis.
The moderating mechanism test results are displayed in Table 6. Columns (1)~(2) evaluate the moderating effect of GGR, while Columns (3)~(4) analyze that of GMI. In Columns (1)~(2), the significantly positive coefficients of InteractionGGR indicate that GGR positively moderated the relationship between data elements and corporate green transformation, supporting Hypothesis 3a. Similarly, Columns (3)~(4) show significantly positive coefficients of InteractionGMI, suggesting GMI also had a beneficial moderating effect. Thus, Hypothesis 3b is supported. These findings imply that enterprises with higher green management innovation or governance resilience can better balance short-term policy pressures with long-term ESG goals. Through a well-established green governance framework, they effectively translate policy pressures into management improvements, reducing potential negative impacts during the initial policy implementation phase.

5.2. Heterogeneity Analysis

5.2.1. Board Size

We categorized all sample corporations into large, medium, and small-scale groups based on the size of their boards of directors for the heterogeneity analysis. The findings are in Columns (1)~(2) of Table 7. According to Column (1), data elements played a significantly positive role on green innovation in large- and medium-scale corporations, but this effect was not statistically significant for small-scale corporations. The above results may have been influenced by larger enterprises’ better resource integration capabilities and financial support, which increased their contribution to green innovation output [69]. Further, Column (2) demonstrates that data elements significantly affected large-scale corporations’ ESG performance, while this effect on small- and medium-scale enterprises did not meet significance thresholds. The possible reason is that larger enterprises may have been able to meet needs through internal or external financing options [70]. Consequently, this dynamic enhanced ESG performance among larger entities [71]. In contrast, small- and medium-scale enterprises rely more heavily on additional policy tools to enhance ESG performance, which is frequently less successful [72].

5.2.2. Spatial Location

We classified corporations’ locations into eastern, central, and western regions for the heterogeneity analysis; the results are showed in Columns (1)~(2) of Table 8. Column (1) indicates that data elements significantly enhanced corporate green innovation in the eastern and central regions, but not in the western region. This disparity may be attributed to the better alignment of data elements with the economic conditions in the eastern and central regions, which alleviates financial pressures and subsequently supports green investments [53]. In contrast, the western region exhibited lower levels of digital coverage and innovation [73]. Column (2) reveals that data elements substantially improved ESG performance in both eastern and central regions. However, this effect was not observed in the western region. This phenomenon may have stemmed from the more advanced economies and infrastructure present in the eastern and central regions, which enable them to effectively leverage policies such as NBDPZ [74]. The western region’s weaker foundational structures and smaller population contributed to a slower adoption of ESG performance, resulting in less pronounced incentives from data elements.

5.2.3. Carbon Emission Intensity

We classified corporations into high- and low-carbon emission intensity groups based on established criteria for the heterogeneity analysis; the results are shown in Columns (1)~(2) of Table 9. Column (1) shows that data elements significantly promoted green innovation in high carbon emission intensity corporations. However, their impact on low carbon emission intensity corporations was not statistically significant. This may have been due to stricter environmental regulations faced by high-emission corporations. Additionally, pilot policies for carbon trading notably boosted green innovation in high-polluting industries [75]. In contrast, low carbon emission intensity enterprises exhibited limited policy response elasticity because of technology path dependency, resulting in less pronounced innovation output [8]. As indicated in Column (2), data elements significantly enhanced ESG performance among high carbon emission intensity corporations but did not influence low emissions corporations. This can be attributed to the greater engagement of high-emission enterprises in terms of utilizing data for technological innovation due to higher environmental governance costs, leading to clearer ESG performance outcomes [76]. In settings of low-carbon emission intensity, where environmental governance is more effective, the potential for optimizing ESG through data elements is limited [77].

6. Conclusions

The National Big Data Comprehensive Pilot Zone is a key Chinese strategy for optimizing regional data element resource allocation and promoting corporate green transformation. This study used the staggered difference-in-differences method and data from listed companies from 2011 to 2022 to explore the casual impact of data elements on corporate green transformation and the mechanisms behind it. The findings are as follows: (a) Data elements significantly promote corporate green transformation, particularly in driving green innovation at the action level. These results were found to be robust in various robustness checks; (b) Data elements alleviate financing constraints and increase executive green attention, thereby facilitating corporate green transformation; (c) Green management innovation and governance resilience positive moderate the promoting effect of data elements on corporate green transformation; (d) A heterogeneity analysis showed that the positive impact of data elements on corporate green transformation is more obvious in large-scale, eastern regions and high-carbon emission intensity corporations.
This study has significant theoretical implications. First, from a theoretical standpoint, it extends the existing literature and systematically elucidates how data elements, as a novel type of production factor, enable the green transformation of corporate. This study enriches the literature on data elements and corporate green transformation within innovation-driven theory and provides a foundation for understanding the synergy between digital and green initiatives. Second, it combines the resource-based view and upper echelons theory to explore the mediating mechanism of data elements in corporate green transformation. By introducing the SA index and EGA as mediators, it clarifies how data elements affect this process and offers theoretical insights into their impact on corporate green transformation. Third, drawing on resource orchestration and dynamic capability theories, it examined how GGR and GMI moderate the effect of data elements on corporate green transformation. This provides an innovative viewpoint for examining corporate sustainability within the evolving digital economic landscape.
This study has several practical implications. Given the importance of corporate green transformation in terms of achieving the ‘dual-carbon’ goals and sustainable development, empowering corporations with data elements provides a feasible way forward. First, the baseline regression findings indicated that the NBDPZ policy is exerting a significant positive impact on corporations’ green transformation, with a particularly pronounced effect on GIO. We recommend that the government augment its financial support for the NBDPZ policy, steadily broaden the scope of policy pilots, and conduct regular evaluations of policy implementation efficacy. This involves setting up experimental zones in regions with a well-established digital economy base and considerable industrial development potential. Second, the implementation of differentiated regional strategies is imperative. Based on the results of the heterogeneity analysis, we suggest scaling up the NBDPZ policy primarily within eastern and central regions. By establishing a comprehensive data element platform with extensive coverage, the government can facilitate the efficient circulation and sharing of data elements among enterprises, which, in turn, would support their endeavors in green transformation. For corporations located in western regions, initial steps should involve strengthening training programs and promotional activities aimed at cultivating digital talent while also enhancing digital infrastructure to improve overall digital accessibility. Lastly, local governments may introduce relevant policies and regulations designed to incentivize enterprises with varying carbon intensities toward achieving green transformation goals. For enterprises characterized by high carbon emission intensity, setting emission reduction standards along with providing incentives for ESG performance and GIO initiatives could effectively guide them toward sustainable practices.
This study also had several limitations. First, there were certain limitations regarding the sample selection and research context. This study exclusively focused on Chinese A-share listed firms and did not include MSMEs. Moreover, the research unfolded within a particular national regulatory setting, which made it difficult to generalize the findings to other countries or economic systems with different institutional traits. As a result, the broader applicability of our results is restricted. Future research could contemplate including MSMEs in the sample and extending the investigation to diverse institutional contexts to evaluate the generalizability of the paper’s findings. Second, the mechanism analysis could be further expanded. Unexamined mediating or moderating variables, such as enterprise digital capabilities and regional innovation ecosystems, might influence the data elements and green transformation relationship. Third, our analysis relied solely on the NBDPZ policy for data-element shocks, neglecting other relevant policies like the ‘East Counts, West Counts’ project. Future research could explore how multiple policy shocks affect corporate green transformation. Fourth, although our study comprehensively utilized classical theories such as the RBV, UET, ROT, and DCT to analyze the influence mechanisms of data elements on corporate green transformation, it failed to introduce a new theoretical paradigm. Future research should strive to go beyond traditional theoretical boundaries to explore novel theoretical categories.
Author Contributions

Conceptualization, S.Z. and W.H.; methodology, S.Z. and W.H.; software, S.Z. and W.H.; validation, W.H.; formal analysis, S.Z., W.H. and X.W.; investigation, S.Z., W.H. and X.W.; resources, W.H.; data curation, S.Z. and W.H.; writing—original draft preparation, S.Z. and W.H.; writing—review and editing, S.Z. and W.H.; visualization, X.W.; supervision, W.H.; project administration, S.Z. and W.H. All authors have read and agreed to the published version of the manuscript.

Funding

This research was funded by the Fundamental Research Funds for the Central Universities (Grant number: 2572024DZ42) and Heilongjiang Province Philosophy and Social Science Research Planning Project (Grant number: 24GLC022).

Data Availability Statement

Data will be available if requested.

Conflicts of Interest

The authors declare no conflict of interest.

References

  1. Li, D.; Zeng, T. Are China’s intensive pollution industries greening? An analysis based on green innovation efficiency. J. Clean. Prod. 2020, 259, 120901. [Google Scholar] [CrossRef]
  2. Jia, X.; Zhang, Y.; Tan, R.R.; Li, Z.; Wang, S.; Wang, F.; Fang, K. Multi-objective energy planning for China’s dual carbon goals. Sustain. Prod. Consum. 2022, 34, 552–564. [Google Scholar] [CrossRef]
  3. Aluchna, M.; Roszkowska-Menkes, M.; Kamiński, B.; Bosek-Rak, D. Do institutional investors encourage firm to social disclosure? The stakeholder salience perspective. J. Bus. Res. 2022, 142, 674–682. [Google Scholar] [CrossRef]
  4. Zhang, D. Green financial system regulation shock and greenwashing behaviors: Evidence from Chinese firms. Energy Econ. 2022, 111, 106064. [Google Scholar] [CrossRef]
  5. Li, J.; Zhang, G.; Ned, J.P.; Sui, L. How does digital finance affect green technology innovation in the polluting industry? Based on the serial two-mediator model of financing constraints and research and development (R&D) investments. Environ. Sci. Pollut. Res. 2023, 30, 74141–74152. [Google Scholar] [CrossRef]
  6. Tan, X.; Liu, G.; Cheng, S. How does ESG performance affect green transformation of resource-based enterprises: Evidence from Chinese listed enterprises. Resour. Policy 2024, 89, 104559. [Google Scholar] [CrossRef]
  7. Gong, W.; Zhou, Y.; Wang, C.; Xia, F.; Zheng, X.; Sun, J. Multi-Level Disparities in Green Development and Dynamic Impacts of Driving Factors Amid Carbon Emission Constraints: A Comparative Study of Mid-Downstream Regions in the Yellow River Basin. Pol. J. Environ. Stud. 2025; online first. [Google Scholar] [CrossRef]
  8. Yang, X.; Li, Z.; Qiu, Z.; Wang, J.; Liu, B. ESG performance and corporate technology innovation: Evidence from China. Technol. Forecast. Soc. Change 2024, 206, 123520. [Google Scholar] [CrossRef]
  9. Wang, J.; Ma, M.; Dong, T.; Zhang, Z. Do ESG ratings promote corporate green innovation? A quasi-natural experiment based on SynTao Green Finance’s ESG ratings. Int. Rev. Financ. Anal. 2023, 87, 102623. [Google Scholar] [CrossRef]
  10. Qi, P.; Sun, D.; Xu, C.; Li, Q.; Wang, Q. Can Data Elements Promote the High-Quality Development of China’s Economy? Sustainability 2023, 15, 7287. [Google Scholar] [CrossRef]
  11. Yang, J.; Yang, D.; Cheng, J. The non-rivalry of data, directed technical change and the environment: A theoretical study incorporating data as a production factor. Econ. Anal. Policy 2024, 82, 417–448. [Google Scholar] [CrossRef]
  12. Lyu, Y.; Wang, W.; Wu, Y.; Zhang, J. How does digital economy affect green total factor productivity? Evidence from China. Sci. Total Environ. 2023, 857, 159428. [Google Scholar] [CrossRef] [PubMed]
  13. Huang, P.; Chen, X. The impact of data factor-driven industry on the green total factor productivity: Evidence from the China. Sci. Rep. 2024, 14, 25377. [Google Scholar] [CrossRef] [PubMed]
  14. Tian, H.; Li, Y.; Zhang, Y. Digital and intelligent empowerment: Can big data capability drive green process innovation of manufacturing enterprises? J. Clean. Prod. 2022, 377, 134261. [Google Scholar] [CrossRef]
  15. Wang, W.; Zhang, H.; Sun, Z.; Wang, L.; Zhao, J.; Wu, F. Can digital policy improve corporate sustainability? Empirical evidence from China’s national comprehensive big data pilot zones. Telecommun. Policy 2023, 47, 102617. [Google Scholar] [CrossRef]
  16. Hu, X.; Jiang, Y.; Guo, P.; Li, M. How does China’s big data policy affect the digital economy of cities? Evidence from national big data comprehensive pilot zones. Heliyon 2024, 10, e24638. [Google Scholar] [CrossRef] [PubMed]
  17. Feng, D.; Zhang, Y.; Lu, Y.; Duan, L. Big data and regional digital innovation: Evidence from China. Appl. Econ. Lett. 2024; early access. [Google Scholar] [CrossRef]
  18. Xu, N.; Zhao, D.; Zhang, W.; Zhang, H.; Chen, W.; Ji, M.; Liu, M. Innovation-Driven Development and Urban Land Low-Carbon Use Efficiency: A Policy Assessment from China. Land 2022, 11, 1634. [Google Scholar] [CrossRef]
  19. Zhong, C.; Zhang, C. Can data elements enhance urban innovation? Evidence from China. China Econ. Rev. 2024, 88, 102307. [Google Scholar] [CrossRef]
  20. Hui, C.X.; Dan, G.; Alamri, S.; Toghraie, D. Greening smart cities: An investigation of the integration of urban natural resources and smart city technologies for promoting environmental sustainability. Sustain. Cities Soc. 2023, 99, 104985. [Google Scholar] [CrossRef]
  21. Cheng, L.; Wang, X.; Zhang, S.; Zhao, M. On corporate total factor productivity: Public procurement. Manag. Dec. 2025, 63, 76–100. [Google Scholar] [CrossRef]
  22. Dong, L.; Zhu, X.; Yang, L.; Jiang, G. Unleashing the power of data element markets: Driving urban green growth through marketization, innovation, and digital finance. Int. Rev. Econ. Financ. 2025, 99, 104070. [Google Scholar] [CrossRef]
  23. Lin, X. A Model of Big Data-Based Governance: China’s National Government Big Data Platform and an Analysis of Its Governance Competence. Chin. Political Sci. Rev. 2025; early access. [Google Scholar] [CrossRef]
  24. Tian, Y.; Kan, C.; Li, X.; Dang, A. An analysis of agglomeration structure for Beijing, Tianjin, and Hebei based on spatial-temporal big data. Comput. Urban Sci. 2024, 4, 11. [Google Scholar] [CrossRef]
  25. Jones, C.I.; Tonetti, C. Nonrivalry and the Economics of Data. Am. Econ. Rev. 2020, 110, 2819–2858. [Google Scholar] [CrossRef]
  26. Xie, k. A Review of Green Innovation Research on Digital Transformation Enabling Enterprises. E-Commer. Lett. 2024, 13, 798–805. [Google Scholar] [CrossRef]
  27. Zhu, L.; Luo, J.; Dong, Q.; Zhao, Y.; Wang, Y.; Wang, Y. Green technology innovation efficiency of energy-intensive industries in China from the perspective of shared resources: Dynamic change and improvement path. Technol. Forecast. Soc. Change 2021, 170, 120890. [Google Scholar] [CrossRef]
  28. Ghallabi, F.; Souissi, B.; Du, A.M.; Ali, S. ESG stock markets and clean energy prices prediction: Insights from advanced machine learning. Int. Rev. Financ. Anal. 2025, 97, 103889. [Google Scholar] [CrossRef]
  29. Ge, Y.; Xia, Y.; Wang, T. Digital economy, data resources and enterprise green technology innovation: Evidence from A-listed Chinese Firms. Resour. Policy 2024, 92, 105035. [Google Scholar] [CrossRef]
  30. Wang, H.; Jiao, S.; Bu, K.; Wang, Y.; Wang, Y. Digital transformation and manufacturing companies’ ESG responsibility performance. Financ. Res. Lett. 2023, 58, 104370. [Google Scholar] [CrossRef]
  31. Barney, J.B. Firm Resources and Sustained Competitive Advantage. J. Manag. 1991, 17, 99–120. [Google Scholar] [CrossRef]
  32. Ouyang, Y.; Hu, M. The impact of data elements marketization on corporate financing constraints: Quasi-experimental evidence from the establishment of data trading platforms in China. Financ. Res. Lett. 2024, 69, 106132. [Google Scholar] [CrossRef]
  33. Lin, B.; Xie, Y. How does digital finance drive energy transition? A green investment-based perspective. Financ. Innov. 2025, 11, 94. [Google Scholar] [CrossRef]
  34. Tang, M.; Liu, Y.; Hu, F.; Wu, B. Effect of digital transformation on enterprises’ green innovation: Empirical evidence from listed companies in China. Energy Econ. 2023, 128, 107135. [Google Scholar] [CrossRef]
  35. Hambrick, D.C.; Mason, P.A. Upper Echelons: The Organization as a Reflection of Its Top Managers. Acad. Manag. Rev. 1984, 9, 193–206. [Google Scholar] [CrossRef]
  36. Wu, L.; Wang, C.; Ren, H.; Zhang, W. How does executive green cognition affect enterprise green technology innovation? The mediating effect of ESG performance. Heliyon 2024, 10, e34287. [Google Scholar] [CrossRef]
  37. Liu, Y.; Chen, Y. Executives’ green cognition and corporate green innovation: Evidence from China. Total Qual. Manag. Bus. Excell. 2024, 35, 1054–1075. [Google Scholar] [CrossRef]
  38. Tang, D.; Chen, W.; Zhang, Q.; Zhang, J. Impact of Digital Finance on Green Technology Innovation: The Mediating Effect of Financial Constraints. Sustainability 2023, 15, 3393. [Google Scholar] [CrossRef]
  39. Peng, C.; Jia, X.; Zou, Y. Can “splitting” be beneficial? The impact of top management team information-knowledge faultline on enterprise green transformation. J. Clean. Prod. 2023, 406, 136935. [Google Scholar] [CrossRef]
  40. Zhang, S.; Yang, Y.; Gan, H.; Ren, Y. Digital welfare of the value cycle of agribusiness supply chain network: Evidence from China’s listed agriculture-affiliated companies. Technol. Anal. Strat. Manag. 2024; early access. [Google Scholar] [CrossRef]
  41. Ghasemaghaei, M.; Calic, G. Assessing the impact of big data on firm innovation performance: Big data is not always better data. J. Bus. Res. 2020, 108, 147–162. [Google Scholar] [CrossRef]
  42. Sirmon, D.G.; Hitt, M.A.; Ireland, R.D. Managing Firm Resources in Dynamic Environments to Create Value: Looking Inside the Black Box. Acad. Manag. Rev. 2007, 32, 273–292. [Google Scholar] [CrossRef]
  43. Lv, L.; Zhang, P. Unlocking green potential: How open government data enhances green economic efficiency in China? J. Environ. Manag. 2025, 380, 125043. [Google Scholar] [CrossRef]
  44. Zhang, S.; Yang, Y.; Gan, H. Can cross-sector collaboration contribute to boundaries reshaping of digital government platforms? Empirical evidence based on machine learning and text analysis. Pub. Admin. 2025; early access. [Google Scholar] [CrossRef]
  45. Huang, J.; Yang, B.; Zhou, B.; Ran, B. Sustainable knowledge integration: Enhancing green development resilience. J. Innov. Knowl. 2025, 10, 100671. [Google Scholar] [CrossRef]
  46. Battistella, C.; Ferraro, G.; Pessot, E. Technology transfer services impacts on open innovation capabilities of SMEs. Technol. Forecast. Soc. Change 2023, 196, 122875. [Google Scholar] [CrossRef]
  47. Teece, D.J.; Pisano, G.; Shuen, A. Dynamic capabilities and strategic management. Strateg. Manag. J. 1997, 18, 509–533. [Google Scholar] [CrossRef]
  48. Zhuo, R.; Zhang, Y.; Zheng, J.; Xie, H. Digitalization transformation and enterprise green innovation: Empirical evidence from Chinese listed companies. Front. Environ. Sci. 2024, 12, 1361576. [Google Scholar] [CrossRef]
  49. Ortiz-Avram, D.; Ovcharova, N.; Engelmann, A. Dynamic capabilities for sustainability: Toward a typology based on dimensions of sustainability-oriented innovation and stakeholder integration. Bus. Strategy Environ. 2024, 33, 2969–3004. [Google Scholar] [CrossRef]
  50. Sun, H.; Mulindwa Bahizire, G.; Bernard Pea-Assounga, J.B.; Chen, T. Enhancing Employee Green Performance through Green Training: The Mediating Influence of Organizational Green Culture and Work Ethic in the Mining Sector. J. Clean. Prod. 2024, 449, 141105. [Google Scholar] [CrossRef]
  51. Callaway, B.; Sant’Anna, P.H.C. Difference-in-Differences with multiple time periods. J. Econom. 2021, 225, 200–230. [Google Scholar] [CrossRef]
  52. Goodman-Bacon, A. Difference-in-differences with variation in treatment timing. J. Econom. 2021, 225, 254–277. [Google Scholar] [CrossRef]
  53. Li, X.; Shao, X.; Chang, T.; Albu, L.L. Does digital finance promote the green innovation of China’s listed companies? Energy Econ. 2022, 114, 106254. [Google Scholar] [CrossRef]
  54. Feng, Y.; Wang, X.; Liang, Z.; Hu, S.; Xie, Y.; Wu, G. Effects of emission trading system on green total factor productivity in China: Empirical evidence from a quasi-natural experiment. J. Clean. Prod. 2021, 294, 126262. [Google Scholar] [CrossRef]
  55. Hadlock, C.J.; Pierce, J.R. New Evidence on Measuring Financial Constraints: Moving Beyond the KZ Index. Rev. Financ. Stud. 2010, 23, 1909–1940. [Google Scholar] [CrossRef]
  56. Naveen, K.; Selvan, C.; Senanayake, R. Assessment of Risk and Opportunity in Accordance With ISO 9001: An Empirical Study. Int. J. Soc. Ecol. Sustain. Dev. 2022, 13, 1–16. [Google Scholar] [CrossRef]
  57. Blyde, J. The ISO 14001 Environmental Standard and Exports. Int. Trade J. 2025, 39, 115–128. [Google Scholar] [CrossRef]
  58. Liu, F.; Wang, R.; Fang, M. Mapping green innovation with machine learning: Evidence from China. Technol. Forecast. Soc. Change 2024, 200, 123107. [Google Scholar] [CrossRef]
  59. Li, X.; Wang, X.; Zhang, S. Impacts of urban spatial development patterns on carbon emissions: Evidence from Chinese cities. Land 2022, 11, 2031. [Google Scholar] [CrossRef]
  60. Wu, Y.; Tham, J. The impact of environmental regulation, Environment, Social and Government Performance, and technological innovation on enterprise resilience under a green recovery. Heliyon 2023, 9, e20278. [Google Scholar] [CrossRef] [PubMed]
  61. Zhang, M.; Ren, Y. Impact of Environmental Regulation on Ecological Resilience—A Perspective of “Local-neighborhood” Effect. J. Beijing Inst. Technol. Soc. Sci. Ed. 2022, 24, 16–29. [Google Scholar] [CrossRef]
  62. Martins, L.L.; Rindova, V.P.; Greenbaum, B.E. Unlocking the Hidden Value of Concepts: A Cognitive Approach to Business Model Innovation. Strateg. Entrep. J. 2015, 9, 99–117. [Google Scholar] [CrossRef]
  63. Guo, M.; Wang, H.; Kuai, Y. Environmental regulation and green innovation: Evidence from heavily polluting firms in China. Financ. Res. Lett. 2023, 53, 103624. [Google Scholar] [CrossRef]
  64. Jiang, L.; Li, B.; Zhang, M. The impact of digital transformation on the efficiency of corporate resource allocation: Internal mechanisms and external environment. Technol. Forecast. Soc. Change 2025, 215, 124107. [Google Scholar] [CrossRef]
  65. Baker, A.C.; Larcker, D.F.; Wang, C.C.Y. How much should we trust staggered difference-in-differences estimates? J. Financ. Econ. 2022, 144, 370–395. [Google Scholar] [CrossRef]
  66. Sun, L.; Abraham, S. Estimating dynamic treatment effects in event studies with heterogeneous treatment effects. J. Econom. 2021, 225, 175–199. [Google Scholar] [CrossRef]
  67. Xu, A.; Dai, Y.; Hu, Z.; Qiu, K. Can green finance policy promote inclusive green growth?- Based on the quasi-natural experiment of China’s green finance reform and innovation pilot zone. Int. Rev. Econ. Financ. 2025, 100, 104090. [Google Scholar] [CrossRef]
  68. Zhang, S.; Cheng, L.; Ren, Y.; Yao, Y. Effects of carbon emission trading system on corporate green total factor productivity: Does environmental regulation play a role of green blessing? Environ. Res. 2024, 248, 118295. [Google Scholar] [CrossRef]
  69. Luo, Q.; Deng, L.; Zhang, Z.; Wang, H. The impact of digital transformation on green innovation: Novel evidence from firm resilience perspective. Financ. Res. Lett. 2025, 74, 106767. [Google Scholar] [CrossRef]
  70. Benlemlih, M.; Bitar, M. Corporate Social Responsibility and Investment Efficiency. J. Bus. Ethics 2018, 148, 647–671. [Google Scholar] [CrossRef]
  71. Li, F.; Li, Y.; Jiang, Y. Can board of directors’ faultlines improve corporate innovation performance? Evidence from China. Heliyon 2024, 10, e34286. [Google Scholar] [CrossRef]
  72. Hojnik, J.; Ruzzier, M. What drives eco-innovation? A review of an emerging literature. Environ. Innov. Soc. Transit. 2016, 19, 31–41. [Google Scholar] [CrossRef]
  73. Su, X.; Tan, J. Regional energy transition path and the role of government support and resource endowment in China. Renew. Sustain. Energy Rev. 2023, 174, 113150. [Google Scholar] [CrossRef]
  74. Su, W.; Yu, J.; Zhao, L. Can Sci-Tech Finance Policy Boost Corporate ESG Performance? Evidence from the Pilot Experiment of Promoting the Integration of Technology and Finance in China. Sustainability 2025, 17, 2332. [Google Scholar] [CrossRef]
  75. Zhang, Y.-J.; Peng, Y.-L.; Ma, C.-Q.; Shen, B. Can environmental innovation facilitate carbon emissions reduction? Evidence from China. Energy Policy 2017, 100, 18–28. [Google Scholar] [CrossRef]
  76. Zhang, T. Can green finance policies affect corporate financing? Evidence from China’s green finance innovation and reform pilot zones. J. Clean. Prod. 2023, 419, 138289. [Google Scholar] [CrossRef]
  77. Huang, R.; Zhu, Z.; Ruan, R.; Lou, X. Linking low-carbon practices with ESG performances: Exploration evidence from the configurational perspective. J. Clean. Prod. 2024, 435, 140532. [Google Scholar] [CrossRef]
Figure 1. Research framework.
Systems 13 00515 g001
Figure 2. Parallel trend test.
Systems 13 00515 g002
Figure 3. Placebo test.
Systems 13 00515 g003
Table 1. Results of descriptive analysis of variables.
VariablesObservationsMeanStandard DeviationMinMax
ESG20,9994.1890.94517.750
GIO20,9990.9611.24907.300
treat×post20,9990.2720.44501
SA20,999−3.8050.273−5.646−2.109
EGA20,999223.200222.34401273.994
GGR20,9990.5760.455−11
GMI20,9990.6070.57601.790
Peo20,99922.2791.36617.64128.636
Lev20,9990.4090.2020.0081.345
ROA20,9990.0440.070−2.6460.786
ROE20,9990.0620.731−53.03843.614
Growth20,9990.54812.558−11.9241294.219
Par20,9990.9330.0830.0621
Atr20,9990.6080.3930.0007.571
ND20,9992.1280.1981.0992.890
FA20,9992.0280.93103.466
Table 2. Baseline regression of results.
(1)(2)(3)(4)
VariablesGIOGIOESGESG
treat×post0.2394 ***0.0945 ***0.0427 *0.0391 *
(12.16)(5.75)(1.81)(1.67)
Peo 0.5334 *** 0.3343 ***
(79.52) (17.09)
Lev 0.0185 −0.7512 ***
(0.41) (−11.15)
ROA −0.3609 *** 0.0895
(−3.46) (0.91)
Growth 0.0008 0.0000
(1.53) (0.04)
Par 0.0628 0.4021 ***
(0.75) (3.33)
Atr 0.1009 *** 0.0745 **
(5.24) (2.55)
ND 0.0087 −0.1074 *
(0.25) (−1.94)
FA −0.0053 −0.2414 ***
(−0.64) (−12.29)
cons0.8959 ***−11.0674 ***4.1734 ***−2.6736 ***
(95.19)(−66.79)(513.65)(−5.65)
Fixed effectsYesYesYesYes
N20,99920,99920,99920,999
R20.1960.4460.4690.485
T-values are in parentheses. * indicates p < 0.1; ** indicates p < 0.05; *** indicates p < 0.01. The same notation applies below.
Table 3. Results of the counterfactual test.
(1)(2)
VariablesGIOESG
treat×post0.08910.0159
(0.63)(0.72)
Fixed effectYesYes
Control variablesYesYes
N20,99920,999
R20.5230.546
Table 4. Results of PSM-DID.
(1)(2)
VariablesGIOESG
treat×post0.0935 ***0.0403 *
(5.69)(1.72)
Fixed effectsYesYes
Control variablesYesYes
N20,99020,990
R20.4470.484
T-values are in parentheses. * indicates p < 0.1; *** indicates p < 0.01.
Table 5. Results of the mediating mechanism analysis.
(1)(2)(3)(4)(5)(6)
VariablesEGAGIOESGSAGIOESG
treat×post20.6919 ***0.0361 **0.0365 *0.0182 ***0.0778 ***0.0369 **
(6.07)(2.02)(1.88)(11.75)(4.56)(2.36)
EGA 0.0003 ***0.0339 *
(8.06)(1.67)
SA 0.4386 ***0.4530 ***
(13.70)(16.95)
Fixed effectsYesYesYesYesYesYes
Control variablesYesYesYesYesYesYes
N18,43318,83318,43318,43318,83418,433
R20.6640.4550.4100.9690.4590.565
T-values are in parentheses. * indicates p < 0.1; ** indicates p < 0.05; *** indicates p < 0.01.
Table 6. Results of the moderating mechanism analysis.
(1)(2)(3)(4)
VariablesGIOESGGIOESG
treat×post3.5054 ***−0.0641 ***1.8643 **−0.0906 ***
(3.82)(−2.68)(2.18)(−3.74)
GGR−0.9557 *0.2243 ***
(−1.91)(14.42)
GMI −2.5652 ***0.0771 ***
(−4.35)(5.18)
InteractionGGR4.5371 ***0.0831 ***
(4.63)(3.23)
InteractionGMI 7.9087 ***0.1141 ***
(5.85)(4.84)
Fixed effectsYesYesYesYes
Control variablesYesYesYesYes
N18,43318,43318,43318,433
R20.7630.5720.7630.564
T-values are in parentheses. * indicates p < 0.1; ** indicates p < 0.05; *** indicates p < 0.01.
Table 7. Results of heterogeneity analysis of corporate board size.
(1) GIO(2) ESG
VariablesLargeMediumSmallLargeMediumSmall
treat×post0.1410 ***0.1543 ***0.01660.1764 ***0.01550.0531
(2.70)(3.84)(0.29)(3.37)(0.44)(1.33)
Fixed effectsYesYesYesYesYesYes
Control variablesYesYesYesYesYesYes
N281597237455281597237455
R20.7920.7200.7750.5540.4940.562
T-values are in parentheses. *** indicates p < 0.01.
Table 8. Results of heterogeneity analysis of spatial location.
(1) GIO(2) ESG
VariablesEastern RegionCentral RegionWestern RegionEastern RegionCentral RegionWestern Region
treat×post0.1363 ***0.1368 **−0.01450.0870 ***0.1727 ***−0.1327
(6.18)(2.25)(−0.27)(3.44)(3.14)(−1.61)
Fixed effectsYesYesYesYesYesYes
Control variablesYesYesYesYesYesYes
N14,9053418267714,90534182667
R20.2820.2170.2940.5430.7110.591
T-values are in parentheses. ** indicates p < 0.05; *** indicates p < 0.01.
Table 9. Results of heterogeneity analysis of carbon emission intensity.
(1) GIO(2) ESG
VariablesHigh Carbon IntensityLow Carbon IntensityHigh Carbon IntensityLow Carbon Intensity
treat×post0.0970 ***0.04320.0535 **0.0229
(2.81)(0.75)(2.02)(0.43)
Fixed effectsYesYesYesYes
Control variablesYesYesYesYes
N14,002695614,0026956
R20.4470.3250.5430.547
T-values are in parentheses. ** indicates p < 0.05; *** indicates p < 0.01.
Disclaimer/Publisher’s Note: The statements, opinions and data contained in all publications are solely those of the individual author(s) and contributor(s) and not of MDPI and/or the editor(s). MDPI and/or the editor(s) disclaim responsibility for any injury to people or property resulting from any ideas, methods, instructions or products referred to in the content.