Article

Measures of Effectiveness Analysis of an Advanced Air Mobility Post–Disaster Response System

by
Olabode A. Olanipekun
1,*,
Carlos J. Montalvo
2 and
Sean G. Walker
1
1
Department of Systems Engineering, University of South Alabama, Mobile, AL 36688, USA
2
William B. Burnsed Jr. Department of Mechanical, Aerospace, and Biomedical Engineering, University of South Alabama, Mobile, AL 36688, USA
*
Author to whom correspondence should be addressed.
Systems 2025, 13(7), 512; https://doi.org/10.3390/systems13070512
Submission received: 25 April 2025 / Revised: 4 June 2025 / Accepted: 17 June 2025 / Published: 25 June 2025
(This article belongs to the Section Systems Engineering)

Abstract

Use of measures of effectiveness (MOE) analysis in exploring candidate systems or alternatives has been the subject of much debate in the systems engineering discipline, as some authors have noted. In this work, methods for MOE analysis are revisited as they pertain to an advanced air mobility platform, first by using the traditional approach, which involves the application of the Pugh matrix, and second by proposing an approach that involves a combination of two (2) methods, namely the Monte Carlo method (MCM) and the analytical hierarchy process (AHP), in order to evaluate and rank the preferred alternative from a selection of candidate systems. The latter method is termed the Monte Carlo–analytical hierarchical hybrid process (MC–AHHP). The results obtained from the application of both approaches demonstrate that the MC–AHHP is a less subjective, more objective, data-driven, and quantitative measure for MOE analysis compared to the erstwhile Pugh matrix method. While the Pugh matrix ranked the SAR AAM as first overall among seven (7) alternatives, the MC–AHHP ranked the same second among three (3) alternatives. The subsequent verification and validation process showed that the MC–AHHP approach resulted in a degree of consistency value of 0.083 , where C I / R I < 0.10 represents an acceptable level of consistency. Thus, the MC–AHHP approach is recommended as a viable decision-making tool for adoption by systems engineering practitioners.

1. Introduction

This work is focused on the subject of evaluating the measures of effectiveness for an advanced air mobility post disaster (AAMPDR) system. The goal at this stage is to answer the following question: How do we choose a viable concept out of a list of potential solutions? To this end, a process that involves ranking these potential options is applied, depending on their relative strengths (merits) and weaknesses.
The ubiquitous role of Monte Carlo has been extensively documented by authors, including Kroese et al. [1], who defined this method as simply generating random objects or entities through a digital computer. More specifically, the Monte Carlo method (MCM) refers to the simulation of quasi-random entity values for the purposes of replicating naturally occurring phenomena.
In an earlier work by Vargas [2], the analytical hierarchy process (AHP) is succinctly discussed. By definition, the AHP is a scientific method of measurement for handling criteria data or variables for the purpose of decision making through a systematic combination of knowledge and expertise on the subject matter. It relies on at least three axiomatic expression which may be broadly summarized as a comparison through reciprocity, assigning preferences through the principle of homogeneity and expression of preferences through independence of criteria. Further discussion on AHP is presented in Section 2.3.
Friedenthal et al. [3] discussed the subject of measures of effectiveness (MOEs) from a systems engineering standpoint. The authors modeled MOEs using block definition diagrams (BDDs), their corresponding blocks and associations, parametric diagrams (PARs), and their corresponding constraint blocks, associations, and stereotypes. They utilized cost functions in each evaluation and comparison of the alternatives. However, this technique is rooted in the sub-discipline of economic order quantity (EOQ), which is highly dependent on data availability. Apparently, this EOQ approach is relatively more data capital intensive compared to the method proposed in this work. Green [4] also presented a concise treatise on the subject of establishing MOEs that included a step-wise process chart and which, among other things, defined the system effectiveness measures with a special focus on command and control systems. However, no mathematical model appeared in said work. Cilli and Parnell [5] also examined trade-off analysis as a supporting tool for engineering practitioners, albeit noting that there were shortcomings to the quality of trade studies executed among organizations and their reliance on experts’ judgments. Interestingly, the authors discussed trade studies from the viewpoint of the application of decision trees and on the basis that it necessitates some form of multiple objective decision analysis.
In their work on intersatellite communication (ISC) for a multi-orbit disaggregated system, Anyanhun [6] developed an MOE by which the system performance was accounted for. The authors also executed their operational concept model, operational scenarios, and MOE in one model as a numerical benchmark for comparison of the system concept and implementation. Some of the parameters captured by [6] included the quality of service, system resilience, system robustness, data security, and cost function, and although the researchers presented a parametric diagram for the system-level MOE ISC effectiveness computation, the theoretical foundations underpinning the mathematical models presented in their work appear yet to be accessible as of the time of this writing. On the other hand, Reed and Fenwick [7] formulated a compelling mathematical framework for obtaining MOEs while demonstrating the same on a sonar system.
Rosenbloom [8] presented one of the early foundational treatises on the subject of AHP. In addition, they made recommendations that laid the groundwork for the idea of integrating the Monte Carlo technique into the AHP process. Successive research work by Momani and Ahmed [9] on the subject of material handling equipment selection using what they describe as a hybrid Monte Carlo simulation and analytic hierarchy process demonstrates similarities to the present work. Notwithstanding, notable differences between both works exist. While Momani and Ahmed [9] focused on the application of MC and AHP with respect to equipment selection for a small pharmaceutical enterprise, this work discusses the application of similar approaches but leverages mobility alternatives directed towards SAR efforts; hence, there are two distinct domains. Furthermore, the work by Momani and Ahmed [9] did not contain a generalized mathematical formulation process, unlike in the case of this present work.
In an earlier work, Chakraborty and Banik [10] applied only the AHP to their materials handling equipment selection process viz-a-viz the manufacturing industry. While there was no reference to applying the MC technique, the authors, however, outlined a mathematical model similar to the approach applied in this work in addition to performing sensitivity analysis, which is beyond the scope of this current work. However, no algorithms, pseudocode, or flowcharts were illustrated, unlike in this work. Furthermore, the authors utilized a summation notation for their matrix transformations contrary to the tensor notation applied here. The latter approach allows for the use of dummy indices and tensor notation, which further facilitates truncation and the easy summarization of mathematical expression according to modern best practices [11].
Other methods that have been applied to the subject of material handling equipment selection include the weighted utility additive theory, otherwise abbreviated as the WUTA theory or methodology, as explored by [12]. The foregoing authors note that the WUTA approach is particularly useful when applied to multi-criteria decision making (MCDM). Developed from the Jacquet–Lagreze and Siskos proposed utility additive (UTA) approach, the WUTA method infers one or more additive value functions from the ranking of an arbitrary reference set, A a , such that A represents the alternative set, while a = ( a 1 , a 2 , , a n ) represents the series of n criteria. It is therefore possible to define a utility function, ( U ( a ) ) , such that ( U ( a ) ) = U ( a 1 , a 2 , , a n ) .
In spite of the prior research efforts discussed above, none appeared to approach the subject through a simplified yet effective approach by presenting mathematical foundations as is demonstrated in the following sections. Further, the development of a mathematical basis for the MC–AHHP techniques presented here lends itself to the future development of computer algorithms that could further facilitate the computation process and shorten otherwise repetitive tasks.

2. Methods

2.1. Measures of Effectiveness

One handy tool that a systems engineer could use to determine how well their system designs satisfy the express desires of the stakeholder is the measures of effectiveness (MOEs) approach, which, according to Sproles [13], forms a segment of the test and evaluation, highlighting the performance of a system in regard to the set objectives for which it was originally conceived. Interestingly, Sproles [13] observed that for MOEs, the stakeholder is more concerned about external factors of the system of interest, leaving the systems engineer to focus on the possible solution that best addresses the needs of the former, thus highlighting the significance of MOEs as a useful tool for realizing what the right solution is.
Similar to how a Pugh matrix is applied, the concept of MOEs also involves the selection of a most preferred candidate of choice among several alternatives based on a set of criteria. Each criterion may have a computed value and/or range of values. The MOE for each alternative is evaluated using an objective function, and a choice of solution is then made based on the result obtained [3]. Notwithstanding, MOEs remain much debated due to the subjective and qualitative nature of their usage, as there is yet to be any universal consensus on what constitutes their formulation or application [13,14]. Another useful tool is the measurement of performance (MOP), which is often mistaken for a MOE but with the major distinction being that MOE parameters are specified with the end goal of the stakeholder as their focus, while the MOP parameters target the supplier’s intended objectives [13,15].
The mathematical model adopted for the MOE is as follows [5]:
S o I e f f ( x ) = i = 1 n W m o e ( i ) v i ( x i )
where,
S o I e f f = System of interest (or candidate) effectiveness
W m o e ( i ) = Weight of ith MOE
i= 1 … n represents the position of the measure
x i = the alternative’s score on the ith measure
The above mathematical model for a MOE works in tandem with the definition of the objective function offered by Friedenthal et al. [3] as the total cost effectiveness of the design space expressed as a weighted1 sum of the utility ascribed to each parameter of the said objective function depending on their assigned value from a stakeholder’s viewpoint. The authors further note that SysML provides functionality whereby system performance may be modeled presently to be analyzed afterwards with the aid of parametrics. However, as Cilli and Parnell [5] rightly noted, and as is the case of the Pugh matrix, which is briefly outlined in the following section, one obvious flaw of the simple mathematical model of Equation (1) is that it is subjective and reliant on empirical data, the latter of which may not be readily available. In this work, a new approach is proposed that is less prone to subjectivity, leans towards increased objectivity, and is systematized in the approach taken.

2.2. The Pugh Matrix—Concept Selection

A Pugh matrix is a simple decision analysis tool that is used to visualize and identify multiple alternatives so that inferences may be drawn as to whether or not they satisfy each of these respective requirements. It was developed to select the best alternative through a process of controlled convergence [17].
However, one of the shortcomings of this method is evident, as it is subjective and prone to bias regardless of the level of expertise of whoever is reviewing the alternatives.

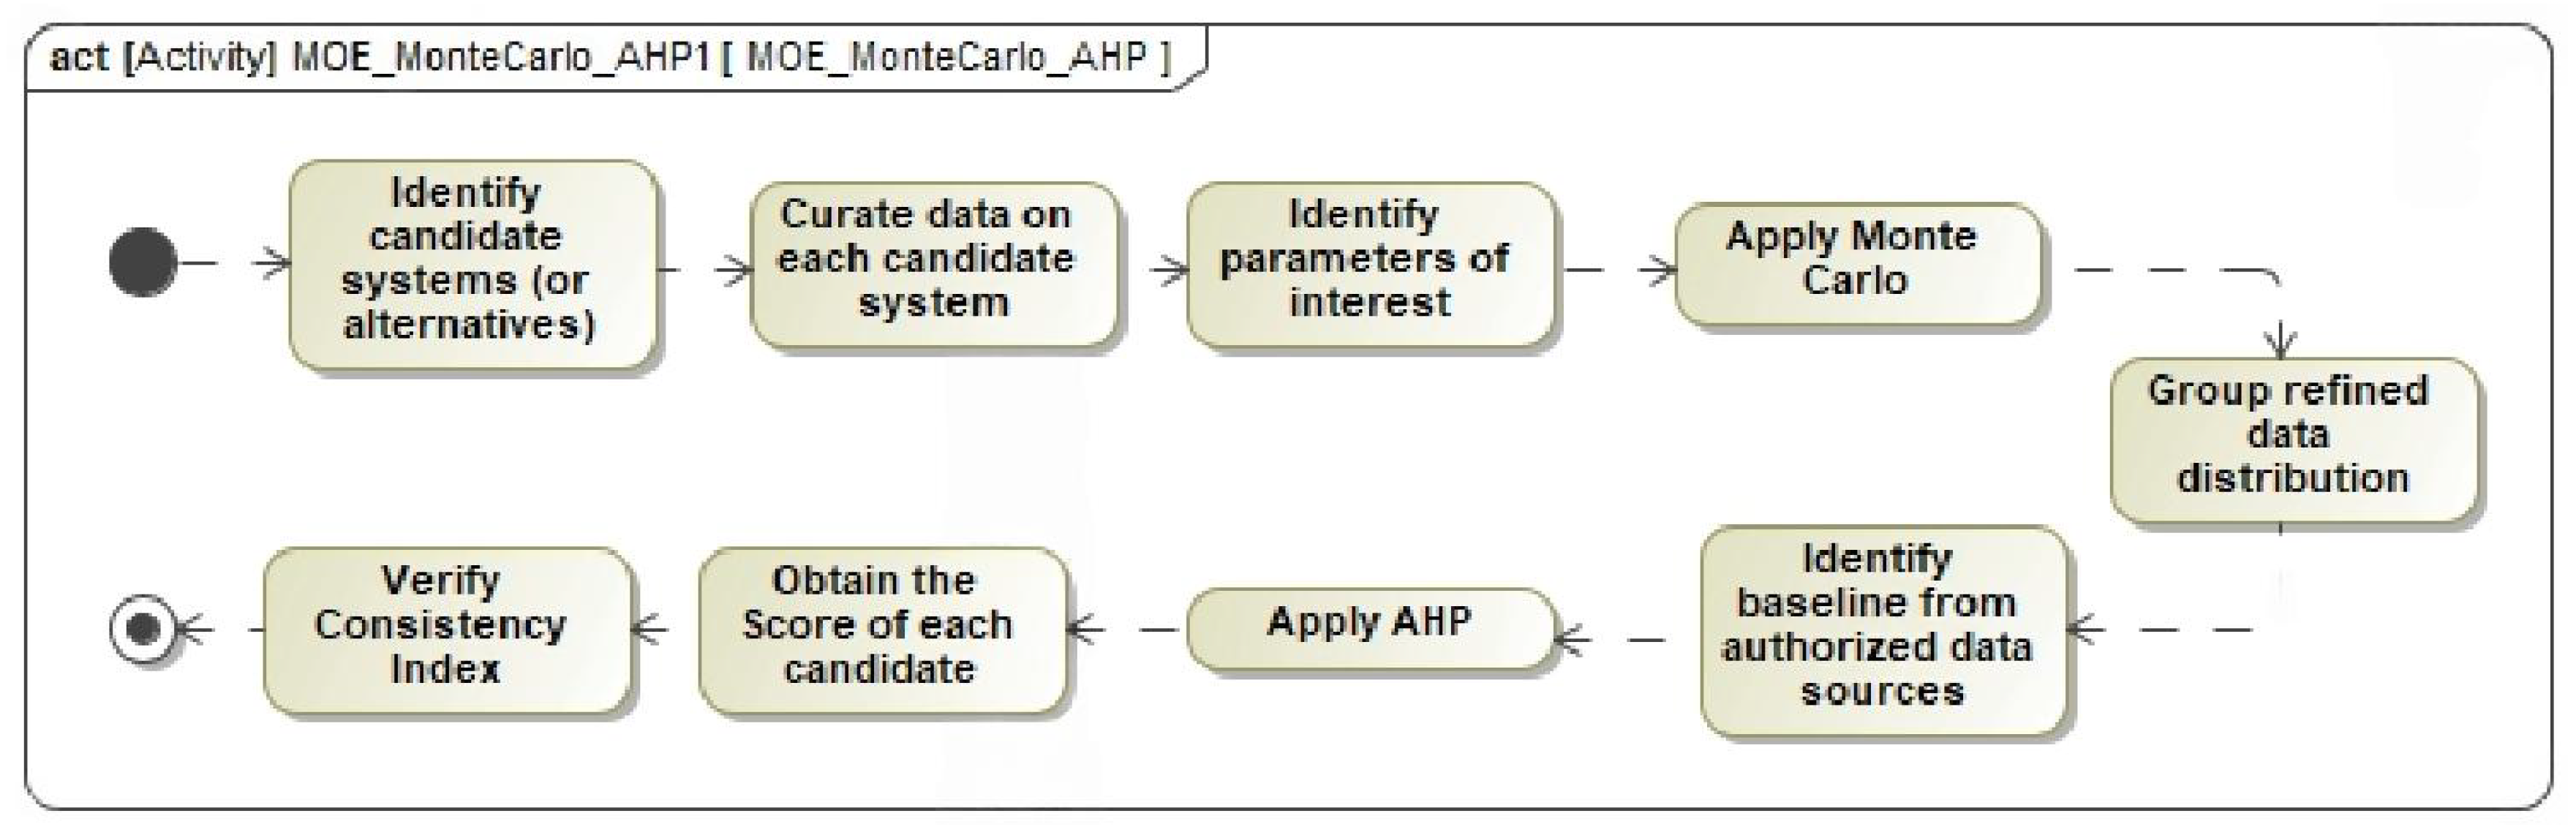
2.3. The Monte Carlo–Analytical Hierarchical Hybrid Process (MC–AHHP)

Despite the wide range utility of the Pugh matrix as a rating model, its shortcomings are apparent. Portner et al. [17] noted that there are two techniques for applying weights using the empirical or subjective method. The former is sensitive to data and changes to the individual factors influencing the weights, while the latter is, as the name suggests, subjective based on the discretion of the experts. Thus, there is a possibility of inherent bias that may be inadvertently introduced while applying the foregoing techniques.
Thus, in this work, another approach is explored, one that is less subjective, more objective, systematized, and data driven. The proposed process involves a hybrid combination of the Monte Carlo (MC) and analytical hierarchy process (AHP), otherwise hereafter termed Monte Carlo–analytic hierarchical hybrid process (MC–AHHP). A brief overarching description of the MC–AHHP is illustrated in the flow chart in Figure 1.
The process begins by curating as much data as possible on the different candidate solutions or potential alternatives for the SAR mission at hand. This is followed by an identification of the operating parameters of interest. The choice of each parameter should preferably be technical or scientifically based. For the operating weight, it is preferable that this specification type cuts across board regardless of whichever regulator oversees the mode of transit or transportation system being considered as an alternative. A specific instance of this would be the case for AAMs, with agencies like the Federal Aviation Administration (FAA) specifying within the 14 CFR Part 107 code regulation what the weight of an AAM platform is. That is, the unmanned aerial vehicle (UAV) should meet the requirements necessary for it to be operational within Class G airspace [18]. Next, a grouping of the operating parameter distribution and relevant measures of dispersion is obtained including the mean and standard deviation. The Monte Carlo simulation of the distribution is then computed by generating a set of pseudo-random numbers. The plots of normal distribution for each operating parameter are inspected. Otherwise, the sample size is repopulated from the available data2.
Having completed this step, the now refined data for each candidate system may be grouped into tabular or matrix form. At this stage, it is helpful to identify constraint parameters from the system requirements, which may be referenced from the authoritative source on the subject. The goal here is to be able to reference a constraint parameter value that could serve as a benchmark or baseline during the decision-making process of choosing the best average value from the result of the Monte Carlo process. For instance, from the PayloadWeightCapacityReq name identifier, which refers to the weight requirement of the AAMPDR as indicated in the requirements block 1.1.6 of Figure 2, it may be seen that the takeoff weight for any proposed SAR AAM platform must be below 24.59 kg (≡55 lbs)3. Subsequently, a determination of the preference for each candidate or alternative system is made depending on each criterion by using the 9-point standard preference level scale for the pairwise comparison AHP, as enumerated in Table 1 [16].
Thereafter, the preferences for the criteria are computed by a pairwise comparison. Given the standard preference scale for AHP from Table 1, a pairwise comparison matrix (PCM) containing rating values for each decision alternative may be formulated. Therefore, the generalized form may be developed as shown on Table 2, where x i j are the decision variables representing selected data averages for the ith or jth candidate or alternative for n concept selections, as the case may be. Typically, x i j = 1 x j i for i j and x i j = 1 for i = j .
Subsequently, a normalization of the matrix results in a transformation of the PCM into the vector σ ¯ expressed in the general form:
σ ¯ i = σ ¯ 1 σ ¯ 2 σ ¯ 3 σ ¯ n
which is then followed by matrix substitution of each preference vectors whose tensor representation, σ ¯ i j , may be expressed as
σ ¯ i j = σ ¯ 1 , 1 σ ¯ 1 , 2 σ ¯ 1 , n σ ¯ 2 , 1 σ ¯ 2 , 2 σ ¯ 2 , n σ ¯ 3 , 1 σ ¯ 3 , 2 σ ¯ 3 , n σ ¯ n , 1 σ ¯ n , 2 σ ¯ n , n
The steps are repeated but this time to obtain the PCM for the decision criteria, D ¯ , where d i j = 1 d j i for i j and d i j = 1 for i = j . That is,
D ¯ i j = d ¯ 1 , 1 d ¯ 1 , 2 d ¯ 1 , n d ¯ 2 , 1 d ¯ 2 , 2 d ¯ 3 , n d ¯ 3 , 1 d ¯ 3 , 2 d ¯ 1 , n d ¯ n , 1 d ¯ n , 2 d ¯ n , n
From the above, the corresponding mean vector for the ith selected concept is obtained as follows:
μ ¯ D = μ ¯ 1 μ ¯ 2 μ ¯ 3 μ ¯ n
Here, μ ¯ i are normalized mean values for i = n decision criteria, respectively. A score model that is analogous to its eigenvalue, λ , may be expressed as the matrix product of the candidate preference matrix and the criteria preference vector as follows
λ = σ ¯ i j · μ ¯ D
The results of the process are presented and analyzed in Section 3.3. Furthermore, the degree of consistency is also evaluated as a means of verification and validation (V&V) for the AAMPDR system concept selection process. This is accomplished by computing the consistency index (CI) and random index (RI). The value of RI is selected from the table of values in Table 3, where n represents the number of decision alternatives being considered.

3. Results

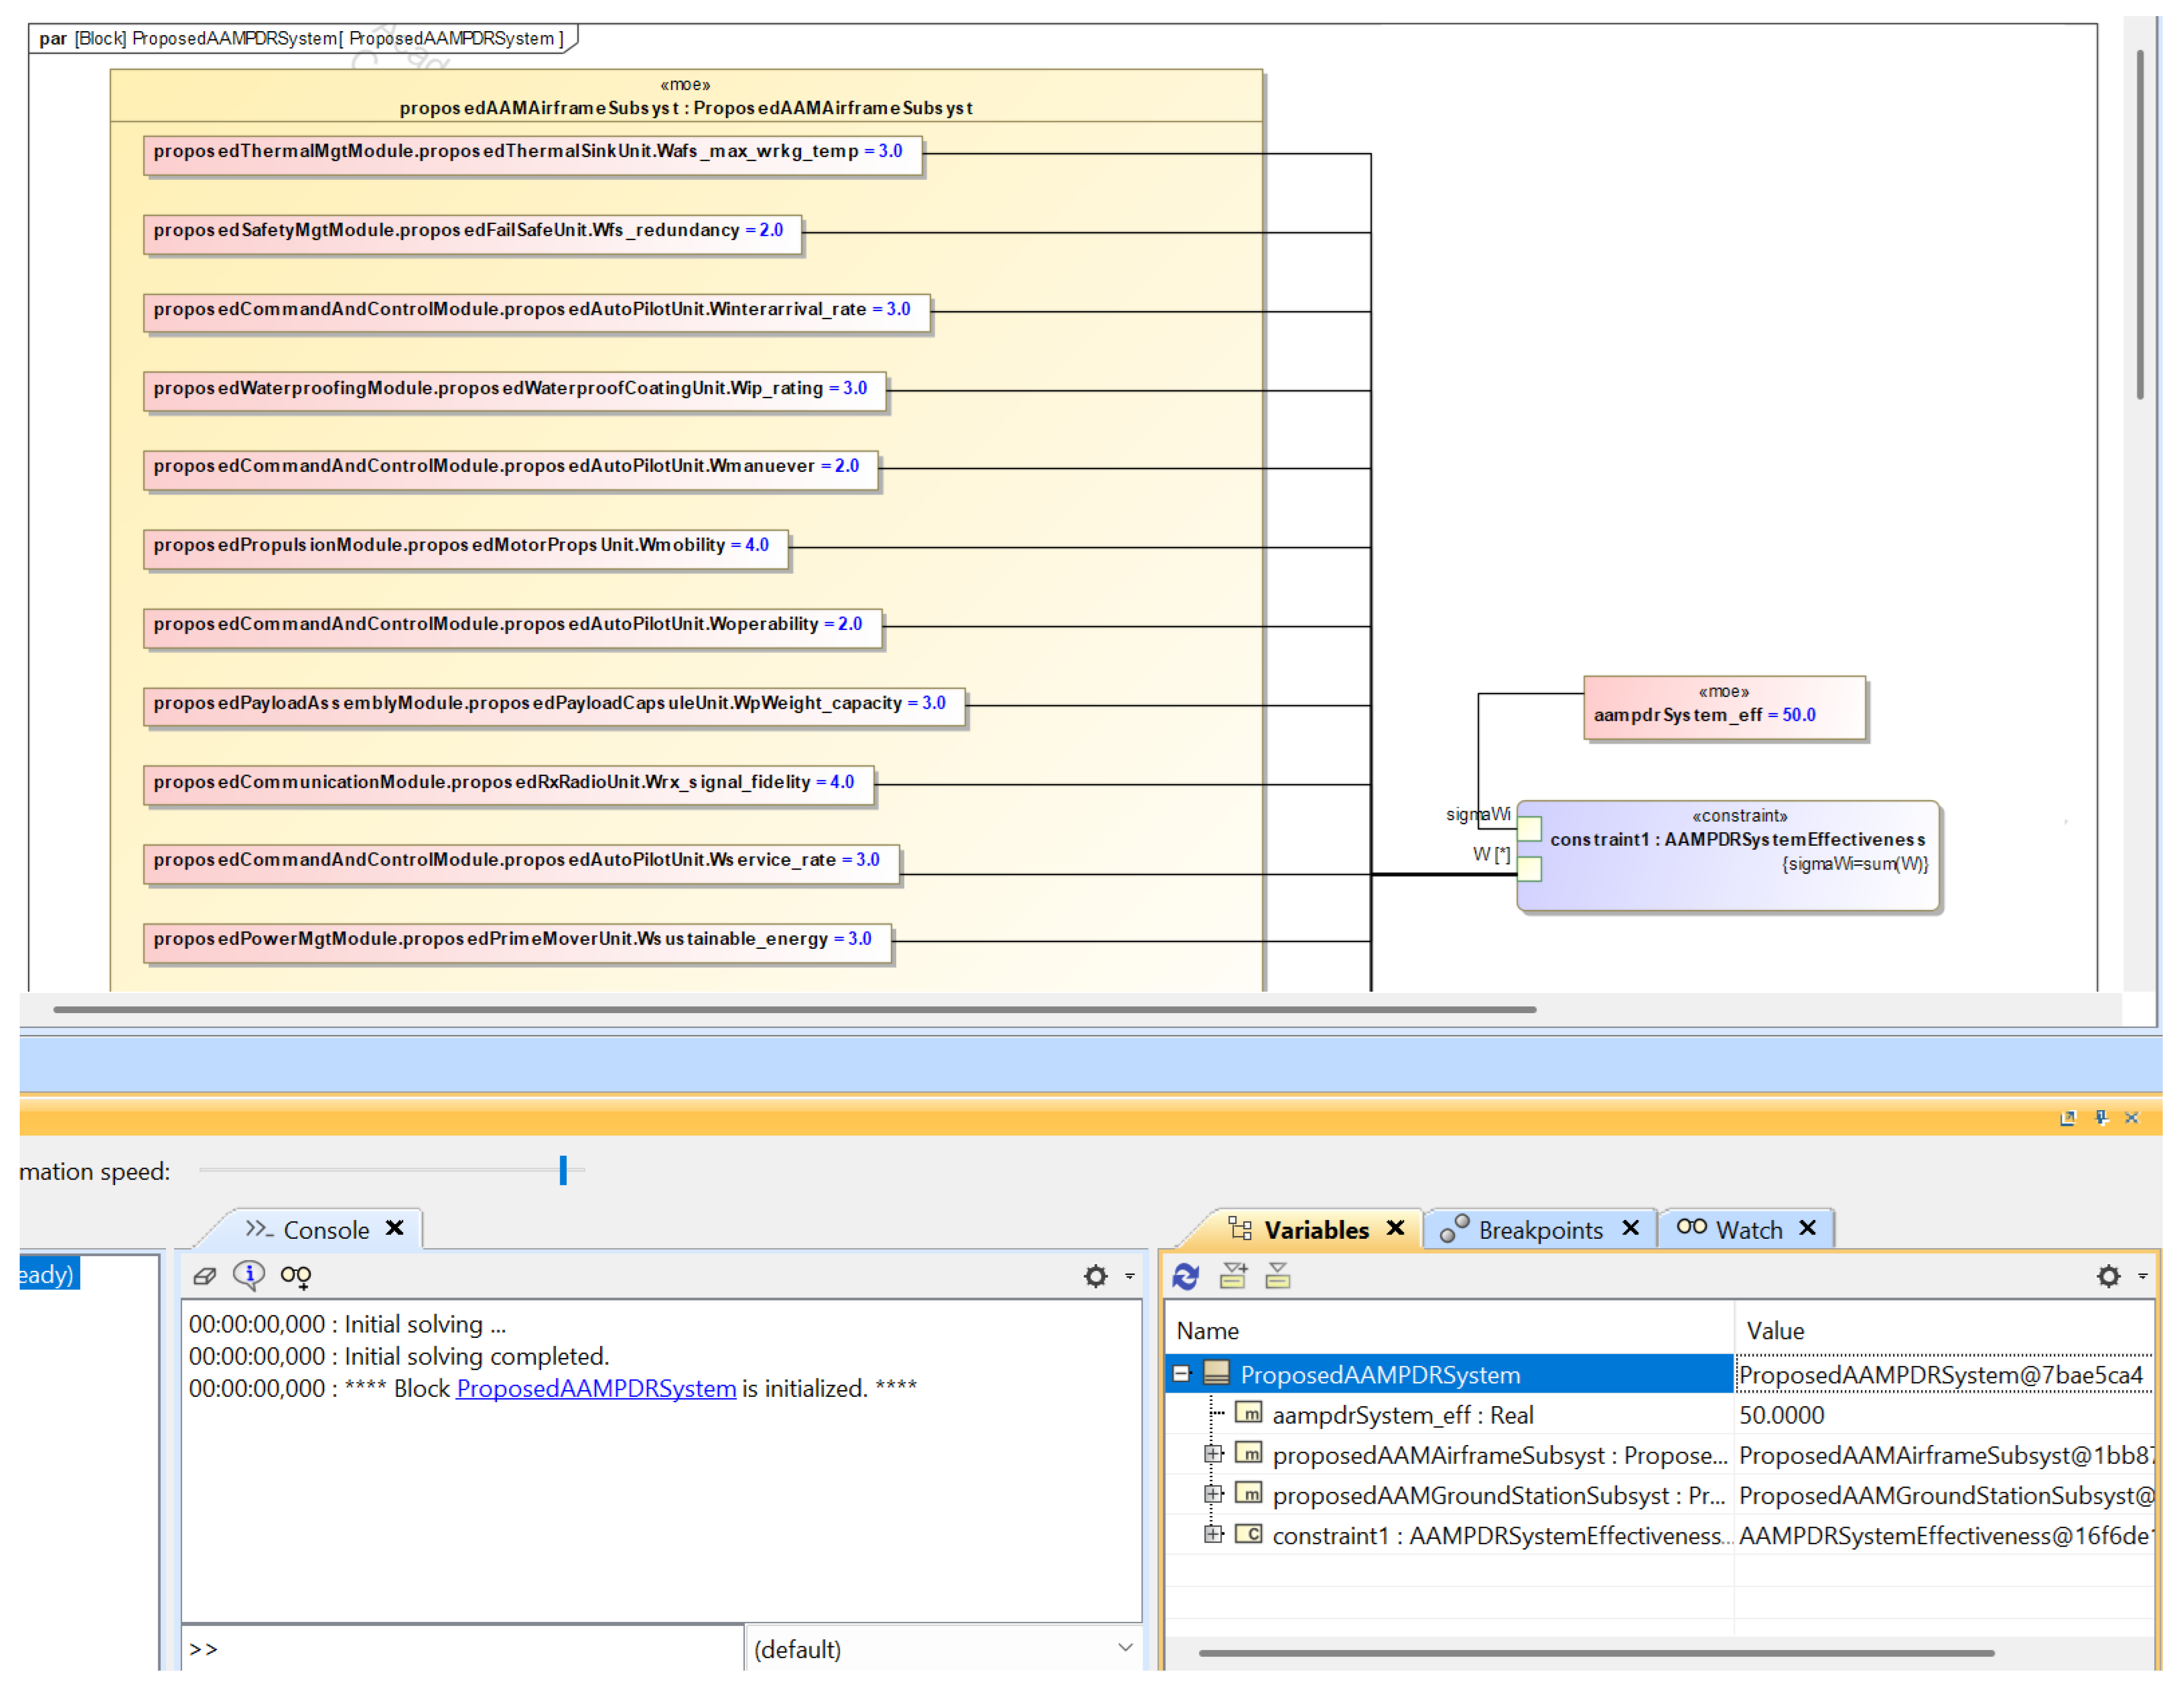
3.1. Measures of Effectiveness (SysML)

From the general mathematical model of Equation (1), it is possible to derive an equation that is specific to the AAMPDR system as expressed in Equation (2). That is,
A A M P D R S y s t e m e f f = i = 1 n W m o e ( i ) v i ( x i )
where
A A M P D R S y s t e m e f f = AAMPDR system effectiveness
W m o e ( i ) = the weight of ith MOE
i= 1 … n represents the position of the measure
x i = the alternative’s score on the ith measure
Such that the following holds true:
  • W a f s _ m a x _ w r k g _ t e m p = the weight assigned to the AAM airframe subsystem maximum working temperature monitored by the thermal management module4.
  • W f s _ r e d u n d a n c y = the weight assigned to the AAM system fail safe redundancy unit under the safety management module.
  • W i n t e r a r r i v a l _ r a t e = the weight assigned to the AAM airframe subsystem measure of interarrival rate under the allocation of the command and control module.
  • W i p _ r a t i n g = the weight assigned to the AAM airframe measure of water.
Furthermore, it is possible to develop a general-purpose parametric diagram in SysML that aids in the MOE analysis for the proposed AAMPDR system model as well as to apply the same to other candidate alternatives to the AAM, as presented in Figure 3. By adopting this approach, it is easier to perform a comparison of alternative solutions on a case-by-case basis taking advantage of SysML. This form of trade studies may be modeled using constraint blocks in a BDD or parametric blocks in a < < p a r > > diagram [3]. It may also be noted that a special property is used to indicate the MOEs and is denoted by the < < m o e > > stereotype. While the analysis executed in Figure 3 focuses on a high-level system-wide evaluation of its effectiveness, it is equally possible to delve deeper and perform an evaluation at lower levels of the model, as demonstrated for the payload, thus showing that MOEs can be implemented in SysML depending on the granularity of analysis. It is noteworthy to mention that the ‘asterisk’ character ( ) signifies the multiplicity association. By convention, it is meant to denote multiple instances of an object or entity. In this case, it represents the collection of statistical weight measure assigned to each MOE parameter including (but not limited to) the parametric blocks representing the Airframe subsystem maximum working temperature ( W a f s _ m a x _ w r k g _ t e m p ), fail safe redundancy ( W f s _ r e d u n d a n c y ), interarrival rate ( W i n t e r a r r i v a l _ r a t e ) and so forth, for the proposed AAM Airframe subsystem. Others include the parametric blocks representing the data processing time ( W d a t a _ p r o c e s s g _ t i m e ), the ground control system processing ( W g c s _ p r o c e s s g _ t i m e ), and so on, for the proposed AAM ground station subsystem.
A snapshot of the simulation showing the MOE value and value types of each parameter is presented in Figure 4, and it utilizes the underlying mathematical model of Equation (2).
By extension, using this SysML < < p a r > > artifact, it is possible to compare the MOEs for each alternative and rank which solution best satisfies the prospective stakeholder’s desires and evaluate whether or not the proposed solution is the best of all alternatives.

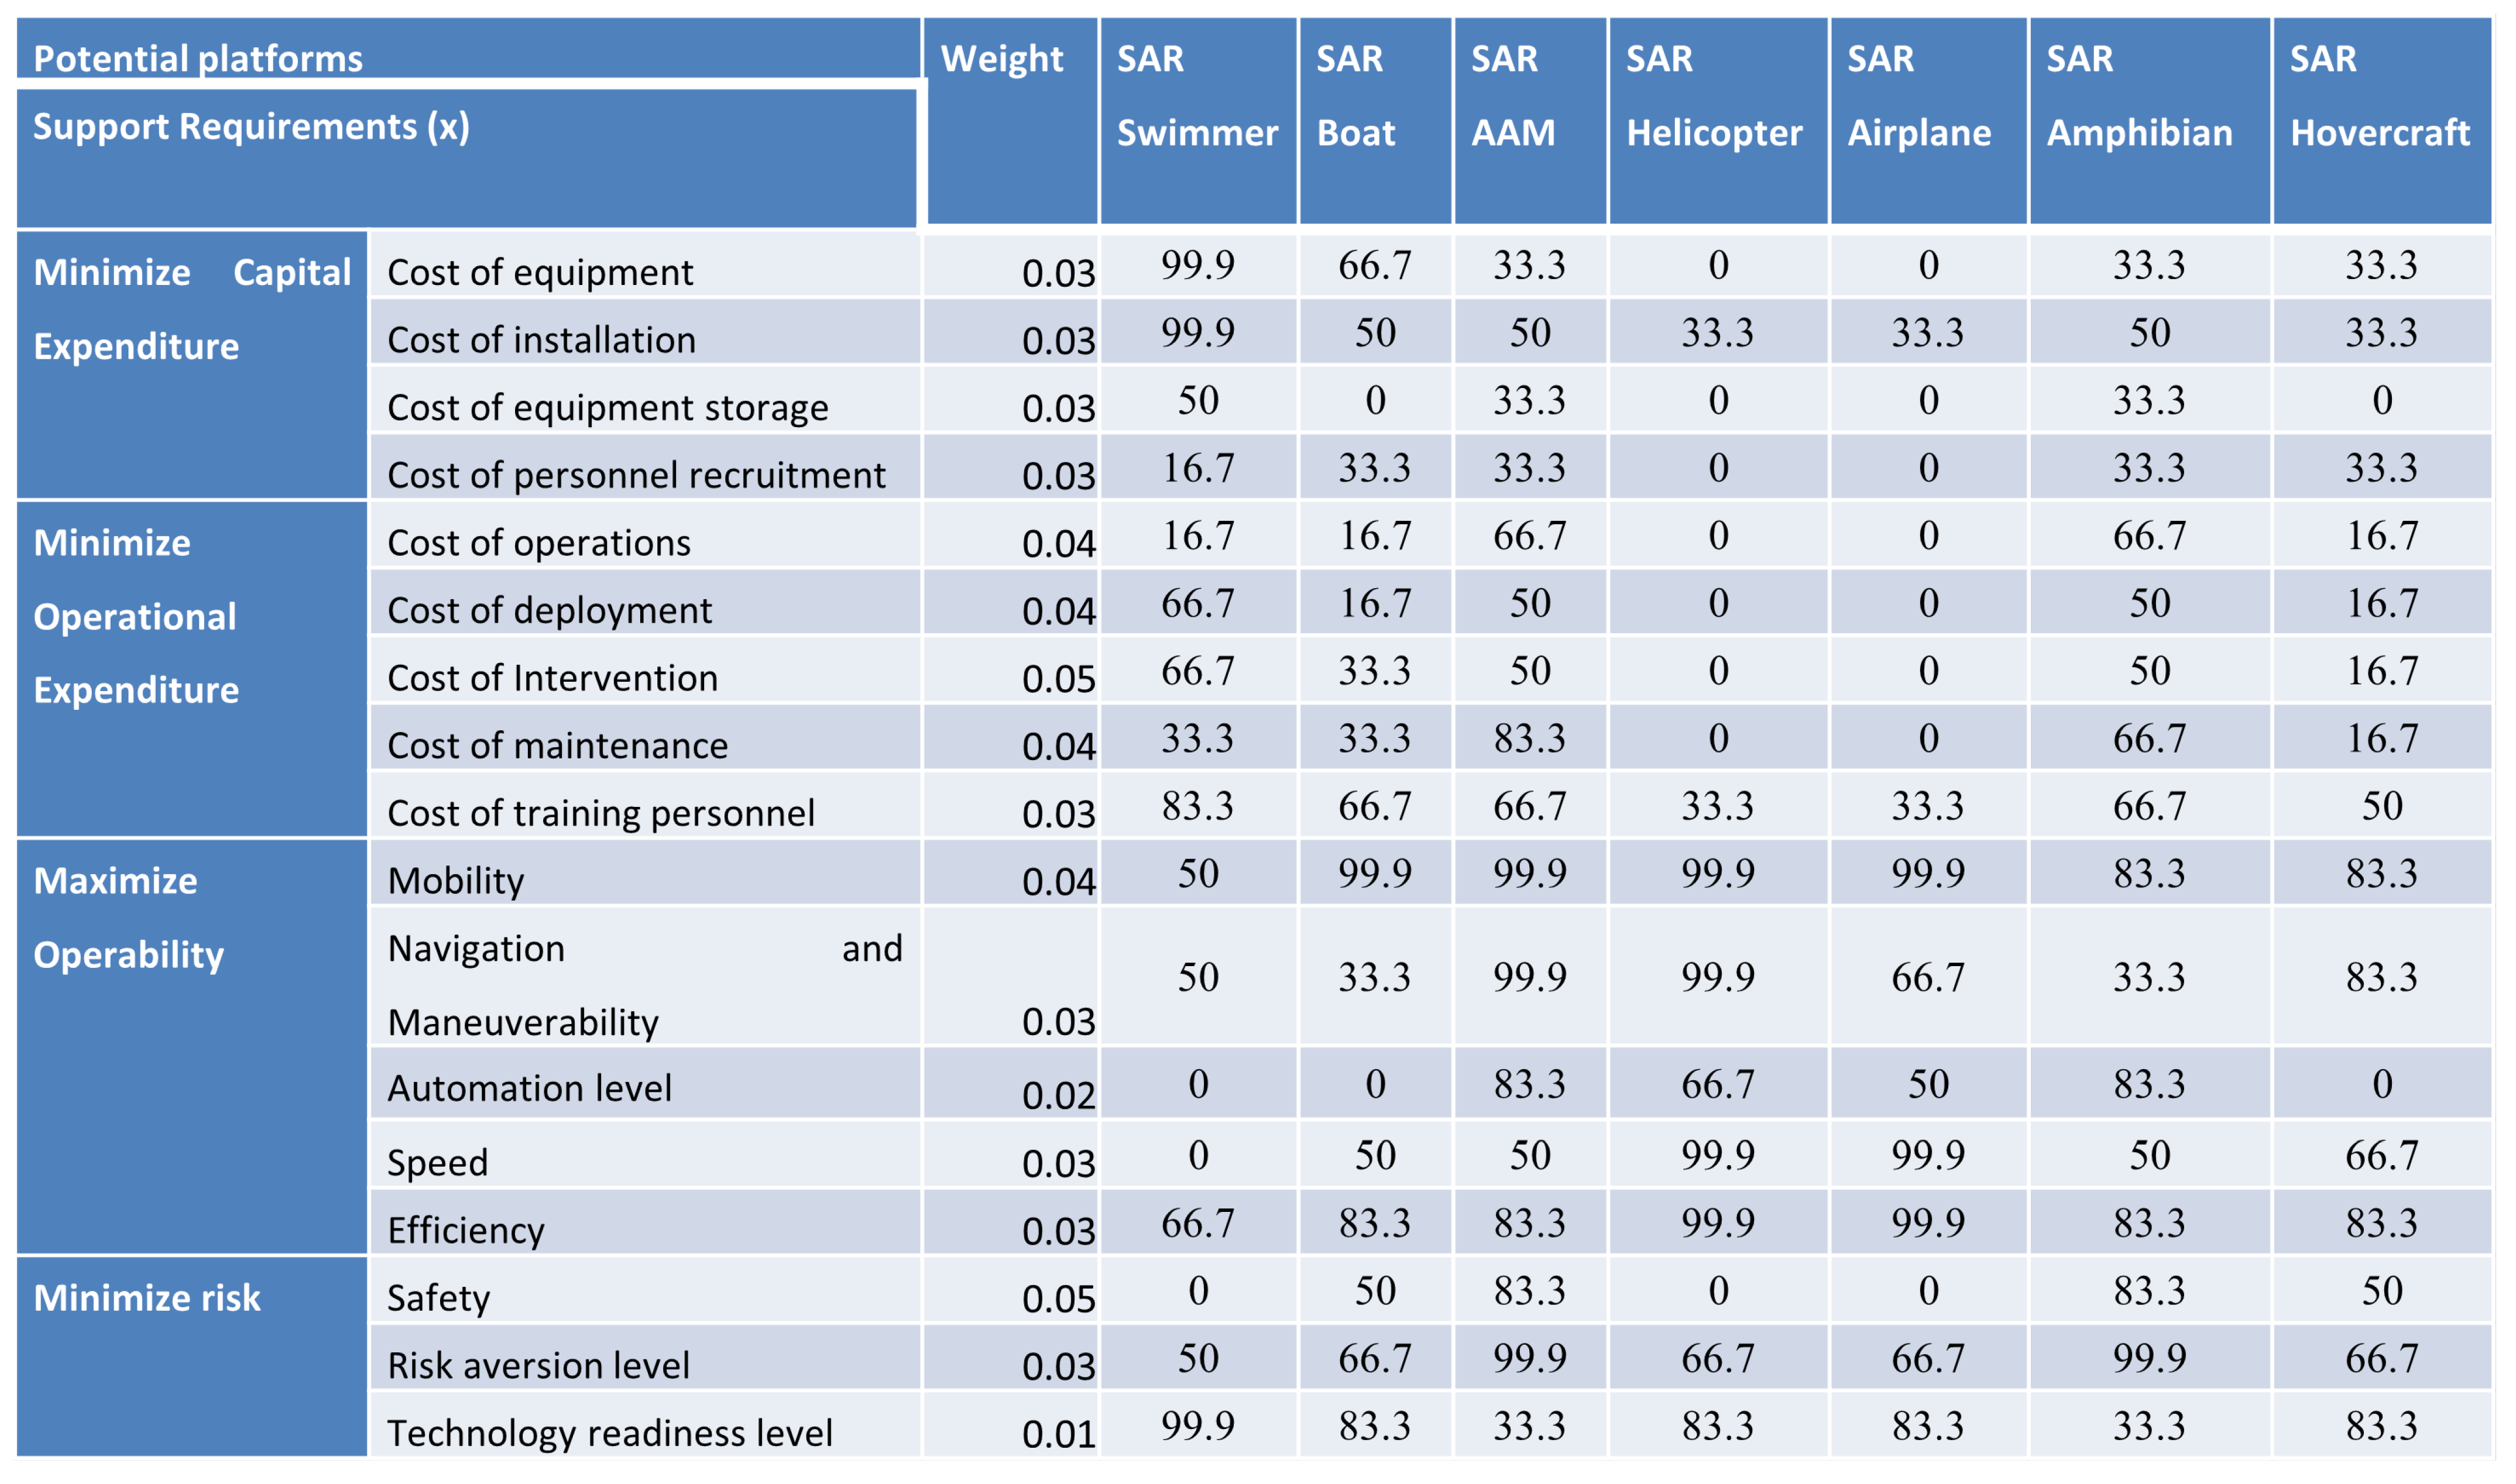
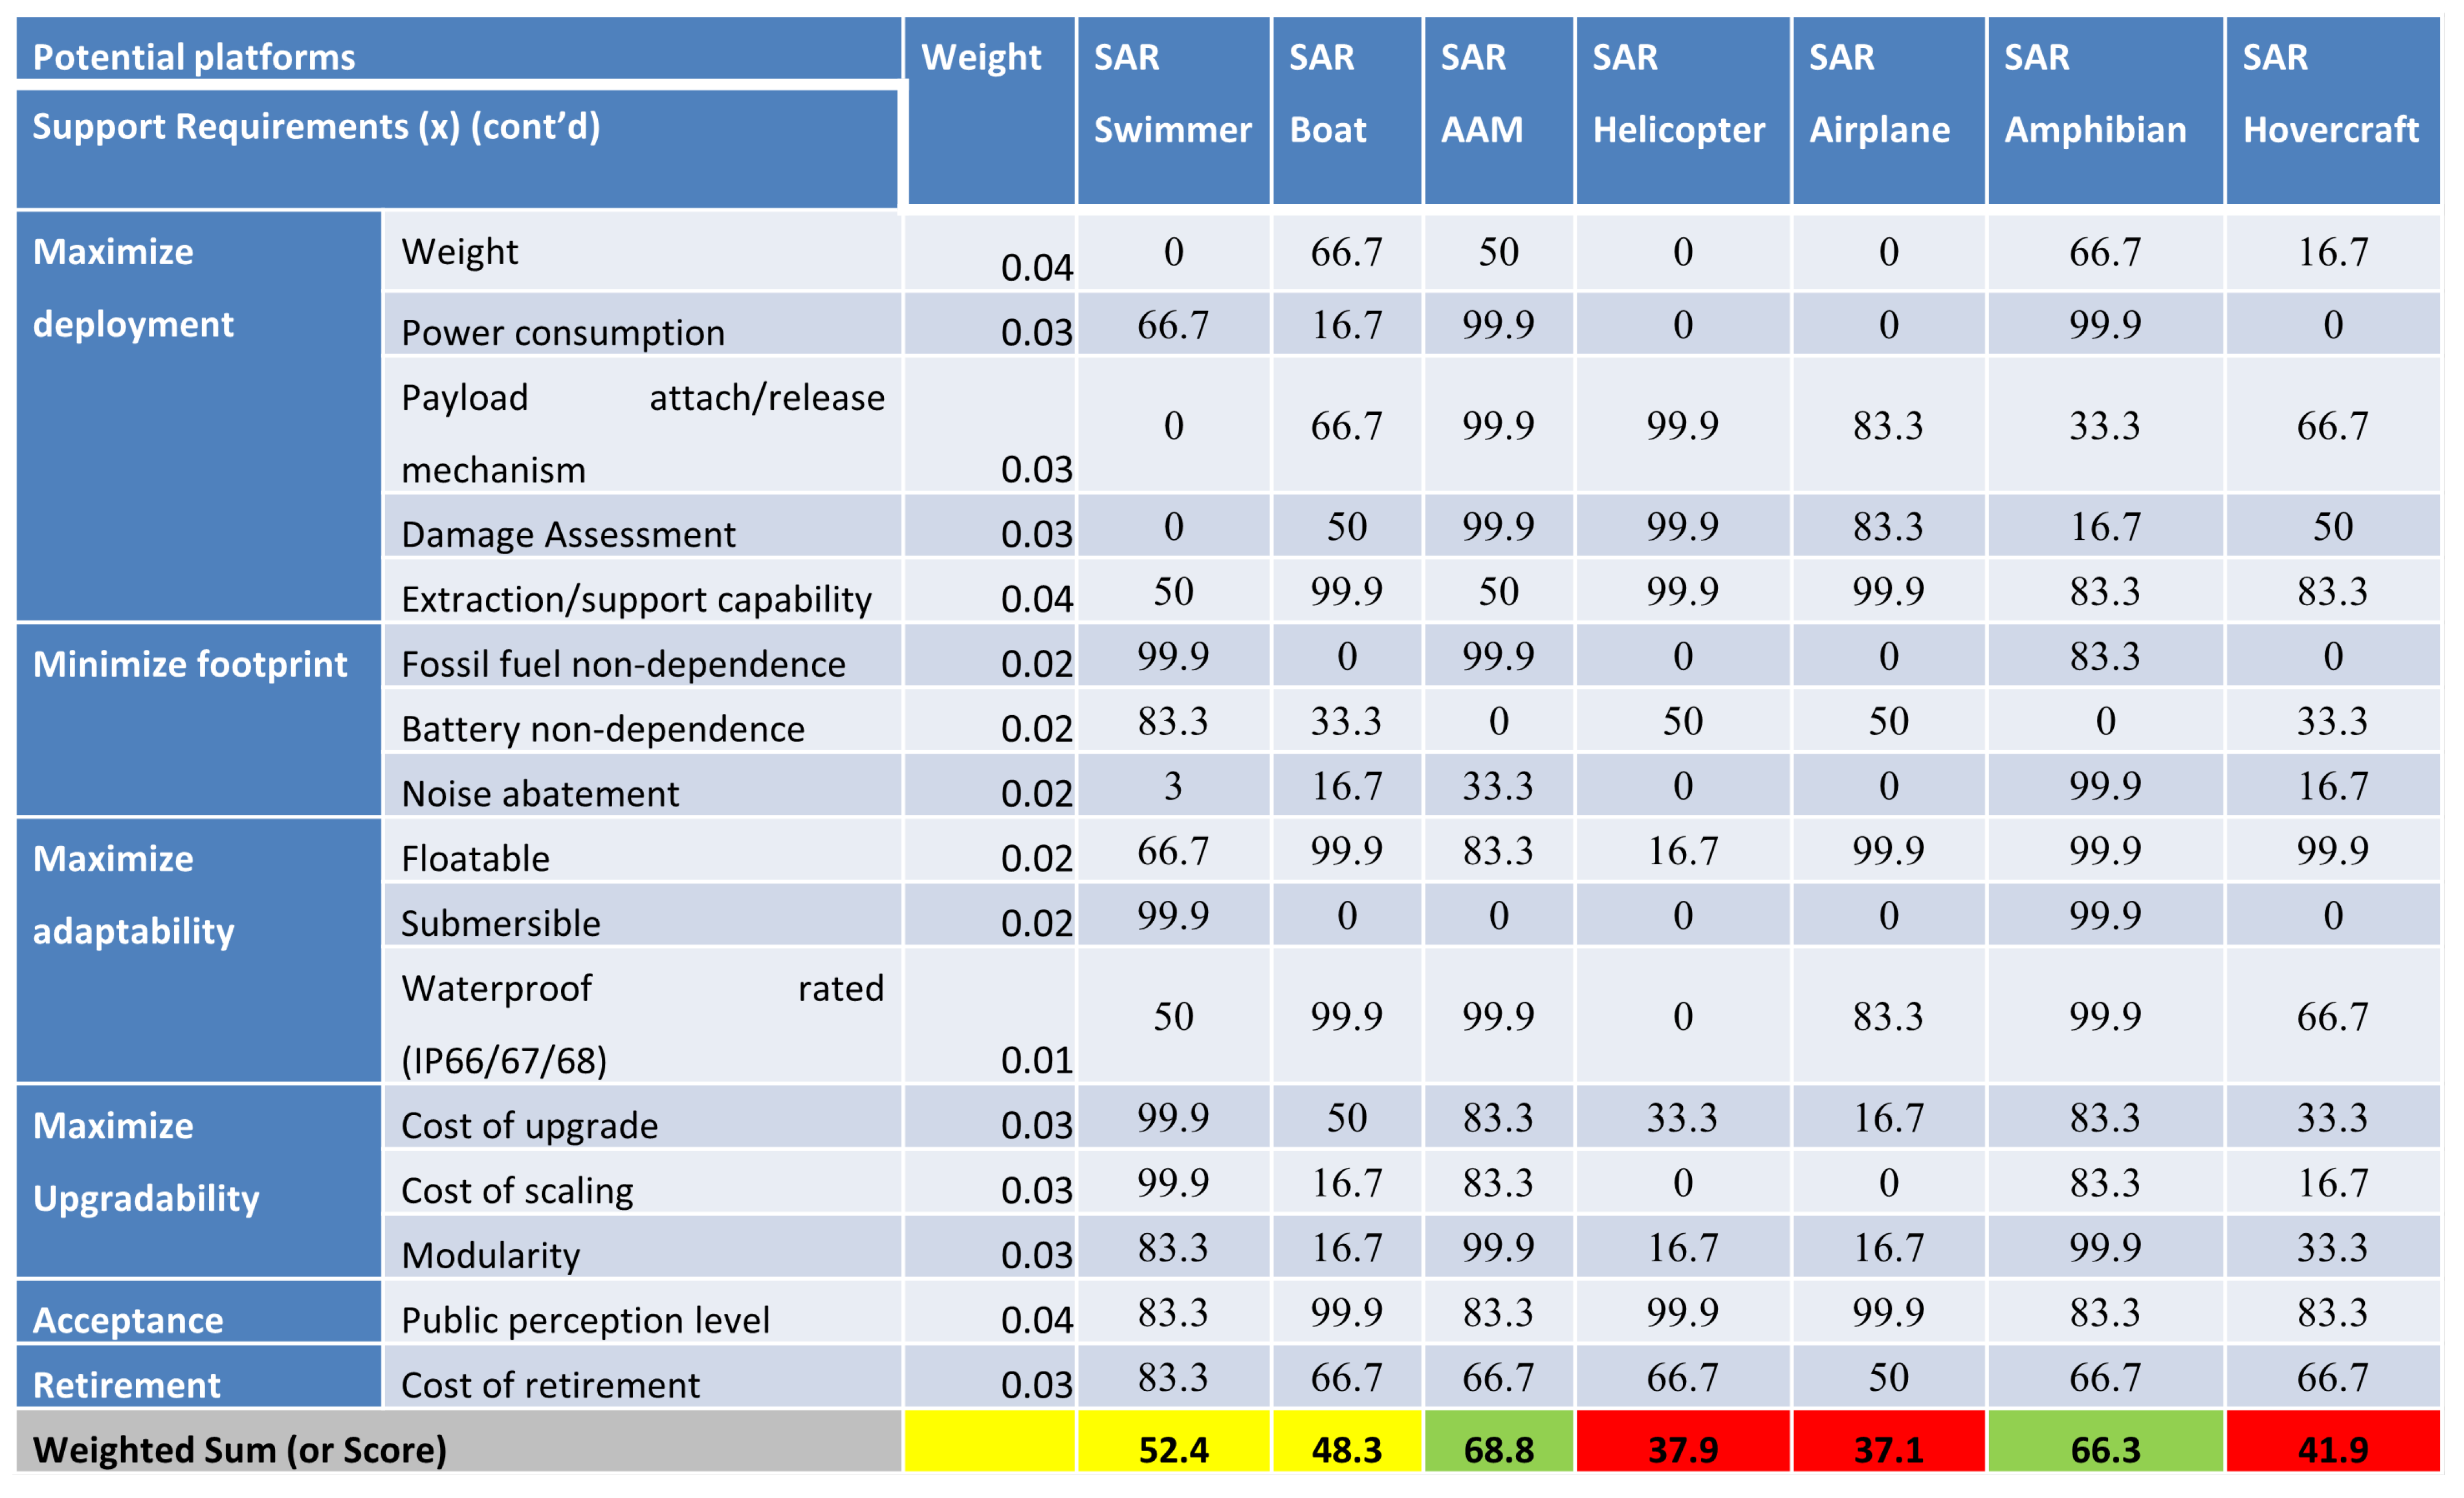
3.2. Pugh Matrix Analysis

After interacting with the stakeholders of the AAMPDR System, the next step for the system engineer is to enumerate the primary challenges and aims for which the stakeholders have expressed their desires and needs. Typical examples of these challenges and aims as they relate to a post-disaster search and rescue effort in the wake of a catastrophe, some of which may also be found in the literature, are:
  • To provide an emergency response team with support,
  • To visually assess the level of damage to affected areas,
  • To support ER workers in locating survivors and casualties by providing real-time imagery and live video feed of affected residential areas,
  • To deliver on-demand and critical intervention in the form of medical aid and food packs to casualties and survivors,
  • To map the affected area in addition to assessing it and upload the map onto a database,
  • To develop the device or means such that it shall be operable in water due to the flooding that accompanies tropical cyclones.
Thus, with the help of these stakeholder desires, in addition to the system requirements that as discussed in the preceding chapters of this work, a Pugh matrix was developed for a list concept solutions as shown in Figure 5 and Figure 6. These alternatives may include a search and rescue (SAR) swimmer [20], a SAR boat [21], SAR advanced air mobility (AAM) [22,23], a SAR helicopter [24], a SAR air- or seaplane [25], a SAR amphibian robot [26], or a SAR hovercraft [27].
From the Pugh matrix in Figure 6, it can be seen that the proposed SAR AAM design is ranked the highest, followed by the SAR amphibian robot, SAR swimmer, SAR boat, SAR hovercraft, SAR helicopter, and SAR airplane. It is important to note that these weights have been chosen based on their relative importance with regard to the SAR mission objective and have been analyzed and graded by the student researcher with respect to authoritative sources previously cited for each alternative.

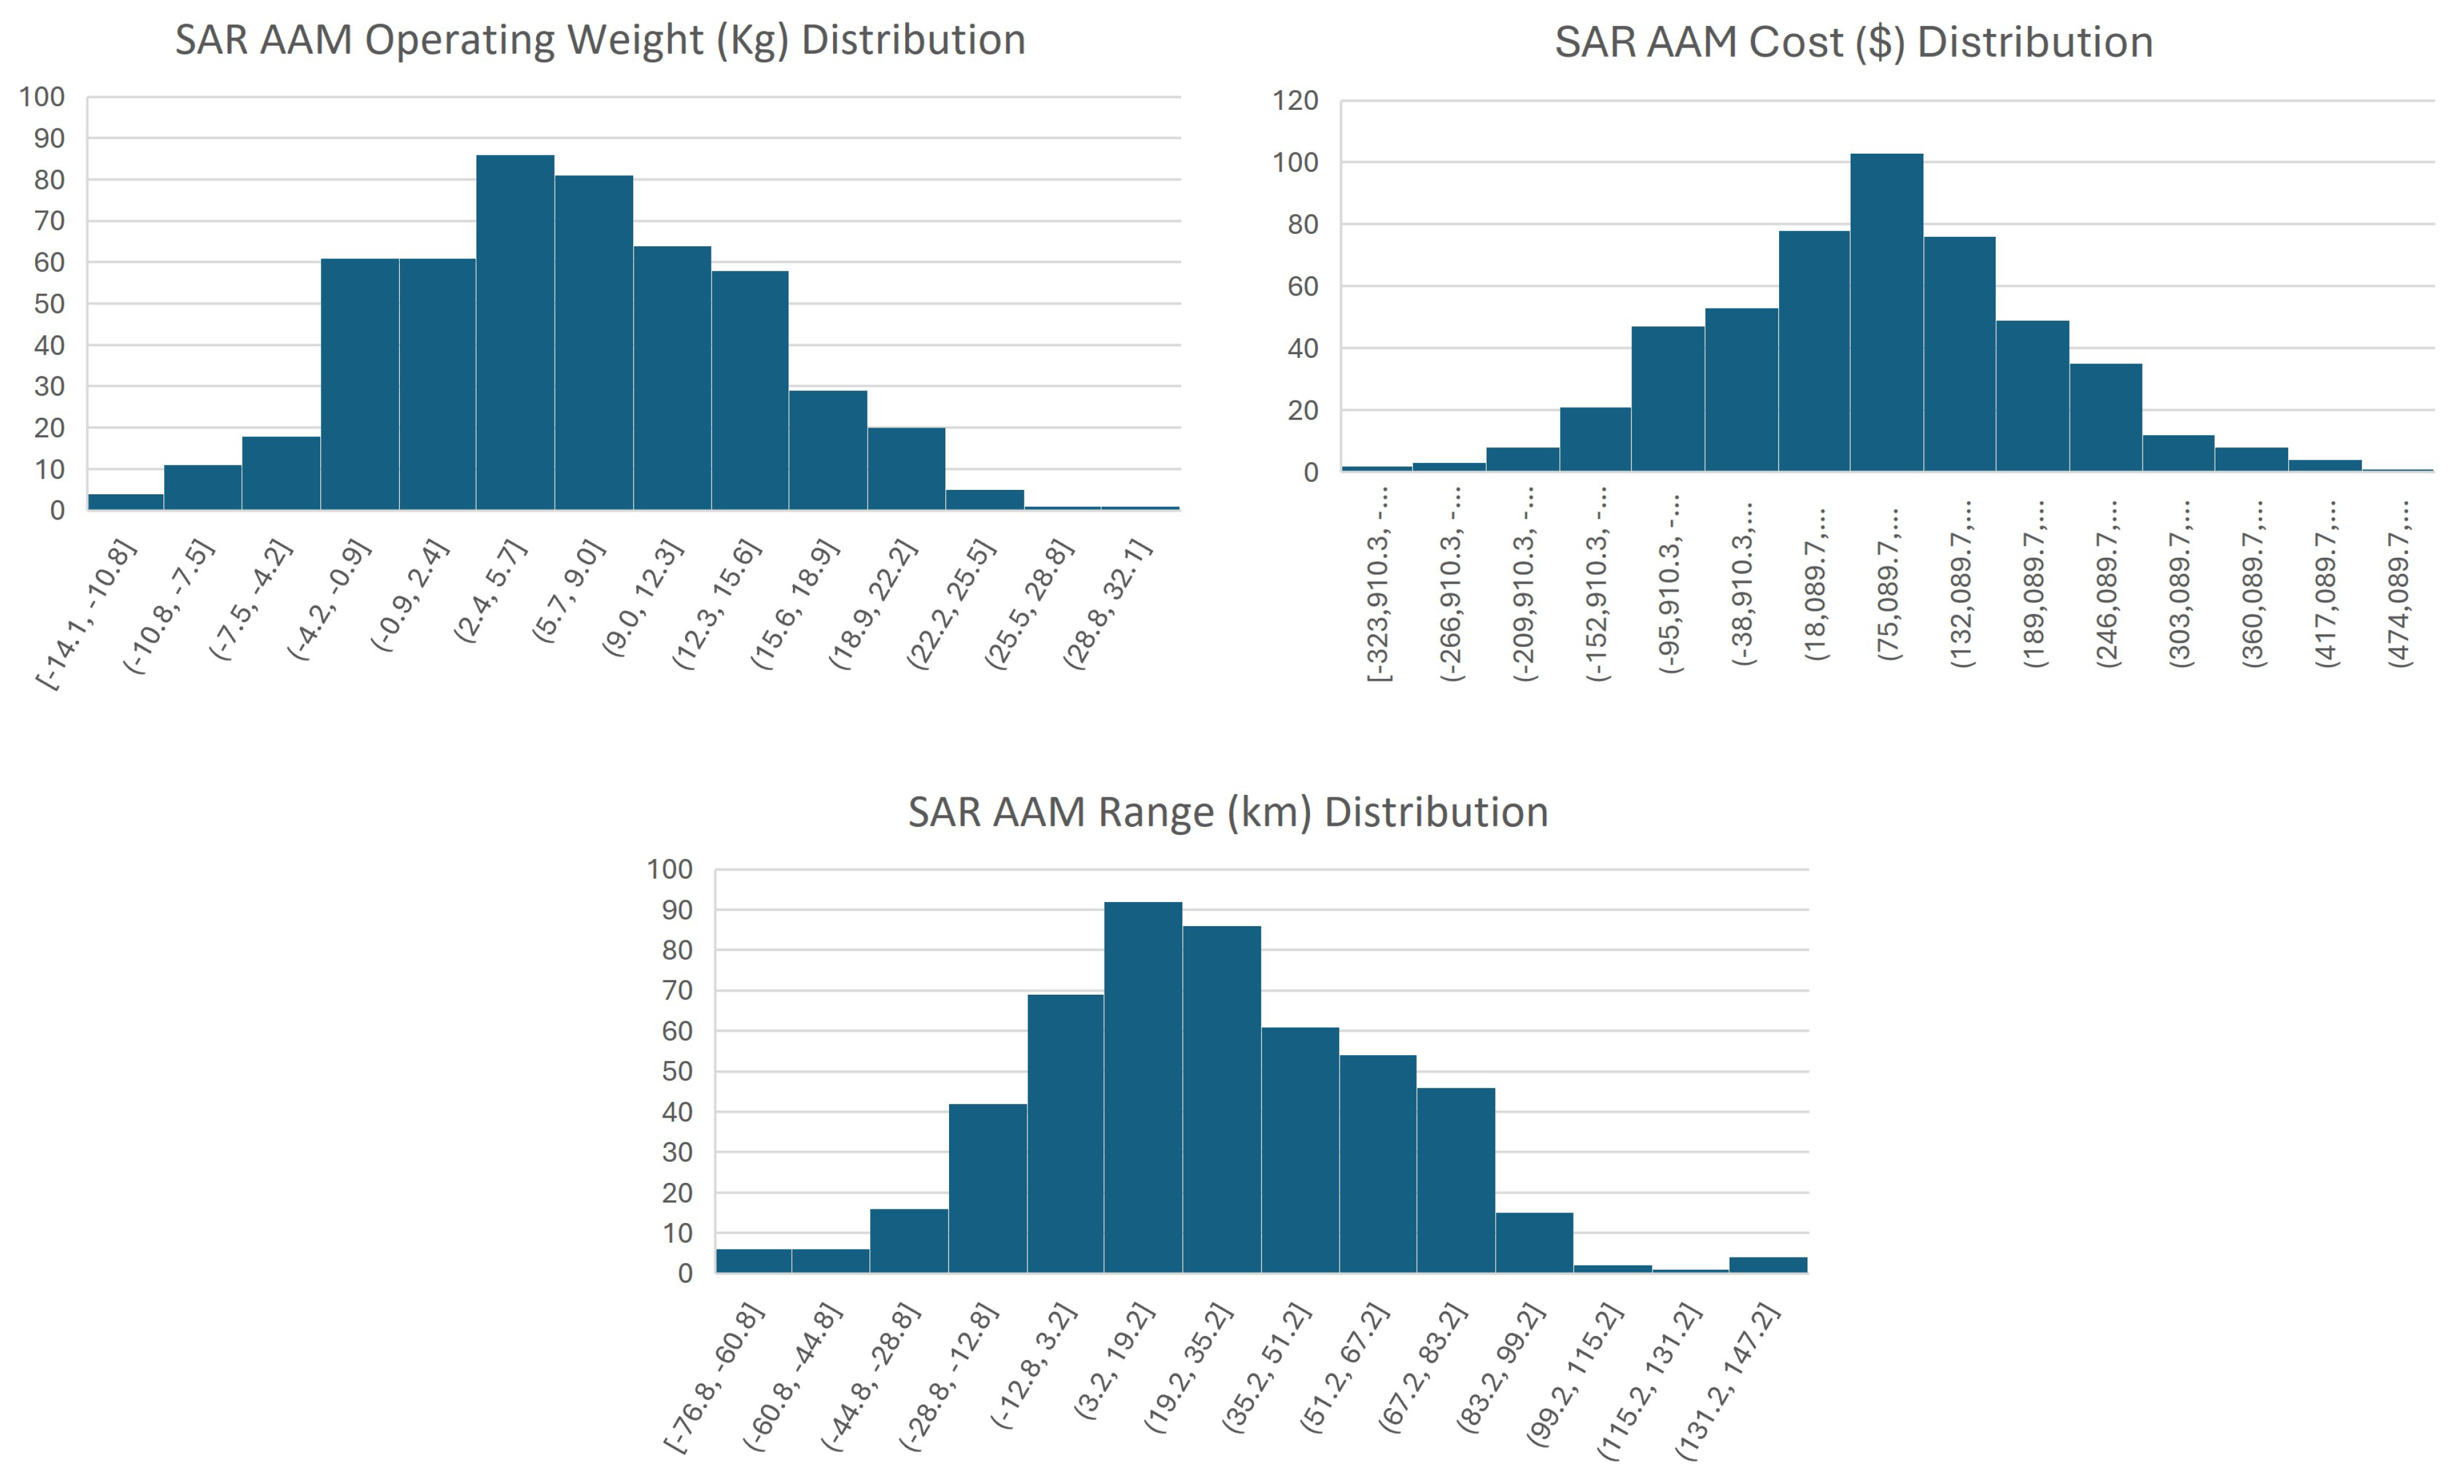
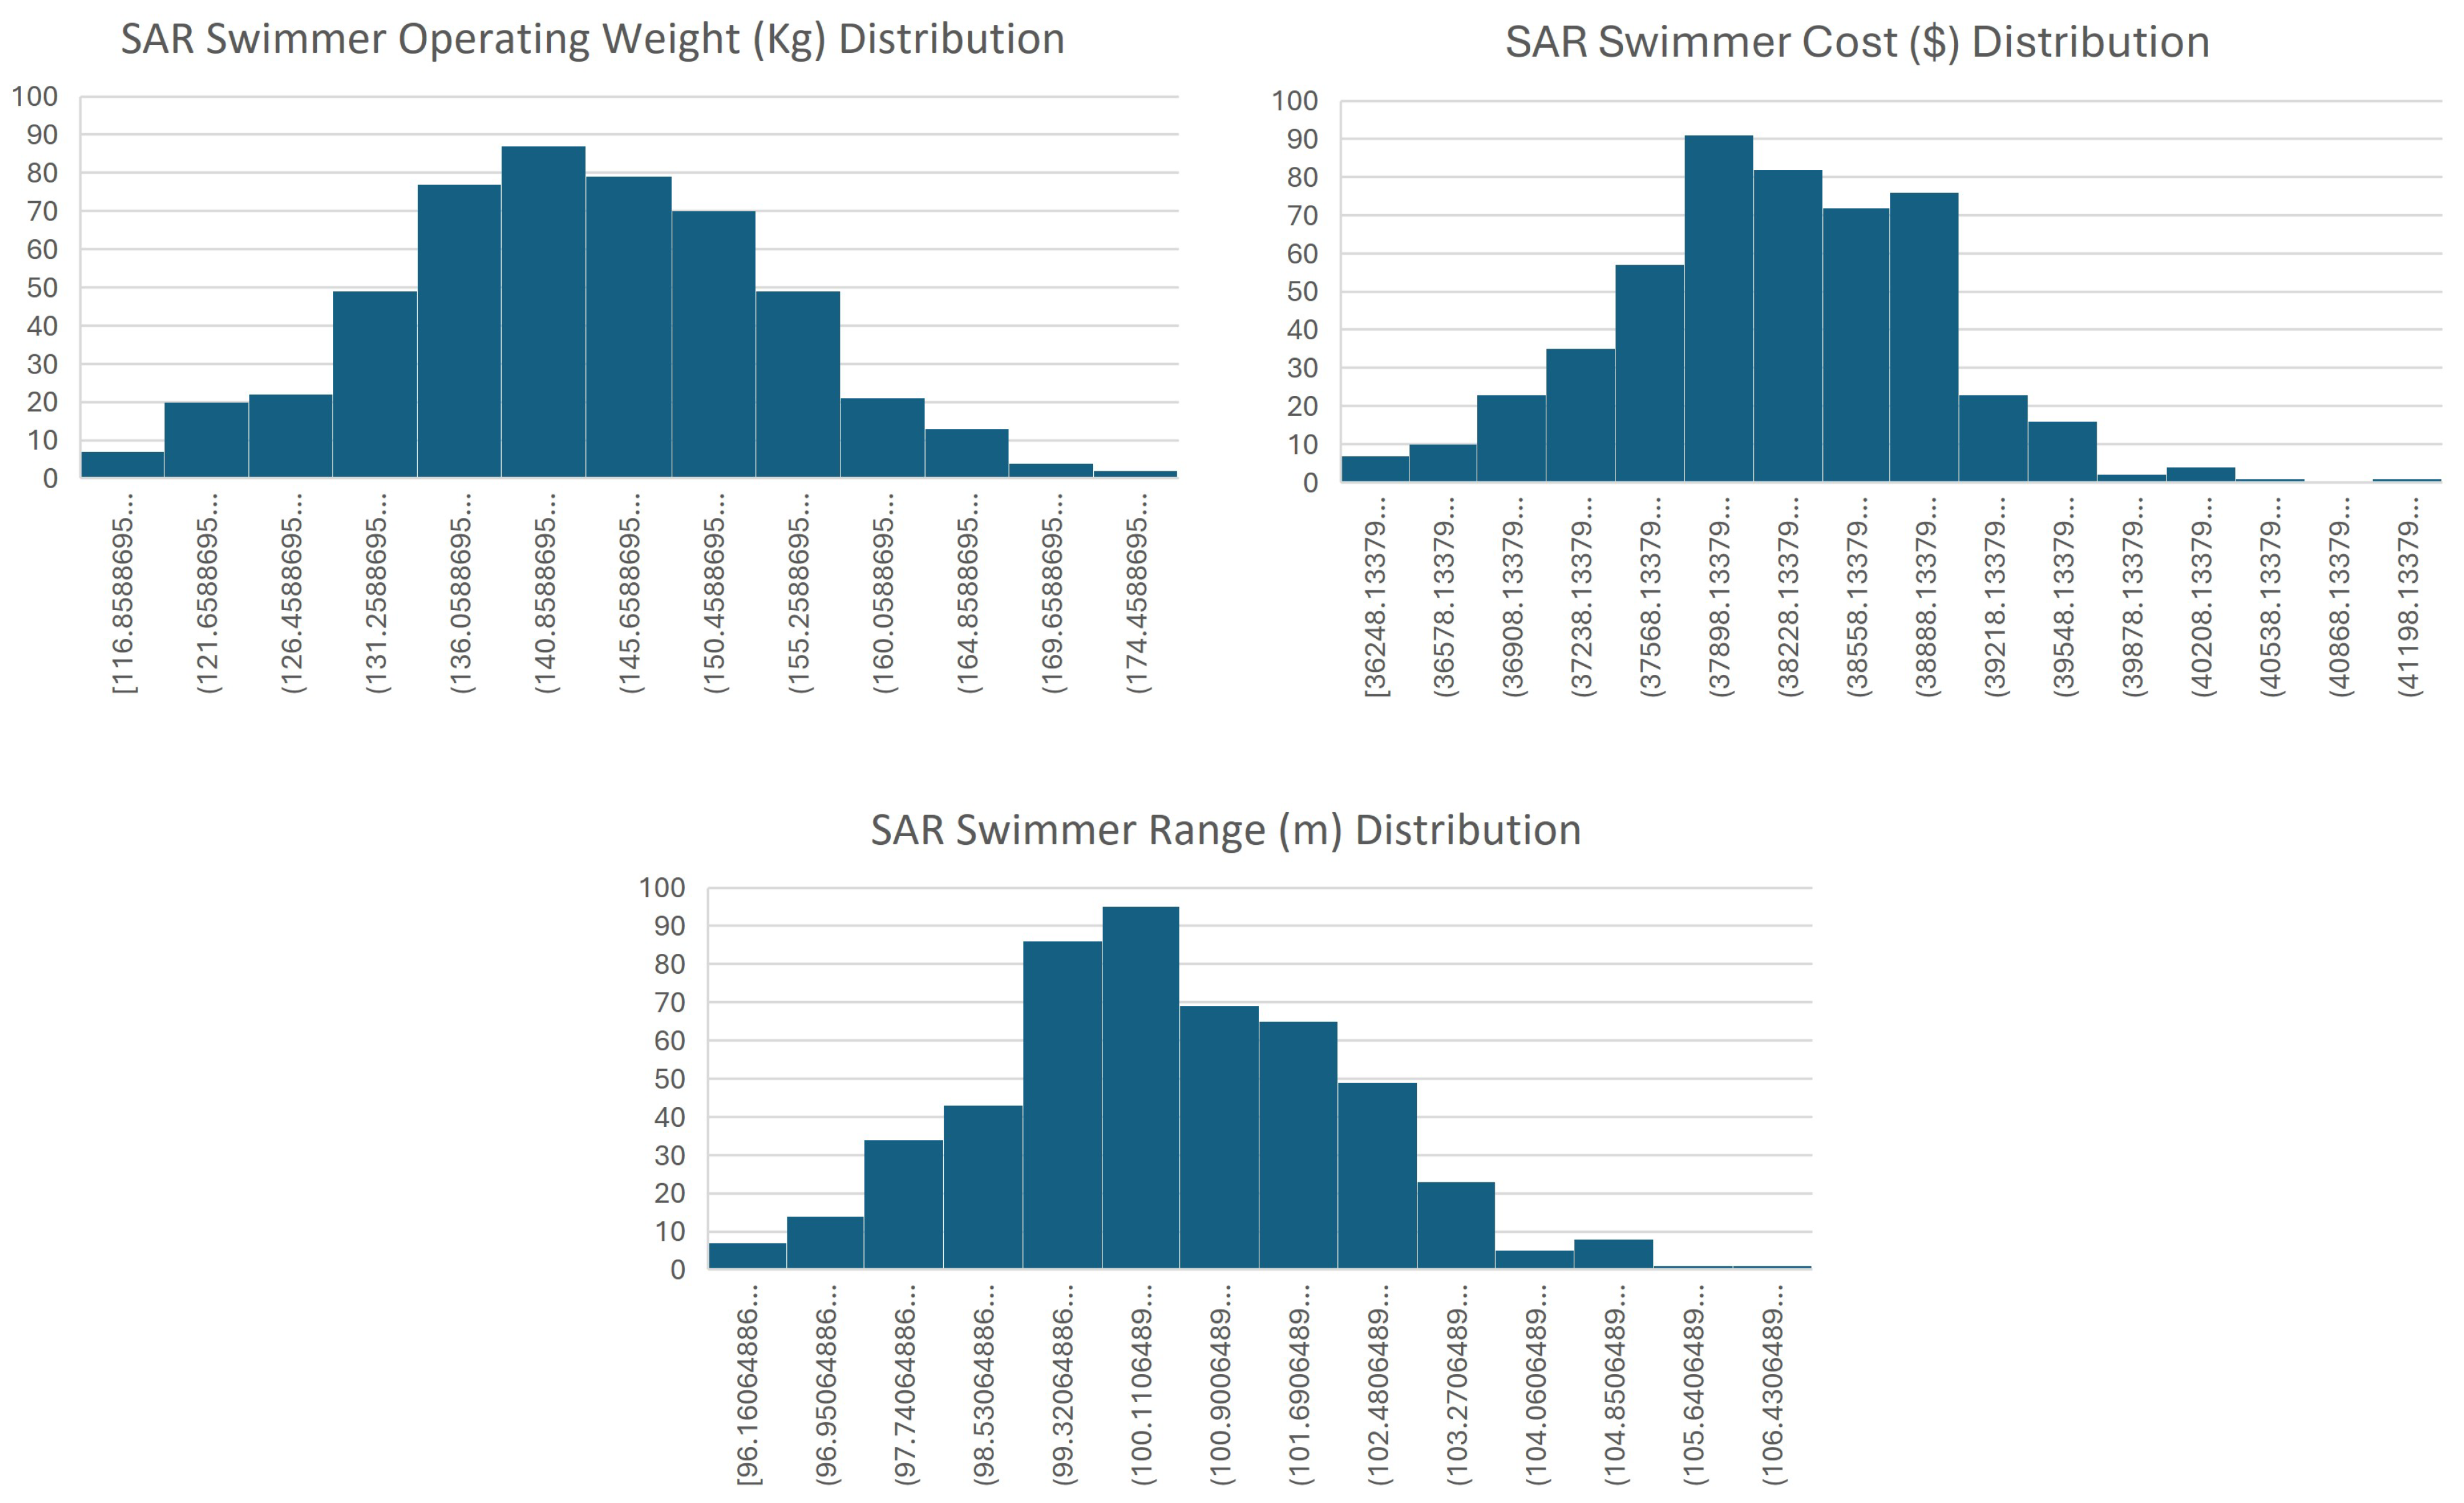
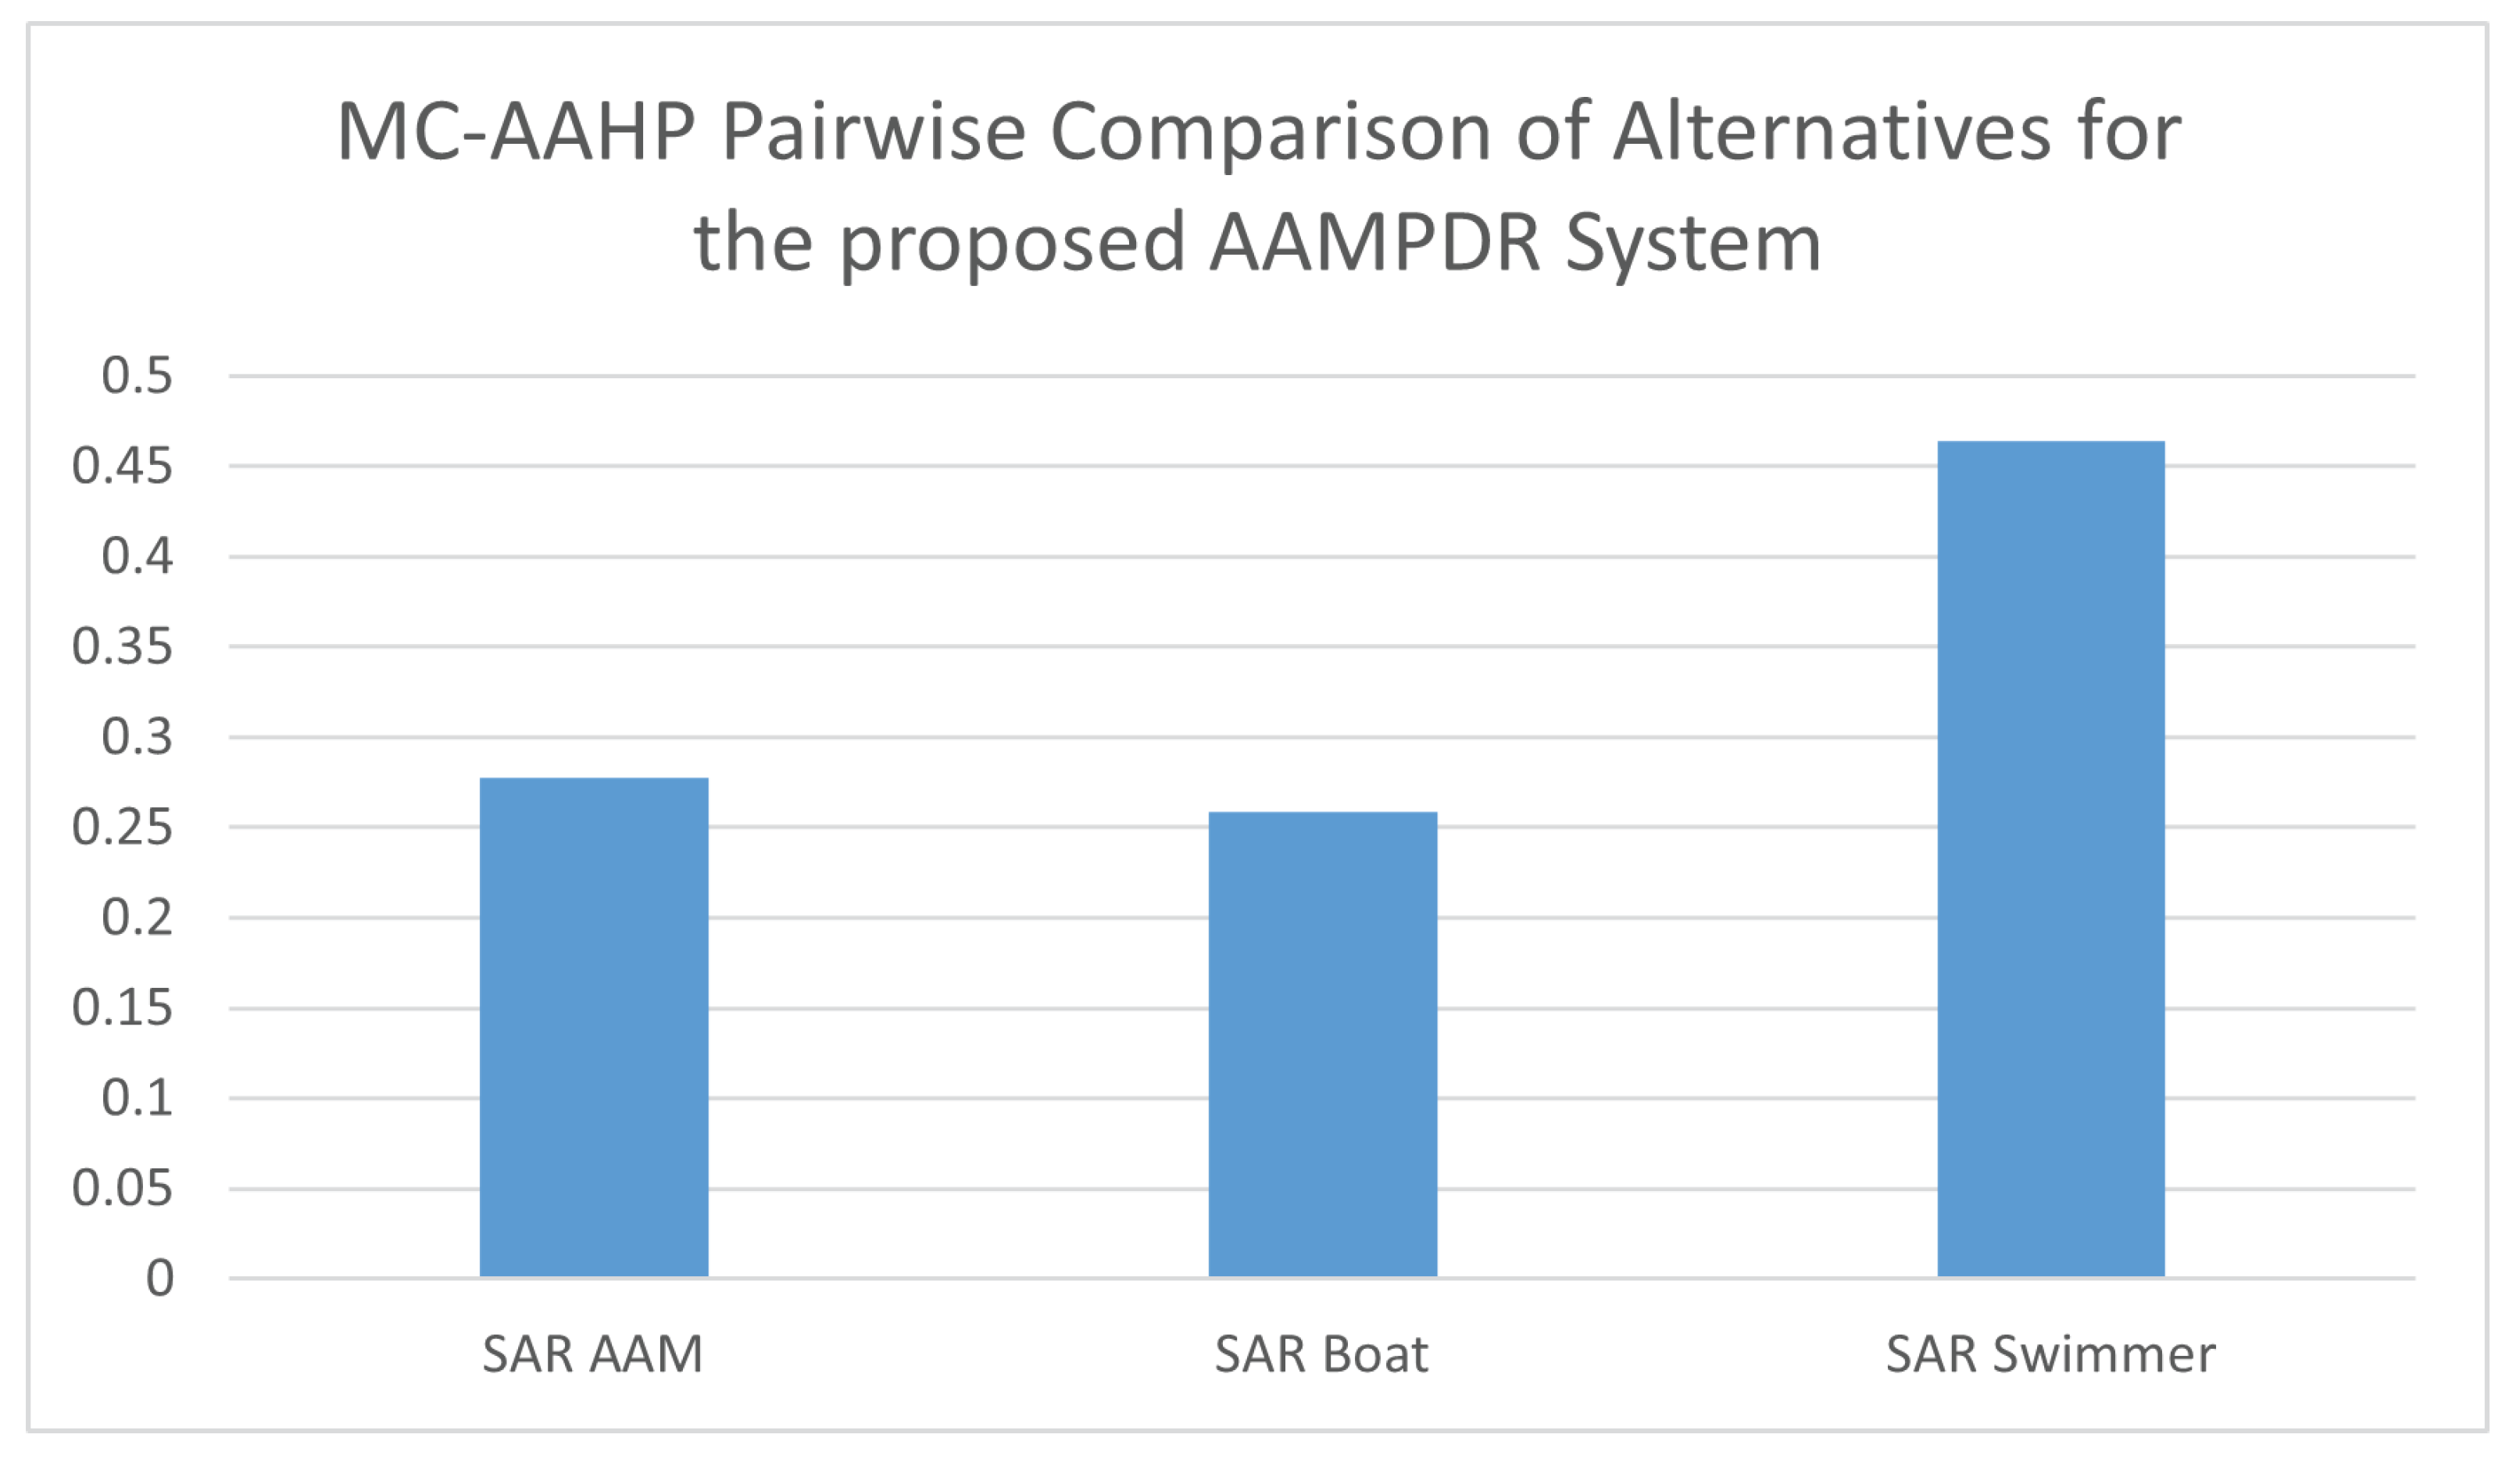
3.3. The Monte Carlo–Analytical Hierarchical Hybrid Process (MC–AHHP) Analysis

For this analysis, three concept selections or alternatives are considered, namely an SAR AAM, SAR boat, and SAR swimmer. Also, for this case study, three (3) parameters have been chosen, namely operating weight, cost of acquisition, and operating range. Their corresponding data are subjected to Monte Carlo simulation to select the best averages for each proposed alternative. The plots of their Gaussian distributions are also presented in Figure 7, Figure 8 and Figure 9.
Given the standard preference scale for AHP from Table 1, a pairwise comparison matrix (PCM) containing rating values for each decision alternative may be formulated as follows:
Index: SAR AAM (SA), SAR boat (SB), SAR swimmer (SS). Therefore, in more specific terms, where n = 3 since there are three (3) candidate selections as enumerated in the foregoing.
The PCM of Table 4 indicates that the concept selection of SA is strongly preferred to SS in terms of the operating weight and so forth. The rationale behind this rating is that the AAM platform can transport and deliver intervention packages to casualties more efficiently than a swimmer could, given the circumstances of a flooding or hurricane environment. It is noteworthy that the comparison of an alternative against itself returns a value of one, which lies along the diagonal of the matrix. Furthermore, the pairwise comparison of the remaining two criteria, namely the cost and operating range, may be formulated using a similar approach.
The prioritization of the decision alternatives is executed followed by the normalization of each PCM, and the mean value of each candidate rating is obtained. Following these transformations, the resulting vector is representative of the preferences for each candidate with respect to the operating weight (OW) criterion, σ ¯ O W , which may presented as follows:
σ ¯ O W = σ ¯ 1 , o w σ ¯ 2 , o w σ ¯ 3 , o w
For this specific case,
σ ¯ 1 , o w = 0.2074 , σ ¯ 2 , o w = 0.7378 , and σ ¯ 3 , o w = 0.05478 .
Through matrix manipulation, each of the three preference vectors are grouped into a concept selection preference matrix:
σ ¯ i j = σ ¯ 1 , o w σ ¯ 1 , c σ ¯ 1 , o r σ ¯ 2 , o w σ ¯ 2 , c σ ¯ 2 , o r σ ¯ 3 , o w σ ¯ 3 , c σ ¯ 3 , o r
Here, σ ¯ 1 , o w , σ ¯ 1 , c , and σ ¯ 1 , o r are the normalized mean values for the SAR AAM (SA) on the i th = 1 row and relative to the operating weight (ow), cost (c), and operating range (or) parameters, respectively. Again, the same may be applied to the other decision alternatives.
The steps are repeated to obtain the PCM to rank the relative weights of the decision criteria, D ¯ , as well. That is,
D ¯ i j = d ¯ 1 , 1 d ¯ 1 , 2 d ¯ 1 , 1 d ¯ 2 , 1 d ¯ 2 , 2 d ¯ 2 , 3 d ¯ 3 , 1 d ¯ 3 , 2 d ¯ 3 , 3
In specific terms, using the preference scale on Table 1, the matrix D ¯ developed for this concept selection model for this AAMPDR system, its normalized matrix, and the vector of their corresponding mean values may be obtained as follows:
D ¯ i j = 1 1 / 6 1 / 3 6 1 5 3 1 / 5 1
μ ¯ D = μ ¯ o w μ ¯ c μ ¯ o r
Here, μ ¯ o w , μ ¯ c , and σ ¯ o r are the normalized mean values for the three decision criteria, respectively.
A score model analogous to its eigenvalue was developed by performing a matrix product of the candidate preference matrix and the criteria preference vector as follows:
λ = d ¯ 1 , 1 d ¯ 1 , 1 d ¯ 1 , 1 d ¯ 2 , 1 d ¯ 2 , 2 d ¯ 2 , 3 d ¯ 3 , 1 d ¯ 3 , 2 d ¯ 3 , 3 μ ¯ o w μ ¯ c μ ¯ o r
The results may be readily computed, the sum of which resolves to unity as expected:
λ = 0.2774 0.2589 0.4637
The foregoing results indicate that the SAR swimmer emerges as the winner of the three alternatives, while the SAR AAM is the runner-up followed by the SAR Boat. By comparison, the SAR AAM was ranked as the first choice in the Pugh matrix in Section 3.2. In hindsight, an explanation for this outcome of the Pugh matrix may lie with the choice of weights and weighted scores applied therein. Furthermore, in the Pugh matrix, more potential vehicle choices were analyzed, and thus, there were more criteria to consider, which could explain the results of the data regardless of the marginal differences in the respective weights applied to each preference parameter considered. The graph of this MC–AHHP effort is presented in Figure 10.
Finally, in order to validate the MC–AHHP model developed for the AAMPDR concept selection, the consistency ratio of the consistency index (CI) and the random index (RI) was calculated [16]. The result showed C I / R I = 0.083 to 3 decimal places. Thus, the CI for this model duly satisfied the consistency ratio requirement such that C I / R I < 0.10 . The implication is that the MC–AHHP model developed in this work is well within acceptable limits in terms of the degree of consistency. It further indicates the level of bias introduced by the researchers into the MOE efforts. In this case, the bias is marginal enough to support the initial goal of a less subjective, more objective measure for evaluating the alternatives to the proposed AAMPDR system.
Following the results obtained by applying the MC–AHHP technique to the proposed AAMPDR system, the authors further note its significance to the broader systems engineering practice. At present, the dominant method presented to students of SE entails foundational scoring models such as the Pugh matrix for pedagogical purposes. However, through this demonstration, SE educators may incorporate this MC–AHHP technique into their curricula, considering that it is straightforward, has a relatively less steep learning curve, and appears not to incur much compromise in terms of the accuracy of the result when compared to more mathematically involved concepts such as goal programming. An additional merit of adopting the MC–AHHP technique includes its data-driven approach, making it less prone to subjective bias that may otherwise influence other empirical methods such as the Pugh matrix.

4. Conclusions

In this work, the subject of MOEs was discussed in detail. Notable among other contributions was the development of a SysML parametric model to compute the MOE for the proposed AAMPDR system and the creation of an algorithm for the MC–AHHP model, and the computation of a ranking score for three of the alternatives to the same proposed system of interest. Further, this algorithm was presented in the form of a flow chart, as depicted in Figure 1.
As per the Pugh matrix, it was found that the proposed SAR AAM candidate was ranked as first, followed by the SAR amphibian robot, SAR swimmer, SAR boat, SAR hovercraft, SAR helicopter, and SAR airplane. However, when the MC–AHHP simulation experiment was conducted, it was found that the SAR AAM was ranked second to the SAR swimmer (otherwise, swim team), while the SAR boat ranked third. Having explored two approaches, the MC–AHHP method developed in this work is recommended as a preferred method for evaluating the MOE as opposed to using the Pugh matrix. The reason for this is that the former has been demonstrated to be data driven and offers a less subjective, more objective and balanced approach. The final results obtained through this MC–AHHP technique were also verified using the degree of consistency metric.
Thus, depending on the aim and objectives of the decision maker, the Pugh matrix represents a relatively rapid and straightforward approach for computing the MOE using the score ranking model. However, it is not the most accurate, as it is prone to the subjectivity of the practitioner who is performing the analysis.
For other scenarios in which the decision maker’s aims are accuracy and precision, then the authors recommend that the MC–AHHP technique be adopted and performed in place of the Pugh matrix method. However, the cons of the MC–AHHP technique may include factors such as being time consuming and requiring additional computational resources depending on the number of simulation runs that the analyst intends to perform and how large the data distribution is.
While the present work did not consider applying the synthesization technique in the AHP segment owing to the scope and rigor involved, there are plans to undertake this procedure in a subsequent study as well as to perform further sensitivity analysis so that the results obtained may be compared to those recorded in the present work.

Author Contributions

Conceptualization, O.A.O.; methodology, O.A.O., C.J.M. and S.G.W.; software, O.A.O.; formal analysis, C.J.M. and S.G.W.; investigation, O.A.O.; writing—original draft, O.A.O.; writing—review and editing, O.A.O., C.J.M. and S.G.W.; supervision, C.J.M. and S.G.W. All authors have read and agreed to the published version of the manuscript.

Funding

This research received no external funding.

Institutional Review Board Statement

Not applicable.

Informed Consent Statement

Not applicable.

Data Availability Statement

The original contributions presented in the study are included in the article. Further inquiries can be directed to the corresponding author.

Conflicts of Interest

The authors declare no conflicts of interest.

Abbreviations

The following abbreviations are used in this manuscript:
AAMAdvanced Air Mobility
AAMPDRAdvanced Air Mobility Post-Disaster Response
AHPAnalytical Hierarchy Process
FAAFederal Aviation Administration
FEMAFederal Emergency Management Agency
MC–AHHPMonte Carlo–Analytical Hierarchical Hybrid Process
MCDMMulti-criteria Decision Making
MCMMonte Carlo Method
NASANational Aeronautic and Space Administration
NOAANational Oceanic and Atmospheric Administration
SARSearch and Rescue
SysMLSystem Modeling Language
UAVUnmanned Aerial Vehicle
WUTAWeighted Utility Additive Theory

Notes

1
The term ‘weight’, as used in this context and Equation (1), refers to the relative importance given to a set of criteria. That is, a value assigned to the criteria in the order of most to least importance [16].
2
Readers should note the implied assumption in this study, which is the introduction of Gaussian noise into the Monte Carlo segment of the MC–AHHP process. This is owing to the pseudo-randomness of the numbers generated.
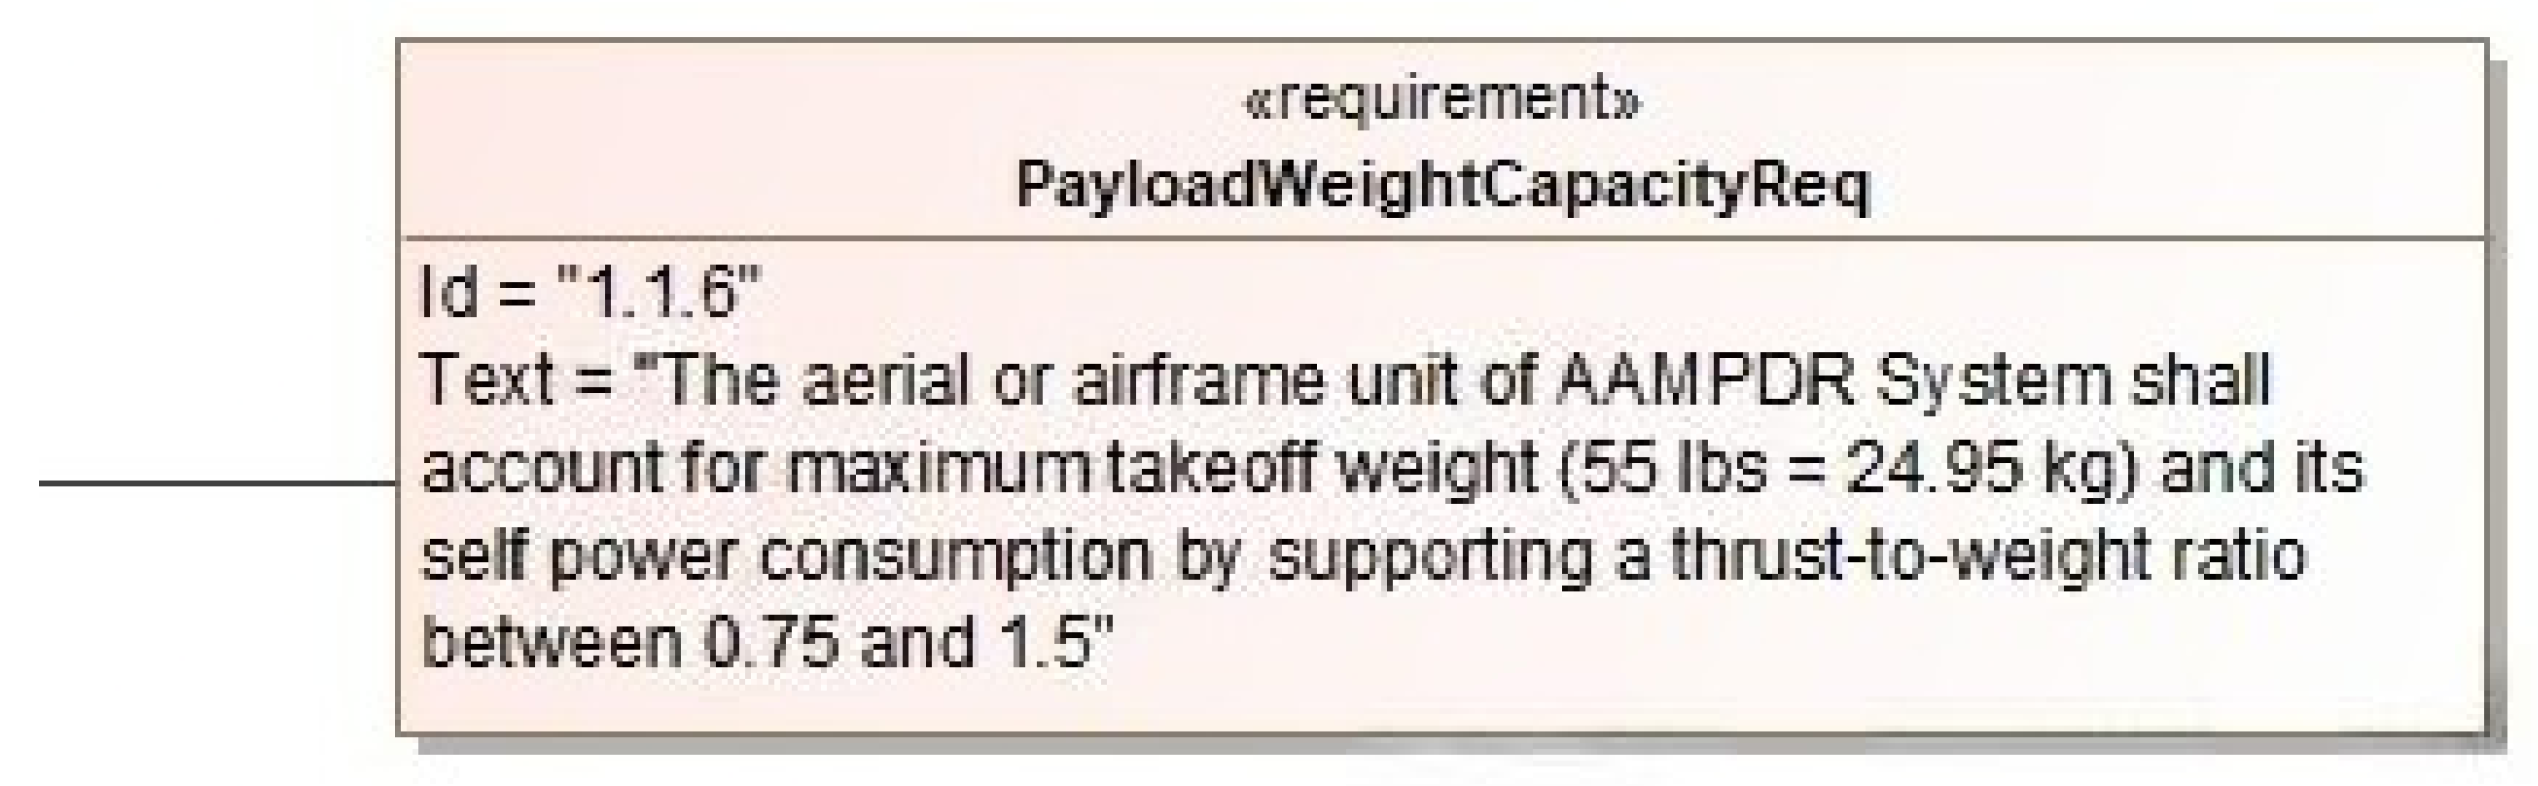
3
Refer to [19] for the details on the requirements for the AAMPDR system.
4
Refer to [19] for the complete logical architecture SysML artifacts depicting the different levels of decomposition for the proposed AAMPDR system. These include (but not limited to) the thermal, safety, command and control management modules

References

  1. Kroese, D.P.; Brereton, T.; Taimre, T.; Botev, Z.I. Why the Monte Carlo method is so important today. Wiley Interdiscip. Rev. Comput. Stat. 2014, 6, 386–392. [Google Scholar] [CrossRef]
  2. Vargas, L.G. An overview of the analytic hierarchy Process and its applications. Eur. J. Oper. Res. 1990, 48, 2–8. [Google Scholar] [CrossRef]
  3. Friedenthal, S.; Moore, A.; Steiner, R. A Practical Guide to SysML: The Systems Modeling Language, 3rd ed.; Morgan Kaufmann: Burlington, MA, USA, 2014; pp. 1–599. ISBN 978-0-12-800202-5. [Google Scholar]
  4. Green, J.M. Establishing system measures of effectiveness. In Proceedings of the 2nd Biennial National Forum on Weapon System Effectiveness, Laurel, MD, USA, 27–29 March 2001; pp. 1–5. [Google Scholar]
  5. Cilli, M.V.; Parnell, G.S. 4.3.1 Systems Engineering Tradeoff Study Process Framework. In INCOSE International Symposium; Wiley Online Library: Hoboken, NJ, USA, 2014; pp. 313–331. [Google Scholar] [CrossRef]
  6. Anyanhun, A.I.; Anzagira, A.; Edmonson, W.W. Intersatellite communication: An MBSE operational concept for a multiorbit disaggregated system. IEEE J. Miniaturization Air Space Syst. 2020, 1, 6–65. [Google Scholar] [CrossRef]
  7. Reed, C.M.; Fenwick, A.J. A consistent multi-user framework for assessing system performance. arXiv 2010, arXiv:1011.2048. [Google Scholar]
  8. Rosenbloom, E.S. A probabilistic interpretation of the final rankings in AHP. Eur. J. Oper. Res. 1996, 96, 371–378. [Google Scholar] [CrossRef]
  9. Momani, A.M.; Ahmed, A.A. Material handling equipment selection using hybrid Monte Carlo simulation and analytic hierarchy process. Int. J. Ind. Manuf. Eng. 2011, 5, 2177–2182. [Google Scholar]
  10. Chakraborty, S.; Banik, D. Design of a material handling equipment selection model using analytic hierarchy process. Int. J. Adv. Manuf. Technol. 2006, 28, 1237–1245. [Google Scholar] [CrossRef]
  11. Reddy, J.N. An Introduction to Continuum Mechanics, 2nd ed.; Cambridge University Press: New York, NY, USA, 2006; pp. 1–449. ISBN 978-1-107-02543-1. [Google Scholar]
  12. Karande, P.; Chakraborty, S. Material handling Equipment Selection Using Weighted Utility Additive Theory. J. Ind. Eng. 2013, 2013, 268708. [Google Scholar] [CrossRef]
  13. Sproles, N. The difficult problem of establishing measures of effectiveness for command and control: A systems engineering perspective. Syst. Eng. 2001, 4, 145–155. [Google Scholar] [CrossRef]
  14. FAA. NAS System Engineering Manual Version 3.1 Section 4.6. Federal Aviation Authority (FAA). 3.1. June 2006, pp. 1–20. Available online: https://web.archive.org/web/20080916144301/http://www.faa.gov/about/office%5Forg/headquarters%5Foffices/ato/service%5Funits/operations/sysengsaf/seman/SEM3.1/Section%204.6.pdf (accessed on 25 March 2025).
  15. NASA; Hirshorn, S.R.; Voss, L.D.; Bromley, L.K. Nasa Systems Engineering Handbook, 6th ed.; National Aeronautics and Space Administration (NASA): Washington, DC, USA, 2017; pp. 1–297. Available online: https://web.archive.org/web/20240207045729/https://www.nasa.gov/wp-content/uploads/2018/09/nasa_systems_engineering_handbook_0.pdf (accessed on 25 March 2025).
  16. Taylor, B.W. Introduction to Management Science, 13th ed.; Pearson: London, UK, 2019; pp. 1–836. ISBN 9780137503933. Available online: https://web.archive.org/web/20230312185505/https://www.pearson.com/en-us/subject-catalog/p/introduction-tomanagement-science/P200000006423/9780137503933 (accessed on 25 March 2025).
  17. Portner, B.; Crabtree, B.; Kern, J. SMC Systems Engineering Primer & Handbook—Concepts, Processes, and Techniques, 2nd ed.; Space & Missile Systems Center U.S. AirForce: El Segundo, CA, USA, 2004; pp. 1–262. Available online: https://web.archive.org/web/20240630224910/https://www.acqnotes.com/Attachments/SMC%20System%20Engineering%20Handbook.pdf (accessed on 25 March 2025).
  18. FAA. Part 107 Airspace Authorizations—How to Request a Part 107 Airspace Authorizations; Technical Report; Federal Aviation Administration (FAA). Available online: https://web.archive.org/web/20221123205841/http://web.archive.org/screenshot/https://www.faa.gov/uas/commercial_operators/part_107_airspace_authorizations (accessed on 25 March 2025).
  19. Olanipekun, O.A.; Montalvo, C.J.; Walker, S.; Wade, J.T.; Lohar, B.R. An Advanced Air Mobility Post–Disaster Response System—An Exemplar SysML Model; Springer Nature: Berlin/Heidelberg, Germany, 2025. [Google Scholar]
  20. Katie, B.; Coast Guard. Coast Guard Height and Weight Requirements. July 2023. Available online: https://web.archive.org/web/20240219043642/https://www.operationmilitarykids.org/coast-guard-height-and-weight-requirements/ (accessed on 30 July 2023).
  21. International Maritime Organization (IMO). Regulation 23—Rescue Boats. August 2024. Available online: https://web.archive.org/web/20240831204949/https://www.imorules.com/GUID-CFD93744-4BAA-4C9A-92F2-D223E93A9577.html (accessed on 25 March 2025).
  22. Patterson, M.D.; Antcliff, K.R.; Kohlman, L.W. A Proposed Approach to Studying Urban Air Mobility Missions Including an Initial Exploration of Mission Requirements. In Proceedings of the AHS International 74th Annual Forum & Technology Display, Pheonix, AZ, USA, 14–17 May 2018; pp. 1–19. Available online: https://web.archive.org/web/20230326200349/https://ntrs.nasa.gov/citations/20190000991 (accessed on 25 March 2025).
  23. BBC. Rescue Drone Trial Hopes to Save Lives at Sea—BBC News. November 2022. Available online: https://web.archive.org/web/20221107181554/https://www.youtube.com/watch?v=hVMrz0fw4MM (accessed on 22 November 2022).
  24. Naval Helicopter Association Historical Society. HH-60 J Jayhawks. March 2025. Available online: https://web.archive.org/web/20240705042238/https://www.nhahistoricalsociety.org/coast-guard-hh-60j-jayhawk-helicopter/ (accessed on 25 March 2025).
  25. United States Coast Guard (USCG). Medium Range Surveillance Aircraft. March 2010. Available online: https://web.archive.org/web/20101201015024/http://uscg.mil/acquisition/mrs/features.asp (accessed on 25 March 2025).
  26. Robot Platform. Aquatic Robots. August 2012. Available online: https://web.archive.org/web/20191223003911/https://www.robotplatform.com/knowledge/Classification_of_Robots/aquatic_robots.html (accessed on 22 November 2022).
  27. BBC. Surviving Hurricane Ian: ‘You Have to Swim or Drown’. September 2022. Available online: https://web.archive.org/web/20221020172248/https://www.bbc.com/news/av/world-us-canada-63082360 (accessed on 22 November 2022).
Figure 1. Flow chart describing the Monte Carlo–analytical hierarchical hybrid process (MC–AHHP) developed for the MOE analysis of the proposed AAMPDR system.
Systems 13 00512 g001
Figure 2. The payload weight capacity requirement block for the AAMPDR System.
Systems 13 00512 g002
Figure 3. The parametric diagram for the measures of effectiveness (MOE) of the AAMPDR system as implemented on Cameo Magic Systems.
Systems 13 00512 g003
Figure 4. The model organization of the AAMPDR system SysML artifacts as implemented on Cameo Magic Systems.
Systems 13 00512 g004
Figure 5. Pugh matrix comparing alternative concept solutions depending on how they satisfy stakeholder requirements.
Systems 13 00512 g005
Figure 6. (Cont’d) Pugh matrix comparing alternative concept solutions depending on how they satisfy stakeholder requirements.
Systems 13 00512 g006
Figure 7. Graph showing the distribution of averages with respect to each parameter for the SAR AAM alternative, obtained using Monte Carlo.
Systems 13 00512 g007
Figure 8. Graph showing the distribution of averages with respect to each parameter for the SAR boat alternative, obtained using Monte Carlo.
Systems 13 00512 g008
Figure 9. Graph showing the distribution of averages with respect to each parameter for the SAR swimmer alternative, obtained using Monte Carlo.
Systems 13 00512 g009
Figure 10. Graph showing the score of alternatives for the AAMPDR system using the MC–AHHP.
Systems 13 00512 g010
Table 1. The 9-point standard preference level for the AHP [16].
Standard Preference LevelIndex
Equally preferred1
Equally to moderately preferred2
Moderately preferred3
Moderately to strongly preferred4
Strongly preferred5
Strongly to very strongly preferred6
Very strongly preferred7
Very strongly to extremely preferred8
Extremely preferred9
Table 2. A generalized pairwise comparison for each criterion and decision alternative.
Concept Selection
Candidates123…n
1 x 11 x 12 x 13 x 1 n
2 x 21 x 22 x 23 x 2 n
3 x 31 x 32 x 33 x 3 n
n x n 1 x n 2 x n 3 x n n
Table 3. Value of RI for each corresponding number of criteria, n.
n2345678910
RI00.580.901.121.241.321.411.451.51
Table 4. Specific pairwise comparisons for each criterion and decision alternative.
Concept Selection
CandidatesSASBSS
SA11/87
SB819
SS1/71/91
Disclaimer/Publisher’s Note: The statements, opinions and data contained in all publications are solely those of the individual author(s) and contributor(s) and not of MDPI and/or the editor(s). MDPI and/or the editor(s) disclaim responsibility for any injury to people or property resulting from any ideas, methods, instructions or products referred to in the content.

