

A Study on the Evolution Game of Multi-Subject Knowledge Sharing Behavior in Open Innovation Ecosystems


Abstract
1. Introduction
2. Related Work
2.1. Open Innovation Ecosystems
2.2. Knowledge Sharing Behavior in Open Innovation Ecosystems
2.3. Evolutionary Games and the Lotka–Volterra Model
2.4. Review
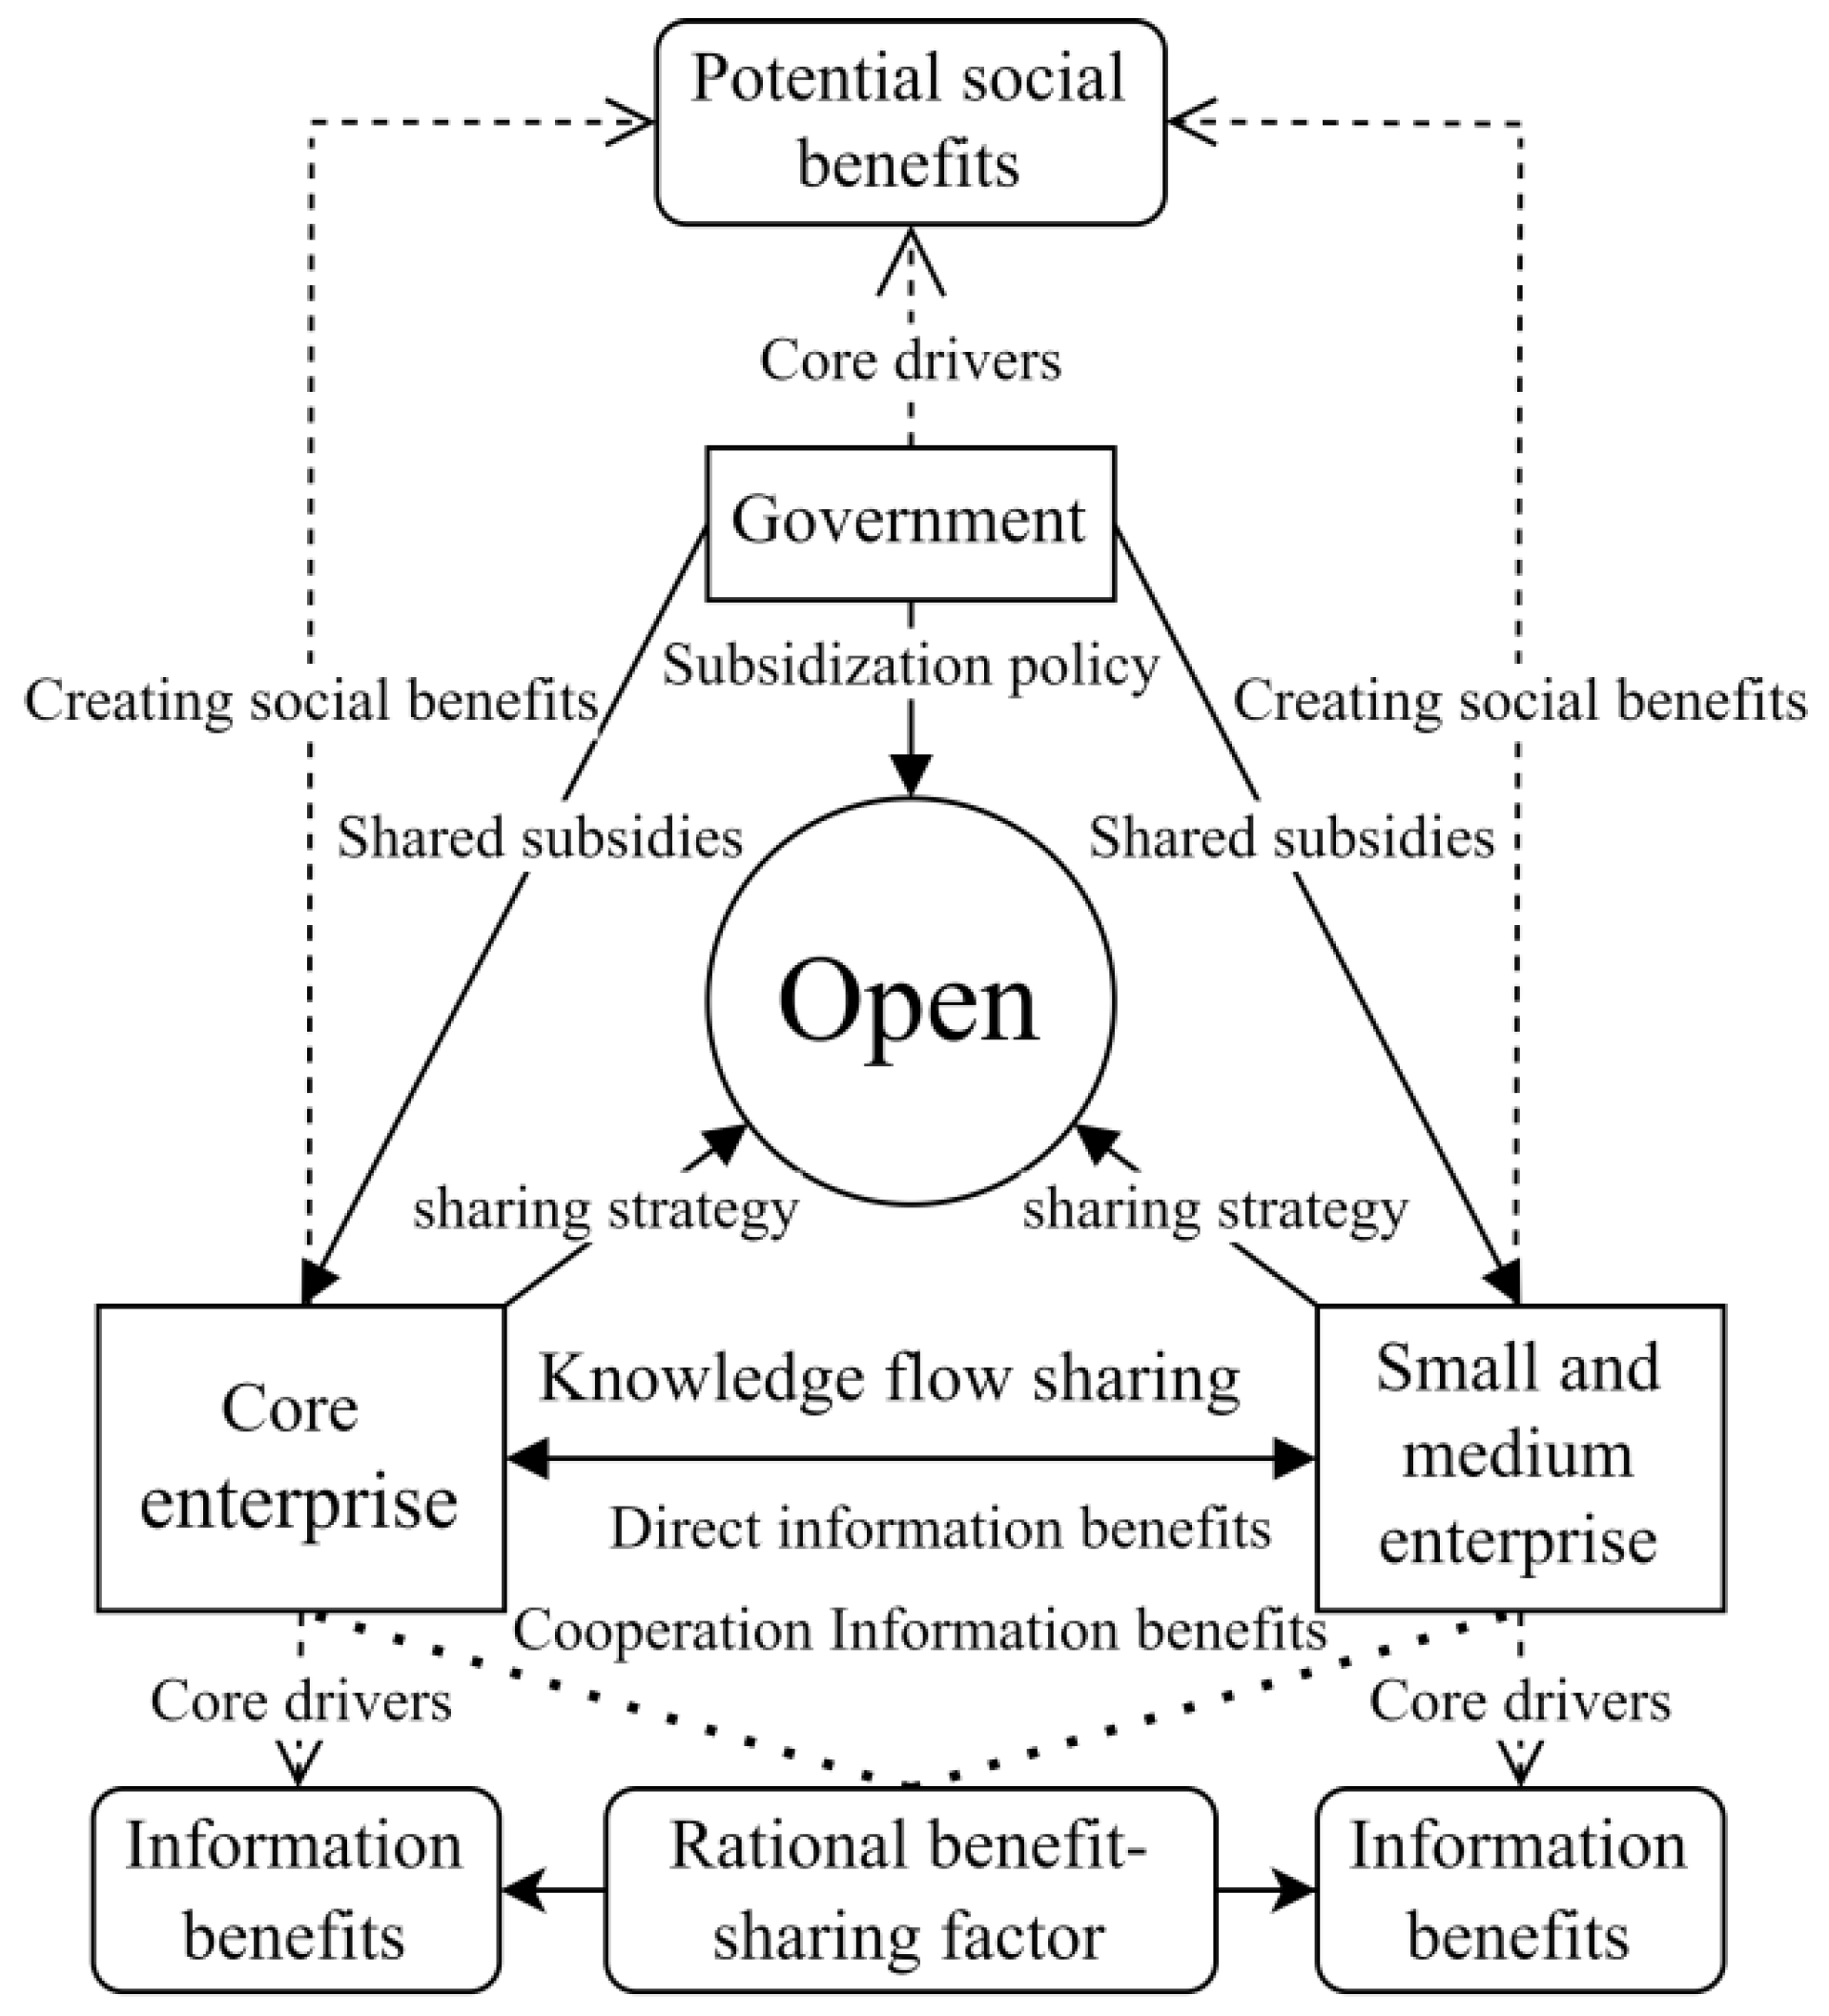
3. Model
3.1. Research Hypotheses and Parameterization
3.2. Model Building
4. The Construction of a Three-Party Evolutionary Game Model
4.1. Game Payoff Matrix Construction
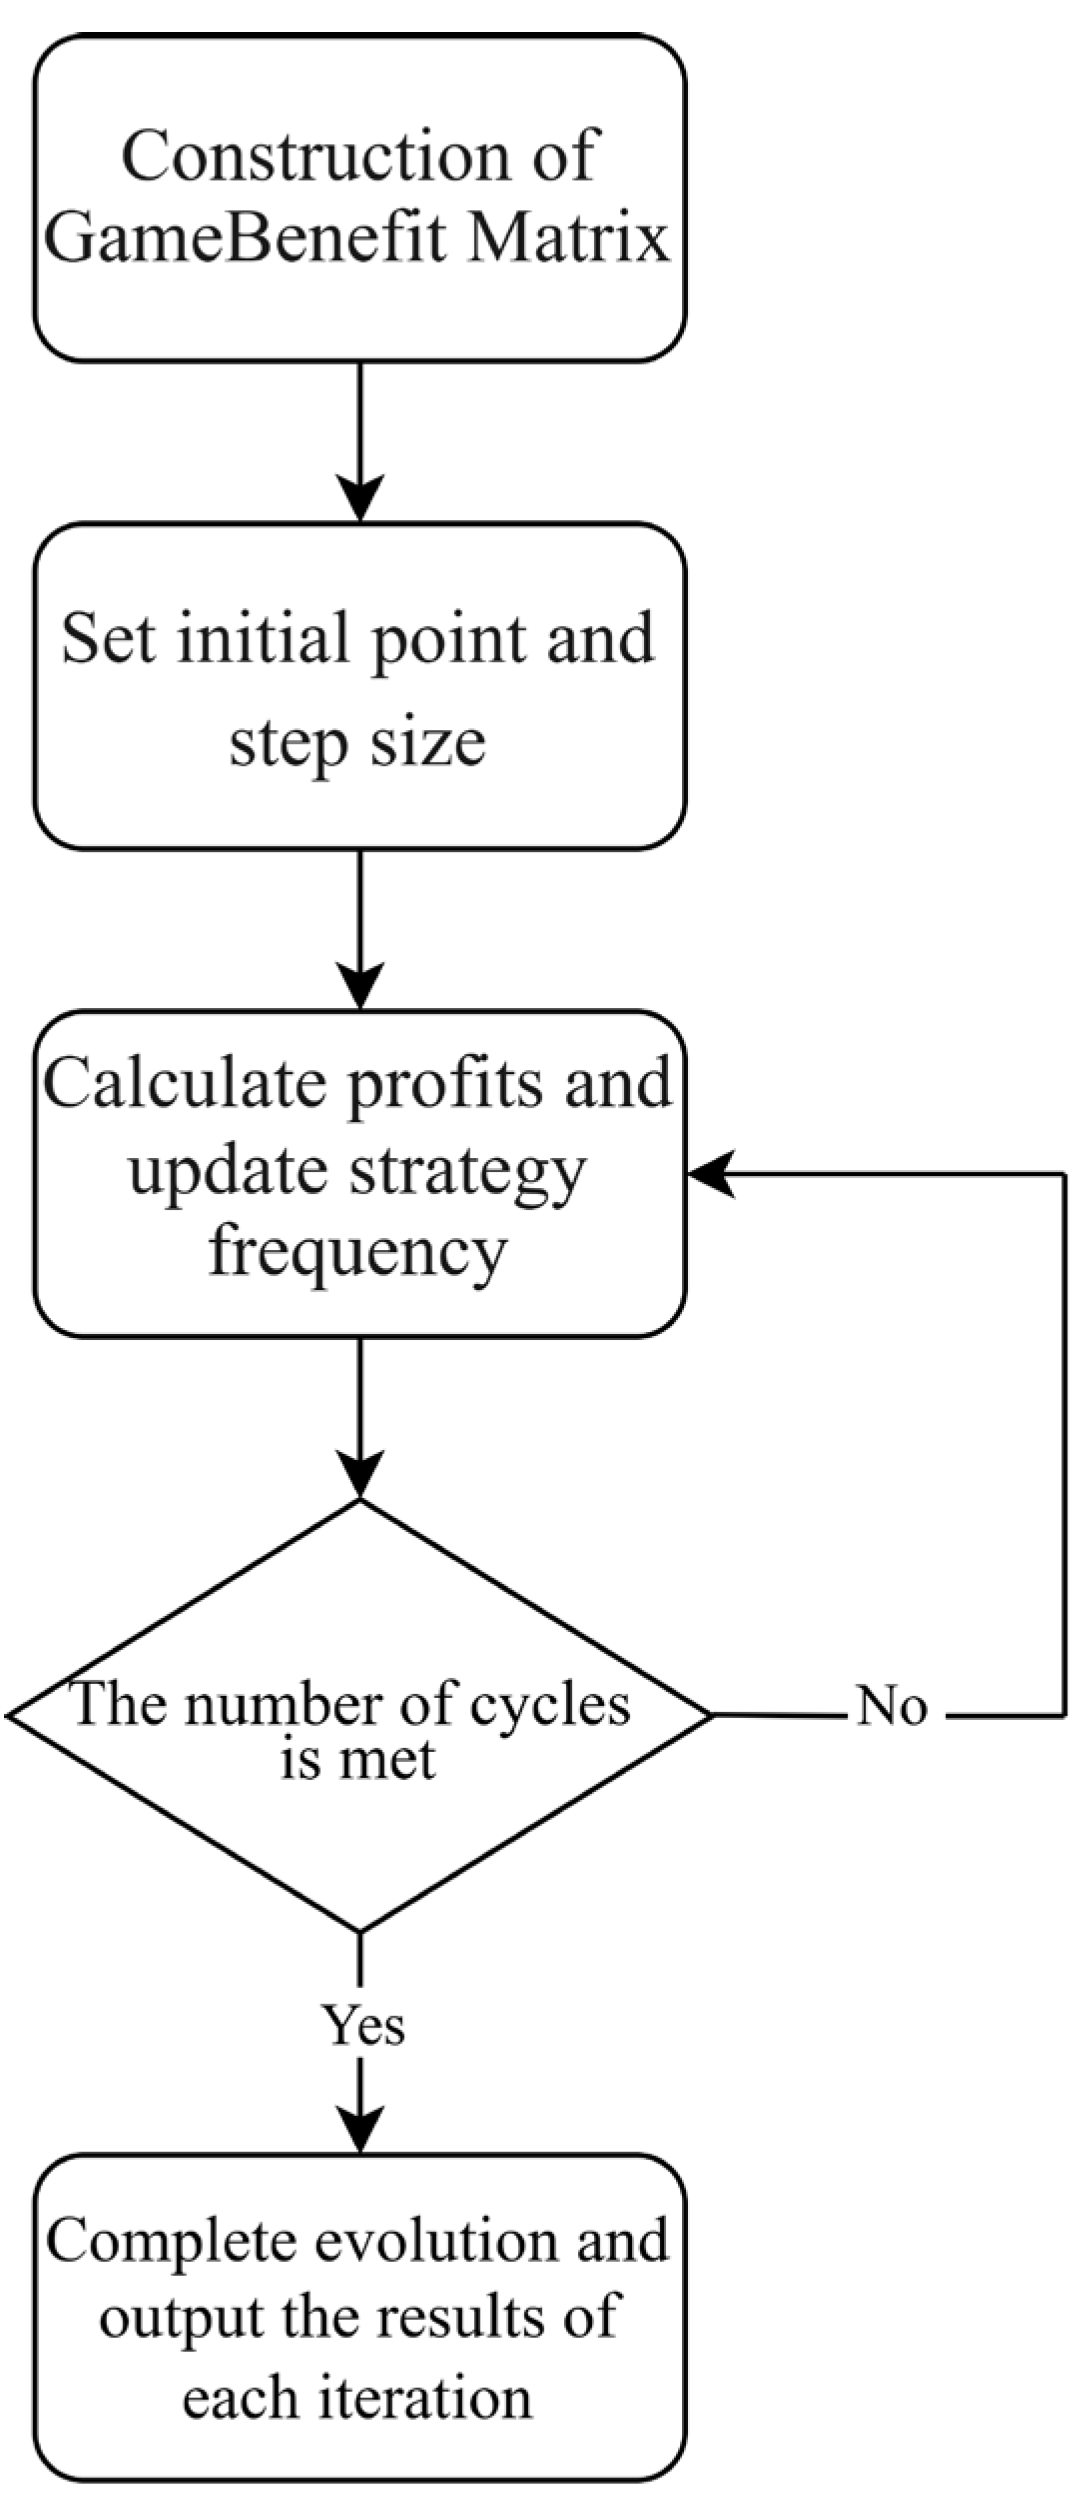
4.2. Model Building for Solving
4.3. Analysis of Equilibrium Strategies in Evolutionary Game Models
5. Numerical Simulation of Evolutionary Game Models
5.1. Case Selection and Parameter Setting
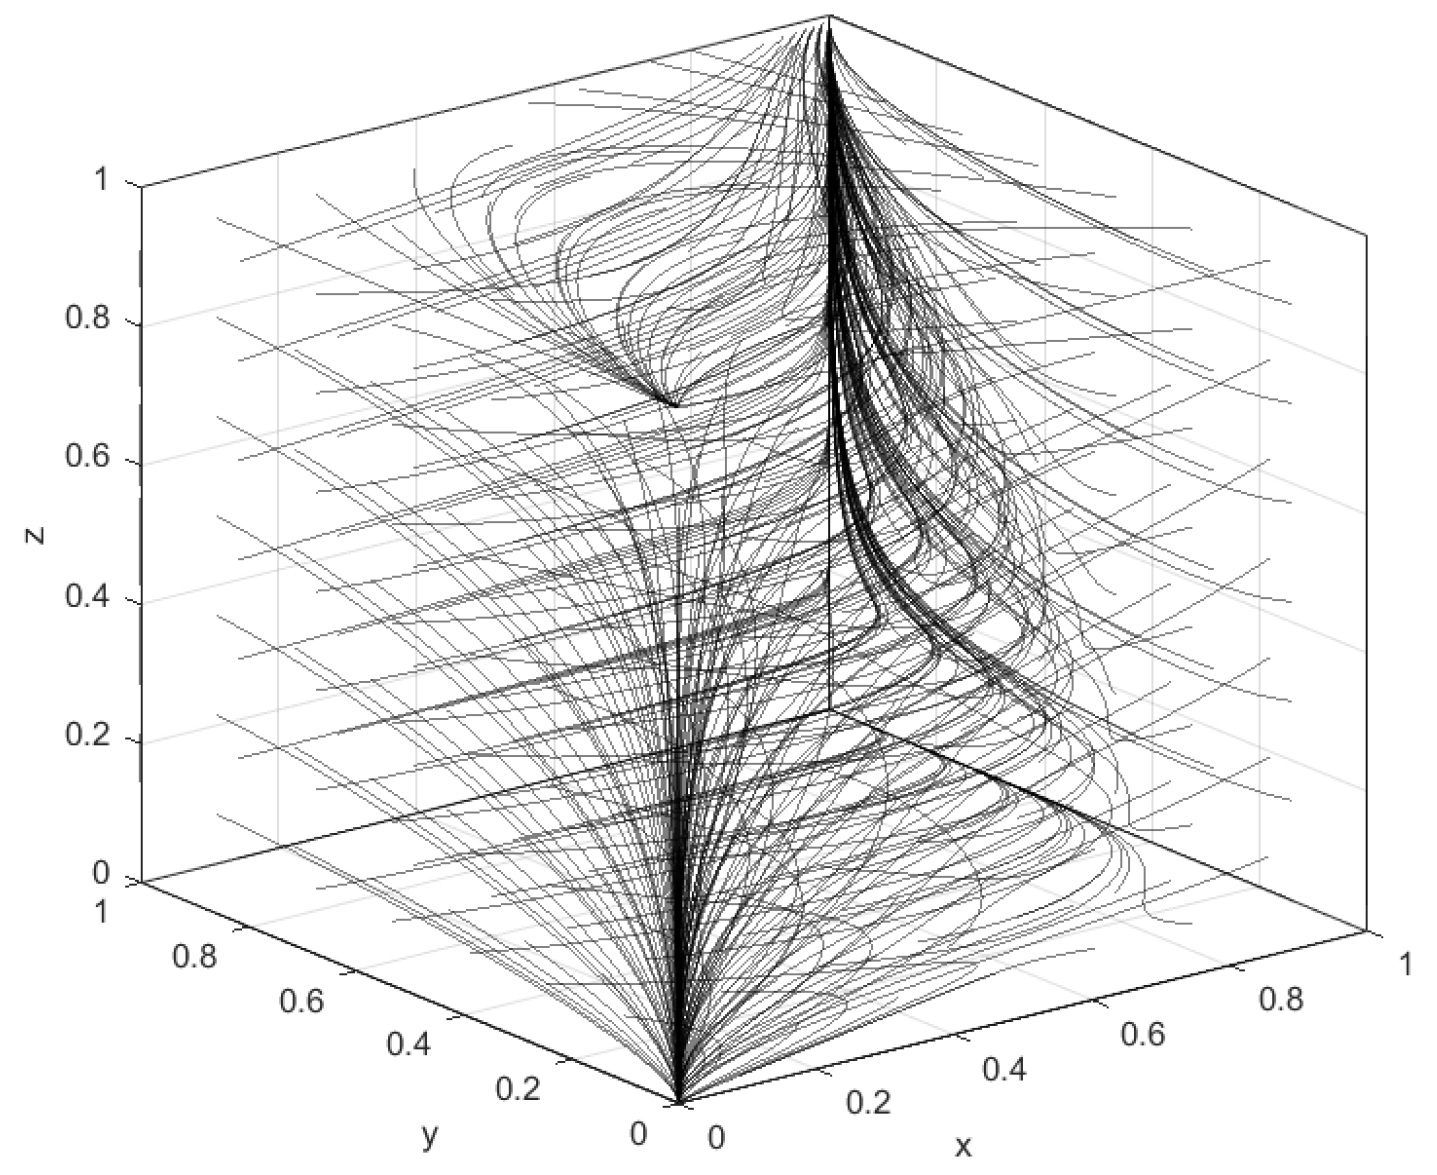
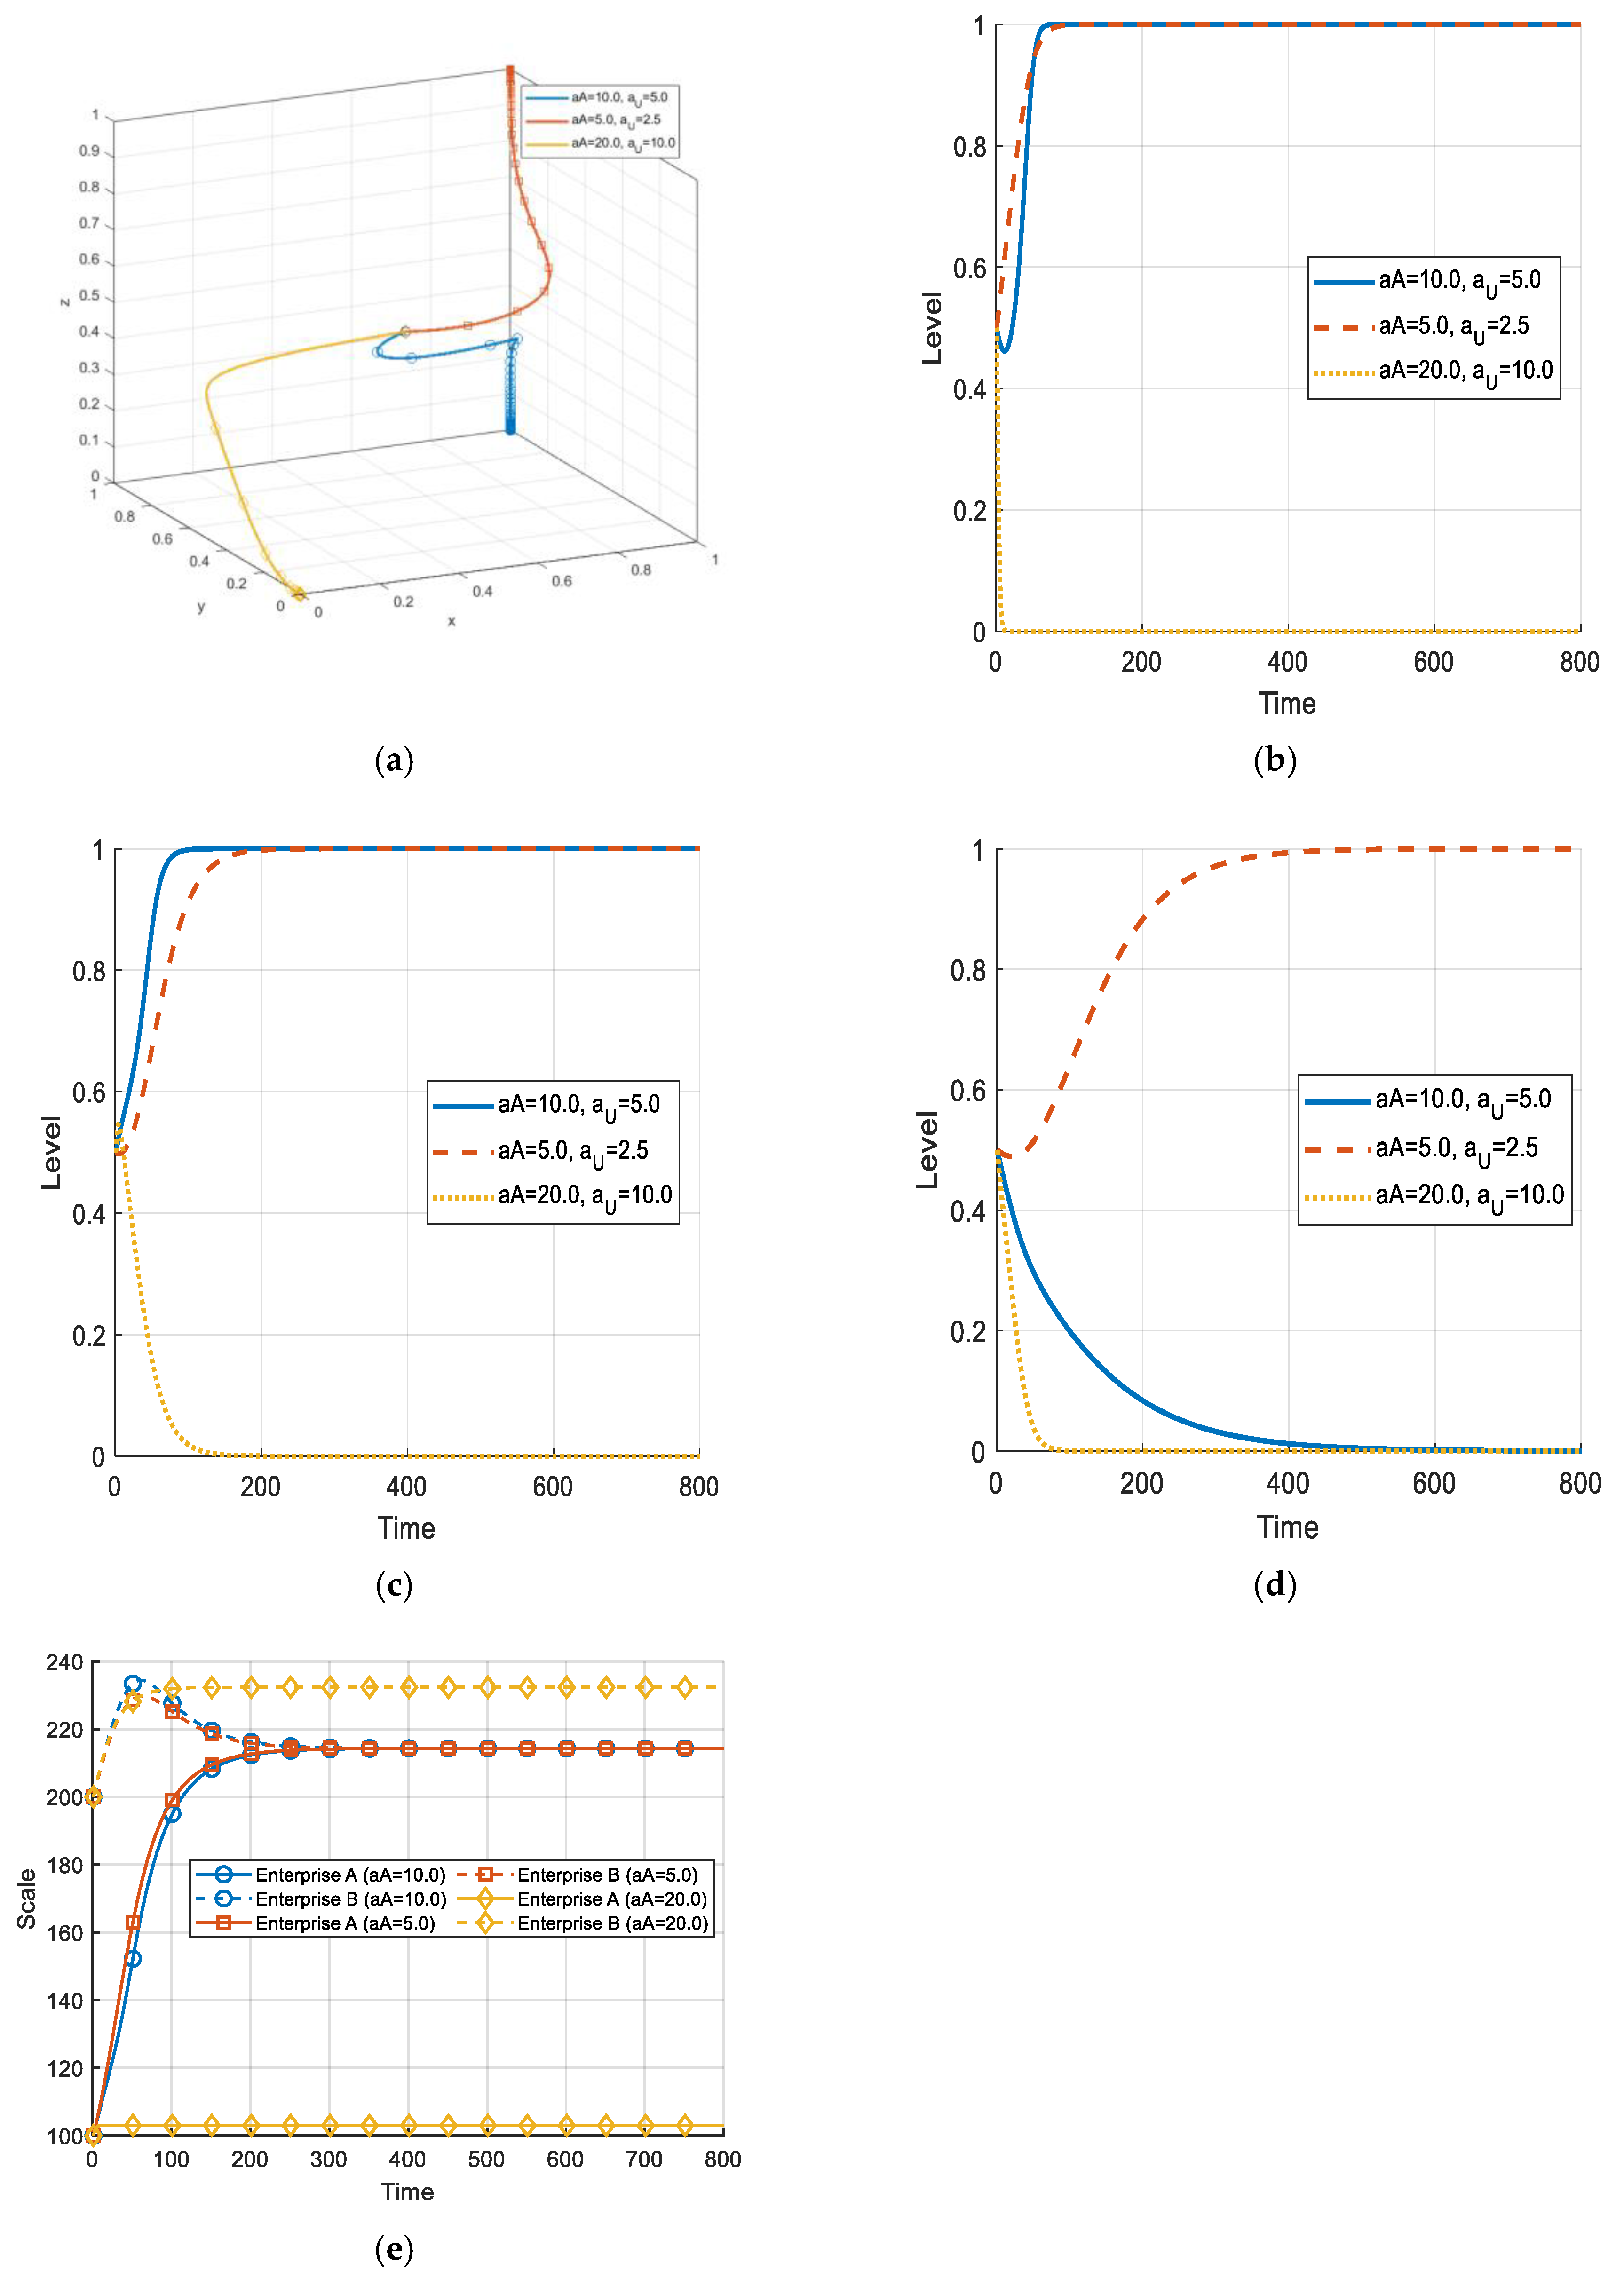
5.2. Initial Strategy Simulation Analysis
5.3. Sensitivity Analysis
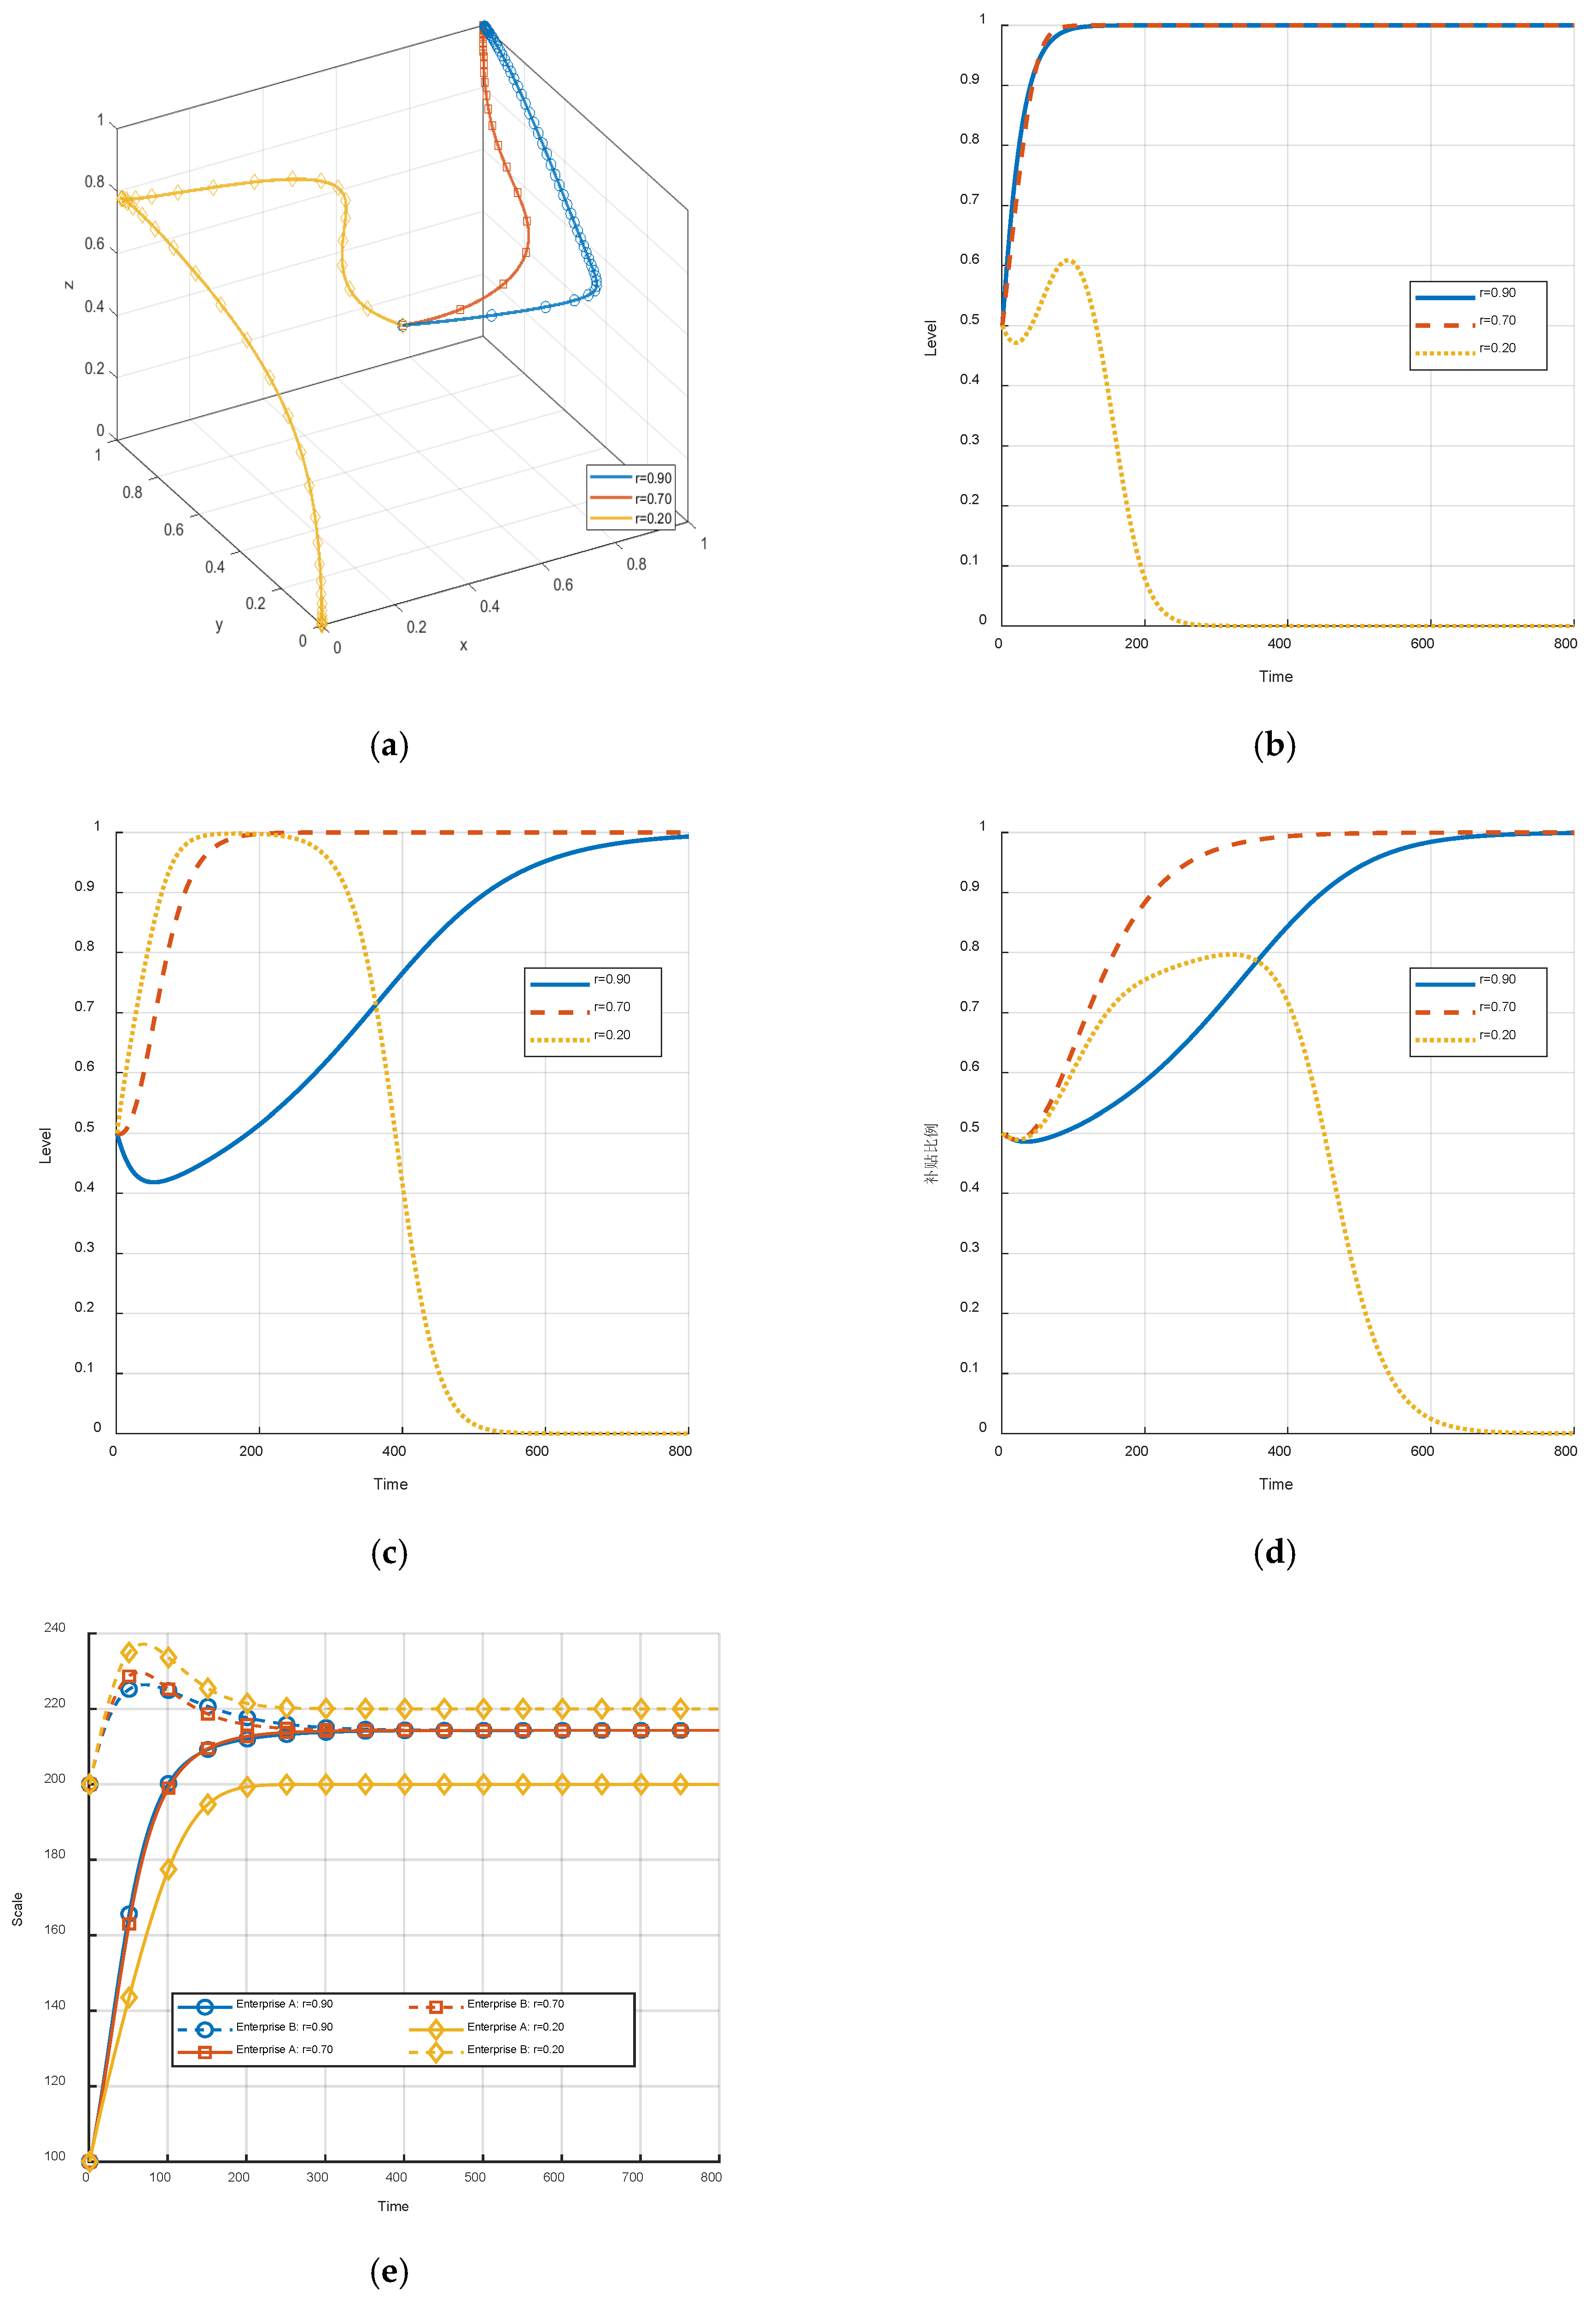
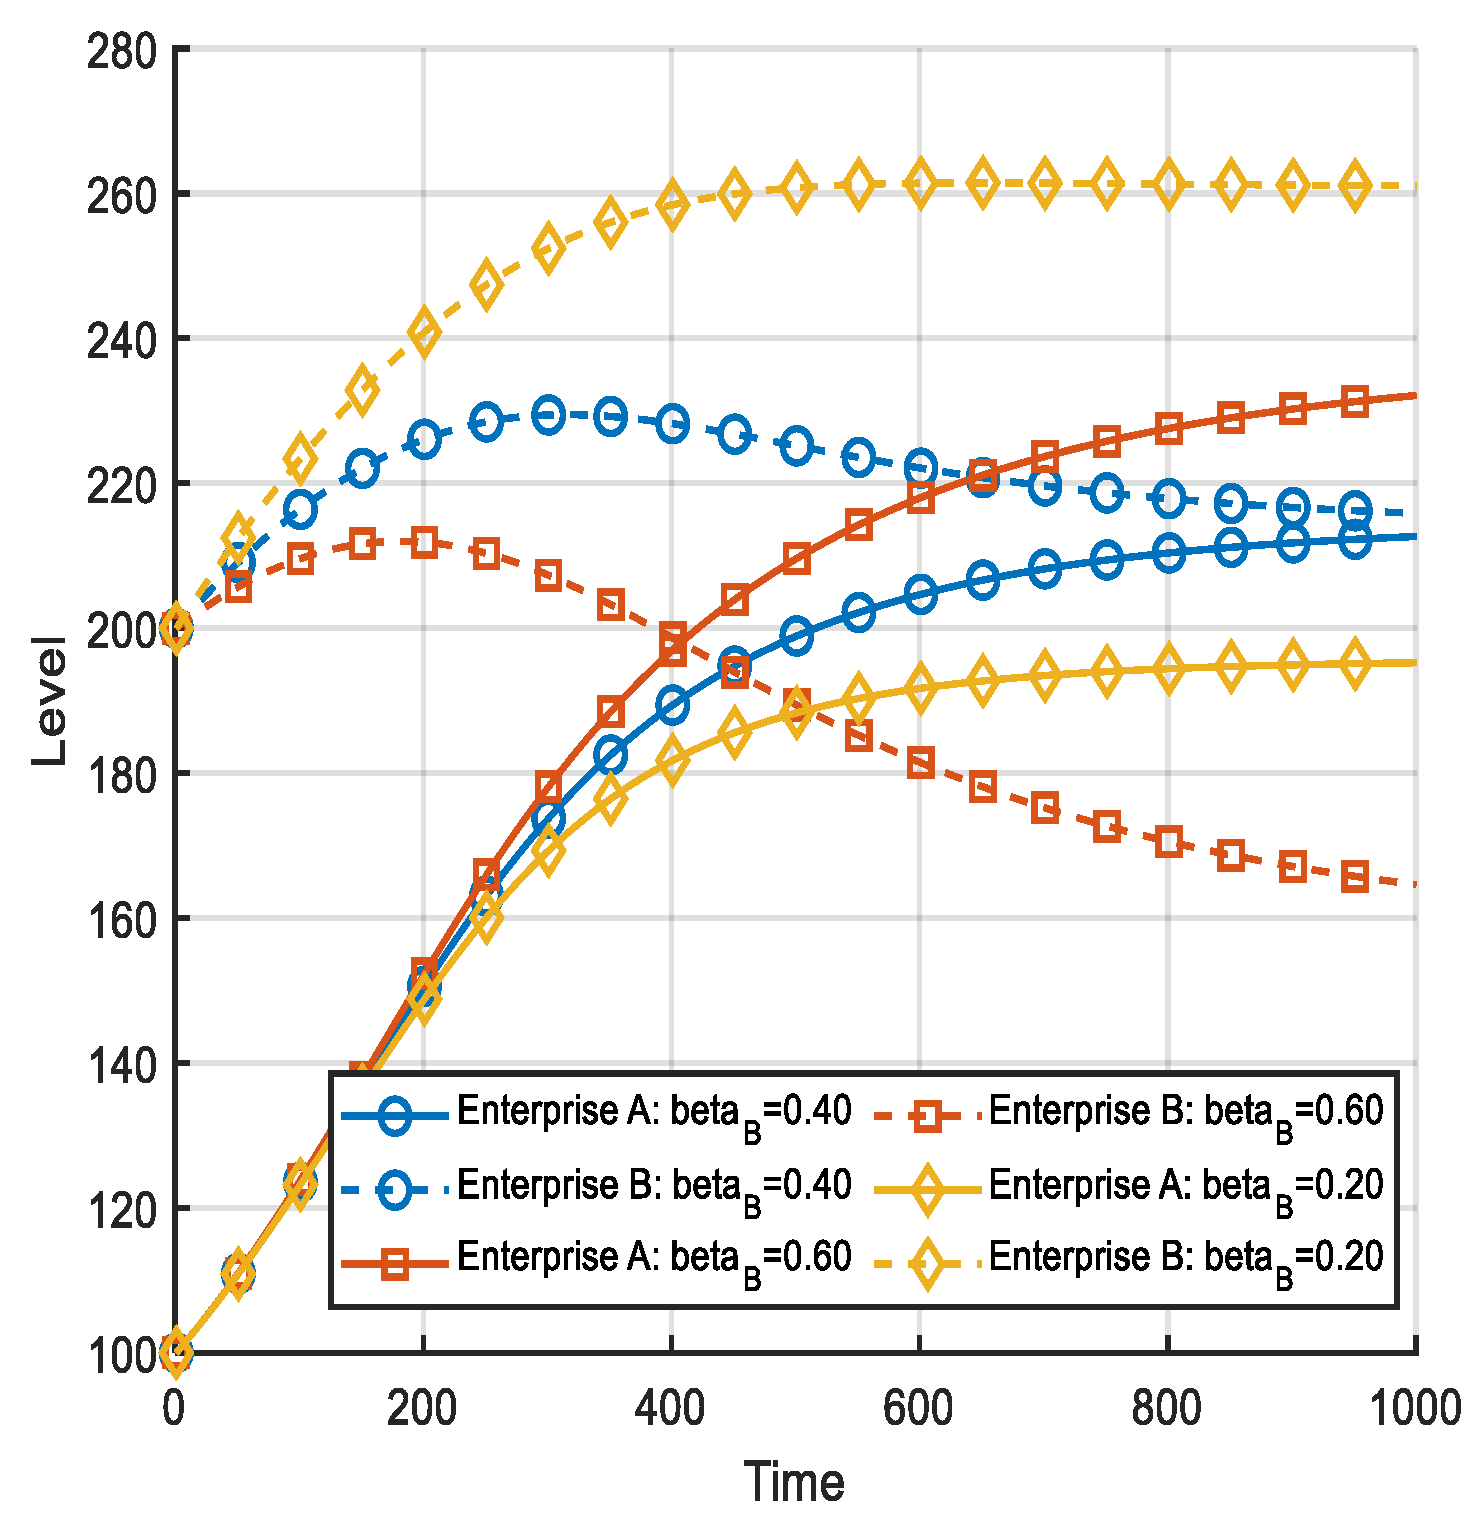
5.3.1. The Effect of Gain Sharing Coefficients on the Evolution of Knowledge Sharing Behavior
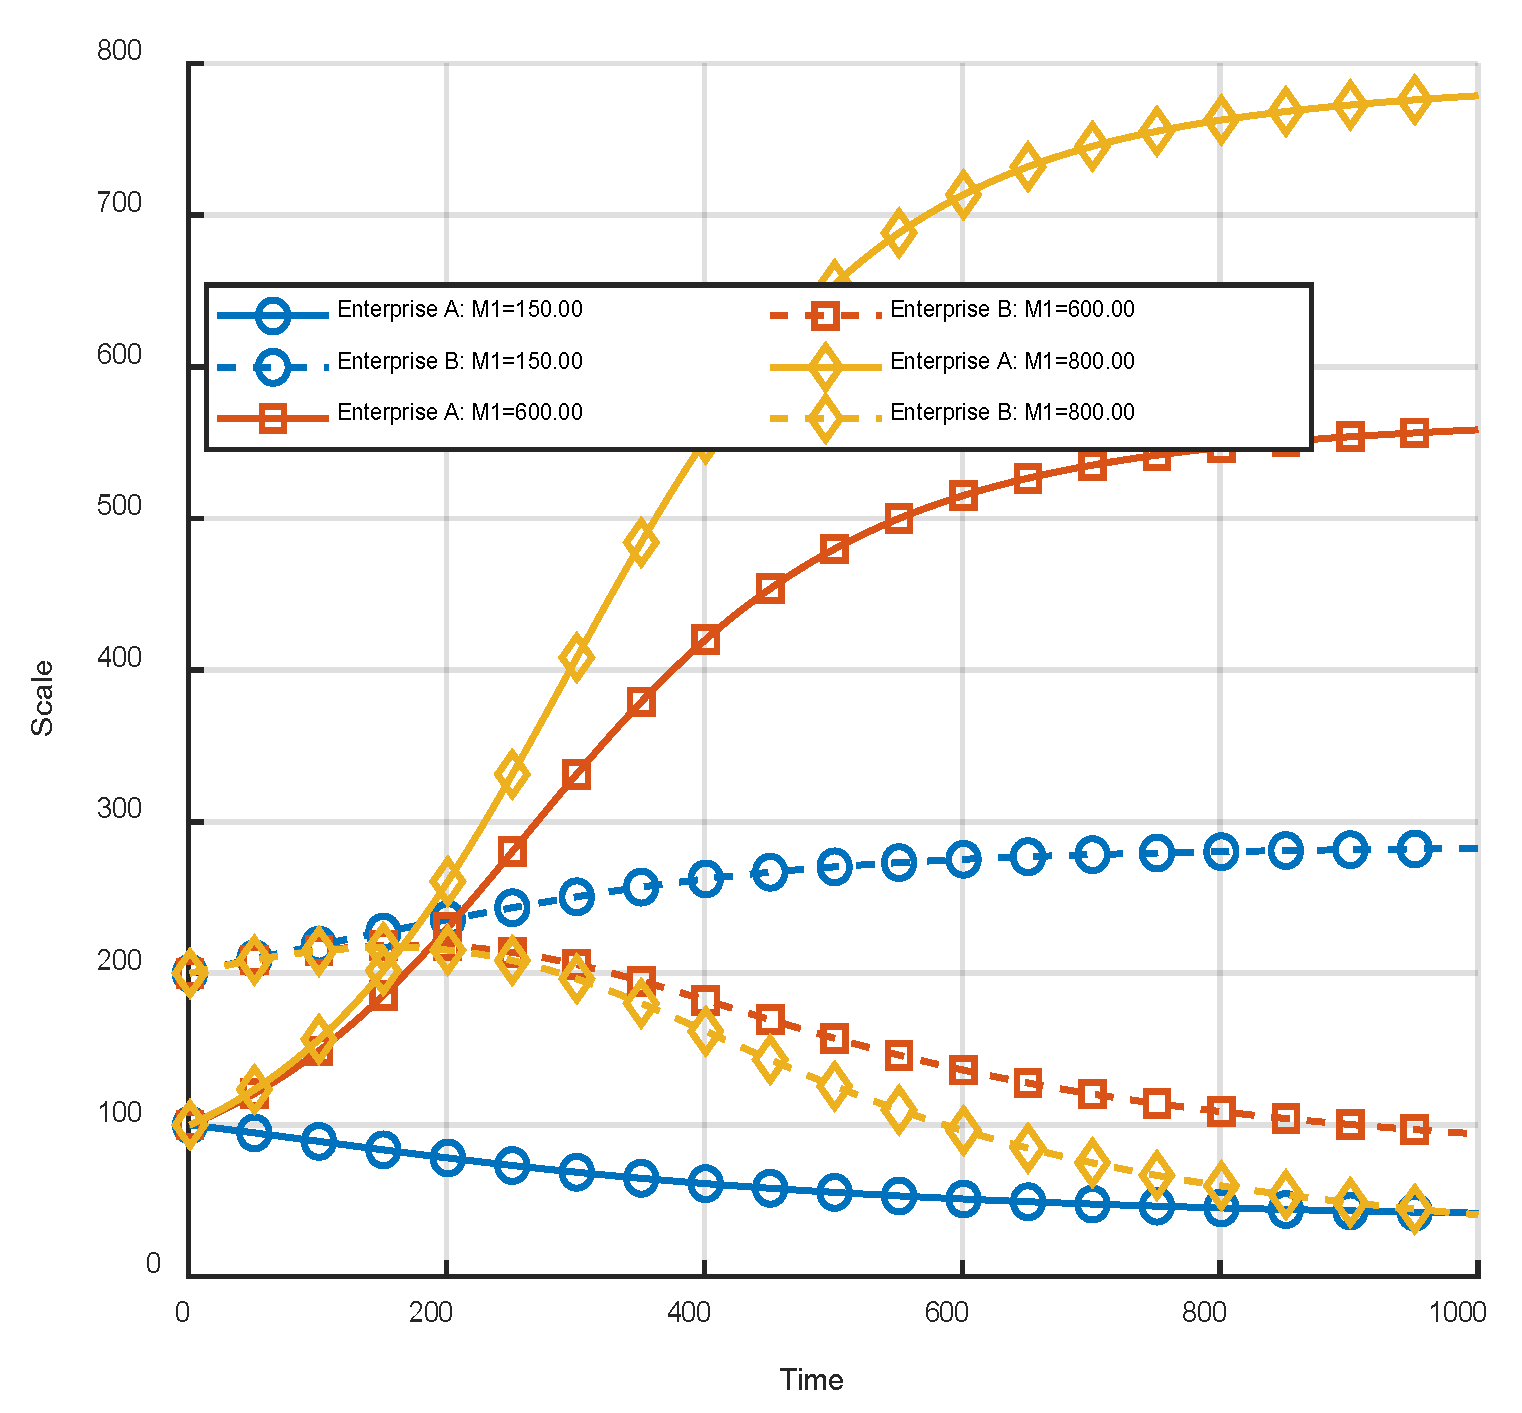
5.3.2. The Impact of Knowledge Inventory on the Evolution of Sharing Behavior
5.3.3. The Impact of Environmental Accommodation on the Evolution of Firms’ Sharing Behavior
5.3.4. The Effect of the Competition Coefficient on the Evolution of Sharing Behavior of Firms
6. Conclusions
Author Contributions
Funding
Data Availability Statement
Acknowledgments
Conflicts of Interest
References
- Kiseleva, O.N.; Sysoeva, O.V.; Vasina, A.V.; Sysoev, V.V. Updating the Open Innovation Concept Based on Ecosystem Approach: Regional Aspects. J. Open Innov. Technol. Mark. Complex. 2022, 8, 103. [Google Scholar] [CrossRef]
- Fang, S.; Qin, Y. Social Identification in Open Innovation Projects: Role of Knowledge Collaboration and Resource Interdependence. Systems 2025, 13, 129. [Google Scholar] [CrossRef]
- Camilleri, M.A.; Troise, C.; Strazzullo, S.; Bresciani, S. Creating Shared Value through Open Innovation Approaches: Opportunities and Challenges for Corporate Sustainability. Bus. Strat. Environ. 2023, 32, 4485–4502. [Google Scholar] [CrossRef]
- Xie, X.; Han, Y.; Dai, M. Study on Symbiotic Relationships and Evolution Mechanisms of Population in Open Innovation Ecosystem. Keji Jinbu Yu Duice 2022, 39, 85–95. [Google Scholar]
- Oliver, A.L.; Rittblat, R. Facilitating Innovation for Complex Societal Challenges: Creating Communities and Innovation Ecosystems for SDG Goal of Forming Partnerships. Sustainability 2023, 15, 9666. [Google Scholar] [CrossRef]
- Traitler, H.; Watzke, H.J.; Saguy, I.S. Reinventing R&D in an Open Innovation Ecosystem. J. Food Sci. 2011, 76, R62–R68. [Google Scholar] [CrossRef]
- Lin, Y.; Zhang, H. Micro Mechanisms and Values of Open Innovation Ecosystem Evolution. Yanjiu Yu Fazhan Guanli 2020, 32, 133–143. [Google Scholar] [CrossRef]
- Mirghaderi, S.A.; Sheikh Aboumasoudi, A.; Amindoust, A. Developing an Open Innovation Model in the Startup Ecosystem Industries Based on the Attitude of Organizational Resilience and Blue Ocean Strategy. Comput. Ind. Eng. 2023, 181, 109301. [Google Scholar] [CrossRef]
- Borgh, M.; Cloodt, M.; Romme, A.G.L. Value Creation by Knowledge-based Ecosystems: Evidence from a Field Study. R&D Manag. 2012, 42, 150–169. [Google Scholar]
- Cricchio, J.; Barabuffi, S.; Crupi, A.; Di Minin, A. China’s New Knowledge Brokers: A Patent Citations Network Analysis of the Artificial Intelligence Open Innovation Ecosystem. J. Eng. Technol. Manag. 2025, 76, 101870. [Google Scholar] [CrossRef]
- McGahan, A.M.; Bogers, M.L.A.M.; Chesbrough, H.; Holgersson, M. Tackling Societal Challenges with Open Innovation. Calif. Manag. Rev. 2020, 63, 49–61. [Google Scholar] [CrossRef]
- Peng, X.; Wang, F.; Wang, J.; Qian, C. Research on Food Safety Control Based on Evolutionary Game Method from the Perspective of the Food Supply Chain. Sustainability 2022, 14, 8122. [Google Scholar] [CrossRef]
- Huang, M.; Li, L. Impact of Non-economic Benefit Distribution Model of Innovation Subject on Project Process Performance: Mediating Effect Based on Project Culture. Guanli Pinglun 2023, 35, 84–95. [Google Scholar] [CrossRef]
- Yuan, Q.; Wen, K. Evolutionary Game and Dynamic Simulation Study of Innovation Ecosystem Open Sharing Relationship. Hehai Daxue Xuebao (Zhexue Shehui Kexue Ban) 2022, 24, 100–108+112. [Google Scholar]
- Alam, M.A.; Rooney, D.; Taylor, M. From Ego-systems to Open Innovation Ecosystems: A Process Model of Inter-firm Openness. J. Prod. Innov. Manag. 2022, 39, 177–201. [Google Scholar] [CrossRef]
- Xie, X.; Wang, H.; Yu, S. Influence Mechanism of Open Innovation Ecosystem Network Structure on Value Co-creation. Guanli Kexue Xuebao 2024, 27, 133–158. [Google Scholar] [CrossRef]
- Xie, X.; Wang, H. How to Bridge the Gap between Innovation Niches and Exploratory and Exploitative Innovations in Open Innovation Ecosystems. J. Bus. Res. 2021, 124, 299–311. [Google Scholar] [CrossRef]
- Cao, Y.; Ren, S.; Du, M. Building a Globally Competitive Open Innovation Ecosystem. Kexue Xue Yanjiu 2024, 42, 1979–1987. [Google Scholar] [CrossRef]
- Oliveira-Duarte, L.; Reis, D.A.; Fleury, A.L.; Vasques, R.A.; Fonseca Filho, H.; Koria, M.; Baruque-Ramos, J. Innovation Ecosystem Framework Directed to Sustainable Development Goal #17 Partnerships Implementation. Sustain. Dev. 2021, 29, 1181–1195. [Google Scholar] [CrossRef]
- Randhawa, K.; West, J.; Skellern, K.; Josserand, E. Evolving a Value Chain to an Open Innovation Ecosystem: Cognitive Engagement of Stakeholders in Customizing Medical Implants. Calif. Manag. Rev. 2021, 63, 101–134. [Google Scholar] [CrossRef]
- West, J.; Gallagher, S. Challenges of Open Innovation: The Paradox of Firm Investment in Open-Source Software. R&D Manag. 2006, 36, 319–331. [Google Scholar] [CrossRef]
- Mei, L.; Zhang, T.; Chen, J. Exploring the Effects of Inter-firm Linkages on SMEs’ Open Innovation from an Ecosystem Perspective: An Empirical Study of Chinese Manufacturing SMEs. Technol. Forecast. Soc. Change 2019, 144, 118–128. [Google Scholar] [CrossRef]
- Radziwon, A.; Bogers, M. Open Innovation in SMEs: Exploring Inter-organizational Relationships in an Ecosystem. Technol. Forecast. Soc. Change 2018, 132, 80–93. [Google Scholar] [CrossRef]
- Costa, J.; Matias, J.C.O. Open Innovation 4.0 as an Enhancer of Sustainable Innovation Ecosystems. Sustainability 2020, 12, 8112. [Google Scholar] [CrossRef]
- Masucci, M.; Brusoni, S.; Cennamo, C. Removing Bottlenecks in Business Ecosystems: The Strategic Role of Outbound Open Innovation. Res. Policy 2020, 49, 103823. [Google Scholar] [CrossRef]
- Kim, S.L.; Cheong, M.; Srivastava, A.; Yoo, Y.; Yun, S. Knowledge Sharing and Creative Behavior: The Interaction Effects of Knowledge Sharing and Regulatory Focus on Creative Behavior. Hum. Perform. 2021, 34, 1–18. [Google Scholar] [CrossRef]
- Kmieciak, R. Trust, Knowledge Sharing, and Innovative Work Behavior: Empirical Evidence from Poland. Eur. J. Innov. Manag. 2020, 24, 1832–1859. [Google Scholar] [CrossRef]
- Bogers, M.; Zobel, A.K.; Afuah, A.; Almirall, E.; Brunswicker, S.; Dahlander, L.; Ter Wal, A.L.J. The Open Innovation Research Landscape: Established Perspectives and Emerging Themes across Different Levels of Analysis. Ind. Innov. 2017, 24, 8–40. [Google Scholar] [CrossRef]
- Öberg, C.; Alexander, A.T. The openness of open innovation in ecosystems—Integrating innovation and management literature on knowledge linkages. J. Innov. Knowl. 2018, 3, 1–10. [Google Scholar] [CrossRef]
- Ferreira, J.J.; Teixeira, A.A.C. Open Innovation and Knowledge for Fostering Business Ecosystems. J. Innov. Knowl. 2018, 4, 253–255. [Google Scholar] [CrossRef]
- Wang, W. Current Status and Prospects of Evolutionary Game Theory Research. Tongji Yu Juece 2009, 3, 158–161. [Google Scholar]
- Xiao, H.; Yu, F.; Tang, H.; Peng, D.; Zhou, J. Research on the evolutionary game of collaborative innovation among government, industry, academia, research, and finance in low-carbon and environmentally friendly technologies. Oper. Res. Manag. 2021, 30, 39–46. [Google Scholar]
- Yang, X.; Pan, L.; Song, A.; Ma, X.; Yang, J. Research on the Strategy of Knowledge Sharing among Logistics Enterprises under the Goal of Digital Transformation. Heliyon 2023, 9, e15191. [Google Scholar] [CrossRef]
- Wang, J.; Qin, Y.; Zhou, J. Incentive Policies for Prefabrication Implementation of Real Estate Enterprises: An Evolutionary Game Theory-Based Analysis. Energy Policy 2021, 156, 112434. [Google Scholar] [CrossRef]
- Shi, Y.; Wei, Z.; Shahbaz, M.; Zeng, Y. Exploring the Dynamics of Low-Carbon Technology Diffusion among Enterprises: An Evolutionary Game Model on a Two-Level Heterogeneous Social Network. Energy Econ. 2021, 101, 105399. [Google Scholar] [CrossRef]
- Xiao, H.; Peng, D.; Wang, H. Research on the International Transfer Game of Low Carbon Environmentally Friendly Technologies under Asymmetric Psychological Pressure. Oper. Manag. 2020, 29, 36–43. [Google Scholar]
- Zhao, G.; Zhang, J. Evolutionary Game Research on Tacit Knowledge Sharing Behavior between Upstream and Downstream Enterprises in the Supply Chain Based on Knowledge Gradient. Juece Zixun 2025, 2, 88–96. [Google Scholar]
- Zhang, S.; Zhao, M.; Cai, Y. Analysis of Behavior Strategies of Scientific Data Open Sharing Subjects Based on Three-Party Evolutionary Game. Keji Guanli Yanjiu 2024, 44, 202–210. [Google Scholar]
- Mohammed, W.W.; Aly, E.S.; Matouk, A.E.; Albosaily, S.; Elabbasy, E.M. An Analytical Study of the Dynamic Behavior of Lotka-Volterra Based Models of COVID-19. Results Phys. 2021, 26, 104432. [Google Scholar] [CrossRef]
- Wang, Z.A.; Xu, J. On the Lotka–Volterra Competition System with Dynamical Resources and Density-Dependent Diffusion. J. Math. Biol. 2021, 82, 7. [Google Scholar] [CrossRef]
- Chen, H.; Wang, J.; Miao, Y. Evolutionary Game Analysis on the Selection of Green and Low Carbon Innovation between Manufacturing Enterprises. Alex. Eng. J. 2021, 60, 2139–2147. [Google Scholar] [CrossRef]
- Xu, L.; Di, Z.; Chen, J.; Shi, J.; Yang, C. Evolutionary Game Analysis on Behavior Strategies of Multiple Stakeholders in Maritime Shore Power System. Ocean Coast. Manag. 2021, 202, 105508. [Google Scholar] [CrossRef]
- Duan, W.; Li, C.; Hui, S. Research on Symbiotic Model of Crowdsourcing Space Ecosystem Based on Lotka-Volterra Model. Shenji Yu Jingji Yanjiu 2021, 36, 107–116. [Google Scholar]
- Yang, X.; Lian, Z.; Su, Y. Research on Symbiotic Model of Digital Economy and Real Economy Based on Lotka-Volterra Model. Xuexi Yu Tansuo 2024, 8, 126–135. [Google Scholar]
- Lu, Q.; Fang, H. Promoting Low-Carbon Development in Yangtze River Delta Area in China through the Lens of Decarbonization of Industrial Gas Producers: A Case Study Based on Evolutionary Game and Lotka-Volterra Models. Technol. Forecast. Soc. Change 2024, 207, 123594. [Google Scholar] [CrossRef]
- Li, T.; Zhang, Z. Research on Reverse Knowledge Spillover of Non-Core Enterprises: System Dynamics Analysis Based on Open Innovation Perspective. Jishu Jingji Yu Guanli Yanjiu 2020, 4, 3–11. [Google Scholar]
- Liu, C.; Yan, D.; Song, Z.; Shi, G.; Zhan, W.; Jiang, M. Patent Openness Decisions and Investment Propensities of Frontier Enterprises in Asymmetric Competition. Systems 2025, 13, 146. [Google Scholar] [CrossRef]
- Shang, S.; Zhang, Z. Evolutionary Game Analysis of Knowledge Sharing in Virtual Enterprises. Zhongguo Ruan Kexue 2015, 3, 150–157. [Google Scholar]
- Bacon, E.; Williams, M.D.; Davies, G.H. Recipes for Success: Conditions for Knowledge Transfer across Open Innovation Ecosystems. Int. J. Inf. Manag. 2019, 49, 377–387. [Google Scholar] [CrossRef]
- Wang, H.; Han, Y. Evolutionary Game Research on Knowledge Sharing in Cooperative Information Retrieval and Search. Tushu Qingbao Gongzuo 2018, 19, 1–6. [Google Scholar]
- Wang, J.; Cao, N.; Wang, Y.; Wang, Y. The Impact of Knowledge Power on Enterprise Breakthrough Innovation: From the Perspective of Boundary-Spanning Dual Search. Sustainability 2022, 14, 10980. [Google Scholar] [CrossRef]
- Kissan, J.; Alex, T. Monitoring and Incentives in Sales Organizations: An Agency-Theoretic Perspective. Market. Sci. 1998, 17, 107. [Google Scholar]
- Qiao, Y.; Zhang, Y.; Li, Y.; Xiao, J.; Xue, Y. How Old Industrial Base Cities Build Open Innovation Ecosystems to Break Industrial Lock-In: A Case Study of Shiyan, Hubei. Zhongguo Ruan Kexue 2024, 3, 109–118. [Google Scholar]
- Shi, T.; Han, F.; Chen, L.; Shi, J.; Xiao, H. Study on value Co-creation and evolution game of low-carbon technological innovation ecosystem. J. Clean. Prod. 2023, 414, 137720. [Google Scholar] [CrossRef]
- Xiao, H.; Guo, P. Research on the Evolutionary Game Theory of Knowledge Sharing in Cross organizational Project Cooperation Considering Knowledge Potential Difference. Sci. Technol. Manag. 2023, 44, 132–151. [Google Scholar]
- Lu, F.; Chang, D. Stability analysis of industry university research cooperation innovation based on evolutionary game theory. Sci. Technol. Manag. Res. 2015, 35, 100–105+114. [Google Scholar]


| Longitude | Parameters | Meanings |
|---|---|---|
| Core enterprise A | Knowledge stock of core enterprise A | |
| Amount of knowledge that does not overlap between core enterprises and SMEs | ||
| Knowledge absorption capacity of core enterprise A | ||
| Reputational damage when only core enterprise A is not shared | ||
| Knowledge structure of core enterprise A | ||
| Synergistic capacity of core enterprise A | ||
| Self-efficacy of core enterprise A | ||
| Knowledge sharing cost factor for core enterprise A | ||
| Revenue sharing coefficient created by knowledge sharing in core enterprise A | ||
| First mover advantage | ||
| Proportion of knowledge possessed by unit B that is available to unit A as percentage of total B | ||
| Size of current volume of core enterprise A | ||
| Environmental maximum capacity in presence of single core enterprise A | ||
| SME B | Knowledge stock of SME B | |
| Knowledge sharing and learning factor for SME B | ||
| Reputational damage when only core enterprise B is not shared | ||
| Knowledge structure of SME B | ||
| Synergistic capacity of SME B | ||
| Self-efficacy of SME B | ||
| Knowledge sharing cost factor for SME B | ||
| Revenue sharing coefficient created by knowledge sharing in SME B | ||
| Proportion of knowledge possessed by unit B that is available to unit A as percentage of total B | ||
| Existing volume size of SME B | ||
| Environmental maximum carrying capacity in presence of single SME B | ||
| Government G | Direct benefits to governments through, for example, corporate knowledge sharing behaviors | |
| Government subsidy coefficient based on knowledge stock | ||
| Potential benefits to society from knowledge sharing behaviors | ||
| Costs of implementing government strategies | ||
| Losses arising from decline in credibility of government |
| Core Enterprise | Small and Medium Enterprises | Government | |
|---|---|---|---|
| (share, share, subsidize) | |||
| (share, share, do not subsidize) | |||
| (share, do not share, subsidize) | |||
| (share, do not share, do not subsidize) | |||
| (do not share, share, subsidize) | |||
| (do not share, share, do not subsidize) | |||
| (do not share, do not share, subsidize) | 0 | ||
| (do not share, do not share, do not subsidize) | 0 |
| Balance Point | λ1 | λ2 | λ3 |
|---|---|---|---|
| E1(1,1,1) | |||
| E2(1,1,0) | |||
| E3(1,0,1) | |||
| E4(1,0,0) | |||
| E5(0,1,1) | |||
| E6(0,1,0) | |||
| E7(0,0,1) | |||
| E8(0,0,0) |
| Balance Point | Stability Conditions |
|---|---|
| E1(1,1,1) | , < 0, |
| E2(1,1,0) | , , |
| E3(1,0,1) | , |
| E4(1,0,0) | |
| E5(0,1,1) | |
| E6(0,1,0) | |
| E7(0,0,1) | |
| E8(0,0,0) |
| 5 | 2.5 | 0.6 | 0.6 | 1.5 | 1.5 | 0.8 | 0.1 | 0.7 | 3 | 0.4 | 100 | 300 | 3 |
| 0.6 | 0.5 | 1 | 0.4 | 1 | 0.2 | 0.3 | 0.4 | 200 | 300 | 2 | 3 | 0.8 | 0.3 |
Disclaimer/Publisher’s Note: The statements, opinions and data contained in all publications are solely those of the individual author(s) and contributor(s) and not of MDPI and/or the editor(s). MDPI and/or the editor(s) disclaim responsibility for any injury to people or property resulting from any ideas, methods, instructions or products referred to in the content. |
© 2025 by the authors. Licensee MDPI, Basel, Switzerland. This article is an open access article distributed under the terms and conditions of the Creative Commons Attribution (CC BY) license (https://creativecommons.org/licenses/by/4.0/).
Share and Cite
Zhang, G.; Zou, H.; Yang, S.; Hou, Q. A Study on the Evolution Game of Multi-Subject Knowledge Sharing Behavior in Open Innovation Ecosystems. Systems 2025, 13, 511. https://doi.org/10.3390/systems13070511
Zhang G, Zou H, Yang S, Hou Q. A Study on the Evolution Game of Multi-Subject Knowledge Sharing Behavior in Open Innovation Ecosystems. Systems. 2025; 13(7):511. https://doi.org/10.3390/systems13070511
Chicago/Turabian StyleZhang, Gupeng, Hua Zou, Shuo Yang, and Qiang Hou. 2025. "A Study on the Evolution Game of Multi-Subject Knowledge Sharing Behavior in Open Innovation Ecosystems" Systems 13, no. 7: 511. https://doi.org/10.3390/systems13070511
APA StyleZhang, G., Zou, H., Yang, S., & Hou, Q. (2025). A Study on the Evolution Game of Multi-Subject Knowledge Sharing Behavior in Open Innovation Ecosystems. Systems, 13(7), 511. https://doi.org/10.3390/systems13070511