Article

A Study on Port Service Quality, Customer Satisfaction, Customer Loyalty, and Referral Intention: Focusing on Korean Container Terminals Amid Smart Port Development

1
The Research Institute for Smart Governance and Policy (RISGP), Inha University, Incheon 22212, Republic of Korea
2
Department of Business Administration, Inha University, Incheon 22212, Republic of Korea
*
Author to whom correspondence should be addressed.
Systems 2025, 13(6), 486; https://doi.org/10.3390/systems13060486
Submission received: 5 May 2025 / Revised: 6 June 2025 / Accepted: 16 June 2025 / Published: 18 June 2025
(This article belongs to the Section Supply Chain Management)

Abstract

:
The evaluation of port service quality (PSQ) is critical for enhancing the competitiveness of container terminals. As technological innovation continues to reshape port operations, PSQ has shifted beyond operational efficiency to deliver smart, reliable, and sustainable services. However, few studies have addressed PSQ in the context of smart port evolution, especially with a focus on container terminals. This study employs a five-dimensional framework, comprising resources, outcomes, process, management, image, and social responsibility, to analyze how PSQ influences customer satisfaction and how customer satisfaction, in turn, affects customer loyalty and referral intention. The data was collected through a survey targeting users of container terminals in five major ports in Korea that undergoing smart port transformation, resulting in a final sample of 324 respondents. The findings reveal that resource-related, process-related, and image- & social responsibility-related PSQ dimensions significantly enhance customer satisfaction, which in turn has a positive effect on customer loyalty and referral intention. In contrast, the outcome-related and management-related dimensions did not have a significant impact on customer satisfaction. The analysis results and various implications discussed in this study are expected to provide helpful information and insights for establishing strategies to enhance the competitiveness of smart ports in the future.

1. Introduction

Maritime transportation, which accounts for approximately 90% of the world’s cargo volume [1], is the foundation and backbone driving globalization [2]. Ports, as the interface between maritime transportation and land, play a crucial role in connecting international logistics networks and fostering national economic growth [3]. The level of port development is closely linked to a country’s economic power, as even small improvements in port infrastructure or management can have a significant impact on economic growth at both regional and national scales [1,4,5]. However, today’s port industry faces more diverse and complex global challenges, including adapting to climate change and supporting economic development [6]. In response, many ports have embraced the “Smart Port” concept by leveraging Fourth Industrial Revolution (4IR) technologies (e.g., IoT, Big Data, Automation, Blockchain, Cloud Computing, and 5G/6G Networks) to enhance productivity, profitability, and sustainability [5,7,8,9]. Moreover, as a critical element of urban infrastructure, a “Smart Port” emerges from the broader concept of a “Smart City”, evolving beyond traditional port functions to become an integral hub that drives city development and fosters urban sustainability [6,7].
Korea, situated in the southern part of the peninsula and surrounded by the sea on three sides, heavily relies on ports and maritime transport. In 2020, Korea’s 31 international trade ports and 29 domestic coastal ports handled 87% of the country’s international trade volume [10]. By 2022, Korea’s liner shipping connectivity had ranked second in the world, only behind China [11]. Given the geographical and strategic significance of these ports, many Korean cities have developed around them. These ports contribute to urban growth by facilitating trade and logistics, while nearby cities, in turn, provide the labor, infrastructure, and market demand that ensure the smooth operation of the ports [12]. This interdependence suggests that Korea’s ports should be closely tied to the urban and economic development of surrounding cities, rather than being viewed as isolated entities.
As such, Korea, as one of the global leaders in implementing smart city policies [13,14,15], naturally prioritizes smart port development as a key initiative to foster synergy with its broader smart city growth agenda [1]. Smart port development, often referred to as smart port transformation, involves the integration of digital technologies and intelligent systems to enhance port efficiency, sustainability, and connectivity [16,17]. This strategic commitment was evident when the Ministry of Oceans and Fisheries (MoF) launched Korea’s first smart port project at Busan Port in 2019 [10]. The project is part of a broader national plan to establish 12 smart ports by 2040 [10], aiming to capture 90% of the domestic and 10% of the global markets for smart port technology by 2031 [18]. Despite the growing emphasis on the development of smart ports at the national level, Korea still lags behind regional competitors such as China, Japan, and Singapore [10]. This gap underscores the critical need to place advanced technologies at the center of smart port transformation [6], with a particular focus on leveraging these technologies to enhance Port Service Quality (PSQ). Strengthening PSQ through technological innovation, such as automation, data analytics, and digital logistics, is essential for realizing the core goals of a “Smart Port”. These goals include enhanced operational efficiency, reduced costs, improved customer experience, and increased competitiveness in the industry [5,7,8,9].
PSQ refers to the overall quality of services provided by a port and is an essential measure of how effectively it meets the needs of its users, such as shipping companies, freight forwarders, and cargo owners [19,20]. In today’s world, with the rising expectations of port users, PSQ has become a key factor in determining port performance and competitiveness [21]. This, in turn, influences customer perceptions and trust, which further affects their behavior when doing port selection [22]. Yeo et al. [19] noted that incompetence or unreliability in port service negatively impacts port operational efficiency, which can result in hindered cargo flow, increased costs, and delayed shipments [21,23]. Beyond these negative effects on operations, the poor PSQ also weakens stakeholder confidence, which can result in customer dissatisfaction and potential business loss [19,20,21,23]. Notably, as dissatisfaction grows, port users are less likely to maintain long-term partnerships with the port currently in use, leading to reduced engagement and weakened customer loyalty [19,24]. In the long run, the decline in loyalty diminishes customer retention and limits positive word-of-mouth referrals, which further deteriorates the port’s reputation and market competitiveness [25]. As a result, ports with poor PSQ have the risk of losing their competitive edge in the maritime industry, since port users tend to seek long-term partnerships with more reliable and efficient alternatives. Therefore, continuous improvement in PSQ is not just a matter of enhancing service efficiency but also a strategic necessity for sustaining competitiveness and securing customer retention.
In the context of smart port transformation, PSQ is evolving beyond traditional service performance metrics [26], which have primarily focused on cargo handling speed, terminal infrastructure, and service availability [2]. The integration of smart port technologies, such as Big Data analytics, IoT-based tracking, and AI-powered customer support, improves the key aspects of PSQ, including reliability, assurance, and efficiency [6,19]. Specifically, by implementing automated cargo handling, real-time monitoring, and predictive maintenance, smart ports improve service consistency and reliability while shaping customer perceptions of port performance [2]. Besides, in smart ports, providing accurate and real-time operational information enhances transparency, traceability, and assurance, thereby fostering trust in service quality [27]. In addition, the promotion of automation and AI-driven optimization in smart ports also improves service efficiency and quality [6]. Obviously, with the support of advanced technologies, the reliability, assurance, and efficiency of PSQ continue to improve, which then benefits in fostering long-term partnerships between users and ports while driving business growth [19]. These advancements also contribute to achieving the core goals of smart ports while enhancing market competitiveness [6]. As such, studying PSQ within the context of smart port transformation becomes crucial.
Recent international studies have increasingly addressed the evolution of PSQ in digitally advanced contexts. For example, Agatić and Kolanović [28] examined how the integration of digital technologies, such as automation, real-time information systems, and user-centered platforms, has enhanced PSQ in leading smart ports like Singapore and Rotterdam. Notably, their findings emphasized the role of digital infrastructure in improving transparency, operational reliability, and customer experience. Similarly, Roh et al. [29] applied a configuration approach to analyze customer satisfaction across various smart port environments, with a particular focus on major Asian ports such as Singapore. In Roh et al.’s [29] study, it is highlighted how technology-enabled service structures contribute to differentiated satisfaction outcomes, reinforcing the need to move beyond traditional PSQ frameworks. While such international studies have explored digital-era PSQ developments, most research in the Korean port industry still focuses on traditional operations, with limited consideration of smart port transformations. Compared to such international developments, PSQ research in the Korean context remains relatively limited, which is a significant research gap worth addressing. In particular, prior studies on PSQ within the Korean port industry have primarily focused on traditional port operations. For example, Kim et al. [30] took Incheon Port in Korea as a case to explore the causal relationship among PSQ, customer satisfaction, and performance in the port industry; Park and Woo [31] selected three major ports (Incheon, Busan, and Gwangyang) as examples to investigate the determinants and performance of PSQ in the traditional logistics domain; Yeo et al. [19] investigated PSQ’s influence on customer satisfaction with more cases chosen from Korean general container ports; Ha and Ahn [26] evaluated PSQ in the context of container transport logistics with the instance of Busan Port from the perspectives of port users. Although these studies offer their own insights into the status of PSQ in traditional Korean ports, the relevant literature remains fragmentary and tends to study PSQ in isolation. Moreover, since most of the studies were conducted before Korea officially began its smart port transition in 2019 [10], the PSQ models addressed in these studies do not sufficiently reflect the context of the evolution toward smart ports.
Therefore, to fill the research gap, this study examines how PSQ affects customer satisfaction, loyalty, and referral intention within the context of smart port development in Korea. This study focuses on container terminals from five major ports (e.g., Busan, Incheon, Yeosu-Gwangyang, Pyeongtaek-Dangjin, and Ulsan) that are currently undergoing smart port transformation, officially announced by the Korean government [10]. By embedding the smart port context into the analytical framework, this research aims to provide a more comprehensive understanding of the influence of PSQ on customer relationships and behaviors. The results and implications of the analysis are expected to provide valuable insights into strategies for enhancing the competitiveness and sustainable development of smart ports.
The rest of the paper is organized as follows. Section 2 reviews the concept of smart port and PSQ evaluation methods. Section 3 develops the research model and hypotheses. Section 4 describes the research method, and Section 5 performs the statistical data analysis and presents the results. Section 6 discusses the findings, provides practical implications and theoretical contributions, and concludes with a discussion of limitations and directions for future research.

2. Literature Review

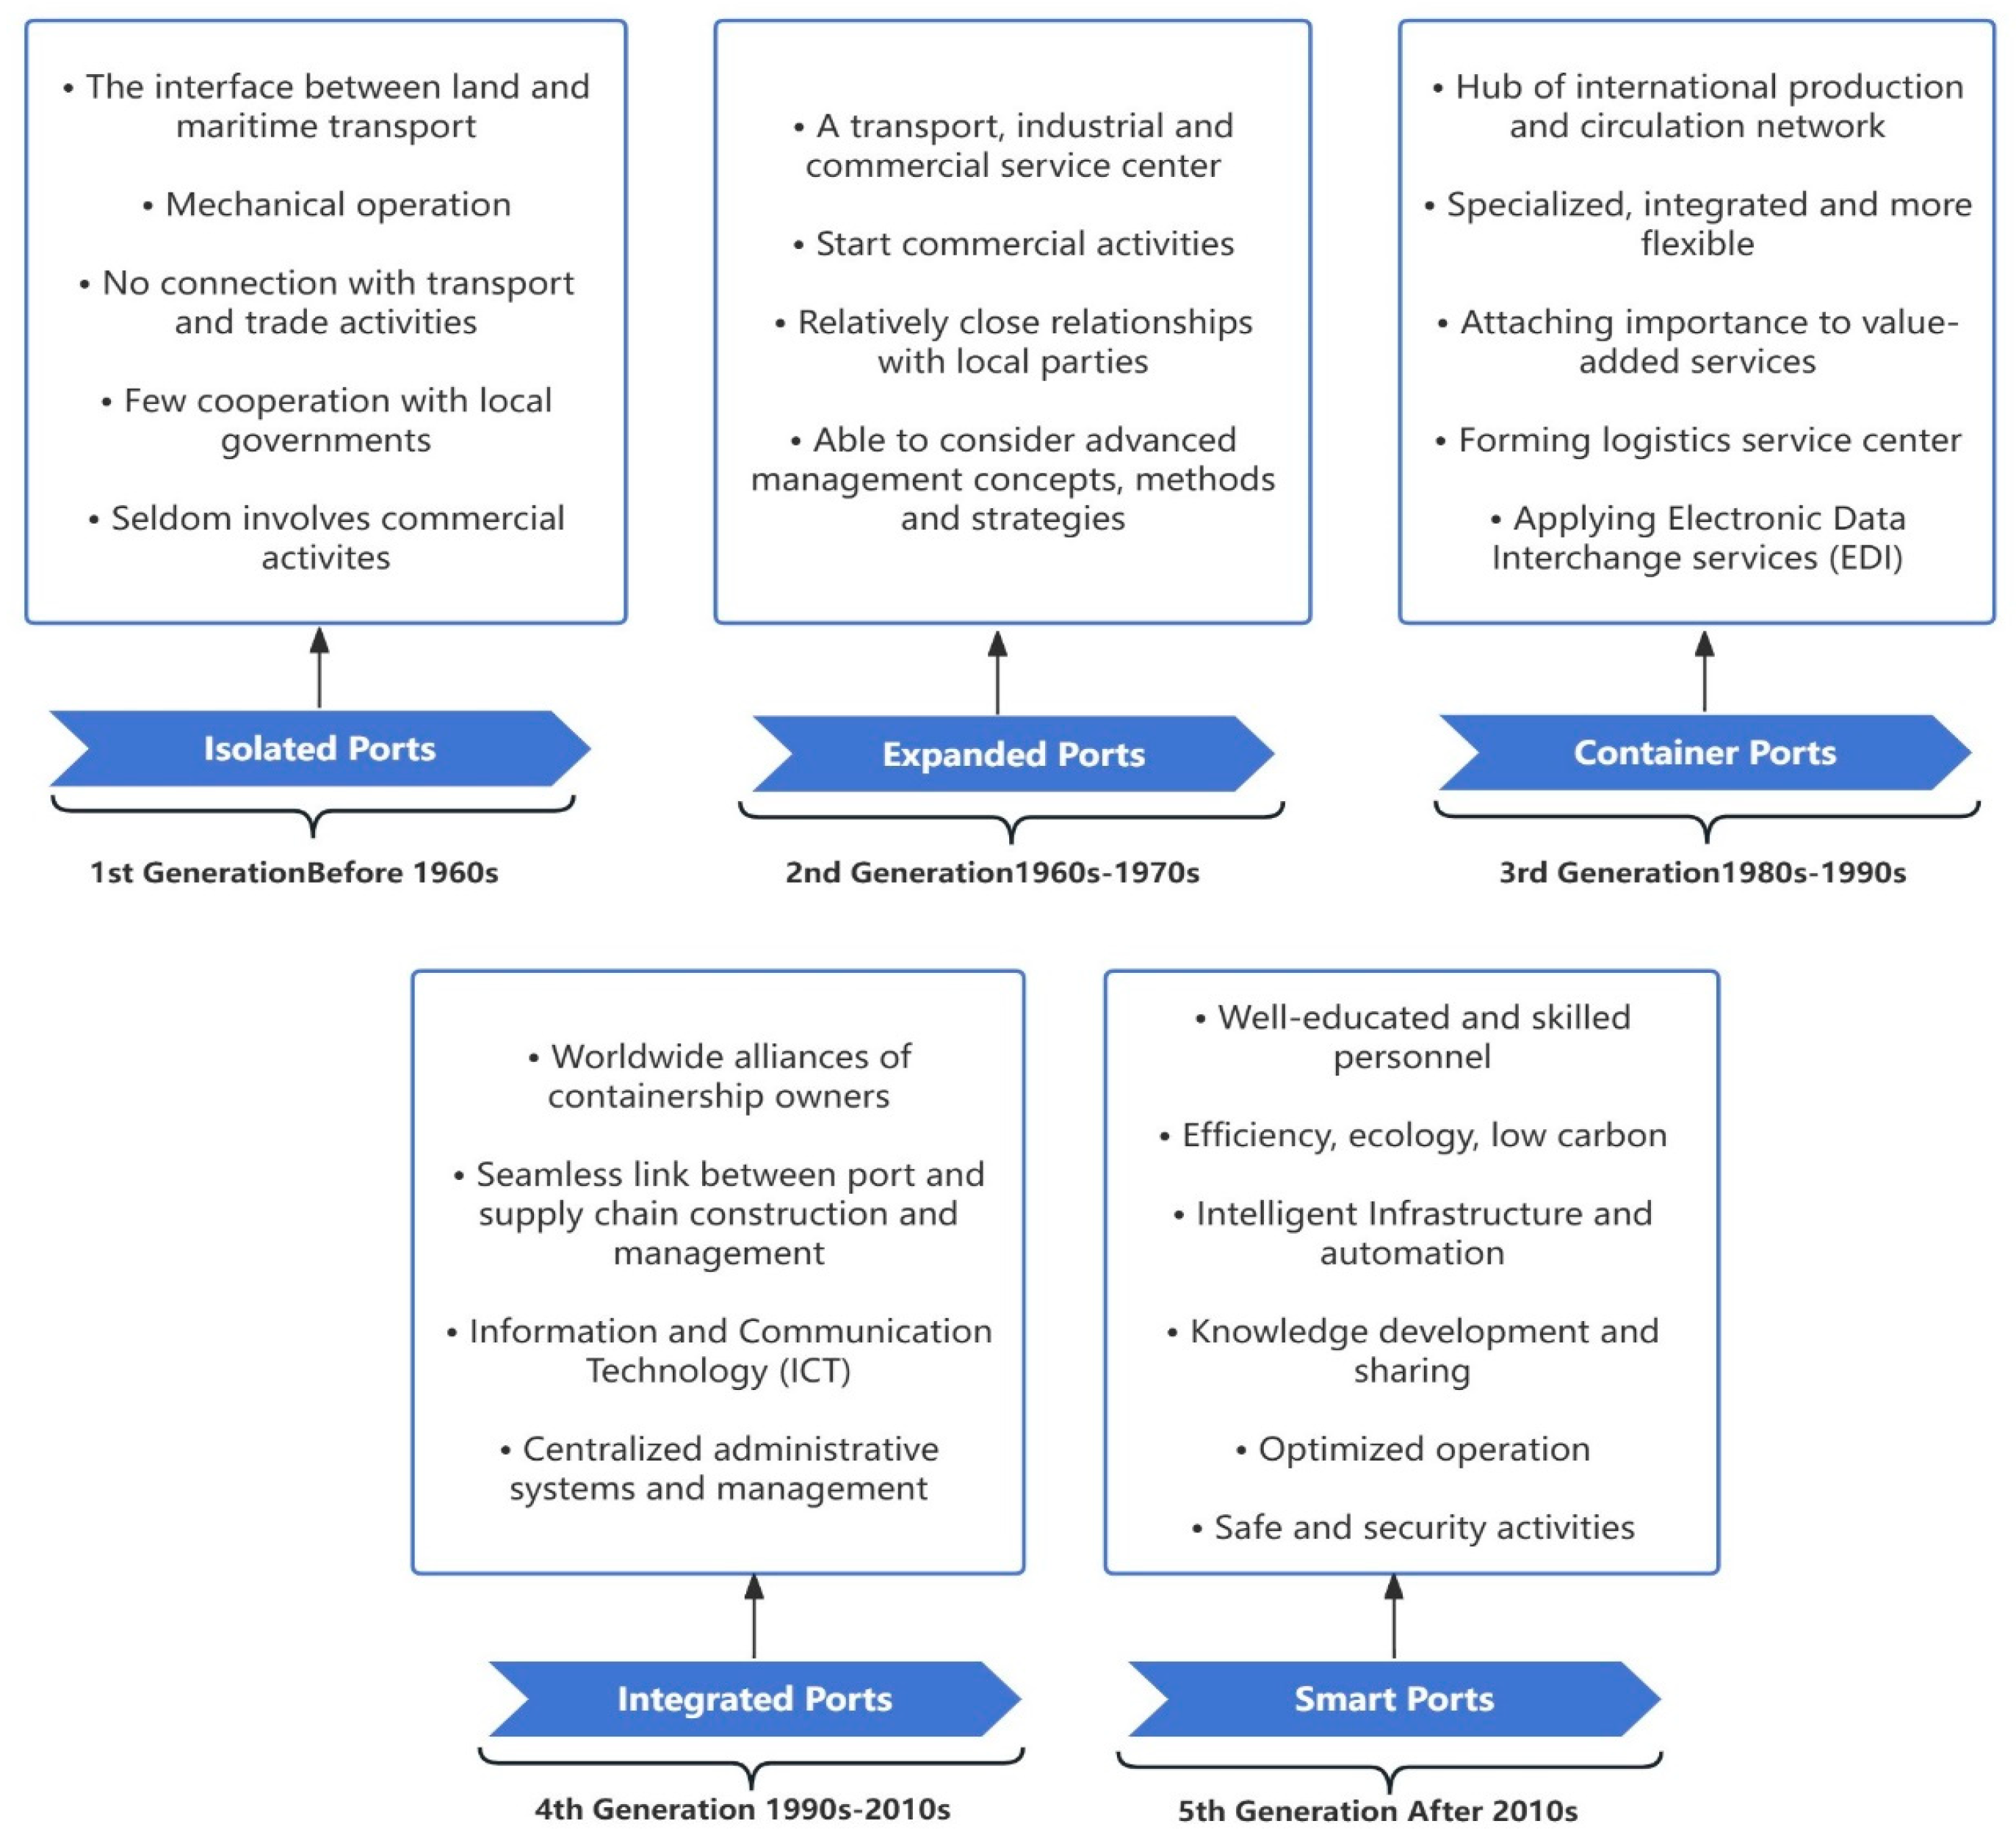
2.1. The Development of the Smart Port

The term “Smart Port” emerged around 2010 [7], coinciding with the advent of the fifth generation of port evolution. Figure 1 illustrates the main features of port evolution from the first to the fifth generation [32,33]. Throughout these generations, ports have progressively integrated a range of advanced technologies (e.g., IoT, Big Data, Automation, Blockchain, Cloud Computing, and 5G/6G Networks) to enhance their operational capabilities and adapt to the evolving demands of global maritime logistics [34]. The implementation of these technologies within smart ports is often referred to as “smart port technology” [1], and their development has garnered immense attention worldwide. Since the 2010s, many countries have recognized the importance of adopting smart port technologies to enhance national competitiveness and have prioritized launching smart port projects [1]. Representative countries leading in smart port development include Germany with its Port of Hamburg, the Netherlands with its Port of Rotterdam, Singapore with its Port of Singapore, and China with its Port of Qingdao. In contrast, Korea commenced its exploration into smart port construction in 2019 [10], indicating a relatively late entry into the field compared to these countries.
Unlike traditional ports, smart ports typically comprise five main components: “smart infrastructure”, “well-educated personnel”, “automation”, “skilled workers”, and “environmental awareness” [7,35]. These elements work synergistically to transform traditional port functions, enabling smarter decision-making, enhanced operational efficiency, and greater adaptability to future challenges [1,8,9,34,36]. While there is no universally accepted definition of a “Smart Port”, it is broadly characterized as a port that leverages automated systems and innovative technologies to enhance productivity, efficiency, safety, and sustainability.
In addition to the elements mentioned above, the development of smart ports is also shaped by regulatory frameworks and technical standards issued by various international organizations, such as the International Maritime Organization (IMO), the United Nations Conference on Trade and Development (UNCTAD), the European Union (EU), the International Association of Ports and Harbors (IAPH), and the International Port Community Systems Association (IPCSA). Among these, the IMO plays a most central role in steering both the digital transformation and safety assurance of port operations. For instance, the IMO FAL Convention [37] aims to standardize the procedures for the arrival and departure of ships in ports and to reduce the administrative burdens associated with port calls. By promoting uniformity and efficiency in port formalities, it facilitates international maritime traffic and enhances operational effectiveness across ports [38]. Moreover, the ISM Code and ISPS Code have been introduced to enhance operational safety and security within ship-port systems [39]. In addition, environmental regulations issued by the IMO, such as those under the MARPOL 73/78 Convention and its related energy management frameworks [40], further contribute to port sustainability. These legal instruments collectively strengthen smart port governance and contribute to the interdisciplinary nature of port innovation, which involves legislation, technology, and environmental policy.
Figure 1. Port Evolution and Main Features. Source: Molavi et al. [7], Lee et al. [33], Yen et al. [41].
Systems 13 00486 g001

2.2. Evaluation of Port Service Quality (PSQ)

PSQ is a specialized research theme that focuses on evaluating service quality by measuring how well ports meet the expectations of their customers [26]. PSQ is widely recognized as a critical determinant of port competitiveness [22]. Over the years, various PSQ evaluation models have been applied in the maritime sector. Table 1 summarizes the diverse evaluation dimensions employed in various maritime industry contexts.
Among the models for evaluating PSQ, the SERVQUAL model proposed by Parasuraman et al. [51] has been the most widely used. This model measures service quality across five dimensions: “tangibles”, “reliability”, “responsiveness”, “assurance”, and “empathy”. This model has attracted many researchers to adopt it in the port industry [6,44,47,49]. Despite its widespread popularity, the SERVQUAL model has not been free from academic criticism due to its inherent drawbacks. The SERVQUAL model has been criticized for lacking an expectation component [52], having unstable dimensions [53], and failing to include service encounter outcomes [54]. These appraisals raise questions about the model’s broad applicability in practical scenarios.
To address the inherent limitations of the SERVQUAL model, numerous PSQ-related studies have advocated for the development of a more robust approach. For example, López and Poole [42] proposed that “efficiency”, “timeliness”, and “security” are three critical factors that should be carefully considered when evaluating PSQ; Brady and Cronin [55] emphasized “rational quality”, “result quality”, and “physical environmental quality” are three main measuring aspects in PSQ examination; Ha [43] introduced a comprehensive set of PSQ evaluation indicators, including “ready information availability of port-related activities”, “port location”, “port turnaround time”, “facilities available”, “port management”, “port costs”, and “customer convenience”; Pantouvakis [45] developed a quality evaluation index based on six factors for gauging passenger ports: “services”, “security and safety”, “cleanliness”, “guidance-communication”, “parking facilities” and “information”; Cho et al. [46] created another measurement method of PSQ, containing testing elements of “endogenous quality”, “exogenous quality” and “relational quality”; Ha and Ahn [26] took four parts of “intermodal transport systems”, “value-added services”, “service reliability”, and “IC-integration” as a basis to check PSQ in container transport logistics domain; Li et al. [50] incorporated four dimensions of “educational level of port talent”, “logistics services”, “production management”, and “hub infrastructure” and started to blend PSQ investigation in smart port industries.
Although these studies offer valuable insights into assessing PSQ to address the increasing demands of ports and logistics, they still fail to fully acknowledge the influence of critical elements, such as corporate image and social responsibility. These factors play a pivotal role in shaping an organization’s influence and reputation, which in turn have a significant impact on customers’ perceptions of service quality [19,20]. As ports evolve to increasingly intelligent and sustainable operations, often referred to as “green” or “smart” ports, port image and social responsibility have become essential evaluation factors [19]. Moreover, today’s ports are rooted in the complex international political and economic landscape [1,19], and are typically exposed to a series of challenges, such as climate change, regional conflicts, and post-pandemic recovery. Therefore, it is necessary to incorporate factors related to a port’s image and social responsibility into the PSQ assessment framework.
Given the ever-changing environment and the growing emphasis on image and social responsibility, the ROPMIS model has attracted increasing interest as a comprehensive framework for assessing PSQ in the context of smart port development. The ROPMIS model was put forward by Thai [23] for examining service quality in maritime transport across six dimensions, namely, “resources”, “outcomes”, “process”, “management”, “image”, and “social responsibility”. In this model, the “resources” involves both physical and financial resources; the “outcomes” denotes service completion (e.g., on-time operation and delivery); the “process” refers to the staff-customer relationship (e.g., staff behavior in catering to customer requirements); the “management” implies to the efficient resource selection and deployment; the “image” relates to customers’ views on the organization’s overall service; the “social responsibility” pertains to the company’s ethical stance and behavior concerning societal benefits [23,24]. The development of PSQ measurement items based on the ROPMIS model has garnered significant attention from researchers in the maritime industry. For example, Yeo et al. [19] revised the ROPMIS model into five dimensions by integrating “image” and “social responsibility” into one aspect to evaluate PSQ with Korean ports. Building on this foundation, Thai [20] further modified the PSQ examination items by removing the “resource” dimension and developing a four-dimensional ROPMIS model, which placed greater emphasis on “outcomes”, “process”, “management”, and “image & social responsibility”. This revised model was applied in empirical studies on Singaporean ports. Subsequently, Phan et al. [21] also adopted this four-dimensional ROPMIS model for PSQ investigations in Vietnamese ports. However, some researchers still prefer to use the classic ROPMIS model with all six original dimensions as their PSQ evaluation framework. For instance, Taş and Yorulmaz [48] applied the full six-dimensional ROPMIS model in their study of freight forwarder businesses in the Turkish maritime industry.

3. Research Model and Hypotheses
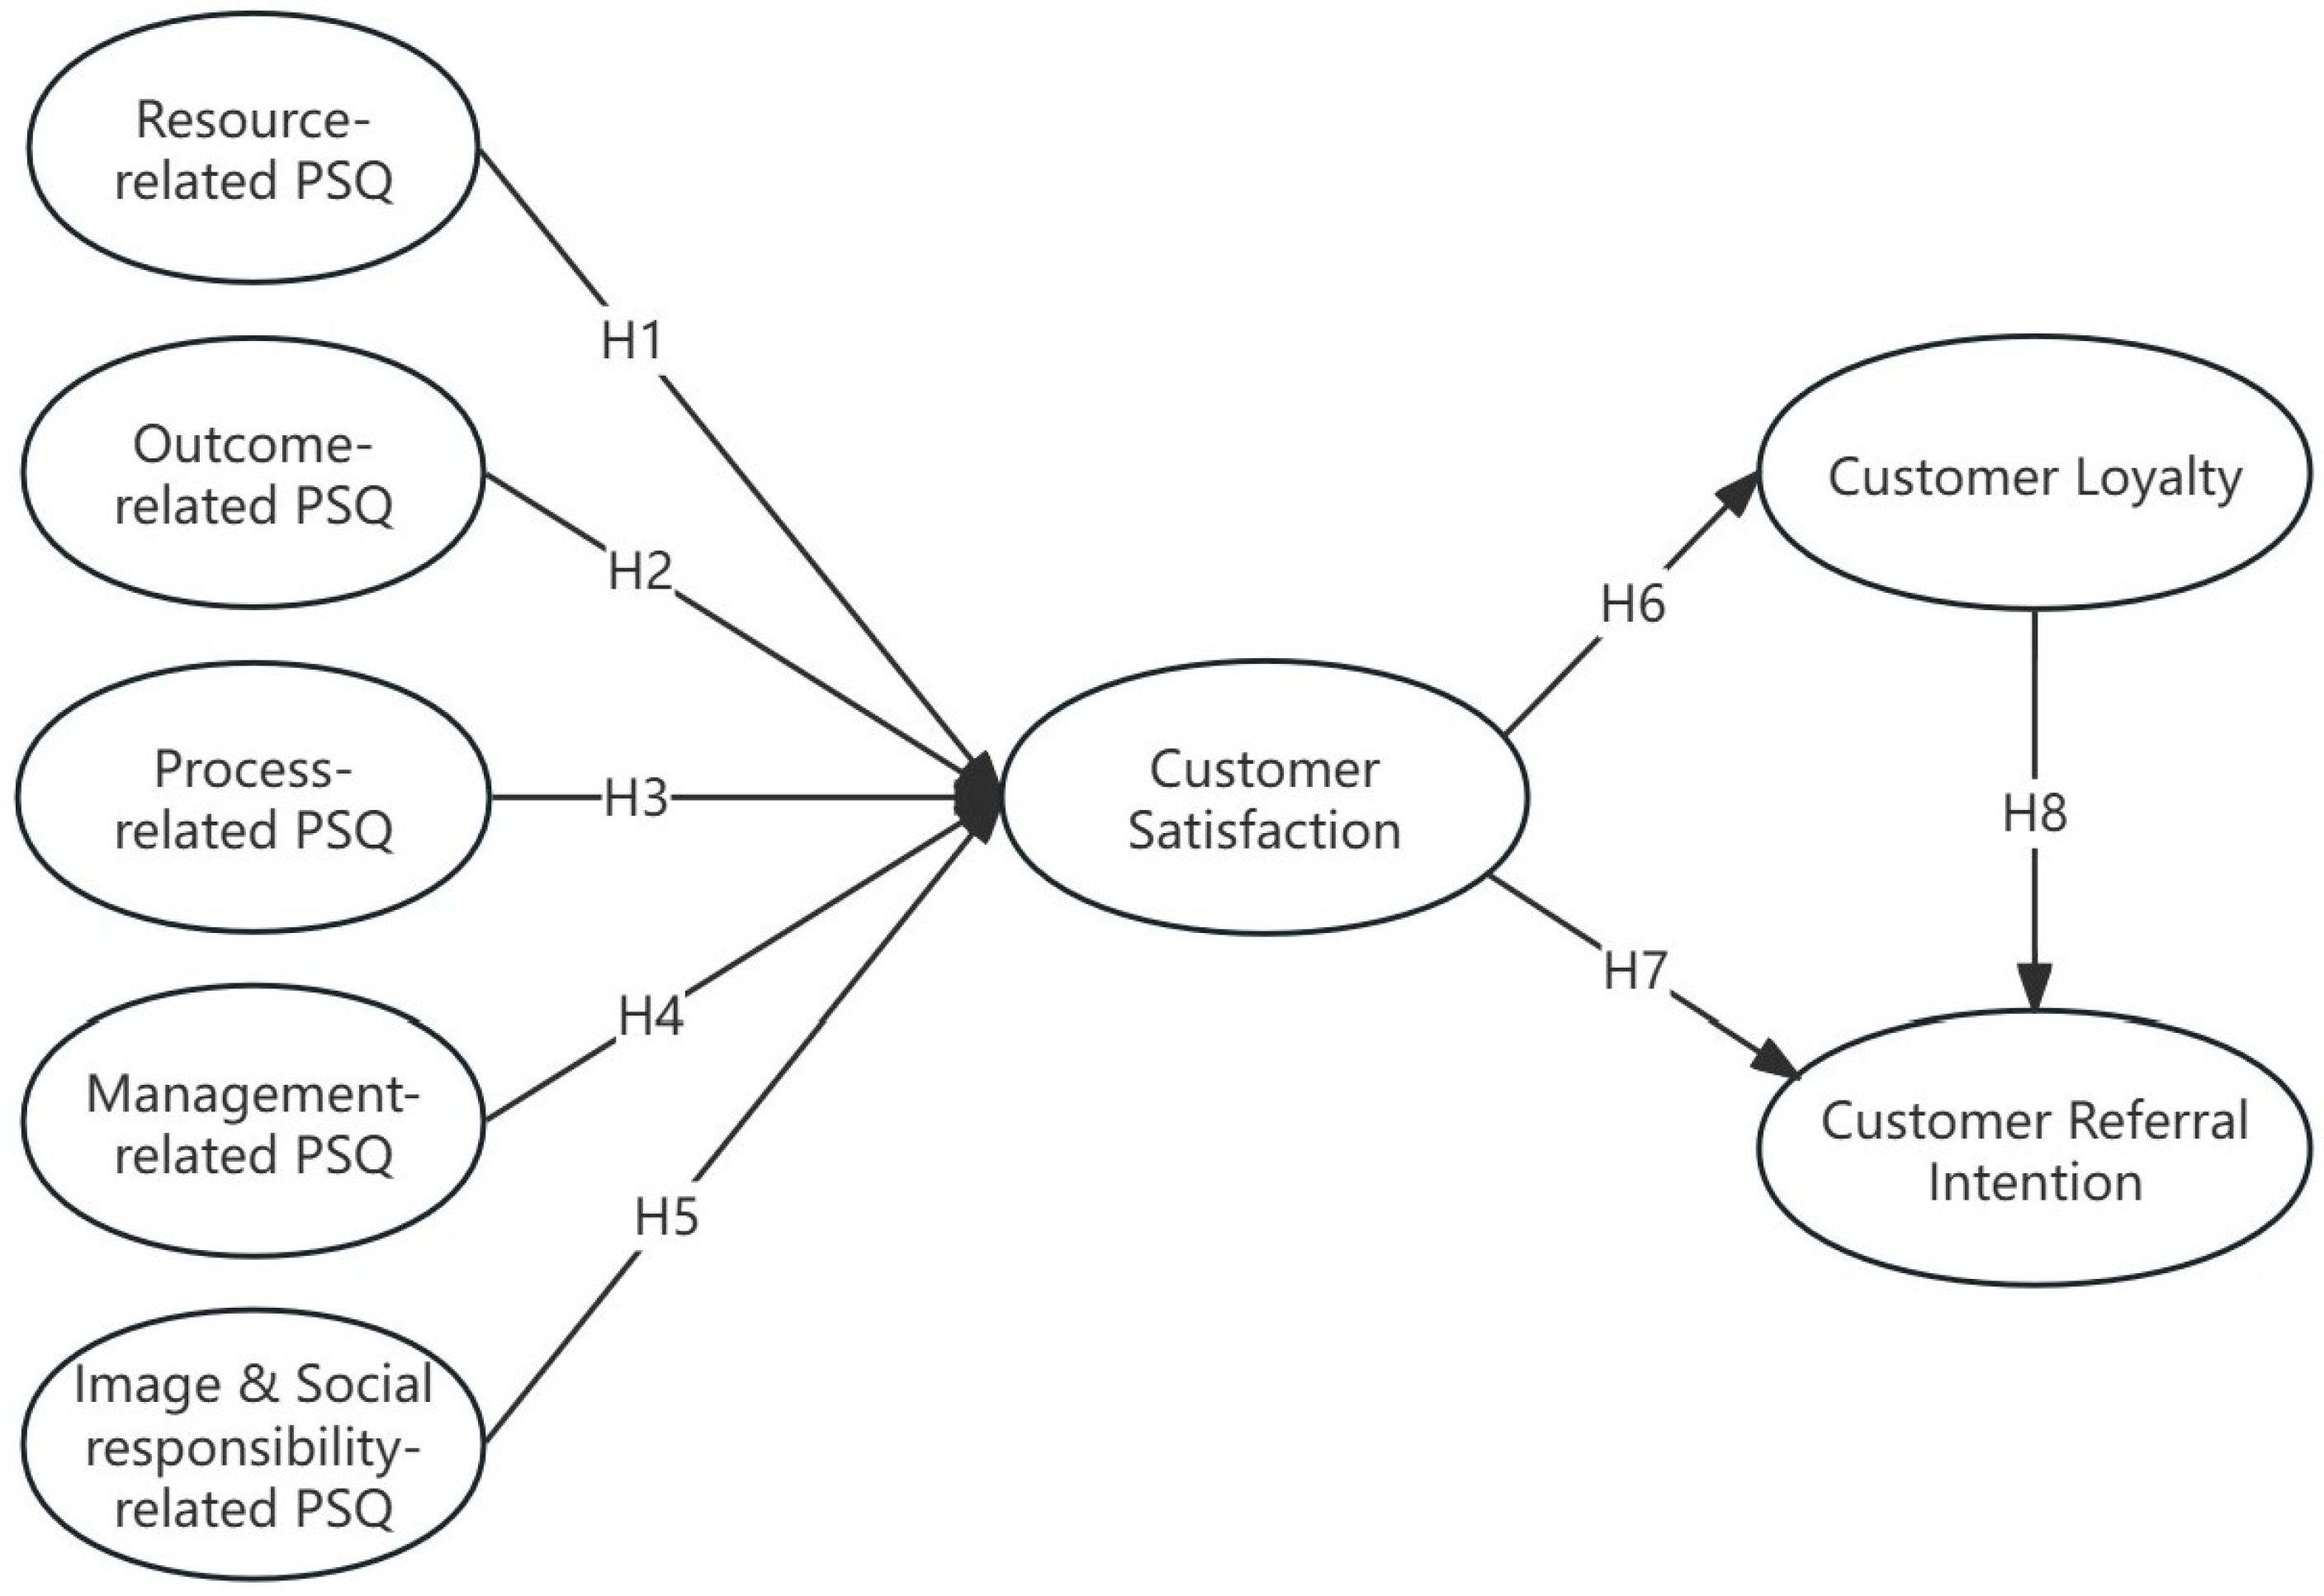
3.1. Research Model

As discussed earlier in this paper, the ROPMIS model, which encompasses factors such as image and social responsibility, has been widely recognized as a practical framework for evaluating service quality in the maritime sector [19]. Meanwhile, some empirical studies have shown that factors of image and social responsibility are highly correlated, as a company’s commitment to social responsibility directly influences its image and shapes public perception [19,21,23]. Due to this strong connection, many researchers have combined these two factors into a single construct in their studies [19,20,21]. Therefore, this paper employs the ROPMIS model, consisting of five dimensions (resources, performance, process, management, image & social responsibility) suggested by Yeo et al. [19], to analyze the impact of PSQ on container terminals in five major ports currently undergoing smart transformation in Korea. Specifically, this study aims to analyze how PSQ affects user satisfaction and how this satisfaction, in turn, influences loyalty and intention to recommend the port. The research model of this study is shown in Figure 2.

3.2. Research Hypotheses

3.2.1. ROPMIS PSQ and Customer Satisfaction

  • Resource-related PSQ
The development of smart ports largely depends on technological resources, along with physical resources (e.g., equipment, facilities, infrastructure) and financial resources [19,20,21,23]. Incorporating cutting-edge technologies into these developments will transform existing port services into collaborative and dynamic operations, improving efficiency and visibility [7]. Advanced technological resources, such as IoT, Big Data, Cloud Computing, and Blockchain, significantly reduce equipment downtime and idle time, improve customer service capacity, and accelerate response speed, which ultimately leads to higher customer satisfaction [16,56,57,58]. In addition to technology, having a conducive workspace, including efficient layouts and optimized environments, can further enhance the productivity and service quality of smart ports [6,35]. Moreover, human capital also plays a pivotal role in smart port operations. Skilled manpower is essential for managing the intelligent infrastructure and automated amenities that distinguish smart ports from traditional ones [8]. The lack of skills and experience has been identified as a significant barrier to progress in smart port development, and this challenge is further intensified by frequent regulatory changes, which are driven by the implementation of new technologies [8,59]. Notably, unlike traditional ports, smart ports are built around a variety of intelligent infrastructure and technological amenities, which require fewer but more skilled employees [41] to operate these automated facilities. These automated operations, in turn, reduce the risk of human error, ensuring consistent service quality and ultimately enhancing customer satisfaction. Based on this discussion, we propose the following hypothesis:
H1. 
Resource-related PSQ has a positive effect on customer satisfaction.
  • Outcome-related PSQ
Outcome refers to the tangible results of port operations, including reliability, efficiency, and overall service performance [19,20,23]. In general, ports face a diverse range of safety and security challenges, including terrorism, natural hazards, equipment failure, ship accidents, and loss of goods [7,60]. These risks significantly impact port operations, causing reduced efficiency, lower profits, and damaged reputations [7,60]. To address these challenges, modern ports implement various strategies such as regulatory enforcement, employee training, periodic facility checks, risk assessments, and operational systems monitoring [7]. These proactive strategies aim to detect safety and security threats early, thereby enhancing port resilience and improving service reliability [41,61]. Notably, among these proactive strategies, implementing effective risk management systems and preventive measures has been widely recognized as playing a critical role in addressing operational weaknesses, which enable ports to proactively mitigate risks while safeguarding workers, preserving environmental integrity, and protecting port resources from unforeseen events and potential disasters [6,62,63]. In doing so, severe service disruptions caused by accidents and risks can be prevented, and escalating operational costs can be avoided [62]. Furthermore, these measures can also ensure that port operations remain consistent, accurate, efficient, and of high quality [6,63]. In addition to implementing such proactive strategies, optimizing service cost is another critical factor that contributes to desirable outcomes in port operations [6,63]. Service cost significantly influences port selection among port users [19], as users are more inclined to choose ports with more competitive pricing when service levels are comparable. Therefore, providing competitively priced and efficient services at smart ports is fundamental to attracting and retaining customers [8,64]. To achieve this, integrating advanced IT systems into port operations becomes necessary, especially for data exchange and communication. This technological integration has revolutionized port operations by enabling seamless collaboration among ports, shippers, freight forwarders, and cargo owners. As a result, it minimizes errors, reduces operational delays, accelerates the arrangement of port facilities, and lowers operational costs. These outcomes not only guarantee operational efficiency but also ensure reliability and responsiveness, which ultimately boosts customer satisfaction [6,64,65,66]. Based on this discussion, we propose the following hypothesis:
H2. 
Outcome-related PSQ has a positive effect on customer satisfaction.
  • Process-related PSQ
Port operations encompass a wide range of processes, involving multiple stakeholders engaged in cargo handling, vessel operations, and intermodal transportation [64]. Managing these complex processes requires strong coordination to ensure the smooth movement of both physical flows (e.g., cargo) and non-physical flows (e.g., information) across maritime, intermodal, and landside logistics networks [67]. Given the increasing complexity of these coordination demands, many ports are shifting toward smart port development, leveraging intelligent infrastructure to optimize operations, enhance flexibility, and promote stakeholder collaboration [7,41]. Notably, the deployment of information and communication technology (ICT) in smart ports promotes innovative work processes and enhances operational efficiency by establishing a foundation for deeper integration of digitalization and automation in port operations [7,9,35]. Meanwhile, the adoption of ICT can also create opportunities for knowledge sharing, human potential development, economic growth, and sustainability, which further reinforces its transformative impact on port operations [9,35]. Consequently, all these operational improvements underpinned by technological advancement contribute to higher levels of customer satisfaction, particularly among external stakeholders such as port users [64]. Based on this discussion, we propose the following hypothesis:
H3. 
Process-related PSQ has a positive effect on customer satisfaction.
  • Management-related PSQ
Port management refers to the planning, coordination, and control of port activities and resources to ensure efficient, safe, and sustainable maritime logistics operations [68]. In today’s world, ports face numerous challenges, which can be broadly categorized into four key areas: environment, energy, safety and security, and operations [7]. To effectively address these key challenges, smart and strategic port management is required. Such management practice is commonly reflected in management-related PSQ, which emphasizes the efficient selection and deployment of resources, as well as the performance of internal systems in port operations [23,24]. In this context, technology-driven solutions and innovative managerial approaches serve as enablers of efficient strategic management, facilitating the transition toward smart port development [7]. Particularly, by leveraging ICT-based solutions, smart ports enable real-time data collection, processing, and exchange, ensuring seamless information flow across stakeholders [61]. This, in turn, lays the groundwork for informed and data-driven decision-making across port operations. Moreover, these technological and innovative management practices also empower ports to adopt a customer-centric approach, which prioritizes the interests, requirements, and preferences of their users. By placing customer interests at the center of management practice, smart ports ensure their operations are responsive to user expectations [69,70]. As a result, this alignment between management practices and customer needs highlights the importance of service quality in driving customer satisfaction. Based on this discussion, we propose the following hypothesis:
H4. 
Management-related PSQ has a positive effect on customer satisfaction.
  • Image- & Social responsibility-related PSQ
The image of a port reflects the overall perception of port users based on their past experiences [19,20]. The image of a port is generally associated with its advanced facilities and conducive working environments [16,41,71]. Specifically, equipping ports with intelligent infrastructures enhances operational efficiency by enabling seamless cooperation across stakeholders, thereby reinforcing the port’s image as one that delivers safe and high-quality services [16,41]. Meanwhile, providing a safe working environment and improving working conditions in ports are essential for fostering employee well-being, boosting productivity, and enhancing the port’s social performance, all of which contribute to a positive port image [71]. Moreover, managing relationships with the local community is also crucial for creating favorable working conditions, which, in turn, help foster trust among port stakeholders and lead to the establishment of a positive image of the port [19]. Additionally, a port’s image is sometimes simply linked to its workers’ outfits. Well-dressed employees convey a sense of competence and professionalism, which can directly affect the users’ perception of service quality provided in a port [6].
In addition to these factors, a port’s security and environmental management also influence its reputation and image, which subsequently affect customer choices in port selection [72] and ultimately impact its revenue [7,60]. These aspects, namely, port security and environmental management, are in line with the broader principles of social responsibility, which emphasize the obligation of port authorities to comply with security standards and environmental regulations while incorporating corporate social responsibility (CSR) into their management systems [19,73]. In the context of smart ports, efforts to enhance social responsibility primarily focus on addressing critical environmental, energy, safety, and security issues through the deployment of positive strategies and innovative ICT-based solutions. By leveraging advanced systems in these domains, smart ports can effectively mitigate challenges stemming from poor management practices. Furthermore, these systems also provide a foundation for proactive and informed decision-making among port stakeholders, which helps enhance the port’s overall performance and resilience [7,41,62]. By embedding social responsibility into their operational systems, smart ports strengthen their social and economic value, which in turn contributes to enhancing consumers’ perception of the port’s positive image [64,74]. Based on this discussion, we propose the following hypothesis:
H5. 
Image- & Social responsibility-related PSQ has a positive effect on customer satisfaction.

3.2.2. Customer Satisfaction, Loyalty, and Referral Intention

Customer satisfaction reflects individuals’ expectations and perceptions [75], involving the “post-consumption” comparison of expected performance with actual experience [76,77]. Satisfaction is often assessed through various dimensions such as “reliability”, “responsiveness”, “access”, “communication”, “credibility”, “security”, “courtesy”, “competency”, “tangibles”, and “knowing the customer” [75]. A higher perceived quality of a product or service typically results in greater customer satisfaction [19]. However, as an intrinsic variable, customer satisfaction does not exist in isolation; it generally influences customer behavior, particularly in terms of loyalty, post-purchase actions, and future engagement [75,77,78,79]. Prior studies have shown that customers are more likely to form loyalty and repurchase a product or service when they are satisfied with their previous experiences [80,81]. In the context of the port industry, the implementation of advanced technologies enhances the operational efficiency and performance of port services, which helps achieve the primary goal of a smart port to meet customer needs and ultimately leads to customer satisfaction [7,56]. As a result of this satisfaction, port users are more likely to develop loyalty and continue engaging with the port for future transactions [20,24,56]. Based on this discussion, we propose the following hypothesis:
H6. 
Customer satisfaction has a positive effect on customer loyalty.
In addition to impacting loyalty, customer satisfaction has also been suggested to significantly influence customer referral intentions. Customers who are satisfied with a product or service tend to have a strong intention to recommend it to others as advocates for the brand or organization [25]. This intention is deeply rooted in the attitudinal aspect of loyalty, since customers who perceive high satisfaction often develop a stronger emotional connection and trust in the brand or the organization [77,82]. Customers’ positive experiences with a service encourage them to share their satisfaction with others, expanding the company’s influence through word-of-mouth using their personal networks [83]. Existing research has consistently shown that higher satisfaction levels correlate with greater referral behaviors, as customers are more inclined to actively promote products or services that exceed their expectations [79,84]. Based on this discussion, we propose the following hypothesis:
H7. 
Customer satisfaction has a positive effect on customer referral intention.
Customer loyalty is generally understood in two popular ways: behavior and attitude [75,77,85]. The former primarily pertains to a customer’s repeated engagement or behavioral action to repurchase or reuse favored goods or services. This commitment is often stable and not easily swayed, reflecting noteworthy “loyalty” to a specific brand, product, service, or organization [75,77,85]. However, customer loyalty extends beyond repetitive purchase behavior and, in many cases, is embodied in a deeper attitude [82]. This can be characterized as a specific belief or emotional connection that influences a customer’s reactions to products, services, or organizations [82]. Such loyalty often leads to future usage and enhanced word-of-mouth recommendations, which are commonly referred to as referrals [25,86]. Specifically, as loyalty increases, customers who derive positive value [87] are more likely to recommend products and services to others through their personal networks [77,83]. Based on this discussion, we propose the following hypothesis:
H8. 
Customer loyalty has a positive effect on customer referral intention.

4. Method

4.1. Survey and Samples

To examine the research model, a field questionnaire survey was conducted, targeting individuals employed in port user groups. The port user groups to which these individuals belong collaborate with container terminals at five major ports undergoing smart port transformations, as designated by the Korean government: Busan, Incheon, Yeosu-Gwangyang, Pyeongtaek-Dangjin, and Ulsan. Moreover, to ensure the representativeness of the sample, these user groups were also identified based on the membership list of the Korea Port Logistics Association (KPLA). The KPLA is a nationally recognized industry organization comprising a comprehensive range of port users, including shipping companies, freight forwarders, logistics service providers, and cargo owners. Its membership structure closely reflects the actual composition of port customers in Korea.
The survey was conducted with a total of 400 people, comprising 364 responses collected online via a professional third-party platform and 36 responses gathered in printed form through the author’s professional network. After eliminating questionnaires that were judged to have insincere responses, 324 questionnaires were ultimately used in the analysis of this study. Among these, 29.88% of respondents reported that the companies they belong to have partnerships with Busan Port, while 30.75%, 15.75%, 13.25%, 8.75%, and 1.62% indicated that their organizations have cooperation experience with Incheon Port, Yeosu-Gwangyang Port, Pyeongtaek-Dangjin Port, Ulsan Port, and other ports, respectively. Table 2 shows the characteristics of the final sample.

4.2. Measures

All measurement items for the research constructs were developed based on existing literature (see Table 3), which ensures content validity and theoretical grounding. In the research model of this study, the use of formative specifications is theoretically justified, given that each dimension of the ROPMIS model, namely “Resources (R)”, “Performance (O)”, “Management (M)”, “Process (P)”, and “Image and Social Responsibility (IS)”, is a concept that contains its own unique and non-interchangeable elements of PSQ. This modeling choice aligns with the conceptual rationale proposed by Diamantopoulos et al. [88] and the methodological guidelines of Hair et al. [89], which recommend formative modeling when indicators are not interchangeable and reflect separate components of a construct. Similar modeling approaches have been found appropriate in service quality research, where dimensions are conceptualized as contributing independently to the overall construct. For instance, Eboli et al. [90] employed a formative measurement model to evaluate transit service quality, emphasizing its suitability in contexts where each service dimension contributes uniquely and independently to the overall perception of quality. Furthermore, as this study aims to investigate how various PSQ dimensions influence customer satisfaction and, in turn, impact loyalty and referral intention, employing a formative model enables a more accurate assessment of the distinct impact of each dimension. However, due to the inherent nature of formative constructs, in which indicators are conceptually distinct and unlikely to covary, it becomes necessary to include an additional global item to facilitate the validity assessment of each construct [89]. Therefore, a global item was developed for each of these five variables and added to the measurement items. On the other hand, the remaining three variables of the research model, which measure the psychological impact of customers’ service experiences, namely “Customer satisfaction (CS)”, “Customer loyalty (CL)”, and “Customer referral intention (CRI)”, were developed as reflective measurement constructs. All measurement items used in this study were measured using a 7-point Likert scale (1 = strongly disagree, 7 = strongly agree), enabling respondents to indicate the intensity of their satisfaction or agreement levels across various items. Nevertheless, since the data were collected through self-reported questionnaires, the study may still be subject to potential biases such as social desirability or subjective interpretation. Although the anonymity of responses was ensured and validated measurement items were used, the possibility of self-report bias cannot be entirely ruled out.

5. Data Analysis and Results

This paper used Partial Least Squares Structural Equation Modeling (PLS-SEM) to statistically verify the research model. PLS-SEM is a variance-based structural equation modeling technique designed to analyze complex causal relationships between latent variables [89]. Compared to traditional SEM (i.e., covariance-based SEM (CB-SEM)), PLS-SEM has the advantage of being particularly suitable for prediction-oriented research, early-stage theory development, or working with relatively small sample sizes [89]. More importantly, as a second-generation multivariate data analysis technique, PLS-SEM does not require that the data follow a specific distribution [89]. This feature enhances its flexibility, particularly in handling reflective constructs. Furthermore, its component-based algorithm and minimal identification requirements also make it well-suited for models that include formative constructs [89,98]. In addition, PLS-SEM simultaneously estimates both the measurement model and the structural model, making it particularly suitable for evaluating path relationships and explanatory power in exploratory studies. This study employed SmartPLS (v.4.1.0.2) as the analysis tool.

5.1. Measurement Model Evaluation

The research model of this study comprises both formative and reflective constructs, each requiring distinct evaluation methods. Therefore, the following subsections were organized separately for each of the two types of measurement models.

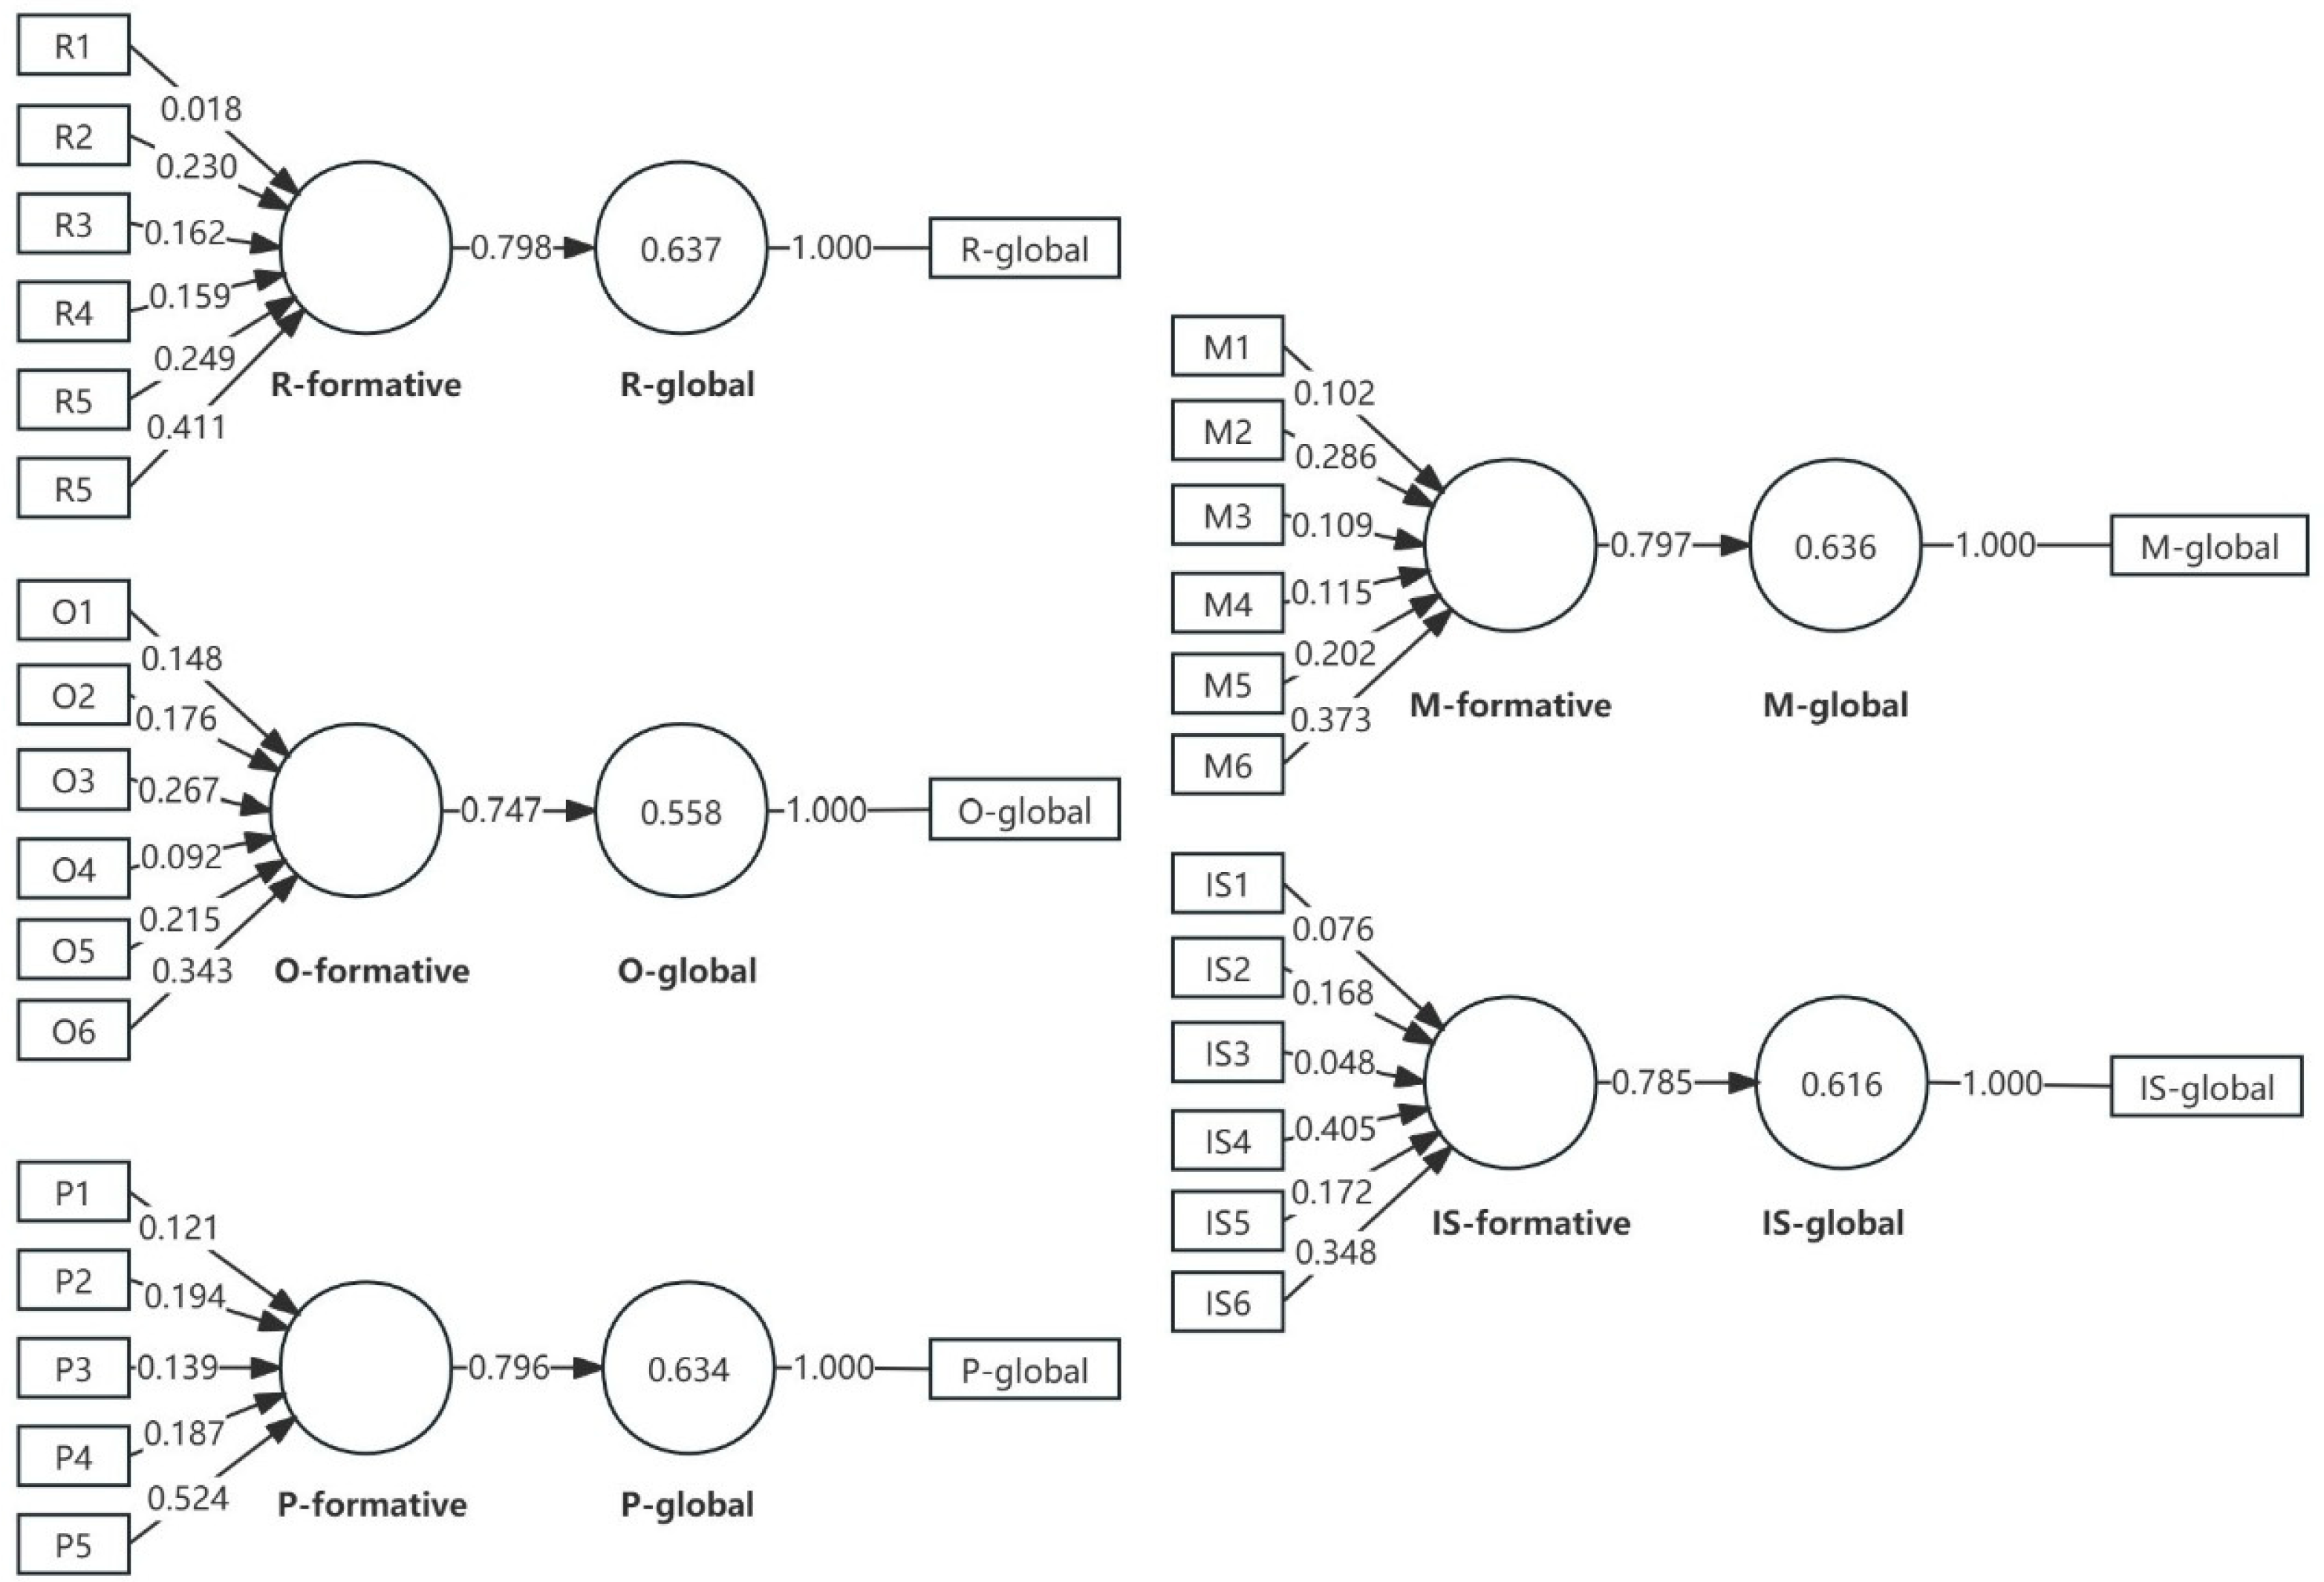
5.1.1. Evaluation of Formative Measurement Model

As explained in Section 4.2, the research model of this study includes formative measurement constructs of “Resource (R)”, “Outcome (O)”, “Process (P)”, “Management (M)”, and “Image & Social Responsibility (IS)”. The evaluation of formative measurement models focuses on the convergent validity, collinearity, and the significance of outer weights [89].
First, to assess convergent validity, redundancy analysis [99] was conducted on five formative models. To this end, five separate models were developed, each incorporating a global single-item measure for the corresponding formative construct [89]. Convergent validity is confirmed when the path coefficient between the original formative construct and its global single-item measure exceeds 0.7 [89]. Figure 3 shows the results of the redundancy analysis, which demonstrate that all formative constructs exhibit satisfactory convergent validity, as indicated by path coefficients exceeding the recommended threshold of 0.7.
Next, collinearity was assessed using the variance inflation factor (VIF), where a value below 5 indicates no serious collinearity [89,100]. As shown in Table 4, all variables in the formative measurement model in this study exhibited VIF values below the threshold, confirming the absence of collinearity concerns [89,100]. Subsequently, the significance of formative constructs was examined by evaluating the p-value of their outer weights. A p-value lower than 0.05 confirms that the formative construct is statistically significant at the 5% level, reflecting a 95% confidence level [89]. However, as illustrated in Table 4, items such as “R1”, “O2”, “O4”, “O5”, “P2”, “M2”, “M4”, “M5”, and “IS1” did not reach the ideal significance level for their outer weights, as their p-values exceed 0.05 [89]. In the significance analysis of the formative measurement model, even if the external weights are not significant, items can still be retained if their outer loadings are 0.5 or higher [89]. Therefore, the values of the outer loadings of these items were further examined. All outer loadings for these formative items were close to or above 0.7, with p-values below 0.01, confirming their statistical significance despite the initial outer weight results [89]. Moreover, when looking at these items from a conceptual perspective, each plays a meaningful role in representing its respective construct. For example, “R1” reflects the advanced level of port technology infrastructure, which is particularly crucial in the context of smart port development. “O2” and “O4” capture reliability and security, both of which can be seen as baseline expectations in port service delivery. “O5” relates to error-free invoices and shipping documents, which help reduce delays and customer complaints. “P2” emphasizes responsiveness during the service process, reflecting the efficiency of user interaction with port personnel. “M2”, “M4”, and “M5” collectively capture essential managerial competencies, namely, operational efficiency, a culture of continuous improvement, and domain-specific professionalism, which are critical to navigating the complexities of delivering high-performance services in digitally enabled environments. In addition to the above, “IS1” indicates the system’s ability to avoid cargo loss or damage, which, to some degree, might reinforce the perception of reliability. As such, given the conceptual relevance in capturing the multidimensional nature of PSQ in smart port contexts, these items were ultimately retained in the measurement model. Consequently, after assessing convergent validity, collinearity, and significance, all formative constructs demonstrate satisfactory measurement quality for further analysis.

5.1.2. Evaluation of Reflective Measurement Model

As noted in Section 4.2, the research model of this study also includes reflective measurement constructs of “Customer Satisfaction (CS)”, “Customer Loyalty (CL)”, and “Customer Referral Intention (CRI)”. To assess the quality of these reflective constructs, this study first conducted the reliability analysis of the reflective measurement items. To ensure the reliability of the measurement items, both the Cronbach’s alpha, which indicates internal consistency, and the composite reliability should exceed 0.7 [89]. As shown in Table 5, the analysis results indicate that the Cronbach’s alpha value for all variables was 0.8 or higher, and the composite reliability was 0.9 or higher, suggesting that the reflective measurement tool used in this study was evaluated to have secured reliability for the construct concept.
Meanwhile, the validity was evaluated from two perspectives: convergent validity and discriminant validity [101]. Convergent validity was evaluated through outer loadings and average variance extracted (AVE). As shown in Table 5, all outer loadings were above 0.7 and all AVE values were above 0.5, indicating that convergent validity was secured [89]. In contrast, discriminant validity was evaluated using the Fornell-Larcker criterion. As shown in Table 6, the square roots of the average variance extracted values were higher than the correlation coefficients with other variables, indicating that discriminant validity was also secured [99,102].

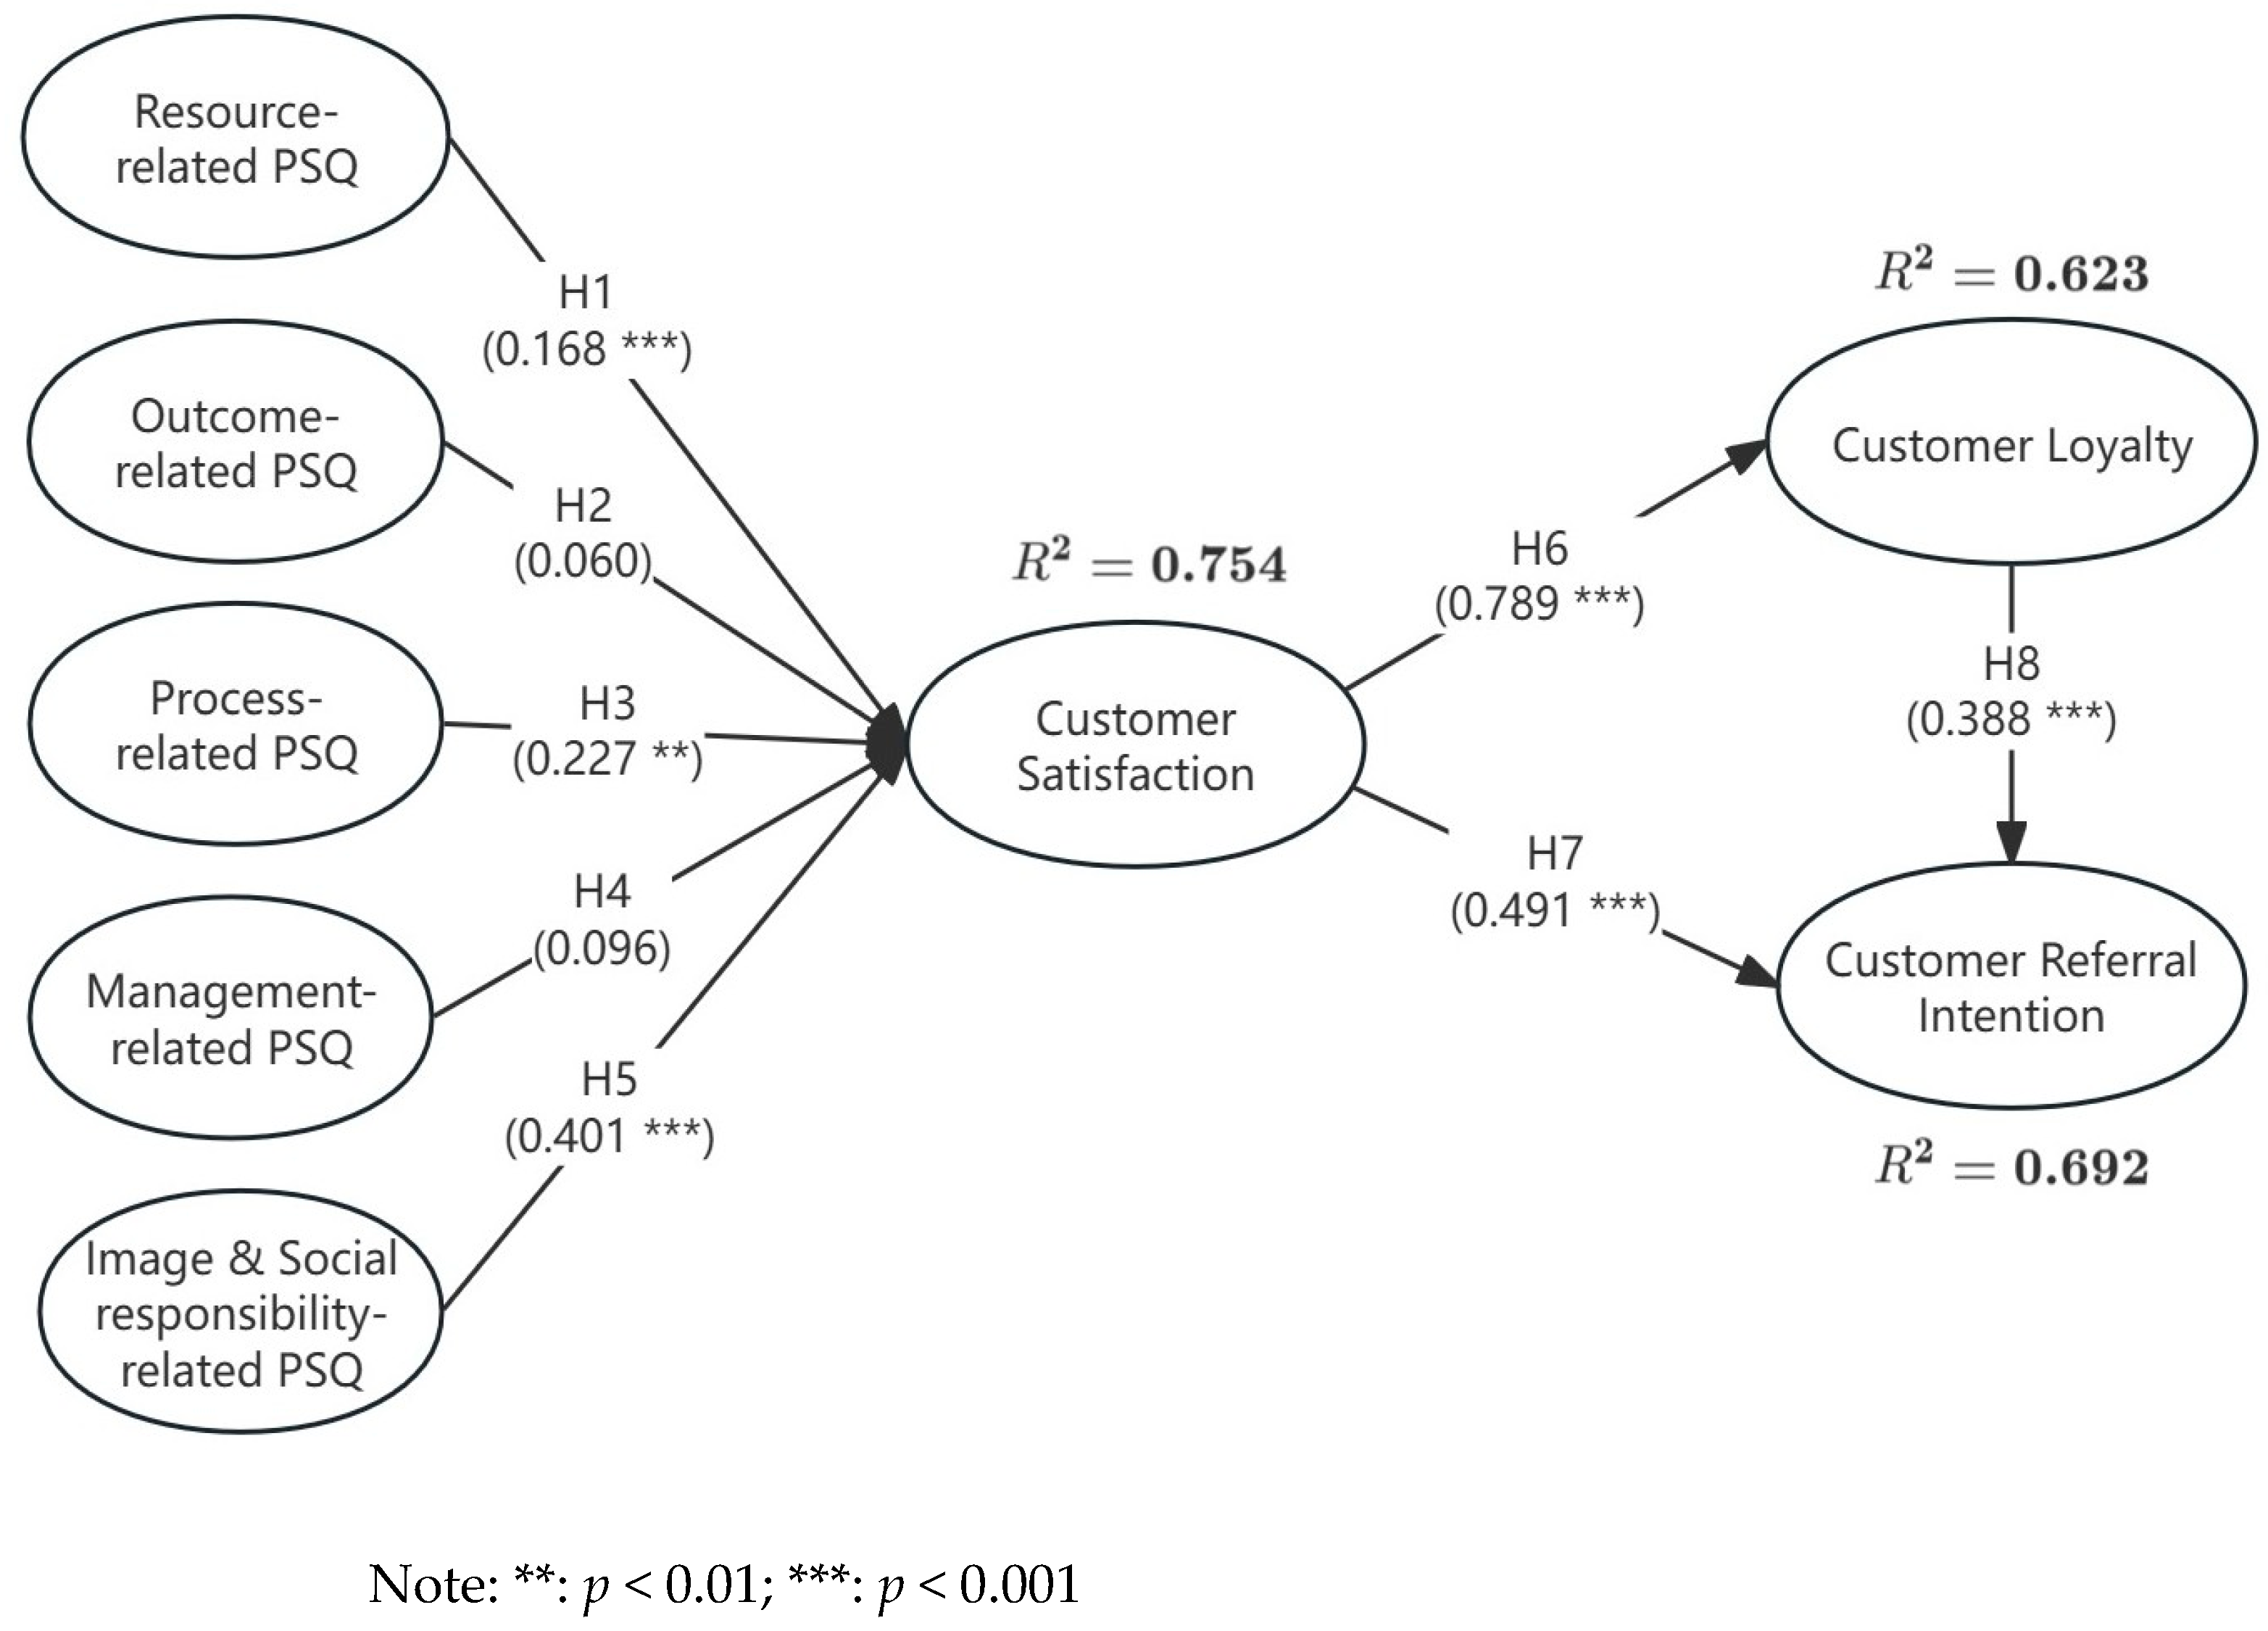
5.2. Structural Model Evaluation

To evaluate the structural model, this paper first performed a collinearity analysis using VIF. The results showed that all VIF values for exogenous constructs were less than 5, confirming that there was no collinearity problem [89]. Next, this study tested the hypotheses proposed in the research model through structural model analysis using the bootstrapping technique (5000 resamplings). As shown in Table 7, all six hypotheses except H2 and H4 were accepted. These results suggest that resource-related, process-related, and image- & social responsibility-related PSQ dimensions significantly contribute to forming user satisfaction with a container terminal in a port, ultimately strengthening customer loyalty and referral intentions. Meanwhile, the R2 values were also analyzed to assess the model’s explanatory power. As shown in Figure 4, all R2 values exceed 0.60, which can be evaluated as strong [89].
In addition, to further examine the generalizability of the model across respondent groups, this study further included company size and field of work as control variables. The results revealed that neither variable had a statistically significant effect on customer satisfaction (company size: p = 0.157; field of work: p = 0.791). These findings suggest that the structural relationships proposed in the model were not sensitive to these sample characteristics, indicating the model’s robustness across different types of respondents.
Finally, this study evaluated the predictive relevance of the structural model using a cross-validation technique based on the PLSpredict algorithm [103,104]. This technique uses training and holdout samples to evaluate the model’s out-of-sample prediction performance for endogenous constructs. The Cross-Validated Predictive Ability Test (CVPAT) summary (See Table 8) shows that the average prediction loss for each endogenous construct was lower for the PLS model than under the linear model. Furthermore, all comparisons were statistically significant (p < 0.05), indicating that the PLS-SEM model provides sufficient out-of-sample predictive power.

6. Discussion and Conclusions

In today’s maritime industry, ports serve as crucial hubs connecting land-based and maritime transport networks [3]. It is essential to study PSQ as it helps port operators to identify key factors shaping port services, which, in turn, optimize service quality, enhance customer experience, improve customer satisfaction and loyalty, and ultimately assist in maintaining a competitive advantage [19,21,23]. Although the importance of PSQ is widely recognized, existing studies do not sufficiently reflect the context of evolution toward smart ports in their PSQ measurement models. Therefore, to fill this gap, this paper analyzed the impact of PSQ on customer satisfaction, loyalty, and referral intention based on the five-dimensional ROPMIS model [19], focusing on Korean container terminals undergoing smart port innovation.
As a result of the analysis, all the hypotheses presented in this study, except H2 and H4 (i.e., outcome-related/management-related PSQ has a positive effect on customer satisfaction), were supported. Accordingly, this study first discusses the reason why H2 and H4 were not supported. The outcome-related PSQ (e.g., fast and reliable service, error-free documentation, and competitive pricing) can be seen as basic service expectations from the perspective of port users. According to the Kano model [105], such basic outcome-related PSQ attributes fall under the category of “must-be qualities”, which do not significantly increase customer satisfaction when fulfilled, but can cause dissatisfaction when absent. This implies that even if these basic outcomes are well delivered, users may not perceive them as value-adding features that enhance satisfaction. Meanwhile, this result can also be interpreted through the perspective of the Expectation-Confirmation Theory [77], which explains customer satisfaction as the outcome of comparing prior expectations with actual experiences. When actual experiences exceed expectations, customers feel pleasantly surprised, which in turn increases their satisfaction [77]. In contrast, if the experience merely meets expectations, it often leads to a neutral emotional response [77]. In the context of smart ports, many outcome-related features have become routine and predictable for experienced users. Therefore, these features may no longer exceed expectations or deliver emotional uplift, resulting in a limited impact on satisfaction. Interestingly, this finding, which shows that outcome-related PSQ does not significantly affect customer satisfaction (H2), is also consistent with the study of traditional Korean ports by Yeo et al. [19].
Meanwhile, the discussion on why the effect of management-related PSQ on user satisfaction was found to be invalid is as follows. Traditionally, management-related PSQ elements of container terminals have focused on improving service quality through human efforts such as coordinating staff, monitoring services, and making strategic decisions [19,20,21]. In such situations, users’ perception of management-related PSQ may have been clearer because human-driven management activities such as service supervision and coordination were more directly observable. However, as ports adopt the concept of smart ports, existing traditional management functions are transitioning to ICT-based ones [7]. This change may have resulted in a decrease in the visibility of people’s roles in management activities, which may have led to users being less aware of management-related PSQ. And this reduced awareness of management-related PSQ can also be explained through the cognitive appraisal perspective [106]. According to this theory, emotion is not merely a reflexive response to stimuli but rather arises based on how an individual interprets and evaluates a given stimulus or situation [106]. From this perspective, if users find it difficult to clearly perceive the efforts to improve PSQ in ICT-based management, their interpretation and evaluation of these efforts may be limited, which in turn may restrict the emotional impact of these efforts on their satisfaction.
The following sections present a comparative analysis of PSQ studies based on the ROPMIS model, theoretical contributions, practical implications, study limitations, and future research directions. For the convenience of readers, a table summarizing the main theoretical and practical contributions is presented in Appendix A.

6.1. Research Comparison

This section presents the key differences between this study and prior empirical research on PSQ that has employed the ROPMIS model. To ensure representativeness in comparison, three seminal studies are selected: Yeo et al. [19] on Korean traditional container ports, Thai [20] on Singaporean ports, and Phan et al. [21] on Vietnamese ports. Although all of these studies examined the influence of ROPMIS dimensions on customer satisfaction, they differed significantly in terms of national context, methodological approach, and empirical findings. For instance, both Thai [20] and Phan et al. [21] employed CB-SEM and adopted the four-dimensional ROPMIS model, finding that all four ROPMIS dimensions: outcomes, process, management, and image & social responsibility, had significant effects on customer satisfaction. In contrast, Yeo et al. [19] adopted the five-dimensional ROPMIS model and applied PLS-SEM, identifying only two significant dimensions: management and image & social responsibility. Turning to this study, although the authors also employed the five-dimensional ROPMIS model and applied PLS-SEM, the analysis was conducted within the specific context of smart port development. As a result, a distinct pattern was observed, with resources, process, and image & social responsibility emerging as significant predictors of customer satisfaction, while outcomes and management showed no significant effects. A detailed comparison is presented in Table 9.

6.2. Theoretical Contributions

First, building on the above comparative analysis, the research novelty of this study becomes clearer, and it forms a key theoretical contribution. While earlier studies typically applied the ROPMIS model in traditional port settings, this study extends its application to the evolving context of smart port development, thereby broadening its relevance to digitally transformed port environments. Furthermore, the empirical results diverge from prior findings: whereas previous studies often found management and outcomes to be key drivers of customer satisfaction, this study identifies resources, process, and image & social responsibility as the most influential factors. These results reflect the shifting perceptions of service quality among port users and highlight the need to recalibrate PSQ evaluation metrics in line with smart port innovation.
Second, this study clarified the psychological mechanisms between PSQ and customer satisfaction, loyalty, and recommendation intention. Unlike with previous studies, which often explored service quality in relation to a single outcome, such as customer satisfaction [19,21], this study connects these three customer responses together in one model, showing how service quality can lead not just to customer satisfaction, but also to continued loyalty and positive referral intentions. By validating this entire pathway through empirical analysis, this study provides a clearer theoretical explanation of the mechanism by which PSQ affects customer behavior in a smart port transformation context.

6.3. Practical Implications

6.3.1. Enhancing Key PSQ Dimensions to Improve Customer Satisfaction

This study confirmed that resource-related (H1), process-related (H3), and image- & social responsibility-related PSQ factors (H5) have significant positive effects on customer satisfaction in the context of smart port transformation. Since customer satisfaction is a key factor in determining customer loyalty and intention to revisit, efforts to improve service satisfaction are critical to strengthening these behavioral outcomes. In this regard, managers of container terminals undergoing smart port transformation should prioritize strengthening service quality dimensions that directly contribute to user satisfaction.
First, this study confirmed that the PSQ dimension related to resources, including technology, equipment, facilities, finance, information, physical space, and human resources, has a significant positive effect on customer satisfaction (H1). This result suggests that container terminal managers should actively pursue efforts to enhance the utilization of various resources and improve user satisfaction. Specifically, to enhance smart technologies and equipment, it is necessary to establish conditions that facilitate regular investments in upgrading automation systems and maintaining facilities in good operating condition, rather than making these efforts one-time. Regarding information resources, container terminal operators should also consider efforts to enhance the transparency and reliability of port services by improving real-time shipment tracking systems to advance shipping information. Moreover, in terms of physical infrastructure, container terminal managers should focus on upgrading berths, storage areas, distribution centers, and hinterland access, as these improvements could contribute to smoother logistics operations and higher service satisfaction. While for human resources, container terminal managers are recommended to consider introducing targeted upskilling initiatives, such as digital training and on-the-job learning programs, to build a workforce capable of adapting to smart port systems. Additionally, to ensure financial sustainability, container terminal managers are encouraged to develop strategic budgeting plans that secure long-term investments in smart infrastructure. Additionally, considering the wide range of resource areas mentioned above that require continuous investment and optimization, it is also essential to establish a comprehensive integrated resource investment plan that prioritizes resources based on their relative importance and urgency. In particular, these priorities should also reflect each terminal’s level of digital transition readiness. For example, container terminals in the early stages of digitalization should focus more on foundational upgrades such as physical infrastructure and staff upskilling, while more digitally mature terminals should concentrate on advanced technologies like IoT and AI-based operational systems.
Second, this study confirmed that the PSQ dimension, which includes factors related to operational processes such as timely professional staff responses, ICT-supported operations, and efficient service scheduling, has a significant positive impact on customer satisfaction in the context of smart port development (H3). This finding suggests that container terminal managers should actively improve the quality of their service processes to enhance user satisfaction and maintain competitiveness during the smart port transformation. To achieve this, container terminal managers should focus on three key components of service processes: staff professionalism and responsiveness, ICT utilization, and service schedule management. More specifically, to enhance the professionalism and responsiveness of frontline staff, terminal managers should consider providing regular customer service training, knowledge sharing sessions, and performance monitoring systems. For example, training programs that focus on improving staff expertise in handling user inquiries and identifying user requirements will enable staff to provide faster and more accurate services. Meanwhile, to enhance ICT utilization, container terminal managers should continuously maintain these digital systems, protect them with strong data security and privacy policies, and regularly update them to reflect changing service demands. Additionally, when managing service schedules, container terminal managers should prioritize optimizing daily workflows and allocating resources efficiently across both peak and non-peak periods. This, in turn, can help reduce delays and ensure smooth operations. Of course, these process improvements should also be aligned with each terminal’s level of digital transition readiness. Terminals at earlier stages may face limitations in adopting ICT-based solutions; therefore, managers are encouraged to tailor their strategies accordingly. For example, they can start with basic digital system upgrades or foundational ICT training before moving toward advanced optimization.
Third, this study confirmed that the PSQ dimension, including factors related to corporate image and social responsibility (e.g., environmental sustainability, community involvement, and operational safety), has a significant positive effect on customer satisfaction in a smart port development environment (H5). This result suggests that container terminal managers should consistently strengthen their sustainability initiatives and social responsibility practices to enhance customer satisfaction and long-term competitiveness. To this end, terminal managers should focus on areas such as environmental performance, community relations, and operational safety. In particular, to improve environmental sustainability, container terminal managers should consider adopting clean energy solutions, enhancing waste recycling initiatives, and implementing green logistics practices to align operations with the broader environmental goals of a smart port. Besides, to promote community participation of ports, it is necessary to consider activities such as supporting local education programs, participating in local community development projects, and building partnerships with local stakeholders. Successfully carrying out these activities can be expected to build trust from the community and enhance one’s social presence. Additionally, to enhance operational safety, container terminal managers should encourage thorough employee training, establish a robust safety management system, and conduct regular risk assessments for the safety of employees and the surrounding community.

6.3.2. Managing Satisfaction to Foster Loyalty and Referral Intention

This study also confirmed that customer satisfaction has a positive effect on customer loyalty (H6) and referral intention (H7). These findings suggest that container terminals undergoing smart port transformation should take strategic efforts to improve customer satisfaction among user groups, thereby cultivating customer loyalty and referral intentions. These efforts should be effectively promoted and managed along with strengthening the PSQ dimensions related to resources, processes, and image & social responsibility, which contribute to satisfaction as discussed above. To achieve this, container terminal managers need to consider various implementation measures, such as conducting customer satisfaction surveys, establishing dedicated channels for customer feedback and complaints, benchmarking competitors, and conducting customer interviews. The customer satisfaction survey should focus on key performance indicators for various service areas of container terminal operations, such as cargo handling efficiency, digital platform usability, and overall operational stability. Notably, to ensure ongoing improvement, it is essential to conduct the survey regularly to continuously track changes in customer satisfaction. Furthermore, to complement the survey results and enhance responsiveness, it would also be beneficial to consider dedicated customer feedback channels, such as those on the port’s website or popular social media platforms. These channels are expected to enable terminal managers to identify and address customer issues quickly, while providing valuable insights into recurring service issues and allowing them to more effectively identify service improvement targets that can improve customer satisfaction. In addition, to enhance customer satisfaction, container terminal managers should actively benchmark their performance against similar facilities, engage in in-depth customer interviews, and focus group discussions to gain a deeper understanding of customer needs. These focused interactions are expected to provide managers with valuable insights into customer expectations, which then can be used to effectively identify specific areas for improvement.

6.3.3. Strengthening Customer Loyalty to Encourage Word-of-Mouth

This study confirmed that customer loyalty has a significant positive effect on customer referral intention (H8). This result suggests that container terminal managers should make efforts to develop strategic initiatives that not only enhance customer loyalty but also encourage loyal users to actively promote terminal services. To this end, container terminal managers should consider introducing systematic loyalty programs designed to provide tangible benefits to users, such as fare discounts, priority service handling, and exclusive value-added services. In addition, efforts should be made to build or further develop digital channels, particularly those that receive and actively respond to customer feedback. Through these channels, port container terminals can expect to further strengthen users’ trust and even form emotional bonds.

6.4. Limitations and Future Research Directions

First, the five PSQ dimensions in the research model presented in this study are formative constructs, each comprising multiple specific items. This suggests that these PSQ dimensions could be further conceptualized into more detailed subdimensions. Accordingly, future research is encouraged to develop a second-order model that systematically captures these refined subdimensions, thereby enabling a more integrated and nuanced understanding of PSQ and its influence on customer behavior.
Second, this study focused solely on container terminals in Korea that are leading smart port innovation. However, it did not account for other critical port sectors such as passenger terminals and hinterland logistics, which may exhibit distinct service structures and customer expectations. Moreover, as the analysis is confined to a single-country context, the findings may lack comparative insights across different geographic or economic regions. Therefore, it is necessary for future research to develop sector-specific PSQ models that reflect the unique characteristics of these other domains and to incorporate cross-country empirical comparisons, thereby enhancing the generalizability and applicability of PSQ research across the broader port ecosystem.

Author Contributions

Conceptualization, L.Z. and W.S.; methodology, L.Z.; software, L.Z.; validation, L.Z. and W.S.; formal analysis, L.Z.; investigation, L.Z.; resources, L.Z.; data curation, L.Z. and W.S.; writing—original draft preparation, L.Z.; writing—review and editing, L.Z. and W.S.; visualization, L.Z. and W.S.; supervision, W.S.; project administration, W.S. All authors have read and agreed to the published version of the manuscript.

Funding

This work was supported by the Ministry of Education of the Republic of Korea and the National Research Foundation of Korea (NRF-2022S1A5C2A03093690).

Data Availability Statement

All data generated or analyzed during this study are included in this article. The raw data is available from the corresponding author upon reasonable request.

Acknowledgments

The authors wish to thank the editors and anonymous referees for their helpful comments and suggested improvements.

Conflicts of Interest

The authors declared no potential conflicts of interest concerning this article’s research, authorship, or publication.

Appendix A

Table A1. Summary of Theoretical and Practical Contributions.
Contribution AreaKey Insights and Impacts
Theoretical
  • Extended the PSQ study based on ROPMIS model to the smart port context, broadening its applicability to digitally transformed environments.
  • Revealed a shift in key PSQ dimensions: Unlike prior studies, this study identifies resources, process, and image & social responsibility as the strongest predictors of customer satisfaction.
  • Established a holistic path model linking PSQ to satisfaction, loyalty, and referral intention, offering a more comprehensive explanation of the influence caused by PSQ on customer behavior in the context of smart ports.
Practical
  • Provided targeted improvement strategies for key significant PSQ dimensions (resources, process, image & social responsibility).
  • Suggested actionable strategies to enhance customer satisfaction, including feedback collection, performance benchmarking, customer interviews, and continuous monitoring through satisfaction surveys.
  • Proposed strategies to strengthen loyalty-driven referrals, including loyalty reward programs and interactive digital feedback platforms.

References

  1. Jun, W.K.; Lee, M.K.; Choi, J.Y. Impact of the smart port industry on the Korean national economy using input-output analysis. Transp. Res. A Policy Pract. 2018, 118, 480–493. [Google Scholar] [CrossRef]
  2. Rachman, A.; Wahid, A. The Influence of Service Quality, Relationship Quality on Port Performance Which has Implications For Customer Satisfaction at The Port Tg. Priok Jakarta Indonesia. Int. J. Adv. Multidiscip. 2023, 2, 475–487. [Google Scholar] [CrossRef]
  3. Zheng, S.; Negenborn, R.R. Centralization or decentralization: A comparative analysis of port regulation modes. Transp. Res. Part E Logist. Transp. Rev. 2014, 69, 21–40. [Google Scholar] [CrossRef]
  4. Chang, Y.T.; Shin, S.H.; Lee, P.T.W. Economic impact of port sectors on South African economy: An input–output analysis. Transp. Policy 2014, 35, 333–340. [Google Scholar] [CrossRef]
  5. Rodrigo González, A.; González Cancelas, N.; Molina Serrano, B.; Orive, A.C. Preparation of a smart port indicator and calculation of a ranking for the spanish port system. Logistics 2020, 4, 9. [Google Scholar] [CrossRef]
  6. Hsu, C.T.; Chou, M.T.; Ding, J.F. Key factors for the success of smart ports during the post-pandemic era. Ocean Coast. Manag. 2023, 233, 106455. [Google Scholar] [CrossRef]
  7. Molavi, A.; Lim, G.J.; Race, B. A framework for building a smart port and smart port index. Int. J. Sustain. Transp. 2020, 14, 686–700. [Google Scholar] [CrossRef]
  8. Othman, A.; El gazzar, S.; Knez, M. A framework for adopting a sustainable smart sea port index. Sustainability 2022, 14, 4551. [Google Scholar] [CrossRef]
  9. Belmoukari, B.; Audy, J.F.; Forget, P. Smart port: A systematic literature review. Eur. Transp. Res. Rev. 2023, 15, 4. [Google Scholar] [CrossRef]
  10. Intralink. Marine Industry 4.0 South Korea; Department for International Trade: Seoul, Republic of Korea, 2021.
  11. UNCTAD. Review of Maritime Transport 2022. Available online: https://unctad.org/publication/review-maritime-transport-2022 (accessed on 10 October 2024).
  12. Beškovnik, B.; Bajec, P. Strategies and approach for smart city–port ecosystems development supported by the internet of things. Transport 2021, 36, 433–443. [Google Scholar] [CrossRef]
  13. Kusuma, A.T.; Supangkat, S.H. Metaverse fundamental technologies for smart city: A literature review. In Proceedings of the 2022 International Conference on ICT for Smart Society (ICISS), Bandung, Indonesia, 10–11 August 2022; pp. 1–7. [Google Scholar]
  14. Yaqoob, I.; Salah, K.; Jayaraman, R.; Omar, M. Metaverse applications in smart cities: Enabling technologies, opportunities, challenges, and future directions. Internet Things 2023, 23, 100884. [Google Scholar] [CrossRef]
  15. Wang, J.; Medvegy, G. Exploration of the future of the metaverse and smart cities. In Proceedings of the 22th International Conference on Electronic Business (ICEB), Bangkok, Thailand, 13–17 October 2022. [Google Scholar]
  16. Min, H. Developing a smart port architecture and essential elements in the era of Industry 4.0. Marit. Econ. Logist. 2022, 24, 189. [Google Scholar] [CrossRef]
  17. Su, Z.; Liu, Y.; Gao, Y.; Park, K.S.; Su, M. Critical success factors for green port transformation using digital technology. J. Mar. Sci. Eng. 2024, 12, 2128. [Google Scholar] [CrossRef]
  18. Park, H. Korea to Create a ‘Global Smart Port’ with Home-Grown Technology. Available online: https://www.smarttoday.co.kr/news/articleView.html?idxno=26703 (accessed on 15 October 2024).
  19. Yeo, G.T.; Thai, V.V.; Roh, S.Y. An analysis of port service quality and customer satisfaction: The case of Korean container ports. Asian J. Shipp. Logist. 2015, 31, 437–447. [Google Scholar] [CrossRef]
  20. Thai, V.V. The impact of port service quality on customer satisfaction: The case of Singapore. Marit. Econ. Logist. 2016, 18, 458–475. [Google Scholar] [CrossRef]
  21. Phan, T.M.; Thai, V.V.; Vu, T.P. Port service quality (PSQ) and customer satisfaction: An exploratory study of container ports in Vietnam. Marit. Bus. Rev. 2021, 6, 72–94. [Google Scholar] [CrossRef]
  22. Brooks, M.R.; Schellinck, T. Measuring port effectiveness in user service delivery: What really determines users’ evaluations of port service delivery? Res. Transp. Bus. Manag. 2013, 8, 87–96. [Google Scholar] [CrossRef]
  23. Thai, V.V. Service quality in maritime transport: Conceptual model and empirical evidence. Asia Pac. J. Mark. Logist. 2008, 20, 493–518. [Google Scholar] [CrossRef]
  24. Chang, C.H.; Thai, V.V. Do port security quality and service quality influence customer satisfaction and loyalty? Marit. Policy Manag. 2016, 43, 720–736. [Google Scholar] [CrossRef]
  25. Bagdonienė, L.; Jakštaitė, R. Estimation of loyalty programmes from customers’ point of view: Cases of three retail store chains. Eng. Econ. 2007, 55, 51–58. [Google Scholar]
  26. Ha, M.H.; Ahn, K.M. Measurement of Port Service Quality in Container Transport Logistics Using Importance-Performance Analysis: A Case of Busan Port. J. Navig. Port. Res. 2017, 41, 353–358. [Google Scholar]
  27. Amin, C.; Mulyati, H.; Anggraini, E.; Kusumastanto, T. Impact of maritime logistics on archipelagic economic development in eastern Indonesia. Asian J. Shipp. Logist. 2021, 37, 157–164. [Google Scholar] [CrossRef]
  28. Agatić, A.; Kolanović, I. Improving the seaport service quality by implementing digital technologies. Pomorstvo 2020, 34, 93–101. [Google Scholar] [CrossRef]
  29. Roh, S.; Haddoud, M.Y.; Onjewu, A.K.E.; Jang, H.; Thai, V. Revisiting the impact of container port service quality on customer satisfaction: A configuration approach. Transp. Policy 2025, 162, 221–231. [Google Scholar] [CrossRef]
  30. Kim, S.; Choi, H.; Kim, Y.S.; Yoo, H.S.; Yoo, S.C.; Kim, S.Y. A Study on the Effects of the Port Service Quality on Customer Satisfaction and Performance in Incheon Port. J. Korean Soc. Qual. Manag. 2012, 40, 543–558. [Google Scholar] [CrossRef]
  31. Park, J.H.; Woo, S.H. Determinants and Performance of Port Logistics Service Quality. J. Korea Port Econ. Assoc. 2015, 31, 15–39. [Google Scholar]
  32. Sheu, J.B.; Hu, T.L.; Lin, S.R. The Key Factors of Green Port in Sustainable Development. Pak. J. Stat. 2013, 29, 621–632. [Google Scholar]
  33. Lee, P.T.W.; Lam, J.S.L.; Lin, C.W.; Hu, K.C.; Cheong, I. Developing the fifth generation port concept model: An empirical test. Int. J. Logist. Manag. 2018, 29, 1098–1120. [Google Scholar] [CrossRef]
  34. Ferretti, M.; Schiavone, F. Internet of Things and business processes redesign in seaports: The case of Hamburg. Bus. Process Manag. J. 2016, 22, 271–284. [Google Scholar] [CrossRef]
  35. Chen, J.; Xue, K.; Ye, J.; Huang, T.; Tian, Y.; Hua, C.; Zhu, Y. Simplified neutrosophic exponential similarity measures for evaluation of smart port development. Symmetry 2019, 11, 485. [Google Scholar] [CrossRef]
  36. Botti, A.; Monda, A.; Pellicano, M.; Torre, C. The re-conceptualization of the port supply chain as a smart port service system: The case of the port of Salerno. Systems 2017, 5, 35. [Google Scholar] [CrossRef]
  37. International Maritime Organization (IMO). FAL Convention: Convention on Facilitation of International Maritime Traffic, 1965, As Amended; International Maritime Organization: London, UK, 2018; p. 8. [Google Scholar]
  38. Rukavina, B.; Panjako, A. Legal regulations for ships arriving in and/or departing from ports–Achievements and open issues. Pomorstvo 2020, 34, 121–128. [Google Scholar] [CrossRef]
  39. International Maritime Organization (IMO). Code of Practice on Security in Ports; International Maritime Organization: Geneva, Switzerland, 2003; p. 28. [Google Scholar]
  40. International Maritime Organization (IMO). MARPOL: Articles, Protocols, Annexes and Unified Interpretations of the International Convention for the Prevention of Pollution from Ships, 1973 as Modified by the Protocol of 1978 Relating Thereto (Consolidated Edition 2022); International Maritime Organization: London, UK, 2022; p. 423. [Google Scholar]
  41. Yen, B.T.H.; Huang, M.J.; Lai, H.J.; Cho, H.H.; Huang, Y.L. How smart port design influences port efficiency—A DEA-Tobit approach. Res. Transp. Bus. Manag. 2023, 46, 100862. [Google Scholar] [CrossRef]
  42. López, R.C.; Poole, N. Quality assurance in the maritime port logistics chain: The case of Valencia, Spain. Supply Chain Manag. Int. J. 1998, 3, 33–44. [Google Scholar] [CrossRef]
  43. Ha, M.S. A comparison of service quality at major container ports: Implications for Korean ports. J. Transp. Geogr. 2003, 11, 131–137. [Google Scholar] [CrossRef]
  44. Ugboma, C.; Ibe, C.; Ogwude, I.C. Service quality measurements in ports of a developing economy: Nigerian ports survey. Manag. Serv. Qual. Int. J. 2004, 14, 487–495. [Google Scholar] [CrossRef]
  45. Pantouvakis, A. Port-service quality dimensions and passenger profiles: An exploratory examination and analysis. Marit. Econ. Logist. 2006, 8, 402–418. [Google Scholar] [CrossRef]
  46. Cho, C.H.; Kim, B.I.; Hyun, J.H. A comparative analysis of the ports of Incheon and Shanghai: The cognitive service quality of ports, customer satisfaction, and post-behaviour. Total Qual. Manag. 2010, 21, 919–930. [Google Scholar] [CrossRef]
  47. Sayareh, J.; Iranshahi, S.; Golfakhrabadi, N. Service quality evaluation and ranking of container terminal operators. Asian J. Shipp. Logist. 2016, 32, 203–212. [Google Scholar] [CrossRef]
  48. Taş, A.; Yorulmaz, M. Analysis of the dimensions of service quality in liner marine transportation by structural equation modeling. Beykozad 2021, 9, 274–291. [Google Scholar] [CrossRef]
  49. Nguyen, T.Q.; Ngo, L.T.T.; Huynh, N.T.; Quoc, T.L.; Hoang, L.V. Assessing port service quality: An application of the extension fuzzy AHP and importance-performance analysis. PLoS ONE 2022, 17, e0264590. [Google Scholar] [CrossRef] [PubMed]
  50. Li, K.X.; Li, M.; Zhu, Y.; Yuen, K.F.; Tong, H.; Zhou, H. Smart port: A bibliometric review and future research directions. Transp. Res. Part E Logist. Transp. Rev. 2023, 174, 103098. [Google Scholar] [CrossRef]
  51. Parasuraman, A.; Zeithaml, V.A.; Berry, L.L. Servqual: A multiple-item scale for measuring consumer perc. J. Retail. 1988, 64, 12. [Google Scholar]
  52. Cronin, J.J., Jr.; Taylor, S.A. Measuring service quality: A reexamination and extension. J. Mark. 1992, 56, 55–68. [Google Scholar] [CrossRef]
  53. Carman, J.M. Consumer perceptions of service quality: An assessment of T. J. Retail. 1990, 66, 33. [Google Scholar]
  54. Baker, J.; Lamb, J.C.W. Measuring architectural design service quality. J. Prof. Serv. Mark. 1994, 10, 89–106. [Google Scholar] [CrossRef]
  55. Brady, M.K.; Cronin, J.J., Jr. Some new thoughts on conceptualizing perceived service quality: A hierarchical approach. J. Mark. 2001, 65, 34–49. [Google Scholar] [CrossRef]
  56. Le, D.N.; Nguyen, H.T.; Truong, P.H. Port logistics service quality and customer satisfaction: Empirical evidence from Vietnam. Asian J. Shipp. Logist. 2020, 36, 89–103. [Google Scholar] [CrossRef]
  57. Maksimchuk, O.; Pershina, T. A new paradigm of industrial system optimization based on the conception “Industry 4.0”. In Proceedings of the International Conference on Modern Trends in Manufacturing Technologies and Equipment (ICMTMTE 2017), Sevastopol, Russia, 11–15 September 2017; p. 04006. [Google Scholar]
  58. Wan, J.; Cai, H.; Zhou, K. Industrie 4.0: Enabling technologies. In Proceedings of the 2015 International Conference on Intelligent Computing and Internet of Things, Harbin, China, 17–18 January 2015; pp. 135–140. [Google Scholar]
  59. Comi, A.; Polimeni, A. Assessing the potential of short sea shipping and the benefits in terms of external costs: Application to the Mediterranean Basin. Sustainability 2020, 12, 5383. [Google Scholar] [CrossRef]
  60. Fabiano, B.; Currò, F.; Reverberi, A.P.; Pastorino, R. Port safety and the container revolution: A statistical study on human factor and occupational accidents over the long period. Saf. Sci. 2010, 48, 980–990. [Google Scholar] [CrossRef]
  61. Buiza, G.; Cepolina, S.; Dobrijevic, A.; del Mar Cerbán, M.; Djordjevic, O.; González, C. Current situation of the Mediterranean container ports regarding the operational, energy and environment areas. In Proceedings of the 2015 International Conference on Industrial Engineering and Systems Management (IESM), Seville, Spain, 21–23 October 2015; pp. 530–536. [Google Scholar]
  62. Antão, P.; Calderón, M.; Puig, M.; Michail, A.; Wooldridge, C.; Darbra, R.M. Identification of occupational health, safety, security (OHSS) and environmental performance indicators in port areas. Saf. Sci. 2016, 85, 266–275. [Google Scholar] [CrossRef]
  63. Hofmann, W.; Branding, F. Implementation of an IoT-and cloud-based digital twin for real-time decision support in port operations. IFAC-PapersOnLine 2019, 52, 2104–2109. [Google Scholar] [CrossRef]
  64. Ha, M.H.; Yang, Z.; Notteboom, T.; Ng, A.K.Y.; Heo, M.W. Revisiting port performance measurement: A hybrid multi-stakeholder framework for the modelling of port performance indicators. Transp. Res. Part E Logist. Transp. Rev. 2017, 103, 1–16. [Google Scholar] [CrossRef]
  65. Karas, A. The role of digitalization for smart port concept. In Proceedings of the 63rd International Scientific Conference on Economic and Social Development—Building Resilient Society, Zagreb, Croatia, 11–12 December 2020; pp. 406–412. [Google Scholar]
  66. Xiao, Y.; Chen, Z.; McNeil, L. Digital empowerment for shipping development: A framework for establishing a smart shipping index system. Marit. Policy Manag. 2022, 49, 850–863. [Google Scholar] [CrossRef]
  67. Unctad, W. Assessment of A Seaport Land İnterface: An Analytical Framework. In Proceedings of the United Nations Conference Trade Development World Trade Organization, Sao Paulo, Brazil, 13–18 June 2004; pp. 1–39. [Google Scholar]
  68. Burns, M.G. Port Management and Operations; CRC Press: Boca Raton, FL, USA, 2018. [Google Scholar]
  69. Ding, J.F.; Hsu, C.T.; Chou, M.T.; Ong, Y.L. A qualitative-quantitative fuzzy evaluation model for selecting an international ocean freight logistics provider. Int. J. Marit. Eng. 2021, 163, A4. [Google Scholar] [CrossRef]
  70. Zhang, M. Research on mutual promote development between smart port and supply chain. Int. Core J. Eng. 2020, 6, 174–187. [Google Scholar]
  71. Gimenez, C.; Sierra, V.; Rodon, J. Sustainable operations: Their impact on the triple bottom line. Int. J. Prod. Econ. 2012, 140, 149–159. [Google Scholar] [CrossRef]
  72. Trbojevic, V.M.; Carr, B.J. Risk based methodology for safety improvements in ports. J. Hazard. Mater. 2000, 71, 467–480. [Google Scholar] [CrossRef] [PubMed]
  73. Pettit, S.J. United Kingdom ports policy: Changing government attitudes. Mar. Policy 2008, 32, 719–727. [Google Scholar] [CrossRef]
  74. Dooms, M.; Verbeke, A. Stakeholder management in ports: A conceptual framework integrating insights from research in strategy, corporate social responsibility and port management. In Proceedings of the IAME 2007 Annual Conference, Athens, Greece, 4–6 July 2007. [Google Scholar]
  75. Donald, J.B.; David, J.C.; Bixby, C.M.; John, C.B. Supply Chain Logistics Management, 5th ed.; McGraw-Hill Education: New York NY, USA, 2020. [Google Scholar]
  76. Anderson, E.W.; Fornell, C.; Lehmann, D.R. Customer satisfaction, market share, and profitability: Findings from Sweden. J. Mark. 1994, 58, 53–66. [Google Scholar] [CrossRef]
  77. Oliver, R.L. A cognitive model of the antecedents and consequences of satisfaction decisions. J. Mark. Res. 1980, 17, 460–469. [Google Scholar] [CrossRef]
  78. Yi, Y.J. A theoretical examination of customer satisfaction research: Findings and outlook. J. Consum. Stud. 2000, 11, 139–166. [Google Scholar]
  79. Szymanski, D.M.; Henard, D.H. Customer satisfaction: A meta-analysis of the empirical evidence. J. Acad. Mark. Sci. 2001, 29, 16–35. [Google Scholar] [CrossRef]
  80. Fishbein, M.; Ajzen, I. Belief, Attitude, Intention, and Behavior: An Introduction to Theory and Research; Addison-Wesley: Reading, MA, USA, 1975. [Google Scholar]
  81. Olson, J.C.; Dover, P.A. Disconfirmation of consumer expectations through product trial. J. Appl. Psychol. 1979, 64, 179. [Google Scholar] [CrossRef]
  82. Khan, M.T. Customers loyalty: Concept & definition (a review). Int. J. Inf. Bus. Manag. 2013, 5, 168–191. [Google Scholar]
  83. Han, S.L. Effects of restaurant service quality on customer retention and word-of-mouth. J. Mark. Manag. 2004, 9, 29–46. [Google Scholar]
  84. Zeithaml, V.A.; Berry, L.L.; Parasuraman, A. The behavioral consequences of service quality. J. Mark. 1996, 60, 31–46. [Google Scholar] [CrossRef]
  85. Bell, S.J.; Auh, S.; Smalley, K. Customer relationship dynamics: Service quality and customer loyalty in the context of varying levels of customer expertise and switching costs. J. Acad. Mark. Sci. 2005, 33, 169–183. [Google Scholar] [CrossRef]
  86. Söderlund, M. Measuring customer loyalty with multi-item scales: A case for caution. Int. J. Serv. Ind. Manag. 2006, 17, 76–98. [Google Scholar] [CrossRef]
  87. Biyalogorsky, E.; Gerstner, E.; Libai, B. Customer referral management: Optimal reward programs. Mark. Sci. 2001, 20, 82–95. [Google Scholar] [CrossRef]
  88. Diamantopoulos, A.; Riefler, P.; Roth, K.P. Advancing formative measurement models. J. Bus. Res. 2008, 61, 1203–1218. [Google Scholar] [CrossRef]
  89. Hair, J.F., Jr.; Hult, G.T.M.; Ringle, C.M.; Sarstedt, M. A Primer on Partial Least Squares Structural Equation Modeling (PLS-SEM), 3rd ed.; SAGE Publications: New York, NY, USA, 2022. [Google Scholar]
  90. Eboli, L.; Forciniti, C.; Mazzulla, G. Formative and reflective measurement models for analysing transit service quality. Public Transp. 2018, 10, 107–127. [Google Scholar] [CrossRef]
  91. Alfayyadh, S.A.J. Development of the Framework for a Lean, Energy Efficient, and Environmentally Friendly Port: Umm Qasr Port as a Case Study. Ph.D. Thesis, World Maritime University, Malmö, Switzerland, 2017. [Google Scholar]
  92. Damayanti, R.; Chairunnisa, A.S.; Manapa, E.S.; Sampetoding, E.A.M.; Chan, T.K.; Idrus, M. Performance Analysis of Terminal II of The New Makassar Container Port in Supporting Logistics Distribution in South Sulawesi. Kapal Jurnal Ilmu Pengetahuan dan Teknologi Kelautan 2023, 20, 238–250. [Google Scholar] [CrossRef]
  93. Yorulmaz, M.; Taş, A. Mediating effect of customer satisfaction on the relationship between core service quality and behavioral intentions in liner shipping. Pomorstvo 2022, 36, 3–13. [Google Scholar] [CrossRef]
  94. Kim, G.H.; Ryoo, D.K. The Impact of Service Quality in the Port Logistics on Customer Satisfaction, Port Image and Relation Continuity Intention: Focused on Busan Port. J. Navig. Port. Res. 2017, 41, 423–436. [Google Scholar]
  95. Minser, J.; Webb, V. Quantifying the benefits: Application of customer loyalty modeling in public transportation context. Transp. Res. Rec. 2010, 2144, 111–120. [Google Scholar] [CrossRef]
  96. Caliskan, A.; Esmer, S. An assessment of port and shipping line relationships: The value of relationship marketing. Marit. Policy Manag. 2020, 47, 240–257. [Google Scholar] [CrossRef]
  97. Chao, S.L.; Yu, M.M.; Sun, Y.H. Ascertaining the effects of service quality on customer loyalty in the context of ocean freight forwarders: An integration of structural equation modeling and network data envelopment analysis. Res. Transp. Bus. Manag. 2023, 47, 100955. [Google Scholar] [CrossRef]
  98. Vinzi, V.E.; Trinchera, L.; Amato, S. PLS Path Modeling: From Foundations to Recent Developments and Open Issues for Model Assessment and Improvement; Springer Handbooks of Computational Statistics; Springer: Berlin/Heidelberg, Germany, 2009; pp. 47–82. [Google Scholar]
  99. Chin, W.W. The partial least squares approach to structural equation modeling. Mod. Methods Bus. Res. 1998, 295, 295–336. [Google Scholar]
  100. Paul, R.K. Multicollinearity: Causes, effects and remedies. Indian Agric. Stat. Res. Inst. 2006, 1, 58–65. [Google Scholar]
  101. Malhotra, N.K.; Kim, S.S.; Agarwal, J. Internet users’ information privacy concerns (IUIPC): The construct, the scale, and a causal model. Inf. Syst. Res. 2004, 15, 336–355. [Google Scholar] [CrossRef]
  102. Fornell, C.; Larcker, D.F. Evaluating structural equation models with unobservable variables and measurement error. J. Mark. Res. 1981, 18, 39–50. [Google Scholar] [CrossRef]
  103. Shmueli, G.; Ray, S.; Estrada, J.M.V.; Chatla, S.B. The elephant in the room: Predictive performance of PLS models. J. Bus. Res. 2016, 69, 4552–4564. [Google Scholar] [CrossRef]
  104. Shmueli, G.; Sarstedt, M.; Hair, J.F.; Cheah, J.H.; Ting, H.; Vaithilingam, S.; Ringle, C.M. Predictive model assessment in PLS-SEM: Guidelines for using PLSpredict. Eur. J. Mark. 2019, 53, 2322–2347. [Google Scholar] [CrossRef]
  105. Kano, N. Attractive quality and must-be quality. J. Jpn. Soc. Qual. Control 1984, 31, 147–156. [Google Scholar]
  106. Lazarus, R.S. Emotion and Adaptation; Oxford University Press: Oxford, UK, 1991; Volume 557. [Google Scholar]
Figure 2. Research Model.
Systems 13 00486 g002
Figure 3. Redundancy Analysis Results of Formative Measurement Models.
Systems 13 00486 g003
Figure 4. Results of Structural Model Analysis.
Systems 13 00486 g004
Table 1. Prior studies on PSQ evaluation dimensions related to the marine domain (sorted by research time).
SourcesEvaluation DimensionsResearch Contexts
López and Poole [42]“efficiency”, “timeliness”, and “security”Maritime port logistics chain with the case of Valencia and Spain
Ha [43]“information availability of port-related activities”, “port location”, “port turnaround time”, “facilities available”, “port management”, “port costs”, and “customer convenience”Major container ports in Korea
Ugboma et al. [44]SERVQUAL model dimensions Port industry in a developing country (Nigerian)
Pantouvakis [45]“services”, “security and safety”, “cleanliness”, “guidance-communication”, “parking facilities”, and “information”General ports
Thai [23]ROPMIS model dimensions Maritime transport
Cho et al. [46]“endogenous quality, “exogenous quality”, and “relational quality”Selected ports from China and Korea
Yeo et al. [19]five ROPMIS model dimensionsPorts in Korea
Thai [20]four ROPMIS model dimensionsPorts in Singapore
Sayareh et al. [47]SERVQUAL model dimensionsContainer Terminals from Bandar Abbas Port
Ha and Ahn [26]“service reliability”, “intermodal transport systems”, “value-added services”, “IC-integration”Main ports in Korea
Phan et al. [21]four ROPMIS model dimensionsPorts in Vietnam
Taş and Yorulmaz [48]ROPMIS model dimensions Freight forwarder businesses in the Turkish maritime industry
Nguyen et al. [49]SERVQUAL model dimensionsGeneral ports
Hsu et al. [6]SERVQUAL model dimensionsSmart ports
Li et al. [50]“educational level of port talent”, “logistics services”, “production management”, “hub infrastructure”Smart ports
Note: SERVQUAL model dimensions—“tangibles”, “reliability”, “responsiveness”, “assurance”, and “empathy”; ROPMIS model dimensions—“resources”, “outcomes”, “process”, “management”, “image”, and “social responsibility”; five ROPMIS model dimensions—“resources”, “outcomes”, “process”, “management”, “image & social responsibility”; four ROPMIS model dimensions—“outcomes”, “process”, “management”, “image & social responsibility”.
Table 2. Sample characteristics.
CharacteristicsOptionsNo. (n = 324)(%)
Field of WorkShipping Companies6118.69%
Freight Forwarders7723.68%
Logistics Enterprises13341.12%
Others5316.51%
Company Size1–50 Employees11836.42%
51–100 Employees7523.15%
101–300 Employees6720.68%
301–500 Employees268.02%
Over 500 Employees3811.73%
PositionVice President or above82.47%
Manager/Assistant Manager134.01%
Director/Vice Director12839.51%
Normal Staff17152.78%
Other Positions41.23%
Experience (Years)Less than 5 Yrs9629.63%
5–10 Yrs8626.54%
11–15 Yrs6018.52%
16–20 Yrs5015.43%
21–25 Yrs247.41%
26–30 Yrs41.23%
More than 31 Yrs41.23%
Table 3. Research Constructs and Measurement Items.
ConstructsCodesMeasurement ItemsSources
Resource (R)R1The container terminals that we currently use feature the latest smart technology, equipment, and facilities, enabling us to meet our requirements.Yeo et al. [19], Thai [23], Alfayyadh [91], Damayanti et al. [92], Yorulmaz and Taş [93]
R2The container terminals that we currently use maintain advanced equipment and facilities in good condition, ensuring proper functionality.
R3The container terminals that we currently use have a solid and stable financial status.
R4The container terminals that we currently use provide accurate and real-time shipment tracking information.
R5The container terminals that we currently use have excellent and adequate physical infrastructure, including berths, yards, land spaces, warehouses, distribution centers, and hinterland connection networks.
R6The container terminals that we currently use have skilled human resources who specialize in operations related to maritime transportation.
R-globalThe overall quality of resources provided by the container terminals that we currently use is excellent. (Here, “resources” refers to physical, human, intangible, financial resources, etc.)Self-developed
Outcome (O)O1The container terminals that we currently use provide fast service.Yeo et al. [19], Thai [20,23], Phan et al. [21], Alfayyadh [91], Damayanti et al. [92], Yorulmaz and Taş [93], Kim and Ryoo [94]
O2The container terminals that we currently use provide reliable service.
O3The container terminals that we currently use provide services in a consistent manner while maintaining the same high quality.
O4The container terminals that we currently use ensure the safety and security of our ships/shipments.
O5The container terminals that we currently use produce error-free invoices and other documents.
O6The container terminals that we currently use offer competitive prices for services.
O-globalThe overall quality of service outcomes provided by the container terminals that we currently use is excellent. (Here, “outcomes” refers to shipping, documentation, price, etc.)Self-developed
Process (P)P1The container terminals that we currently use have staff who exhibit a professional attitude and behavior in meeting our requirements throughout the service process.Alfayyadh [91], Damayanti et al. [92], Kim and Ryoo [94], Phan et al. [21], Thai [20,23], Yeo et al. [19], Yorulmaz and Taş [93]
P2The container terminals that we currently use have staff who quickly respond to our inquiries and requests throughout the service process.
P3The container terminals that we currently use have staff who are knowledgeable about our requirements throughout the service process.
P4The container terminals that we currently use apply ICT throughout the service provision process.
P5The container terminals that we currently use operate service schedules and processes appropriately and efficiently.
P-globalThe overall quality of service provided by the container terminals that we currently use is excellent.Self-developed
Management (M)M1The container terminals that we currently use have effectively adopted ICT to enhance operations and management.Thai [20,23], Yeo et al. [19], Alfayyadh [91]; Damayanti et al. [92], Phan et al. [21], Yorulmaz and Taş [93]
M2The container terminals that we currently use show a high level of efficiency in operation and management.
M3The container terminals that we currently use appear to be paying a lot of attention to collecting feedback on service from customers and reflecting on it to improve operation and management.
M4The container terminals that we currently use appear to be continuously improving their operations and management to be more customer-oriented.
M5The container terminals that we currently use ensure management with professional knowledge and capabilities, including accident handling capabilities.
M6The container terminals that we currently use appear to be managing its workers well so that the site operates efficiently and smoothly.
M-globalThe overall management quality of the operation provided by the container terminals that we currently use is excellent.Self-developed
Image & Social responsibility (IS)IS1The container terminals that we currently use have not experienced cases of lost or damaged transported goods in the past.Yeo et al. [19], Thai [20,23], Phan et al. [21], Alfayyadh [91], Damayanti et al. [92], Yorulmaz and Taş [93], Kim and Ryoo [94]
IS2The container terminals that we currently use have a good reputation for their quality and customer-oriented services.
IS3The container terminals that we currently use place great emphasis on operations and operational safety, and their performance in this regard appears to be good.
IS4The container terminals that we currently use appear to be fulfilling their social responsibilities to their employees and other stakeholders.
IS5The container terminals that we currently use appear to be paying attention to compliance with international standards of quality, environmental management, energy management, occupational health and safety (ISO 14001, OHSAS 18001 etc.) for improving social responsibility.
IS6The container terminals that we currently use appear to have efficient environment and energy management systems and to emphasize operation that takes the environment and renewable energy into consideration.
IS-globalThe overall image and social responsibility efforts of the container terminals that we currently use appear to be excellent.Self-developed
Customer satisfaction (CS)CS1I am happy with the container terminals that we currently use.Kim and Ryoo [94], Minser and Webb [95]
CS2I am satisfied with the container terminals that we currently use.
CS3I think it was a wise decision for our company to choose the container terminals that we currently use.
CS4I believe that our company has made the right decision in choosing the container terminals that we currently use.
Customer loyalty (CL)CL1I hope that my company continues to develop its relationship with the container terminals that we currently use in the future.Chang and Thai [24], Caliskan and Esmer [96], Chao et al. [97]
CL2I will inform the terminals for the sake of their development if I find any shortcomings in the service of the container terminals that we currently use.
CL3I hope that, when selecting the partner terminal, my company considers the container terminals that we currently use as the first option.
CL4I hope that even if the usage costs of the container terminals that we currently use increase, our company will continue to utilize the terminals.
Customer referral intention (CRI)CRI1I am willing to recommend the container terminals that we currently use to our business partners. Kim and Ryoo [94], Caliskan and Esmer [96]
CRI2I will say positive things about the container terminals that we currently use for our business partners.
CRI3I have referred to the container terminals that we currently use with our business partners frequently.
CRI4I am willing to continue to positively mention the container terminal we currently use to our business partners.
Table 4. Formative Measurement Items’ Collinearity and Significance.
ConstructsItemsOuter Weightst-Statisticsp-ValuesOuter LoadingsVIF
Resource (R)R1−0.072 0.846 0.398 0.6622.195
R20.256 3.193 0.001 0.783 2.283
R30.341 4.906 0.000 0.810 1.795
R40.194 2.727 0.006 0.757 1.828
R50.218 2.740 0.006 0.800 2.070
R60.297 3.697 0.000 0.841 2.182
Outcome (O)O10.296 5.322 0.000 0.838 2.303
O20.079 1.358 0.175 0.785 2.413
O30.180 2.817 0.005 0.840 2.572
O40.120 1.736 0.083 0.779 2.401
O50.150 1.726 0.084 0.704 1.775
O60.413 3.440 0.001 0.816 1.688
Process (P)P10.162 2.957 0.003 0.836 2.398
P20.123 1.047 0.295 0.759 2.183
P30.208 2.959 0.003 0.762 1.948
P40.402 5.899 0.000 0.894 2.447
P50.285 4.713 0.000 0.886 2.568
Management (M)M10.317 4.884 0.000 0.868 2.200
M20.144 1.859 0.063 0.779 2.187
M30.189 2.179 0.029 0.803 2.296
M40.117 1.778 0.075 0.784 2.241
M50.128 0.504 0.615 0.769 2.382
M60.302 5.010 0.000 0.890 2.621
Image & Social responsibility (IS)IS10.306 0.987 0.324 0.719 1.915
IS20.182 4.301 0.000 0.839 2.158
IS30.291 4.262 0.000 0.864 2.279
IS40.051 3.344 0.001 0.828 2.166
IS50.090 2.672 0.008 0.784 2.039
IS60.266 2.572 0.010 0.769 1.909
Table 5. Reflective Measurement Constructs’ Reliability and Convergent Validity.
ConstructsIndicatorLoadings (>0.7)Composite Reliability (>0.7)Cronbach’s Alpha (>0.7)AVE (>0.5)
Customer satisfaction (CS)CS10.8490.940.9230.722
CS20.857
CS30.833
CS40.851
Customer loyalty (CL)CL10.770.9270.9080.647
CL20.729
CL30.82
CL40.817
Customer referral intention (CRI)CRI0.8870.9250.8920.756
CR20.854
CR30.849
CR40.886
Table 6. Results of Fornell-Larcker Criterion Analysis for Discriminant Validity Assessment.
CSCLCRI
Customer satisfaction (CS)0.865
Customer loyalty (CL)0.7890.815
Customer referral intention (CRI)0.7970.7750.869
Note: Diagonal elements are the square roots of AVEs.
Table 7. Significance Testing Results of Structural Model Path Coefficients.
HypothesesPathsPath Coefficientst-Statisticsp-ValuesSupported?
H1Resource-related PSQ (R) -> Customer satisfaction (CS)0.1683.4850.000Supported
H2Outcome-related PSQ (O) -> Customer satisfaction (CS)0.0600.9960.319Not Supported
H3Process-related PSQ (P) -> Customer satisfaction (CS)0.2272.6340.008Supported
H4Management-related PSQ (M) -> Customer satisfaction (CS)0.0961.3930.164Not Supported
H5Image & Social responsibility-related PSQ (IS) -> Customer satisfaction (CS)0.1686.2280.000Supported
H6Customer satisfaction (CS) -> Customer loyalty (CL)0.78933.4010.000Supported
H7Customer satisfaction (CS) -> Customer referral intention (CRI)0.4918.3010.000Supported
H8Customer loyalty (CL) -> Customer referral intention (CRI)0.3885.9770.000Supported
Table 8. Cross-Validated Predictive Ability Test (CVPAT) Summary (PLS-SEM vs. Linear Model).
PLS LossLM LossAverage Loss Differencet-Statisticsp-Value
Customer satisfaction (CS)0.531 0.563 −0.032 2.193 0.029
Customer loyalty (CL)0.740 0.795 −0.055 2.130 0.034
Customer referral intention (CRI)0.677 0.749 −0.072 2.847 0.005
Overall0.649 0.702 −0.053 3.805 0.000
Table 9. Cross-Country Comparison of PSQ Studies Based on the ROPMIS Model.
SourceCountry/ContextSEM TypeROPMIS Dimensions UsedSignificant DimensionsNot Significant Dimensions
Yeo et al. [19]Korea (traditional container ports)PLS-SEMresources, outcomes, process, management, image & social responsibilitymanagement, image & social responsibilityresources, outcomes, process
Thai [20]Singapore (port)CB-SEMoutcomes, process, management, image & social responsibilityall 4 dimensionsnone
Phan et al. [21]Vietnam (ports)CB-SEMoutcomes, process, management, image & social responsibilityall 4 dimensionsnone
AuthorKorea (container terminals amid smart port development context)PLS-SEMresources, outcomes, process, management, image & social responsibilityprocess, resources, image & social responsibilityoutcomes, management
Disclaimer/Publisher’s Note: The statements, opinions and data contained in all publications are solely those of the individual author(s) and contributor(s) and not of MDPI and/or the editor(s). MDPI and/or the editor(s) disclaim responsibility for any injury to people or property resulting from any ideas, methods, instructions or products referred to in the content.

