Article

Spatiotemporal Evolution of and Regional Differences in Consumer Disputes in the Tourism System: Empirical Evidence from the Yangtze River Economic Belt, China

School of Economics and Management, Yanshan University, Qinhuangdao 066004, China
*
Author to whom correspondence should be addressed.
Systems 2025, 13(6), 473; https://doi.org/10.3390/systems13060473
Submission received: 4 May 2025 / Revised: 11 June 2025 / Accepted: 13 June 2025 / Published: 15 June 2025
(This article belongs to the Section Systems Practice in Social Science)

Abstract

:
The global tourism industry is currently experiencing a significant boom, leading to increasing prosperity in the tourism economy. However, litigation disputes and conflicts between tourism consumers and operators have become more frequent, severely disrupting the smooth functioning of tourism markets. Therefore, clarifying the spatiotemporal attributes and distributional characteristics of tourism disputes in destinations holds substantial significance for destination market governance and the sustainable development of tourism systems. Taking China’s Yangtze River Economic Belt as a case study, this research employs the geographic concentration index, the gravity center model, and the Dagum Gini coefficient to analyze the spatiotemporal patterns of different types of tourism disputes and their watershed-specific variations from 2013 to 2024. The results demonstrated that tourism disputes exhibited an increase–decrease–increase inter-annual trend. The downstream basin had the most disputes, followed by the upstream and midstream ones. Areas with a high and low incidence of disputes were interspersed, with low spatial agglomeration. The gravity center was in Hubei Province. Basin differences changed in a fluctuating manner. Basin differences were large at the beginning of the study period, and thereafter the basin differences decreased in a fluctuating manner. The inter-basin differences were more significant for travel agency disputes and catering disputes. Overall, this study effectively presented the temporal distribution characteristics, spatial evolution characteristics, and basin differences in tourism disputes using mathematical statistics, geospatial analysis, and other methods.

1. Introduction

In recent years, the global tourism industry has shown strong growth. According to the World Tourism Barometer released by the United Nations Tourism Organization, the number of international tourists will reach 1.4 billion in 2024, with per capita tourism spending reaching USD 1100 and tourism revenues reaching USD 1.6 trillion, representing a year-on-year increase of 3%. The Middle East, Europe, and the Asia–Pacific region are particularly prominent as popular cultural tourism destinations. However, under the surface of the booming industry, numerous explicit and implicit conflicts exist among tourism consumers, tour operators, and ancillary service providers [1]. The frequent occurrence of tourism disputes is becoming a hidden crisis that restricts the sustainability of tourism. In China, for example, in 2024, China’s Ministry of Culture and Tourism launched a special rectification campaign for the tourism market, with law enforcement officers inspecting more than 133,000 businesses across the country and investigating 2660 cases of illegal business operations. Tour guides verbally abusing tourists, false advertising, defrauding tourists to spend money, forcing tourists to shop, the unauthorized operation of travel agency businesses, and other industry irregularities are common, triggering several tourism litigation disputes [2,3]. Such dilemmas not only harm the rights and interests of consumers, but also erode the credibility of the industry. The tourism market and destination governance continue to face significant challenges.
Tourism disputes are disputes occurring among tourism consumers, tourism operators, and ancillary service providers. Stakeholder theory proposes that sustainable tourism development relies on balancing rights, interests, and synergies among stakeholders [4]. The tourism system involves multiple stakeholders including tourism consumers, enterprises, destination residents, and government administrations [5]. However, information asymmetry theory posits that tourism market asymmetries disadvantage consumers [6,7]. Tourism operators monopolize the market discourse, trapping consumers in false advertising, forced consumption, safety negligence, and contractual exploitation. Such market disorder violates consumer protection theory, damaging tourists’ rights to fair trade, safety, security, and information [8,9]. Similarly, social conflict theory posits that resource inequality creates opposing group interests [10]. In tourism contexts, operators pursue profit maximization, while consumers seek value-for-money. This creates confrontations from unequal benefit distribution, causing disputes over opaque pricing, service degradation, and contractual failures [2]. The man–land relationship theory suggests that human behavior and activities are influenced by the geographical environment; geographical space imposes certain constraints on tourism consumption activities [11,12,13]. Based on the production of space theory, capital, power, and space continuously generate contradictions in the process of restructuring, manifesting as the geographical distribution of tourism disputes [14,15,16]. The dynamic interplay of human–environment relations across different regions leads to geographical variations in the distribution of tourism disputes. For example, in capital-intensive urban tourism circles (such as around Shanghai Disneyland), travel agency contract disputes and hotel overbooking issues are prevalent. In regions with rich natural landscapes and complex terrain conditions, tourism site disputes are more common. In regions with complex and variable climates and rugged, dangerous terrain, passenger transportation disputes are more prominent. This imbalanced spatial distribution represents the geographical projection of resource interest conflicts in tourism economic activities across different spatial scales.
Collaborative governance theory emphasizes solving social problems through institutionalized collaboration, resource sharing, and responsibility sharing [17,18]. Due to their multi-stakeholder nature and complex conflict dynamics, tourism disputes require resolution through collaborative governance [19]. Stakeholder theory indicates that tourism dispute governance requires multi-party participation including governments, enterprises, consumers, and social organizations [20,21]. Governments must enhance institutional laws/regulations and strengthen regulatory oversight. Tourism enterprises should operate in good faith and fulfill contractual obligations. Consumers must actively safeguard their rights and employ legal mechanisms. Tourism social organizations should conduct oversight and promote industry standardization. Therefore, a comprehensive tourism legal system is key to resolving tourism disputes [3]. In this context, scholars have extensively discussed the legal framework of tourism [22,23], basic theories of tourism law [24], basic principles of tourism law [23], judicial application of tourism litigation [25], and overlapping of tourism laws at various levels [2]. This research provides a legal basis and practical guidance for resolving tourism disputes. Previous studies have mainly focused on conventional tourism consumption and service dispute issues, such as the legal regulation of hotel service quality [26], legal supervision of the shared accommodation industry [27], legal regime of cruise tourism [28], and regulation of big data on e-commerce travel platforms [8,29]. Due to the complexity of the causes of tourism disputes, including tourism operation, consumption, management, and other relationships, research on tourism disputes has focused on the perspectives of tourism consumers, operators, administration, and management. Examples include the protection of tourism consumers’ rights and interests [9,26,27,30], evaluation of tourism consumers on the regulation of the tourism market [30], assessment of tourism enterprise laws [31], illegal business of tourism operators [1], and tourism policies at national and governmental levels [25,32,33]. Most existing studies have used qualitative research methods, such as literature reviews, case studies, and content analyses. The results were mainly expositions, with the conclusions lacking data support and testing. In recent years, scholars have gradually broken through the traditional research paradigm and applied game theory [34], dynamic panel models [35,36,37], double-difference models [31], questionnaire surveys [3], causality analyses [38], and other quantitative research methods to examine tourism disputes and explore the effects of tourism laws on tourism industry development. These studies have laid the foundation for subsequent quantitative research on tourism disputes.
Previous studies have conducted useful explorations of tourism disputes and related issues; however, several limitations remain. First, based on the man–land relationship theory and production of space theory [11,12,13,14,15,16], tourism activities have strong spatiotemporal attributes, and tourism disputes also exhibit spatial variations in their distribution. However, existing tourism dispute studies primarily adopt legal perspectives, largely neglecting spatiotemporal dimensions. Conversely, analogous research on land disputes earlier addressed spatiotemporal evolution patterns. For example, Tan et al. [39] analyzed land dispute distributions in China’s Yangtze River Economic Belt using GIS spatial analysis and the Theil Index. Therefore, future research should examine tourism disputes’ geospatial distribution patterns. Moreover, existing research has not sufficiently explored the industry types, travel agencies, scenic spots, and other tourism industry segments involved in various types of tourism disputes. Furthermore, existing quantitative research on tourism disputes has mainly employed econometric methods to explore the effects of tourism laws on tourism development, whereas the application of other research methods remains scarce.
This study focuses on tourism consumer disputes and selects China’s Yangtze River Economic Belt as the case study area. The Yangtze River Economic Belt spans China’s eastern and western regions, connecting its southern and northern areas, and serves as a vital hub for tourism development. However, frequent tourism disputes have tarnished its image and severely hindered the sustainable operations of the destination’s tourism industry. The Yangtze River Economic Belt encompasses 11 provinces, with a total basin length of more than 6300 km. It is internally divided into upstream, midstream, and downstream areas. Differences exist in the foundation of tourism development, level of tourism economy, tourism laws, and regulations of tourism markets among provinces and watersheds [40]. Tourism disputes are also characterized by clear spatial and watershed differences. The tourism industry comprises various actors, such as travel agencies, catering, accommodation, and transport [41,42]. Consequently, tourism disputes involve various types of travel agencies, scenic spots, and hotels. Therefore, the governance of tourism disputes must comprehensively consider individual, local, and type variability. Research should examine the distribution patterns of various types of tourism disputes from the province and river basin perspectives. This would help the tourism administration to rationally allocate resources among provinces, delineate key provinces for dispute prevention and control, and formulate differentiated dispute management strategies. Moreover, it would clarify the internal and external regional gaps in tourism disputes among river basins; provide a foundation for eliminating barriers to basin cooperation in dispute governance; and help promote cooperation in tourism market regulation in the upstream, midstream, and downstream areas. Furthermore, it would help identify the characteristics of tourism disputes in provinces and basins, provide a scientific basis for classifying tourism disputes, and present a reference for administrative departments to adjust disciplinary efforts to tourism violations by industry and type. Therefore, scientifically grasping the distribution and occurrence patterns of tourism disputes across temporal, spatial, and basin scales is crucial for resolving such disputes and optimizing tourism market governance in the Yangtze River Economic Belt.
In summary, this study uses China’s Yangtze River Economic Belt as the case study area. Geographic methods including the concentration index, standard deviational ellipse, gravity model, and others are employed. At the geospatial scale, dynamic trends of tourism disputes across time, space, and basins in the belt’s 11 provinces (2013–2024) are analyzed by province, basin, and type. Tourism disputes are classified into five categories as per the UNWTO’s International Recommendations on Tourism Statistics, China’s National Statistical Classification, and litigation content: travel agency, scenic spot, hotel, catering, and passenger transportation. Travel agency disputes involve service contract conflicts between tourism consumers and agencies during conclusion, fulfillment, or termination. Scenic spot disputes concern conflicts between tourists and management regarding services, facilities, safety, and tickets, etc. Hotel disputes involve lodging contract conflicts between tourism consumers and operators during conclusion, fulfillment, or termination, covering service quality, safety, and payments. Catering disputes arise between tourism consumers and operators over food safety, service quality, and price transparency, etc. Passenger transportation disputes involve conflicts between travelers and carriers arising from transportation service contracts, covering transportation safety, delay compensation, and baggage loss. This study aimed to provide theoretical support and practical guidance for the governance of tourism disputes and regulation of the tourism market in the Yangtze River Economic Belt.

2. Theoretical Framework and Research Logic of Tourism Disputes

2.1. Mechanisms and Theoretical Framework of Tourism Disputes

Accident causation theory is a theoretical framework for exploring the essence of accidents, their triggering factors, and the progression of their development. In 1931, Heinrich proposed the accident causal chain theory, which posits that accidents are not caused by a single factor, but rather by the combined influence of multiple factors. He also introduced the “human–mechanism–environment–management” framework for accident causation theory [43]. Based on this, this paper introduces the theoretical framework of “human, mechanism, environment, and management” into the analysis of the causal mechanisms of tourism disputes. We adopt accident causation theory as the core theoretical framework, analyzing the causal logic and driving mechanisms of tourism disputes in four dimensions: human factors, mechanism factors, environmental factors, and management factors. Supplementary theories such as the stakeholder theory, information asymmetry theory, social conflict theory, consumer protection theory, man–land relationship theory, production of space theory, and collaborative governance theory are employed to further elaborate on each dimension of the accident causation theory’s “human-mechanism-environment-management” framework. Among these, stakeholder theory, information asymmetry theory, social conflict theory, and consumer protection theory are primarily used to supplement the explanation of tourism disputes’ causal mechanisms. The man–land relationship theory and production of space theory are employed to explain the intrinsic reasons for tourism disputes’ spatial differences. Collaborative governance theory is used to supplement governance approaches to tourism disputes. Therefore, under a combined analysis of core and supplementary theories, the causal mechanisms and theoretical framework of tourism disputes are established (Figure 1).
In terms of human factors, tourism disputes arise between tourism consumers, tourism operators, and tourism auxiliary service providers, involving numerous stakeholders [4]. Tourism operators and tourism auxiliary service providers together constitute the subject of tourism disputes, while tourism consumers constitute the object of tourism disputes. In terms of institutional factors, the complex tourism industry chain, diverse stakeholders, and supply–demand contradictions in the tourism market have collectively contributed to the outbreak of tourism disputes. Specifically, the tourism industry chain is diverse and complex, with a rich supply of market offerings involving numerous tourism operators and auxiliary service providers such as travel agencies, catering services, hotels, scenic spots, and tourism transportation [20]. Stakeholder theory and social conflict theory reveal that conflicts of interest among stakeholders such as travel agencies, tourist attractions, and tourists within the industry chain lead to imbalances in strategic interactions [5]. Tourism suppliers exploit information monopolies (e.g., ambiguous contract terms, false advertising) to mislead consumer decisions, exacerbating trust crises [6,7]. This leads to frequent conflicts of interest and unequal resource allocation between tourism consumers on the demand side and tourism operators on the supply side, resulting in severe damage to consumer rights protection [8,9]. In terms of environmental factors, tourism consumers and tourism operators are influenced by multiple factors, including economic (e.g., price disputes, cost equilibrium), social (e.g., cultural conflicts, insufficient community participation), environmental (e.g., ecological damage, overcapacity), and managerial (e.g., regulatory gaps, lack of service standards) factors. Under the combined influence of economic pressure, social pressure, and ecological and environmental pressure, explicit and implicit conflicts between tourism consumers and tourism operators are constantly expanding and erupting. From a management perspective, collaborative governance theory emphasizes that the resolution of tourism disputes requires the joint participation of multiple stakeholders, including government departments, tourism enterprises, industry associations, and the public [17,18]. However, the current tourism market still faces issues such as incomplete laws and regulations, an inadequate dispute resolution system, and lax market supervision. These management gaps and shortcomings provide opportunities for tourism disputes to erupt.
As a result, under the combined influence of personnel factors, institutional factors, environmental factors, and management factors, contradictions and conflicts continue to accumulate, leading to various types of tourism disputes. Due to the complexity of tourism activities, the characteristics of human–land relationships, and spatial production attributes [13,16], tourism disputes exhibit differences in type (e.g., travel agency disputes, scenic area disputes, hotel disputes), temporal and spatial distribution, and regional distribution. In summary, this constitutes the causal mechanism and theoretical framework of tourism disputes.

2.2. Research Ideas and Logic

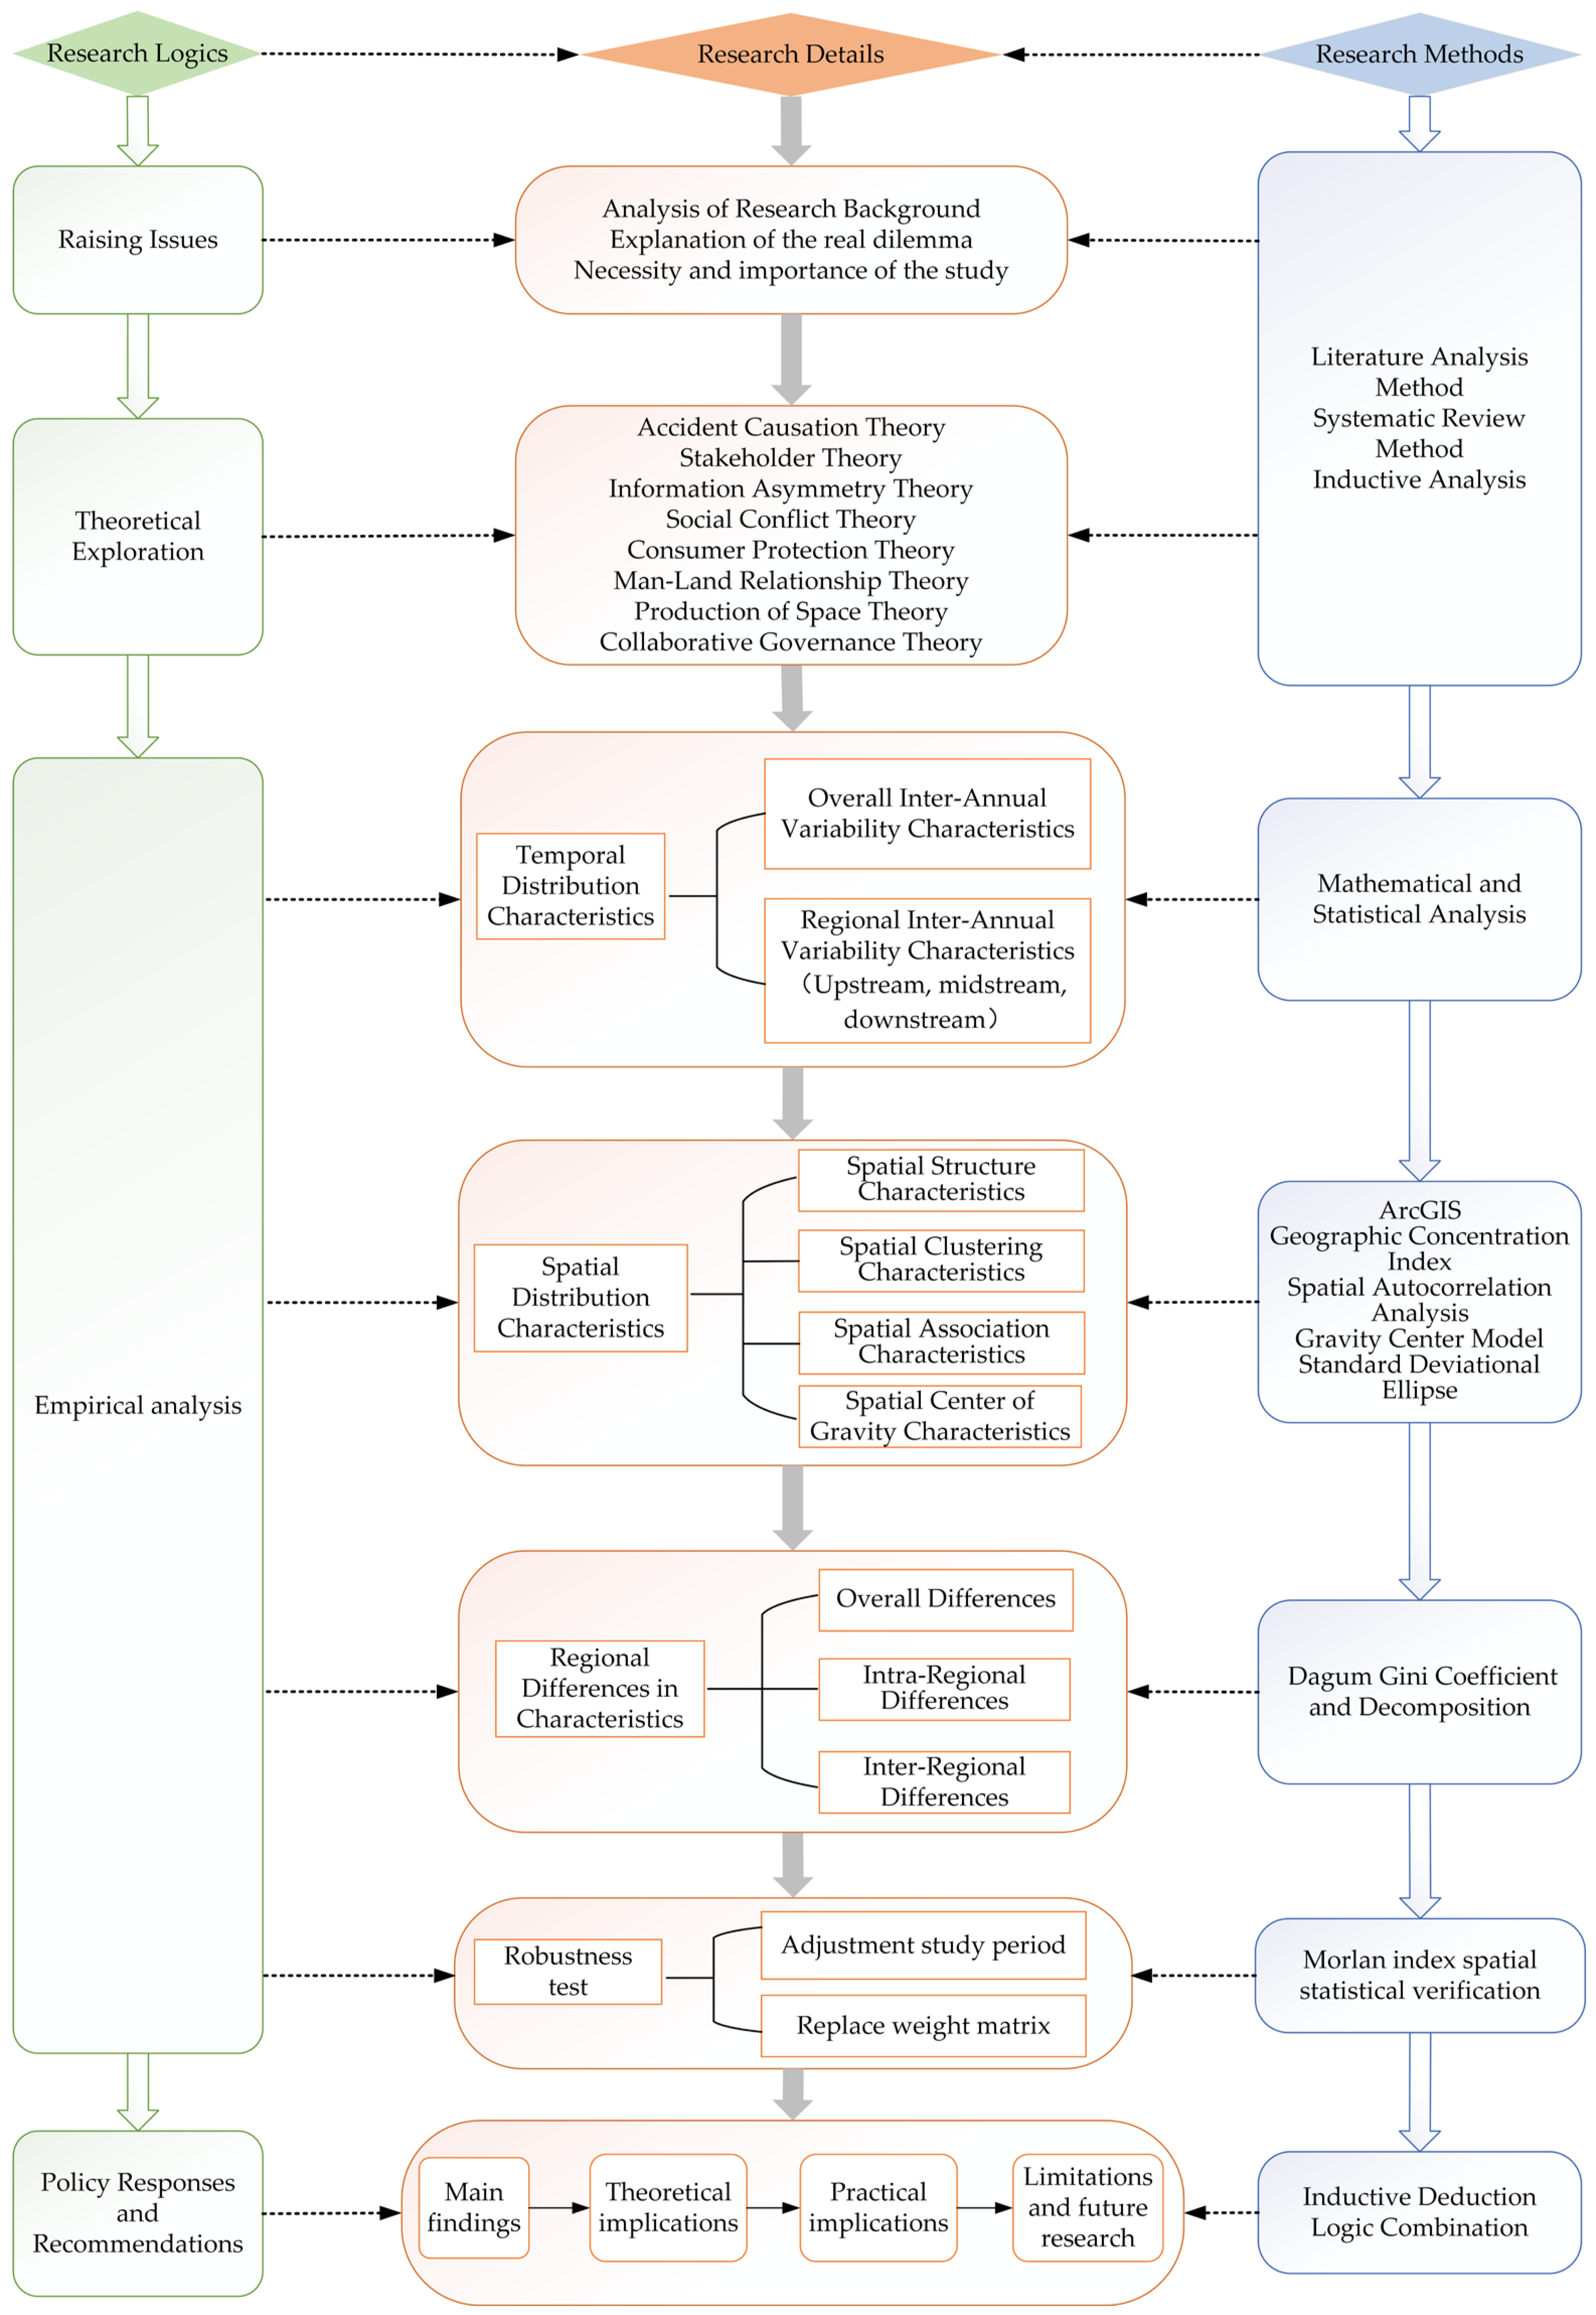
To investigate the spatiotemporal distribution patterns of tourism disputes in the Yangtze River Economic Belt, this study follows the logical framework of “raising issues → theoretical exploration → empirical analysis → policy responses and recommendations” to explore the temporal, spatial, and basin-specific characteristics of tourism disputes (Figure 2). First, the study provides a background explanation of the tourism dispute issue, highlighting the practical problems of frequent tourism disputes and the ongoing emergence of tourism conflicts and contradictions. A literature review and analysis of the relevant studies is conducted to identify the shortcomings and gaps in the existing research. The necessity and importance of conducting spatiotemporal evolution analysis of tourism disputes are explained. Second, the theoretical logic of tourism disputes based on the theoretical framework of humans, mechanisms, environment, and management is constructed. Drawing on the stakeholder theory, information asymmetry theory, social conflict theory, consumer protection theory, man–land relationship theory, production of space theory, and collaborative governance theory, the study analyzes the causes, geographical characteristics, and governance approaches of tourism disputes. Third, empirical analyses of temporal, spatial, and regional differences in tourism disputes are conducted. In terms of temporal distribution characteristics, quantitative statistical methods are used to classify and explore tourism disputes from both regional and watershed perspectives. In terms of spatial distribution characteristics (1) ArcGIS 10.6 is applied to conduct spatial visualization analyses of different types of tourism disputes. (2) Geographic concentration indices are combined to measure the degree of spatial aggregation and assess the spatial equilibrium of different types of tourism disputes. (3) Spatial autocorrelation analysis is used to determine the spatial correlation and spatial aggregation of tourism disputes, at the same tim, laying the foundation for subsequent spatial analysis research. (4) Geographic spatial analysis methods such as the gravity center model and standard deviational ellipse are employed to determine the distribution center and direction of various types of tourism disputes. In terms of basin disparity characteristics, the Dagum Gini coefficient is applied to analyze the overall differences, intra-basin differences, and inter-basin differences among various types of tourism disputes. To ensure the reliability and scientific validity of the results, robustness tests are conducted on the research findings using two methods: adjusting the study period and replacing the weighting matrix. Fourth, the main findings, theoretical contributions, and limitations of the study are summarized. Based on the conclusions of the theoretical exploration and empirical analysis, optimized recommendations and improvement strategies for governing tourism disputes are proposed.

3. Materials and Methods

3.1. Study Area

The Yangtze River Economic Belt comprises 11 provinces along the Yangtze River, covering an area of approximately 2.05 million km2. Its population and economy account for more than 40% of China’s total population and half of China’s economy, respectively. It has 3602 A-class tourist attractions, accounting for 40.23% of China’s total A-class attractions. Its access to the river and sea, favorable geographical location, abundant natural endowments, and sound infrastructure create favorable conditions for tourism development [40]. Fueled by policies such as the Outline of the Development Plan for the Yangtze River Economic Belt and Outline of the Development Plan for the Yangtze River International Golden Tourism Belt, the region’s tourism industry has formed an integrated cooperative development model and complete industry chain [6,7]. It has seen sustained growth in tourism revenue and visitor numbers, increasing the diversification of tourism products and services, and progressive enhancements in tourism infrastructure and transport networks. The Yangtze River Economic Belt is divided according to its watershed into upstream (Chongqing, Sichuan, Guizhou, and Yunnan), midstream (Hubei, Hunan, and Jiangxi), and downstream regions (Shanghai, Jiangsu, Zhejiang, and Anhui).

3.2. Methods

3.2.1. Geographic Concentration Index

Geographic concentration is used to measure the degree of concentration of the research object in the region. It can objectively quantify the aggregation and unevenness of the spatial distribution of tourism disputes with numerical values, reflecting the degree of their concentration or dispersion. It helps to clarify the degree of aggregation of various types of tourism disputes, and guides management departments to accurately target the limited regulatory resources of highly concentrated types of tourism disputes. At the same time, it has the advantages of simplicity and efficiency, strong comparability (suitable for comparative analysis across regions and time periods), and visual presentation. Therefore, this study used the geographic concentration index to measure the degree of spatial aggregation of tourism disputes [44], as follows:
G = 100 × k = 1 n X k T 2
where G is the geographical concentration of tourism disputes, X k   is the number of tourism disputes in the K t h province, n is the total number of provinces, and T is the total number of tourism disputes in the Yangtze River Economic Belt. G takes a value in the range of [0, 100], with values closer to 100 indicating a more concentrated distribution of tourism disputes and those closer to 0 indicating a more dispersed distribution.

3.2.2. Spatial Autocorrelation Analysis

Spatial autocorrelation analysis can determine whether the spatial distribution of tourism disputes in the Yangtze River Economic Belt exhibits spatial dependence and spatial association, and can identify the spatial clustering patterns of tourism disputes. It serves as an important prerequisite and necessary foundation for subsequent spatial geographic statistical analysis. Therefore, we used Global Moran’s I to explore the spatial correlation of tourism disputes. Local Moran’s I was employed to depict the spatial differences in the number of tourism disputes between regions and their adjacent areas. Combined with LISA clustering results, we investigated the spatial clustering trends of tourism disputes. The formula is as follows [45]:
G l o b a l   M o r a n I = i = 1 n j = 1 n w i j ( x i x ¯ ) ( x j x ¯ ) S 2 i = 1 n j = 1 n w i j
x ¯ = 1 n i = 1 n x i , S 2 = 1 n i = 1 n ( x i x ¯ ) 2
l o c a l   M o r a n s   I = z i · i = 1 n w i j z j
where w i j is the spatial weight matrix (1 for adjacent provinces, 0 for non-adjacent provinces), x i   and   x j   represent the number of dispute cases in adjacent provinces,   n is the number of provinces, and S 2   is the sample variance. The value range of Global Moran’s I is [−1, 1]. A positive value indicates positive spatial correlation; a negative value indicates negative spatial correlation. Z i = ( x i x ¯ ) and Z j = ( x j x ¯ ) represent the difference between the tourism dispute cases in the i and j provinces and the mean, respectively; I i > 0 indicates the aggregation of high values with high values or low values with low values; and I i < 0 indicates the aggregation of low values with high values or high values with low values.

3.2.3. Gravity Center Model

The trajectory of the movement of the geographical gravity center of elements reveals their evolution [46]. The gravity center model can intuitively reflect the overall offset direction of the distribution of tourism disputes and identify the macro distribution trend of tourism disputes. By calculating the trajectory of the gravity center in different time periods, it can reveal the spatial migration law of tourism disputes and present the dynamic evolution characteristics of dispute distribution. It helps tourism administration to dynamically adjust the supervision force and accurately grasp the key areas of tourism disputes. Therefore, the gravity center model and movement distance models were used to assess the evolution of tourism disputes [46] as follows:
M x i , y i = i = 1 n u i x i / i = 1 n u i , i = 1 n u i y i / i = 1 n u i
D m k = c · x m ¯ x k ¯ 2 + y m ¯ y k ¯ 2
where u i is the total number of tourism disputes in province   i , x i , y i are the coordinates of the geometric center of province i , x ¯ , y ¯ are the coordinates of the geographic gravity center of tourism disputes, D m k   is the distance from the gravity center offset from the m year to the k   year, and c = 111.111 (km).

3.2.4. Standard Deviational Ellipse

The standard deviational ellipse responds to the spatial characteristics of geographic elements through the azimuth, standard deviation along the x-axis, and standard deviation along the y-axis [47]. Applying it to the study of the spatial distribution of tourism disputes can provide a finer examination in terms of the dimensions of directionality, scope of concentration, and dynamic evolution. It makes up for the shortcomings of the gravity center model and the geographic concentration index that cannot capture the distribution direction of tourism disputes. It is able to identify whether tourism disputes are concentrated along a specific geographic direction, revealing the directional trend of dispute distribution. It measures the degree of spatial dispersion of disputes by judging the concentration or diffusion status of dispute distribution through the length of the long and short axes. In addition, it is able to dynamically monitor the evolution of dispute distribution by comparing the ellipse parameters (center shift, direction rotation, and axis length change) in different periods. Therefore, in this study, the standard deviational ellipse was used to explore the trends of spatial centers, distribution directions, and degree of agglomeration of tourism disputes as follows:
Mean Center:
x w ¯ = i = 1 n w i x i / i = 1 n w i ; y w ¯ = i = 1 n w i y i / i = 1 n w i
X-axis standard deviation:
σ x = i = 1 n w i x i ~ cos θ w i y i ~ sin θ 2 / i = 1 n w i 2
Y-axis standard deviation:
σ y = i = 1 n w i x i ~ sin θ w i y i ~ cos θ 2 / i = 1 n w i 2
Angle of rotation θ :
t a n θ = i = 1 n x i ~ 2 i = 1 n y i ~ 2 + i = 1 n x i ~ 2 i = 1 n y i ~ 2 + 4 i = 1 n x i ~ y i ~ 2 / 2 i = 1 n x i ~ y i ~
where w i   is the weight, x i and y i are the coordinates of the i t h province, x , y are the center coordinates of the standard deviational ellipse, n is the number of provinces, and x i ~ and y i ~ are the deviations of the i t h province from the center.

3.2.5. Dagum Gini Coefficient and Decomposition

The Dagum Gini coefficient breaks down regional differences into inter-regional and intra-regional differences, and is able to pinpoint the sources of differences. By calculating the inter-regional Gini coefficient, it is possible to identify the basins where the tourism dispute differences mainly exist. By calculating the intra-regional Gini coefficient, it is possible to identify the problem of the intra-basin polarization of tourism disputes and analyze whether the disputes are balanced within each basin. This will help to clarify the priority of tourism dispute management and provide a governance idea of “difference decomposition → precise positioning → co-ordinated management” for the study of tourism disputes in the Yangtze River Economic Belt. Therefore, the Dagum Gini coefficient and its decomposition were used to explore the overall differences   G , intra-group differences   G w , inter-group differences G n b , and their sources of contribution, G t   in tourism disputes in different regions. Larger Dagum Gini coefficients indicated greater regional differences in tourism disputes [48]. The following formula was used:
G = j = 1 k l = 1 k i = 1 n j r = 1 n l y j i y l r 2 n 2 y ¯
G = G w + G n b + G t
where k is the number of regions (upstream, midstream, or downstream), n is the number of provinces, n j n l   is the number of provinces in region j l , y ¯   is the mean value of the number of tourism disputes in all provinces, and y j i y l r   is the number of tourism disputes in province i r   within region   j l . G w , G n b , and G t   were calculated as follows [48]:
G w = j = 1 k G j j P j S j
G n b = j = 2 k l = 2 j 1 G j l P j S l + P l S j D j l
G t = j = 2 k l = 1 j = 1 G j l P j S l + P l S j 1 D j l
G j j = i = 1 n j r = 1 n j y j i y j r / 2 n j 2 y j ¯
G j l = i = 1 n j r = 1 n l y j i y l r / n j n l y j ¯ + y l ¯
where S j = n j y j ¯ / n y ¯ . P j = n j / n   is the ratio of the number of provinces in region j to the total number of provinces in the Yangtze River Economic Belt, G j j   is the Gini coefficient of region j , G j l   is the Gini coefficient between regions j and l , and D j l   is the relative impact of the number of tourism disputes in regions j and l .

3.3. Data Sources

The tourism dispute statistics used in this study are sourced from the China Judgements Online (https://wenshu.court.gov.cn/ (accessed on 12 February 2025)) and the Laws & Regulations Database—Chinalawinfo (https://www.pkulaw.com/en (accessed on 12 February 2025)), among others. The China Judgements Online was established in 2013. In accordance with the Provisions of the Supreme People’s Court on the Publication of Judgement Documents by the People’s Courts on the Internet, judgment documents of the People’s Courts at all levels throughout the country that have come into force must be published on the internet within seven working days after their entry into force. An exception is provided for special circumstances stipulated in the law, such as those relating to State secrets, juvenile delinquency, and personal privacy. The China Judgements Online and the Laws & Regulations Database—Chinalawinfo adopt a real-time dynamic update system, ensuring the timeliness and real-time nature of the data. As a result, the data sources possess high authority, timeliness, and scientific rigor. This study sets the search period for judgment documents from 1 January 2013 to 31 December 2024. The case type is limited to civil cases, and the document level is set to judgment documents. Searches were conducted using the following keywords for tourism disputes: travel agencies, scenic spots, hotels, catering, and passenger transportation. To prevent duplicate records of the same case across different judicial levels, the judicial level was uniformly set to first-instance civil trials. To enhance the accuracy of dispute case classification, the data underwent a secondary manual screening and verification process. By reviewing the specific content of the judgment documents, each dispute case category was confirmed individually. After removing irrelevant and duplicate data, a total of 21,976 judgment documents related to various tourism disputes in the Yangtze River Economic Belt from 2013 to 2024 were obtained.

4. Results

4.1. Temporal Distribution Characteristics

4.1.1. Overall Inter-Annual Variability Characteristics

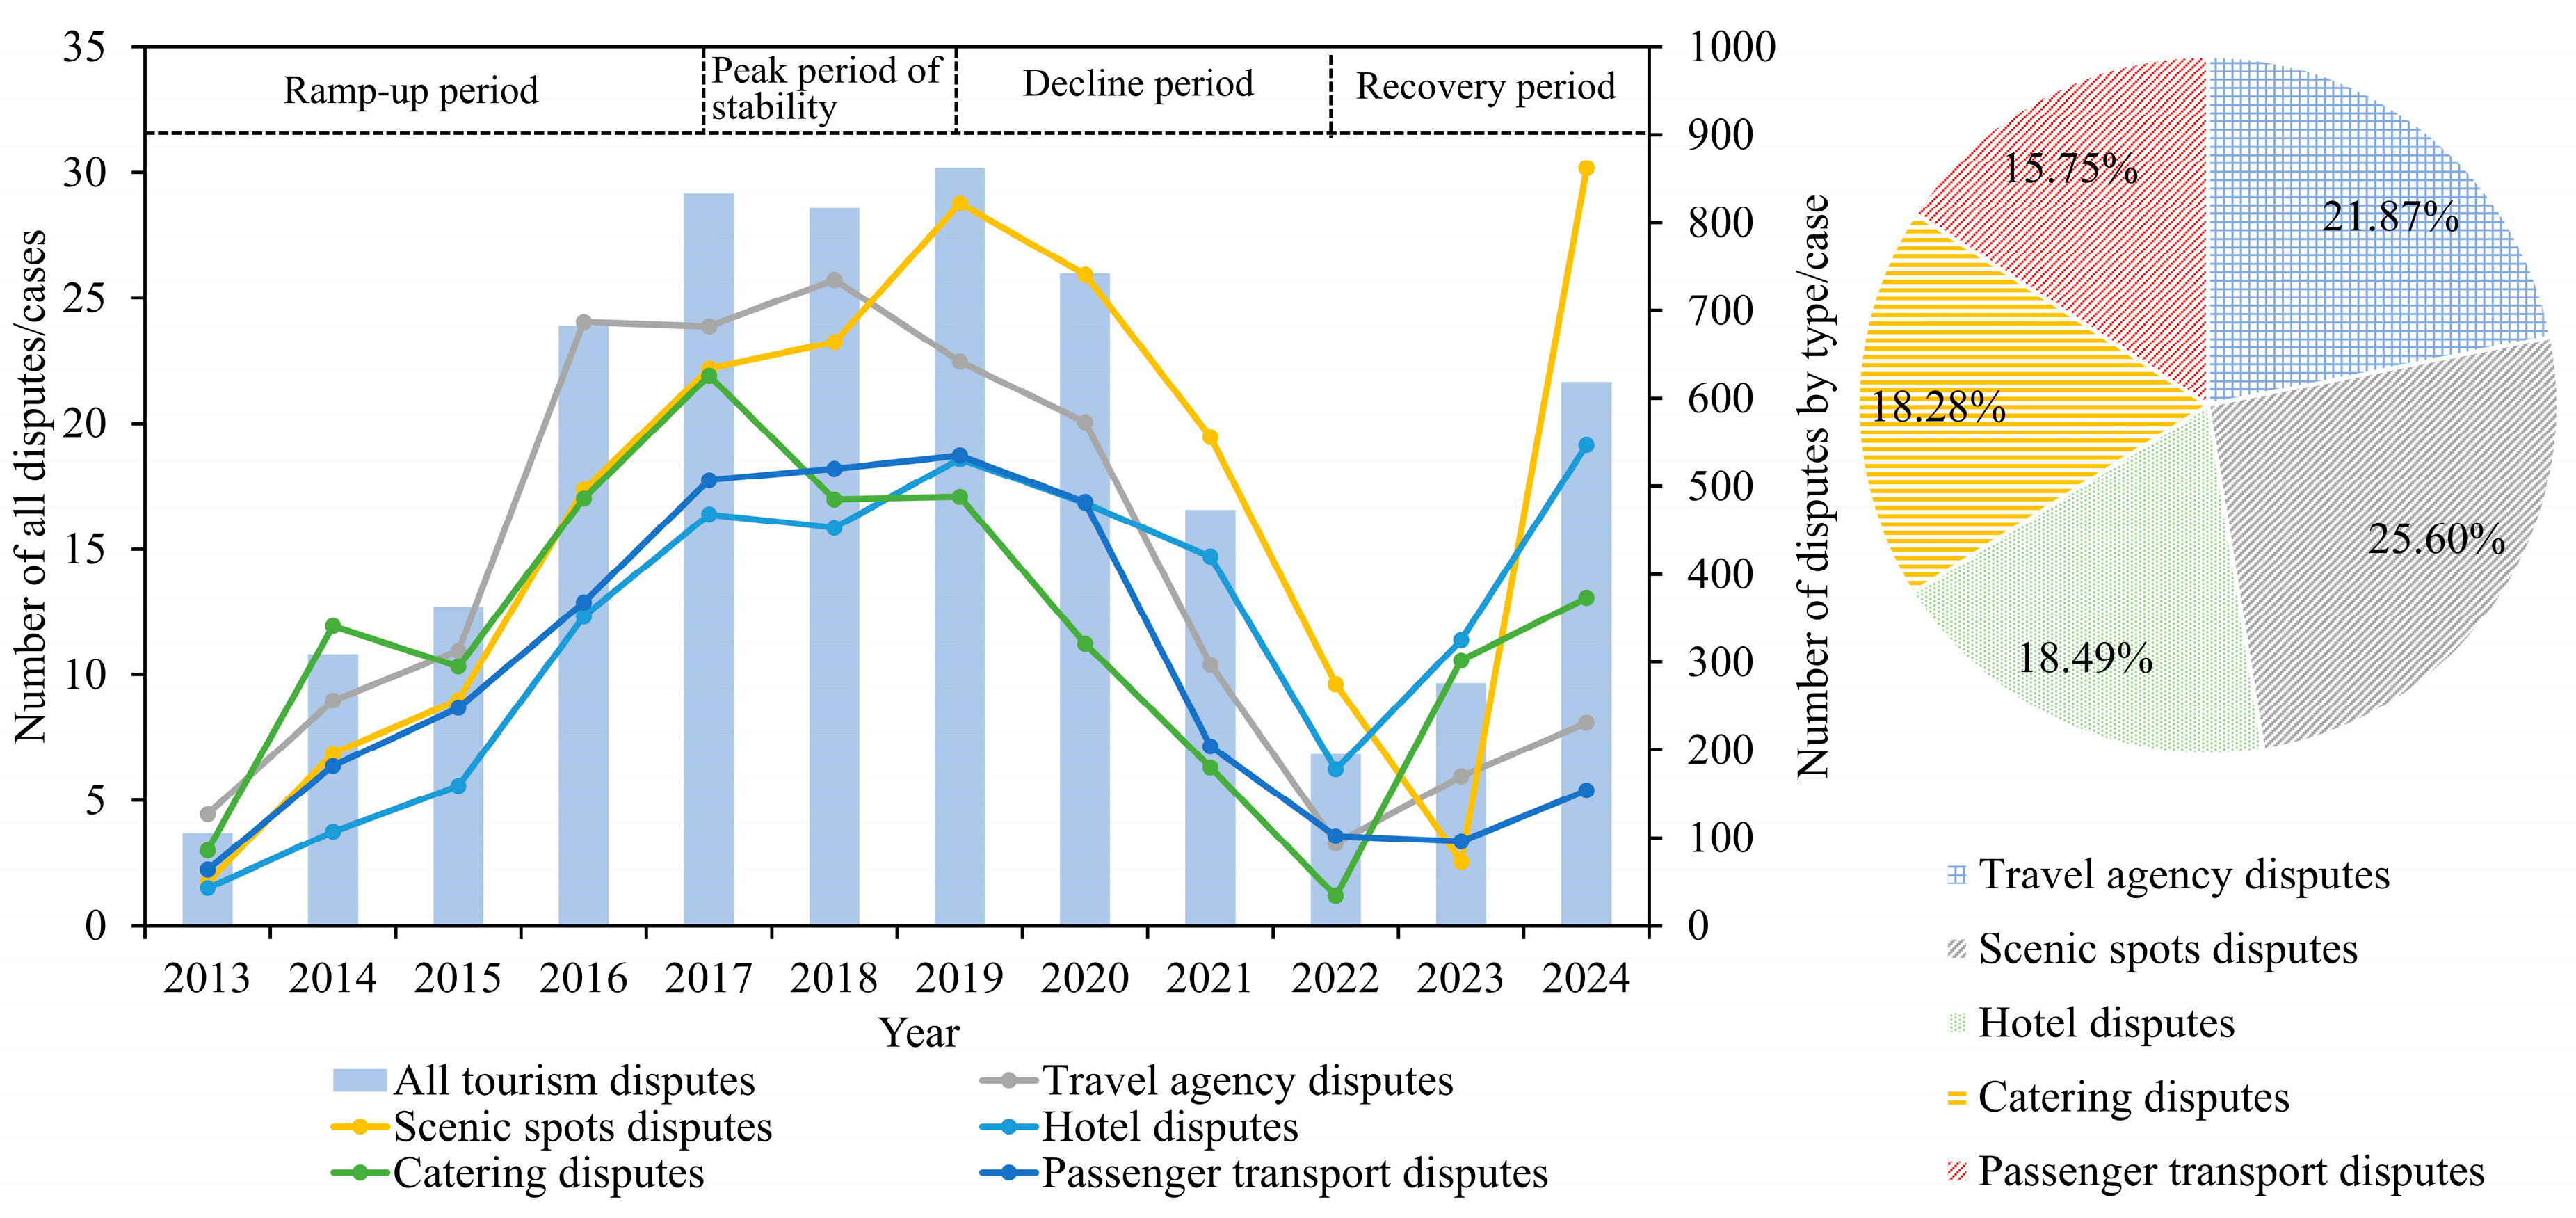
The inter-annual variation in tourism disputes exhibited a trend of increasing, decreasing, and then increasing again (Figure 3). This is mainly because human, mechanical, environmental, and management factors play distinct roles across stages, influencing the temporal patterns of tourism disputes. From 2013 to 2017, tourism gradually became a strategic pillar industry of the national economy. The National Tourism and Leisure Development Program and 13th Five-Year Plan for Tourism Development were introduced consecutively, and the tourism industry in the Yangtze River Economic Belt thrived. However, the development of tourism laws remains in its infancy, and there are endless abuses in the tourism market that damage the legitimate rights and interests of consumers, leading to a sharp increase in tourism disputes. Between 2017 and 2019, owing to the continued promotion of the Outline of the Development Plan for the Yangtze River International Golden Tourism Belt, the tourism market in the provinces and cities along the Yangtze River Basin continued to thrive. Tourism governance in accordance with the law steadily progressed; however, opportunities and challenges coexisted. Tourism market organization continued to face severe challenges, and tourism disputes peaked during this period. Between 2019 and 2022, tourism development stopped due to the COVID-19 pandemic, and tourism disputes in the Yangtze River Basin decreased dramatically. Between 2022 and 2024, China’s COVID-19 prevention and control measures were lifted, quarantine measures were no longer in place, and the tourism industry achieved full recovery and revitalization, with a consequent increase in tourism litigation and disputes.
Disputes in the scenic area category accounted for the largest share of disputes (29.86%), showing a year-on-year increase from 2013 to 2019, a decreasing trend from 2019 to 2023, and another increase from 2023 to 2024. Disputes in the travel agency category accounted for the next largest share (25.51%), exhibiting an increase from 2013 to 2018, decreasing from 2018 to 2022, and increasing again from 2022 to 2024. Hotel disputes accounted for 21.57% of the total, exhibiting a trend of increasing, decreasing, and then increasing again, with the highest and lowest values in 2019 and 2022, respectively. Catering disputes accounted for 21.32% of the total, peaking in 2017 and reaching a minimum in 2022. Passenger transport disputes accounted for 18.37% of the total, exhibiting an inverted U-shaped trend from 2013 to 2022, followed by an increase after 2022. Thus, tourism dispute peaks were concentrated between 2017 and 2019, with the majority of decreases in 2022.

4.1.2. Regional Inter-Annual Variability Characteristics

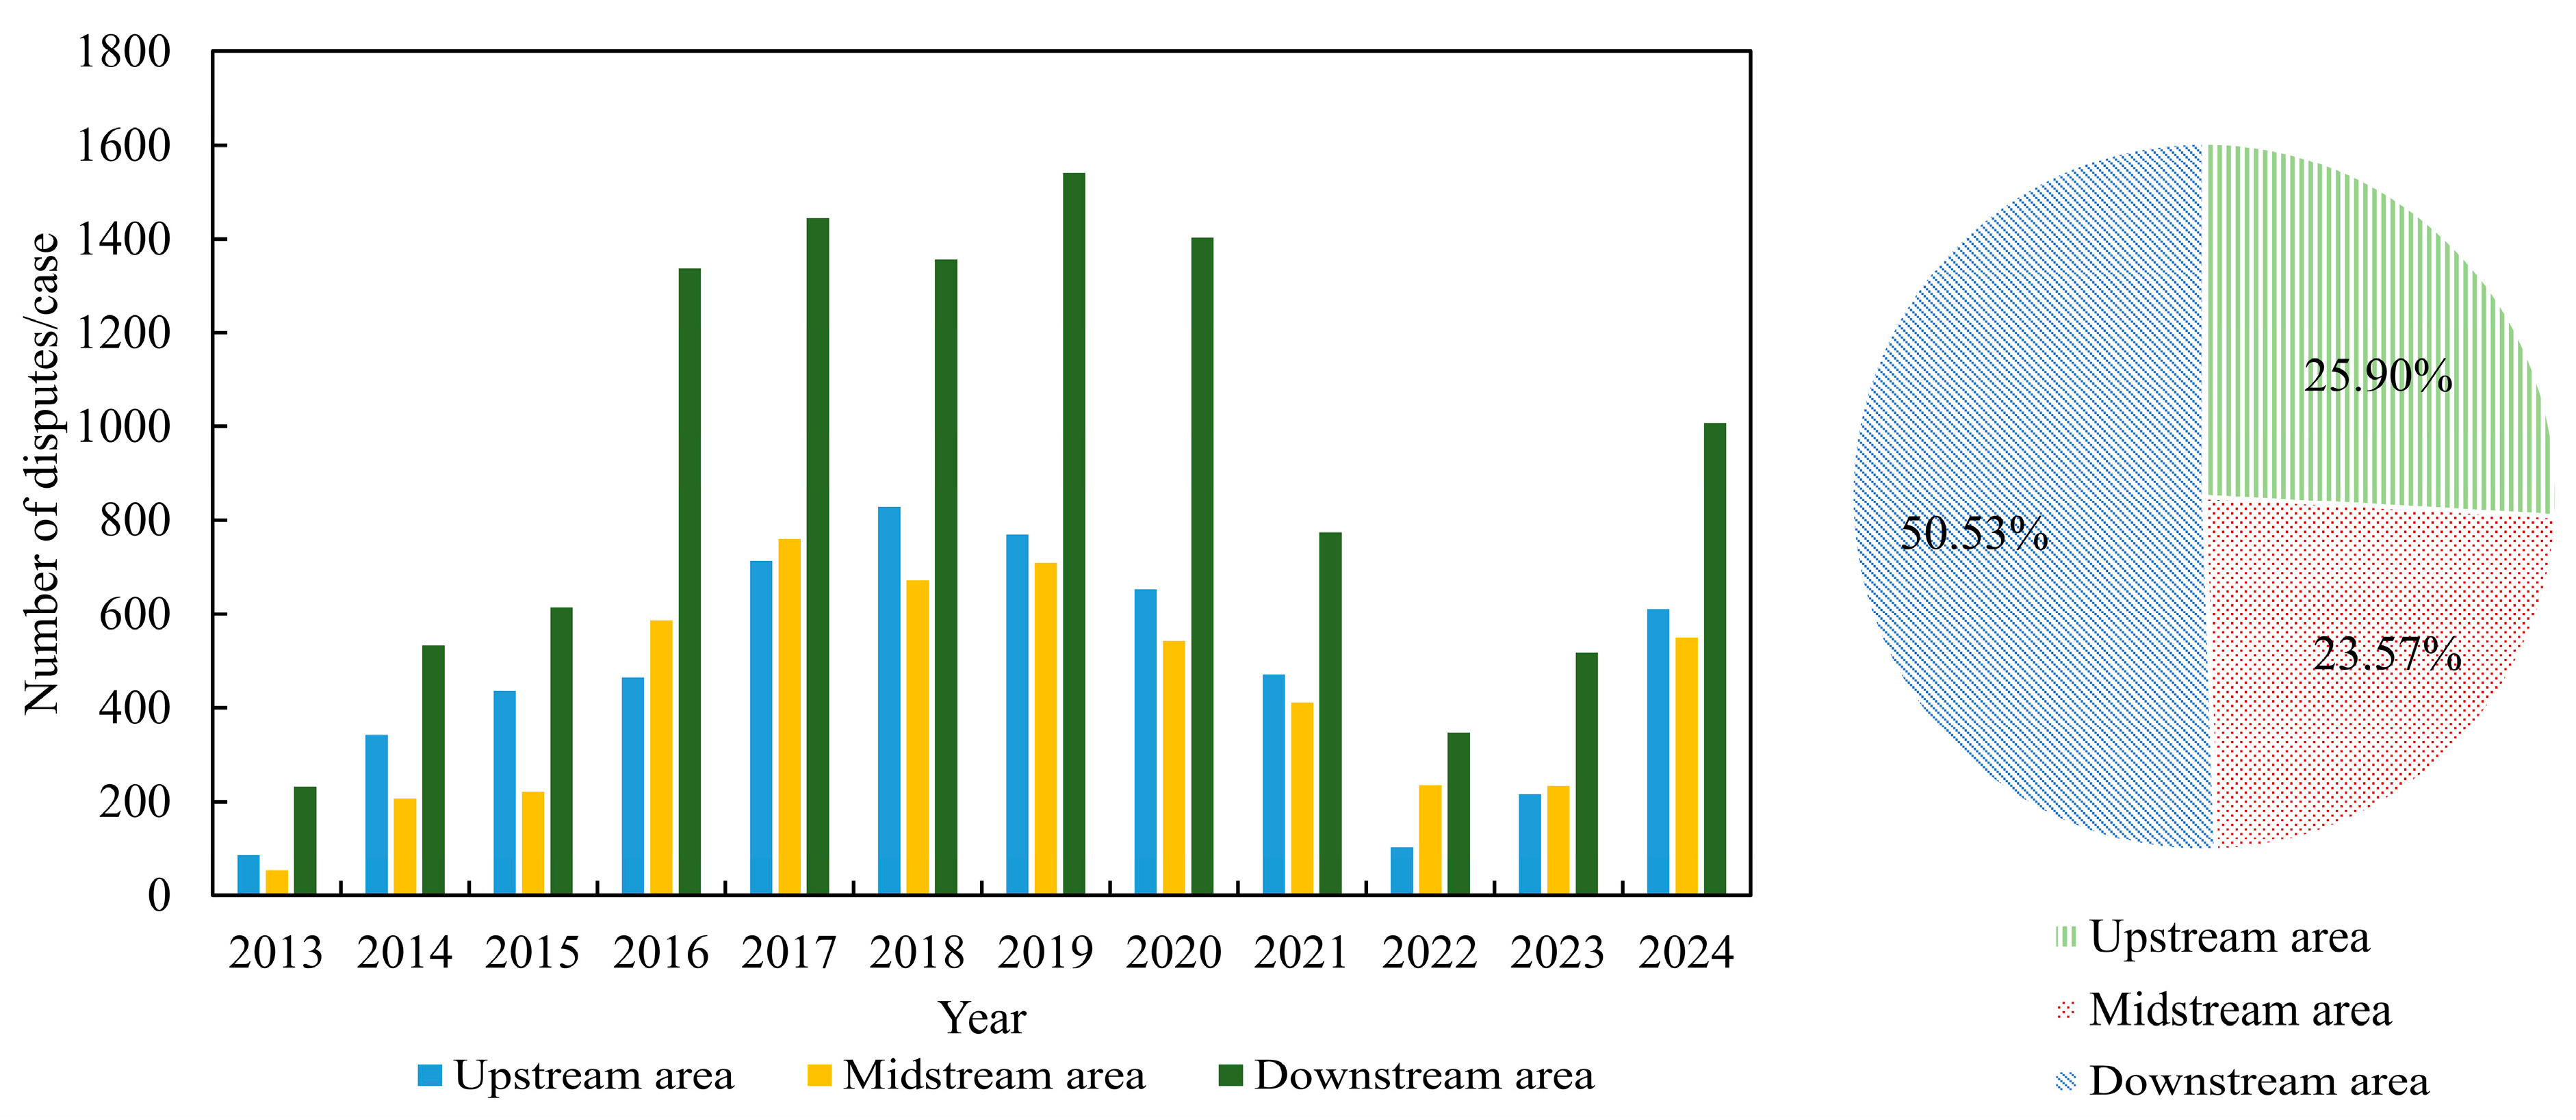
Inter-annual changes in tourism disputes in the upper, middle, and lower regions followed a similar trend, with the peak period concentrated between 2016 and 2019 (Figure 4). During this period, the tourism industry in all basins experienced booming development, and the vitality of the tourism economy continued to grow. However, tourism market management was outdated, laws were insufficiently regulated, illegal business operation continued, and tourism disputes occurred frequently. Between 2020 and 2022, China was affected by force majeure factors, tourism development slowed down, and tourism disputes subsequently decreased. Between 2022 and 2024, China’s tourism industry fully recovered, with a subsequent increase in the number of disputes. In terms of percentages, a significant disparity was observed in the share of disputes across regions. The downstream region had the highest share (50.53%), accounting for half of the total number of disputes. The upstream and midstream regions accounted for similar proportions (25.90% and 23.57%, respectively).
Moreover, a significant disparity was observed in the share of disputes across regions. Based on the man–land relationship theory, regional differences in tourism disputes are essentially the manifestation of the lack of coordination and adaptation between people (tourists, operators, residents, and managers) and the land (natural geographical environment, socio-economic environment, cultural environment, and institutional environment) within specific spatial contexts. The downstream region had the highest proportion (50.53%), accounting for half of the total number of disputes. The upstream and midstream regions accounted for similar proportions (25.90% and 23.57%, respectively). This could be because tourism’s economic development along the Yangtze River Economic Belt has historically been strong in the eastern and downstream regions and weak in the western and upstream regions. The downstream areas of Shanghai, Jiangsu, Anhui, and Zhejiang provinces are rich in tourism resources and have significant advantages in the tourism industry; however, the comprehensive governance system of the tourism market is under-developed, failing to achieve the simultaneous enhancement of industrial prosperity and legal supervision. Consequently, litigation disputes regarding scenic spots, travel agencies, hotels, and other industries continue. In contrast, the midstream and upstream regions have weaker economic development in the tourism sector, with fewer economic transactions between tourism consumers, operators, and service support providers and fewer tourism disputes than in the downstream regions.

4.2. Spatial Distribution Characteristics

4.2.1. Spatial Structure Characteristics

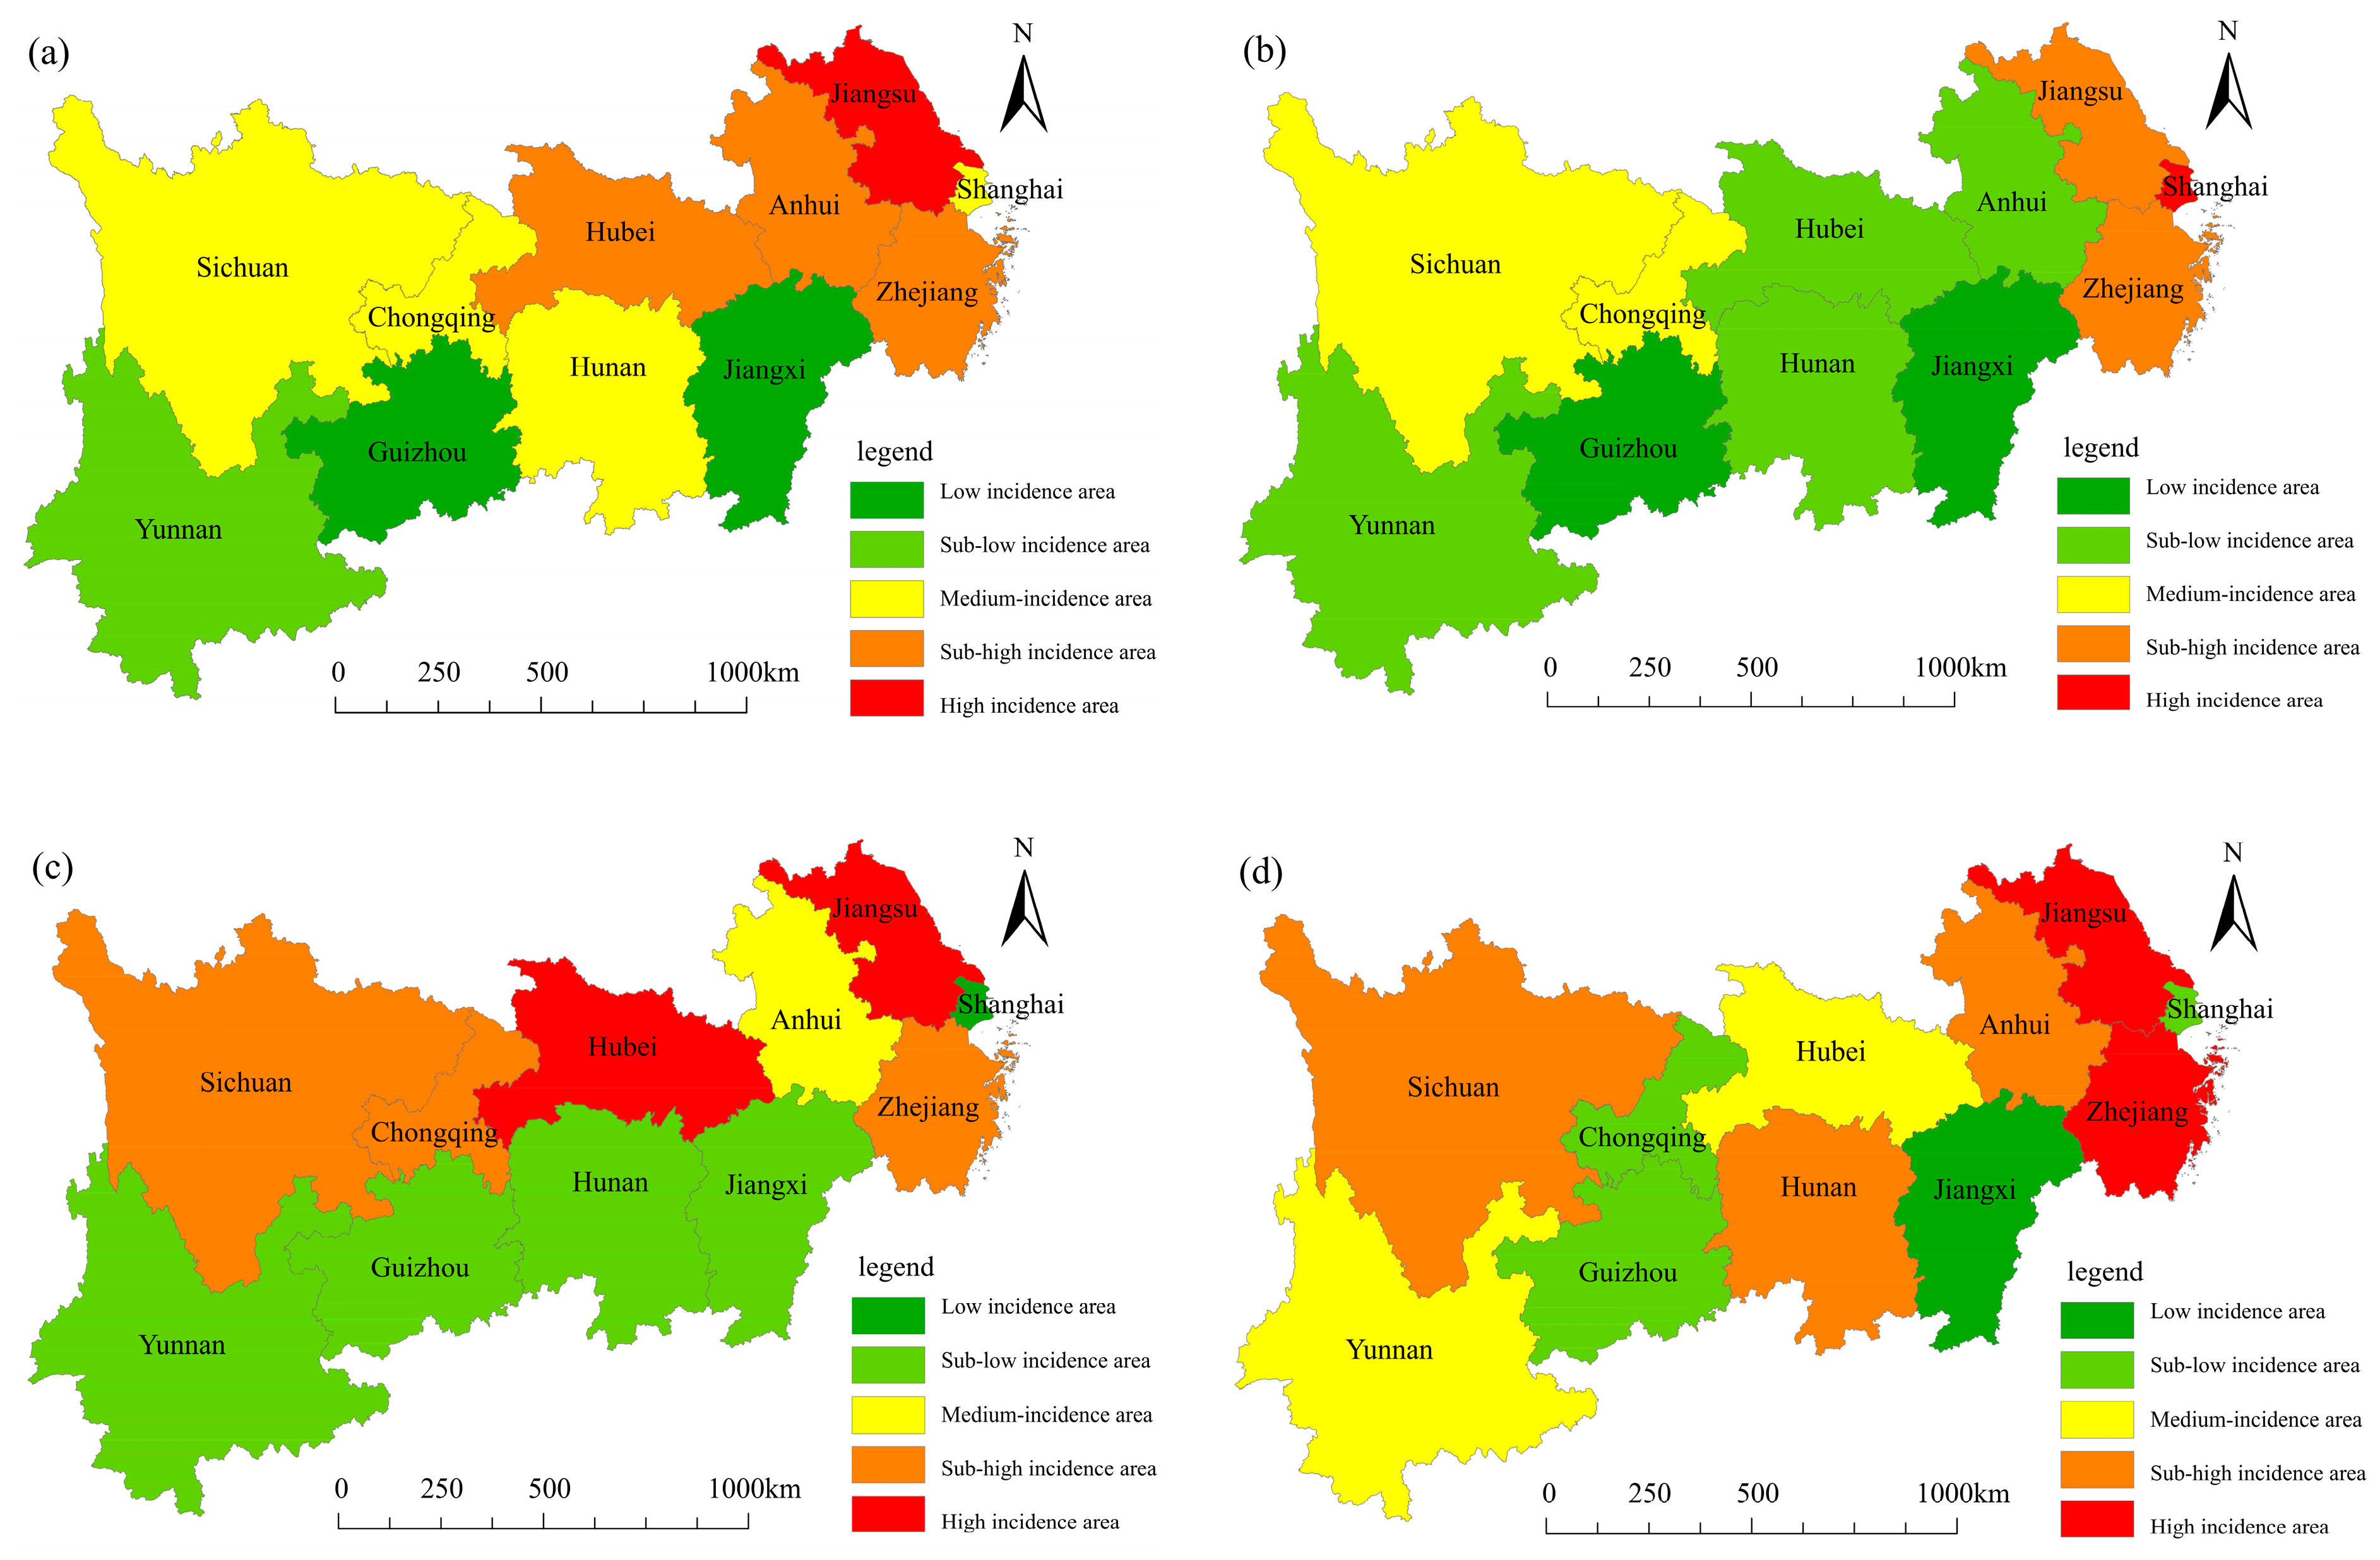
Based on the Jenks breakpoint method, the Yangtze River Economic Belt was classified into five levels: high, second-highest, medium, second-lowest, and low incidence of tourism disputes (Figure 5). The results demonstrated that tourism disputes were characterized by significant spatial differentiation. According to the man–land relationship theory and space production theory, the spatial heterogeneity of the geographical environment profoundly shapes the distribution, intensity, and modes of various elements of tourism activities, as well as the perceptions and behaviors of both residents and tourists. Consequently, these variations manifest in significant differences in tourism disputes at various spatial scales.
Jiangsu Province had a high incidence of all tourism disputes. The second-highest-incidence area had a semi-enclosed distribution with a high-incidence area as the core. Medium-incidence areas were distributed throughout Shanghai, Hunan, Sichuan, and Chongqing. The reason for this may be that areas such as Jiangsu, Shanghai, and Hunan generally suffer from imbalances between supply and demand in the tourism market, inadequate industry management, lagging enforcement of laws and regulations, insufficient market supervision, and weak consumer awareness of their rights, leading to the accumulation and outbreak of tourism disputes and conflicts. The low- and second-lowest-incidence areas were distributed in Yunnan, Guizhou, and Jiangxi. This is because these regions have proactively managed the core contradictions in tourism development and service quality, effectively reducing the likelihood of disputes. For example, Yunnan has regulated the market through governance, Guizhou has adjusted the supply and demand contradictions in tourism through policy, and Jiangxi has avoided the risks of similar competition among tourism enterprises through differentiation.
The high- and second-highest-incidence areas of travel agency disputes were concentrated in Jiangsu, Zhejiang and Shanghai, showing a single-core distribution pattern. Medium-incidence areas were in Sichuan and Chongqing. The reason for this is that there are a large number of travel agencies in Jiangsu, Zhejiang, and Shanghai, and their products are highly homogeneous. To gain a competitive edge, some travel agencies have cut costs, lowered service standards, and even made false promises about travel services. This has led to significant discrepancies between the actual itinerary and the advertised one, triggering consumer lawsuits. Sichuan and Chongqing, as popular tourist destinations in southwestern China, have a high incidence of travel agency-related disputes, which are closely linked to their unique geographical environment, tourism market characteristics, and management challenges. Factors such as low price competition, false advertising, high risks associated with travel projects, and the absence of emergency response mechanisms have contributed to the frequent occurrence of travel agency disputes. The low- and second-lowest-incidence areas were distributed across the upstream, midstream, and downstream provinces.
Scenic disputes were bound by the main axis of the Yangtze River, showing an overall distribution pattern of high- and low-value clustering in the north and low-value clustering in the south. The high- and second-highest-incidence areas were distributed horizontally in Sichuan, Chongqing, and Hubei, as well as distributed vertically in Jiangsu and Zhejiang. The medium-incidence area was in Anhui Province. The second-lowest-incidence areas were distributed as strips in the Yunnan, Guizhou, Hunan, and Jiangxi Provinces. The low-incidence area was in the Shanghai Municipality. The main reason for this is that tourist attraction management in the northern part of the Yangtze River Economic Belt is unregulated, and oversight is lagging. For example, many tourist attractions in Zhejiang have too many visitors and not enough capacity, which affects the visitor experience. In Jiangsu, attractions are scattered and itineraries are often poorly planned, which can lead to visitor dissatisfaction. Popular tourist spots like Hongyadong in Chongqing have traffic jams and forced consumption, which are messing up the market. Scenic spots like Mount Emei in Sichuan have issues like forcing visitors to buy expensive blessing packages and monkey injury insurance, sparking consumer disputes. Some scenic spots in Hubei have seen a decline in visitor experience due to traffic congestion and service quality issues, leading to consumer complaints. In contrast, the southern region of the Yangtze River Economic Belt has relatively balanced scenic spot resource development, strong market rectification efforts, and effective supervision, effectively curbing tourism disputes in scenic spots. Shanghai, in particular, has the fewest number of scenic spot-related disputes. This is because Shanghai has established a tourism dispute prevention and control system. Dispute mediation rooms have been set up in scenic spots, with police officers, mediators, and security personnel stationed there daily. Police officers, mediation committees, and park management authorities collaborate to address disputes related to three aspects: legal application, compensation assessment, and visitor experience. This ensures the swift resolution of disputes and effectively prevents the escalation of conflicts.
Hotel disputes exhibited a high incidence in Jiangsu and Zhejiang Provinces. Hotel companies in these two provinces frequently launch promotional activities to compete for customers, but price reductions have not been accompanied by service upgrades. This has led to a surge in hotel service disputes, such as downgraded room types and reduced breakfasts. The second-highest-incidence areas were sporadically distributed in Anhui, Hunan, and Sichuan, forming a three-legged tripod. The reason for this is that hotels in Anhui, Hunan, Sichuan, and other places cancel low-priced reservations during the peak tourist season under the pretext of fictitious renovations or system errors, and then re-list them at several times the original price. This directly infringes on consumer rights and exacerbates the supply–demand conflict between the two parties. The medium-, low-, and second-lowest-incidence areas were distributed in Yunnan, Hubei, Chongqing, and other locations. This is due to the fact that in recent years, the aforementioned regions have introduced relevant policies that clearly define hotel service standards and liability for breaches of contracts, effectively reducing consumer disputes in the hotel industry. For example, Yunnan has implemented a dynamic price filing system to curb malicious breaches of contracts by hotels. Hubei has increased penalties for false advertising and hidden fees, thereby raising the cost of non-compliance for hotels. Chongqing has introduced an annual inspection system for hotel facilities, focusing on safety hazards such as fire exits and smart door locks.
Catering disputes exhibited a decreasing distribution trend from northeast to southwest. The high- and second-highest-incidence areas were distributed as a group in the Jiangsu, Zhejiang, and Anhui Provinces, and the polarization of the distribution characteristics was significant. The frequent occurrence of disputes in the catering and tourism industries is caused by multiple factors, including pricing mechanisms, hygiene and safety, and service standards. For example, some restaurants in Jiangsu set minimum consumption requirements and charge unreasonable fees for tableware disinfection and seating. Restaurants in scenic spots or popular tourist cities in Zhejiang often use seasonal prices instead of clearly marked prices, taking advantage of tourists’ lack of information to arbitrarily raise prices. Some catering enterprises in Anhui use inferior ingredients and expired food, and small and medium-sized restaurants have poor hygiene conditions and disinfection equipment that is virtually useless. The medium-incidence area was found only in Hubei. The low- and second-lowest-incidence areas were distributed in Yunnan, Guizhou, Sichuan, Chongqing, Jiangxi, and Hunan, with some spatial diffusion. This is due to the continuous strengthening of the supervision of catering enterprises and industry standardization in the above-mentioned regions, which has prevented the number of catering disputes from continuing to increase. For example, a policy of clear pricing and price transparency has been implemented, requiring all catering outlets to display the prices, quantities, and sources of ingredients of their dishes on electronic screens. A food safety traceability system has been established, and a catering safety code has been set up. Consumers can scan the code to view live streams of the kitchen, food procurement records, and test reports. The Catering Association has taken the lead in standardizing services and has formulated the catering service standards.
Passenger transport disputes exhibited the highest and second-highest incidence in Hubei, Hunan, Jiangsu, Zhejiang, Sichuan, and the national comprehensive three-dimensional transportation network, comprising six axes, seven corridors, and eight channels. The main structure of the spatial layout was consistent. The reason for this is that the Yangtze River Economic Belt encompasses water transport, high-speed rail, aviation, and highway networks, and multimodal transport often leads to poor connectivity. When passengers seek redress, they often encounter situations where transportation companies and transportation authorities shift blame onto each other, exacerbating conflicts in passenger transportation. Additionally, the Yangtze River Economic Belt is constrained by natural geographical conditions, with high climate sensitivity in waterways. For example, the Hubei and Hunan regions are frequently foggy, while Sichuan has numerous gorges and swift currents, resulting in frequent delays or suspensions of vessel operations. This leads to difficulties in refunding tickets for tourists, triggering consumer litigation disputes. The low- and second-lowest-incidence areas were intertwined and distributed in Anhui, Jiangxi, and Shanghai. This is because these three regions have reduced the likelihood of passenger transport disputes through institutional innovation and technological empowerment. For example, Anhui has launched a real-time bus app and opened customized bus routes (such as direct buses to Huangshan Scenic Area) according to demand to avoid the risk of overloading. Jiangxi has implemented standardized services for new energy vehicle fleets. All tourist vehicles in the province are equipped with seat belt alarms and on-board first aid kits, which have effectively reduced the accident rate. At Shanghai Pudong International Airport, flight delays exceeding two hours automatically trigger insurance claims, with passengers receiving compensation by scanning a QR code. This significantly reduces the time required to resolve disputes and effectively prevents conflicts in passenger transportation from escalating.

4.2.2. Spatial Clustering Characteristics

The geographic concentration index, G, of all tourism disputes was maintained at 42.00–45.00, remaining below 50.00, indicating a relatively balanced spatial distribution of tourism disputes and low degree of spatial aggregation (Table 1). The G-value of travel agency disputes showed a fluctuating downward trend from 58.59 in 2013 to 32.65 in 2024, indicating a lower spatial agglomeration effect and more balanced spatial distribution of travel agency disputes. This is because the Yangtze River Economic Belt has unified the management standards for the travel agency industry and implemented the Yangtze River Tourism Service Standards across provinces, achieving mutual recognition of tour guide qualifications and the convergence of refund and compensation standards. This has effectively reduced travel agency disputes caused by policy differences. In addition, the Yangtze River Economic Belt has promoted the reconstruction of the distribution pattern of traditional tourism resources through the joint construction of ecological tourism cooperation zones by provinces and cities along the river. This has dispersed the pressure of travel agency disputes in traditional hotspot areas and promoted the balanced distribution of travel agency disputes. The G-value of scenic disputes fluctuated and decreased from 2013 to 2023, and then rose sharply to 63.07 in 2024 with increased spatial agglomeration. This may have been due to a surge in disputes over scenic spots in 2024 as provinces along the Yangtze River Economic Belt launched scenic spot discounts and reductions, stimulating a sharp increase in spending at tourist attractions. The G-value of hotel disputes showed an increasing trend from 2013 to 2024, from 34.09 to 50.24, with an increasing trend of spatially unbalanced distribution and increased spatial concentration of hotel disputes and conflicts. This is due to the strong demand for hotels in the Yangtze River Economic Belt, but hotel companies are generally facing challenges such as low service quality and difficulties in transforming their business models. Upstream resource-based cities rely on traditional tourism models, with hotel services limited to basic accommodation functions, failing to meet consumers’ personalized needs. Downstream core cities have adopted the concept of smart hotels, but issues such as robotic AI customer service responses and overly complex membership systems have led to consumer complaints. Midstream regions, affected by poor supply chain integration, exhibit a fragmented state where high-end hardware coexists with inefficient services, exacerbating consumer dissatisfaction. The G-value of the catering disputes exhibited an increasing trend from 2013 to 2022 and a decreasing trend from 2022 to 2024. However, the overall degree of spatial clustering increased significantly from 2013 to 2024, suggesting a significant geographical preference for occurrences of catering disputes. The reason for this is that the Yangtze River Economic Belt has a high population density and frequent dining consumption. There is a rich variety of business types, including high-end chain restaurants, trendy fast-food restaurants, street stalls, and scenic spot specialty restaurants. However, this is accompanied by market chaos such as false advertising, substandard hygiene, price fraud, and forced consumption. This has led to a constant accumulation of dining disputes in the Yangtze River Economic Belt. The G-value of passenger transport disputes had a fluctuating downward trend over the years, and the degree of spatial concentration decreased. The reason for this is that as the transportation networks in various provinces have continued to be improved, a three-dimensional transportation system comprising water, land, and air transportation has been rebuilt, and a multi-hub structure has been formed. The three major hub cities of the lower reaches of the Yangtze River (Shanghai), the middle reaches (Wuhan, Hubei), and the upper reaches (Chongqing) have achieved passenger transportation diversion. This has effectively dispersed passenger transportation pressure, alleviated the concentration of passenger transportation conflicts, and promoted the gradual spatial equilibrium distribution of passenger transportation disputes.

4.2.3. Spatial Association Characteristics

The results of the spatial autocorrelation analysis of tourism disputes (Table 2) indicate that all types of disputes passed the significance test, with p-values < 0.05, suggesting that tourism disputes exhibit a pronounced spatial clustering effect. Moran’s I > 0 indicates that tourism disputes exhibit positive spatial correlation. Further analysis of local spatial autocorrelation can be conducted to examine the LISA clustering of tourism disputes (Table 3). The high–high clustering areas for all tourism disputes are primarily concentrated in the upper reaches of the Yangtze River Economic Belt, including Chongqing, Sichuan, Yunnan, and Guizhou. The low–high clustering area is Hunan. The low–low clustering areas are primarily in the lower reaches. The high–low clustering area is Hubei. For travel agency disputes, the high–high clustering areas are Chongqing, Sichuan, and Guizhou. The low–high clustering areas are Yunnan, Hubei, and Hunan. The low–low clustering areas are primarily in the middle and lower reaches. The high–low concentration area is Shanghai. There are no high–high concentration areas for scenic spot-related disputes. Chongqing, Yunnan, and Anhui exhibit a low–high concentration trend. Jiangxi, Hunan, Shanghai, and Zhejiang are low–low concentration types. Sichuan, Guizhou, Hubei, and Jiangsu exhibit a high–low concentration distribution pattern. The high–high concentration areas for hotel-related disputes are Sichuan, Guizhou, Yunnan, and Hunan. The low–high concentration area is Chongqing. The middle and lower reaches regions primarily exhibit a low–low concentration pattern. There are no high–low concentration areas. The high–high concentration areas for catering disputes are Sichuan, Guizhou, and Yunnan. The low–high concentration area is Chongqing. The low–low concentration areas are in the middle and lower reaches. The high–high concentration areas for passenger transportation disputes are Sichuan, Guizhou, and Hunan. The low–high concentration areas are Chongqing, Yunnan, and Jiangxi. The low–low concentration areas are in the lower reaches. The high–low concentration area is Hubei. Based on accident causation theory, this distribution is essentially the result of the combined effects of human factors, mechanism factors, environmental factors, and management factors. High–high concentration regions have large and relatively concentrated tourist flows. However, market management is relatively lax, regulations are weak, service quality fluctuates significantly, and there are many issues with contract fulfillment. These factors contribute to the high–high concentration pattern of tourism disputes. Low–high concentration regions are primarily influenced by regional environmental factors and cannot completely escape the spatial spillover effects of neighboring high-incidence areas, resulting in a low–high concentration pattern. Low–low concentration regions benefit from their highly developed economic foundations, mature and standardized tourism service systems, robust infrastructure capacity, and efficient and stringent market regulation, effectively reducing the probability and density of disputes. High–low concentration provinces have a relatively high total volume of disputes, forming a stark contrast with surrounding low-dispute-concentration regions, thereby creating a unique high–low concentration pattern.

4.2.4. Spatial Gravity Center Characteristics

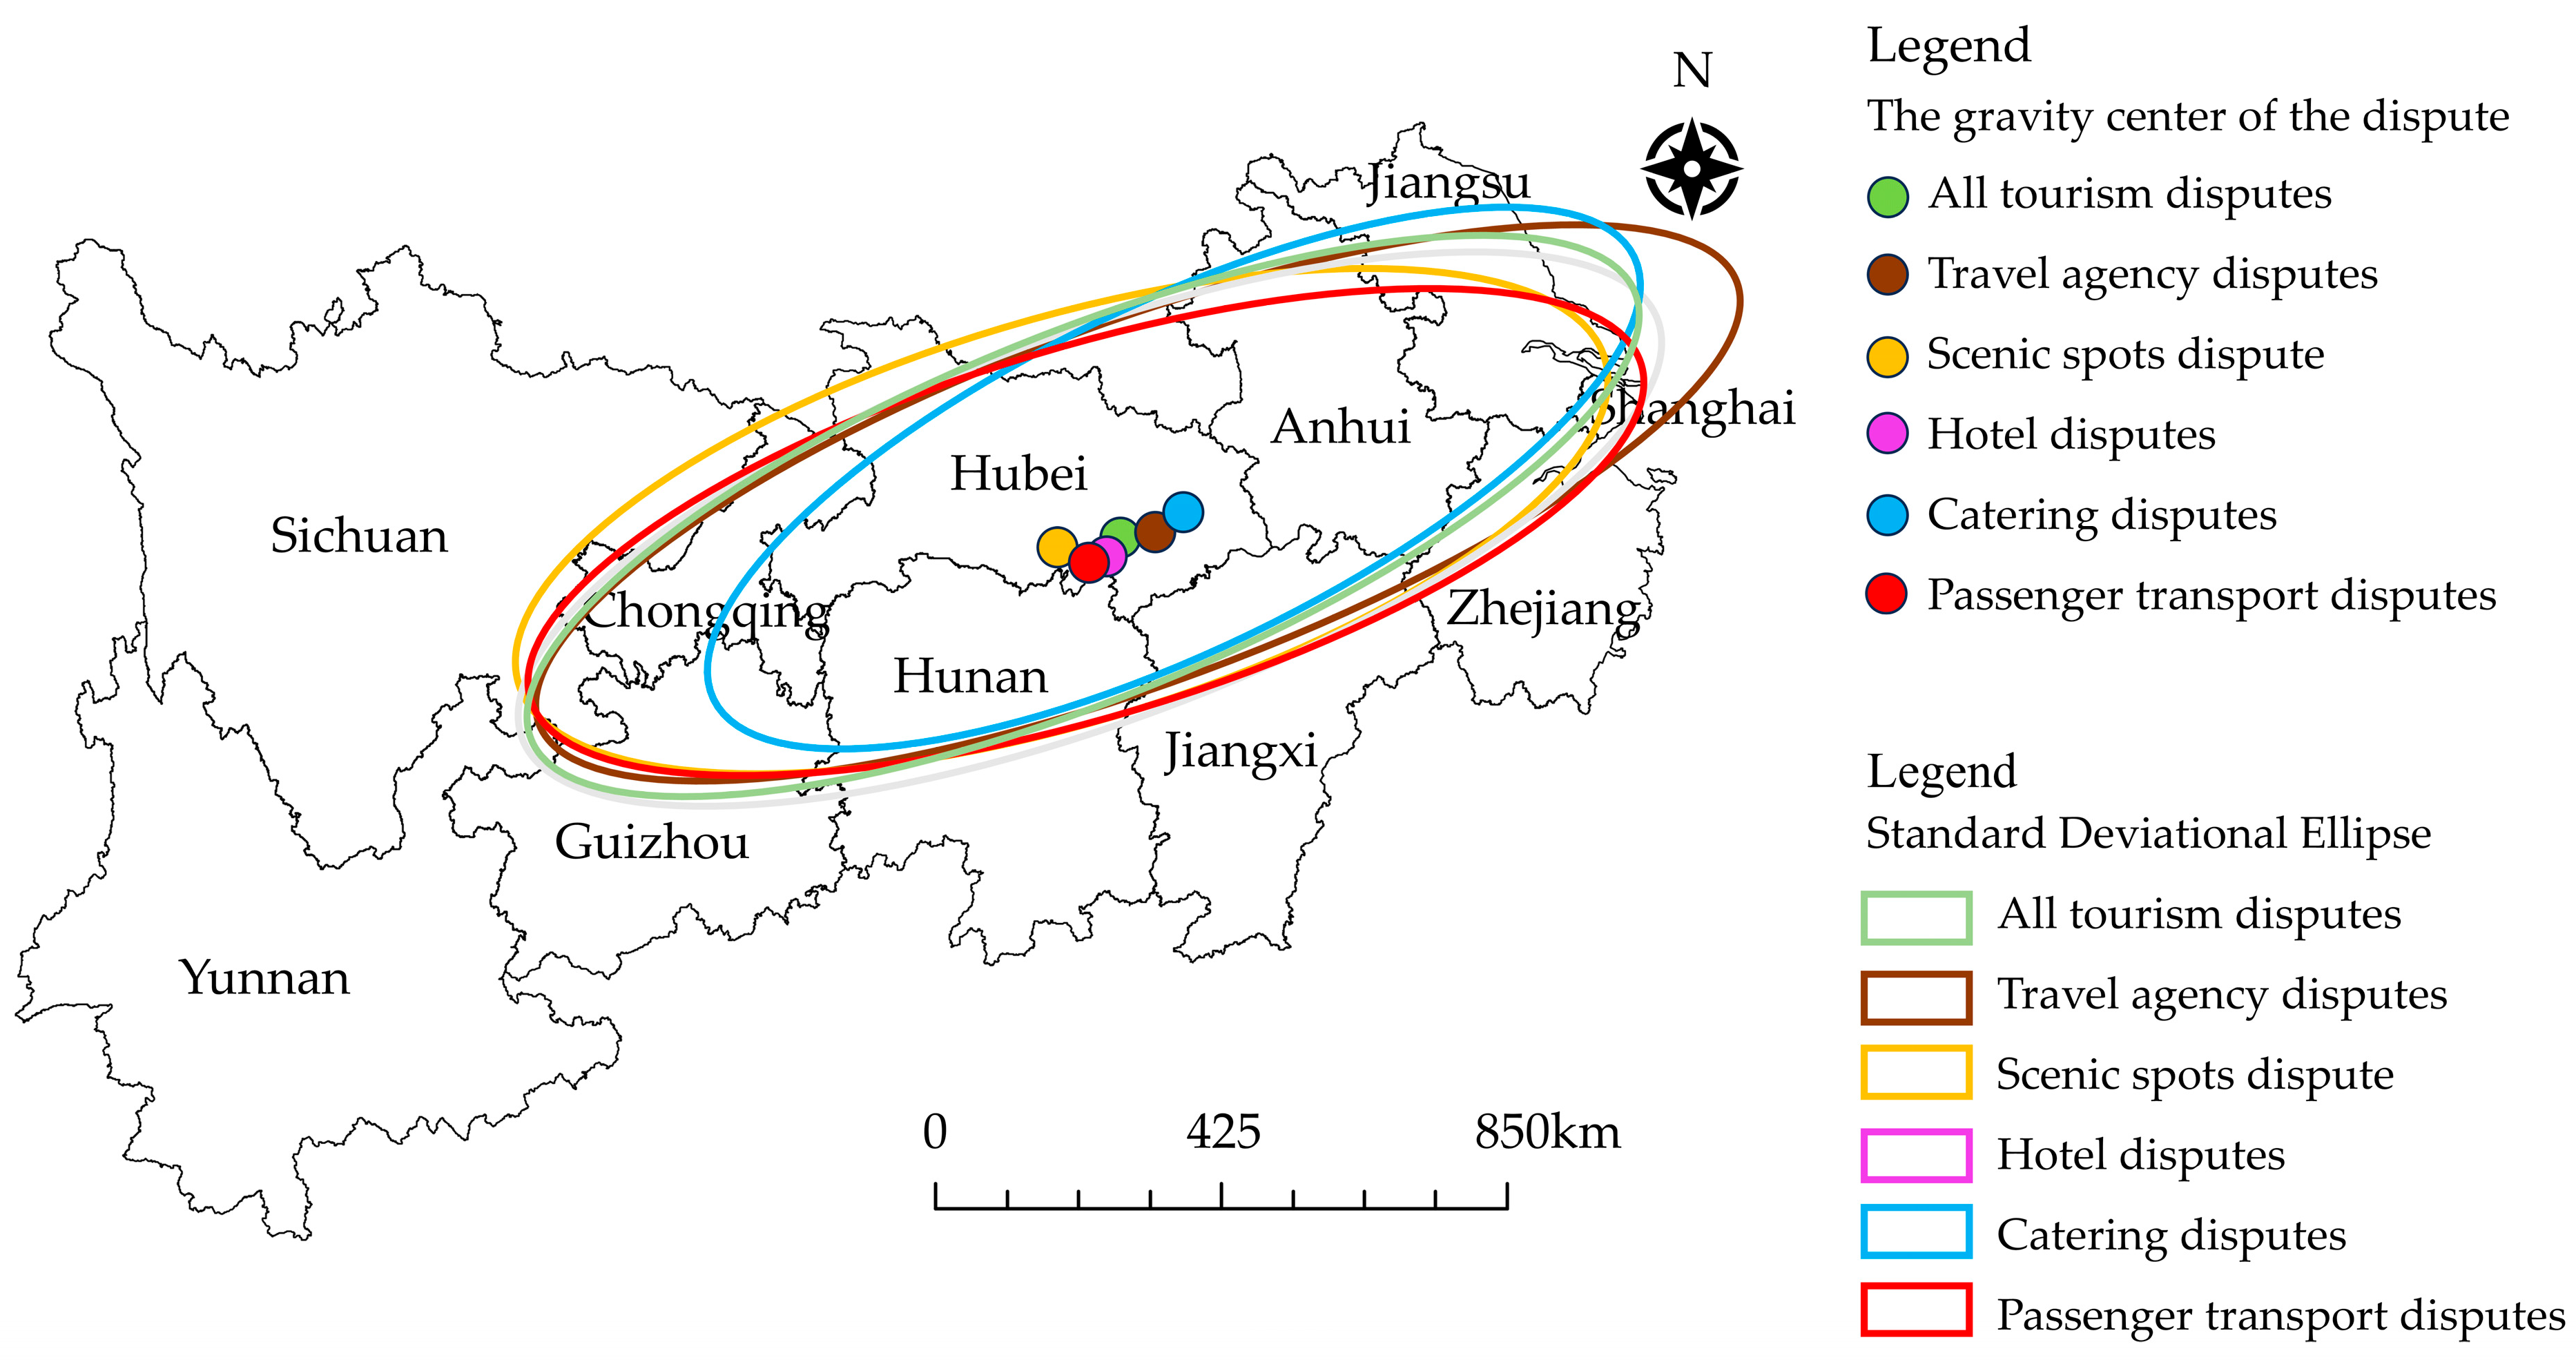
The gravity center and direction of the standard deviational ellipse distribution of tourism disputes are presented in Figure 6. The gravity center for all types of tourism disputes was in Hubei Province and the border between Hubei and Hunan Provinces. With numerous stakeholders involved in the tourism industry chain, the focus of disputes results from a combination of human, mechanical, environmental, and management factors. Specifically, as popular cultural tourism destinations, Hubei and Hunan face issues such as insufficient reception capacity and inadequate regulatory oversight of markets. For example, during peak tourist seasons, problems like scenic area congestion, traffic gridlock, and delayed services frequently occur. These issues have exacerbated disputes over ticket refunds and itinerary changes. Some travel agencies attract tourists with low prices, but engage in practices such as forced shopping and last-minute price hikes during actual trips. Additionally, Hubei Province has weak grassroots tourism enforcement capabilities, and scenic spots, hotels, and catering businesses often engage in price fraud and food safety hazards, making it difficult to enforce regulations in real time. Furthermore, Hubei and Hunan experience frequent heavy rains in summer, which can trigger flash floods and landslides, leading to the temporary closure of scenic spots. However, some scenic spots have not clearly defined refund and modification policies, resulting in consumer refund disputes. The directions of tourism dispute distribution showed a northeast–southwest orientation and tended to be clustered in the northern provinces. This may be because northern provinces, such as Hubei, have high-quality tourism resources and strong tourism attractions, high population density, high transport accessibility, and a large tourism market. However, tourism laws in the northern provinces are not well regulated, and the tourism market is chaotic and prone to various tourism disputes in travel agencies, catering, hotels, and other industries.

4.3. Regional Differences in Characteristics

4.3.1. Overall Differences

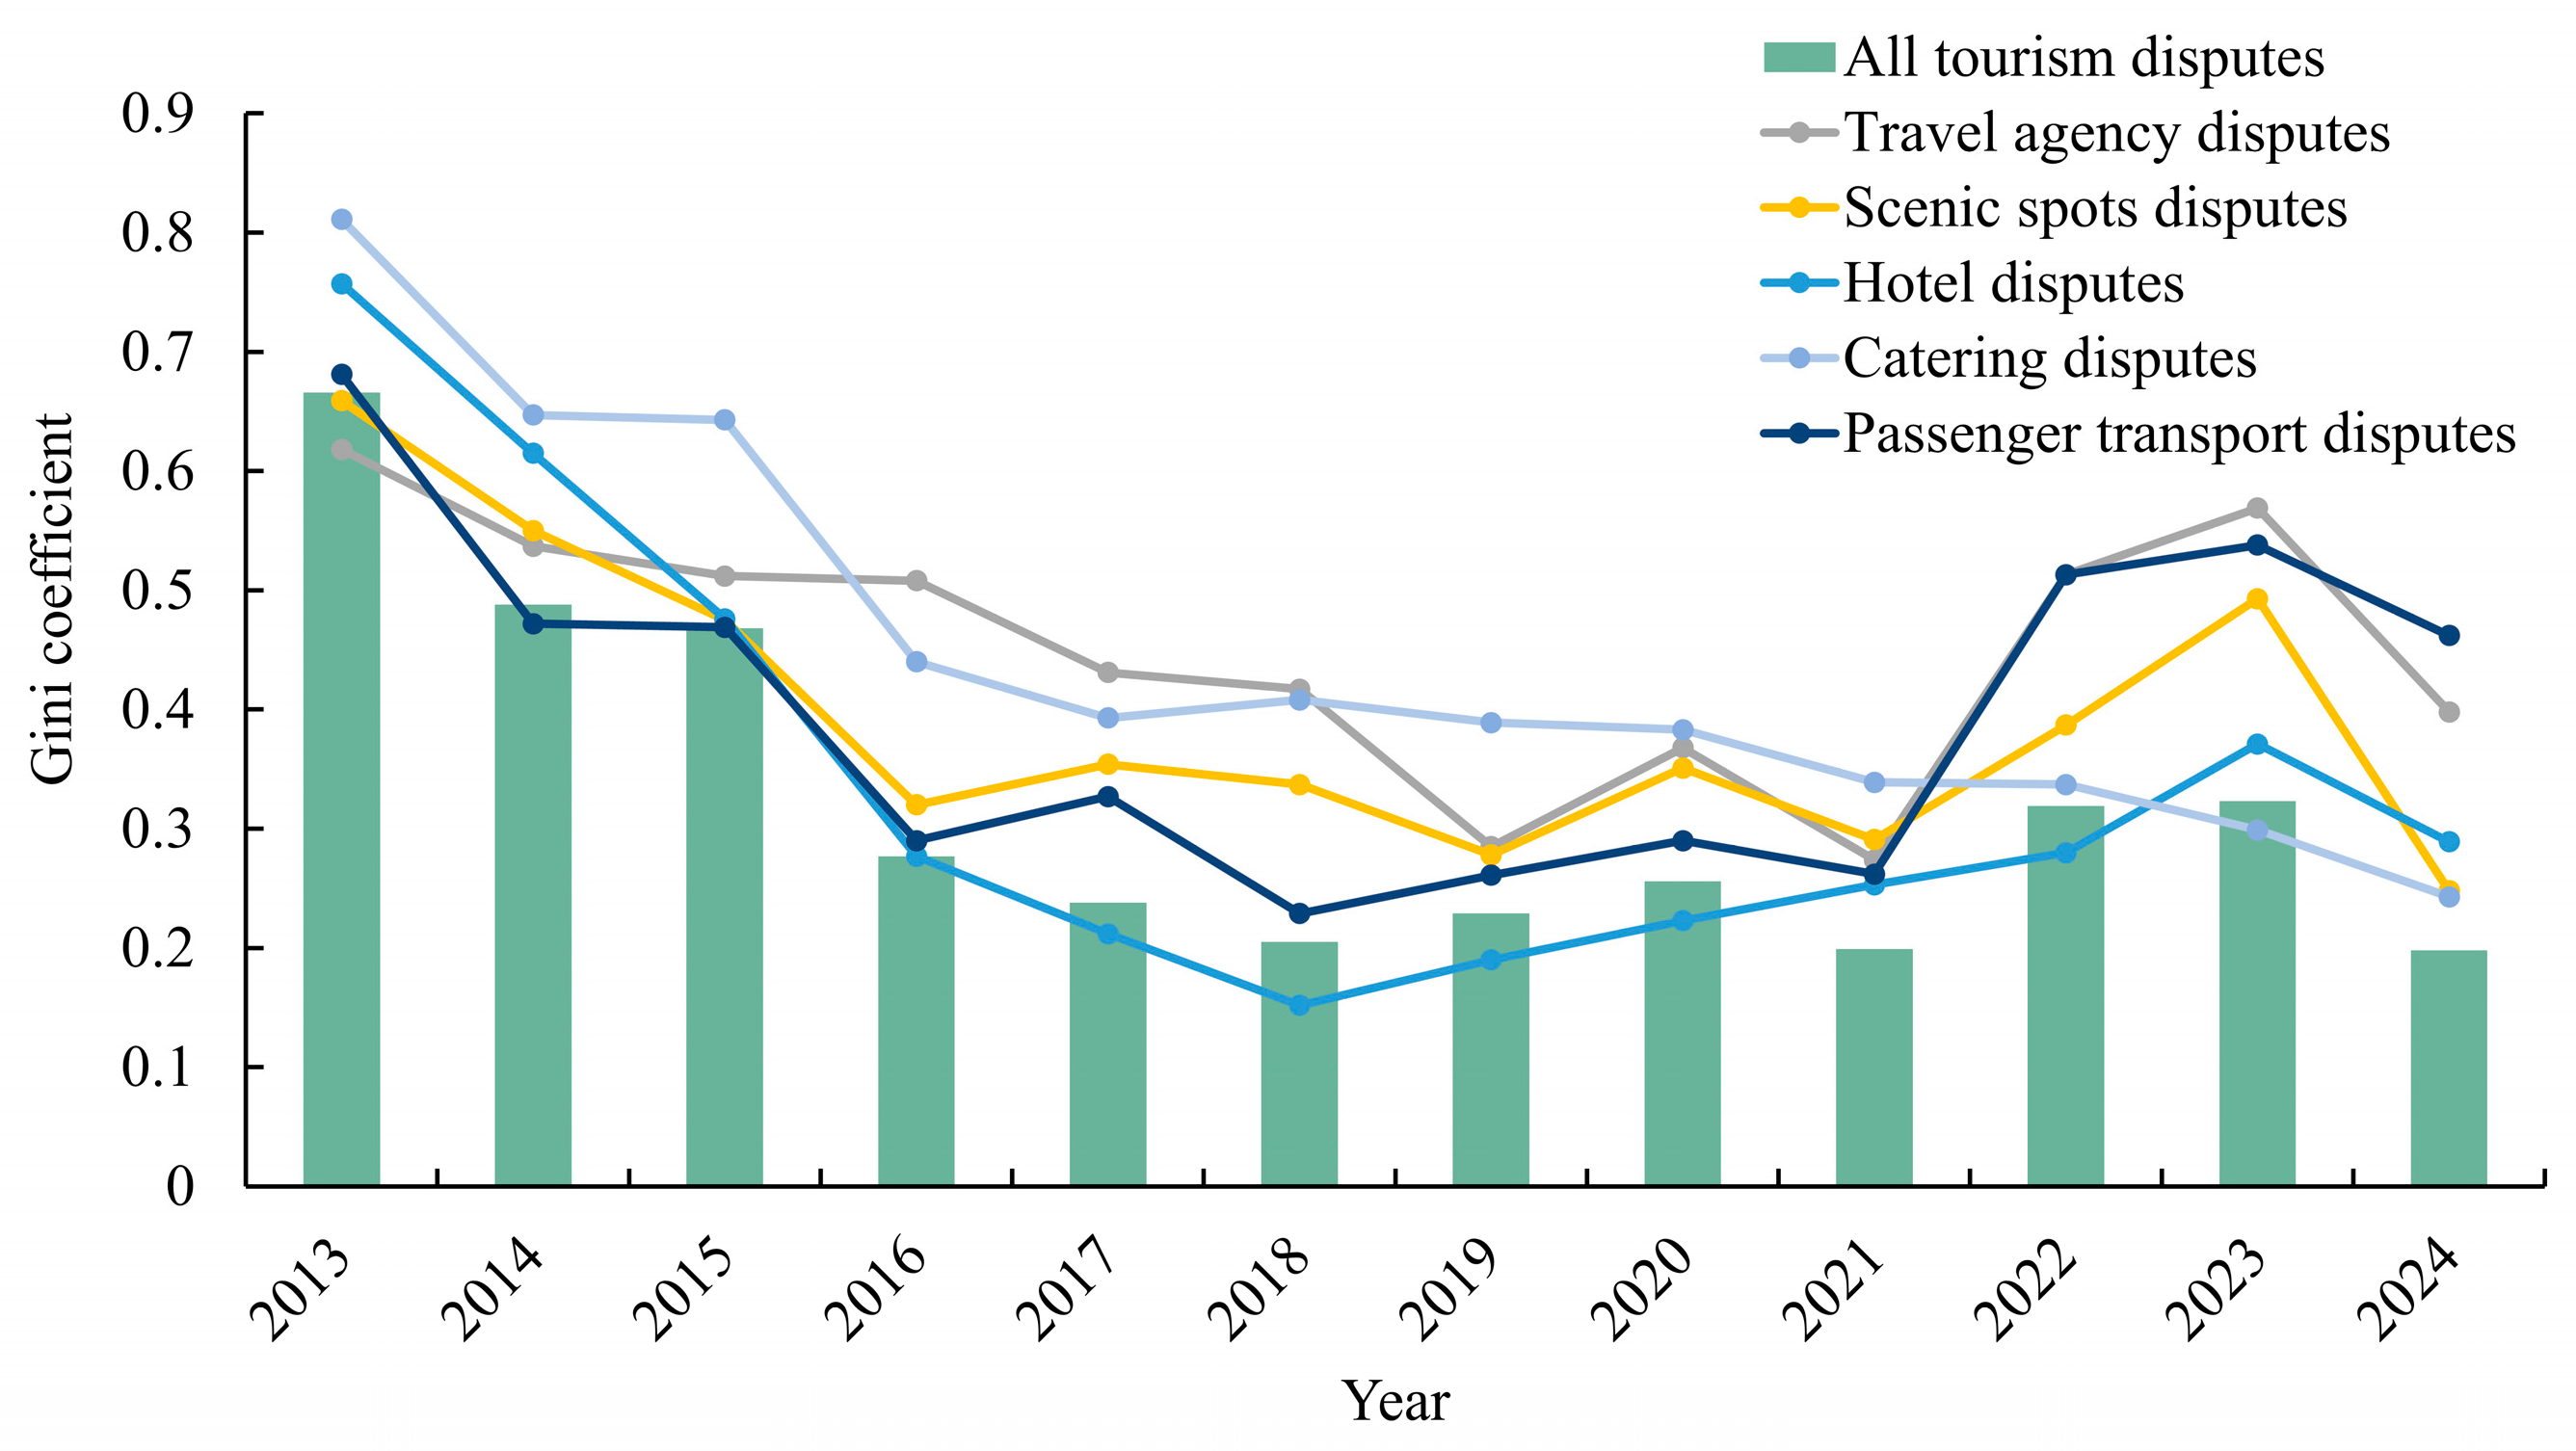
The Gini coefficient decreased from 0.666 in 2013 to 0.277 in 2016, with regional disparities shrinking sharply (Figure 7). Between 2016 and 2024, the Gini coefficient, despite occasional small fluctuations in the upward trend, remained below 0.4, indicating a low level of overall disparity. Overall, the regional differences in various types of tourism disputes along the Yangtze River Economic Belt were significant at the outset of the study period, but have gradually narrowed in recent years. This indicates that, under the guidance of collaborative governance theory, the Yangtze River Economic Belt has established a collaborative governance network characterized by institutional coordination, unified law enforcement, information sharing, and multi-stakeholder participation. This network has broken down administrative barriers, driving the transformation of tourism dispute resolution from fragmented approaches to a more integrated and systematic framework. This has not only enhanced the overall efficiency of dispute resolution, but also significantly reduced regional disparities in disputes caused by differences in geographical location, economic levels, and governance capabilities through resource reallocation, capacity rebalancing, and standard unification, bringing regional disparities into a convergence phase.
The Gini coefficient of travel agency disputes decreased from 2013 to 2021 and increased from 2021 to 2024. However, the overall level remained high, falling below the threshold of 0.4 only in 2019, 2021, and 2024. This was due to the varying levels of travel agency development in the provinces and cities along the river and fragmentation of the law, which led to significant regional disparities. However, in recent years, the fragmentation of the comprehensive governance of the travel agency market has been mitigated, and regional disparities have gradually eased. The Gini coefficients of scenic disputes showed a fluctuating pattern of decreasing and then increasing. Between 2013 and 2015 and in 2023, coefficients were higher than 0.4. Between 2016 and 2022 and in 2024, coefficients were lower than 0.4, indicating that the regional gap was small during most periods. This may be because, owing to the continuous promotion of the construction of the Yangtze River International Golden Tourism Belt, the concept of regional synergistic development was constantly strengthened, and provinces and cities actively integrated resources of tourist attractions, complementary products, and the mutual attraction of sources of passengers; thus, an integrated mode of development of tourist attractions was gradually established, and regional differences decreased. The Gini coefficient for hotel disputes showed an overall V-shaped pattern of change, with a sharp decline from 2013 to 2018 and small increase from 2018 to 2023. The coefficients remained below 0.3 from 2016 to 2022 and in 2024, indicating that regional disparities were small in most periods. This is because, in recent years, owing to the gradual maturation of the hotel market, hotel owners prefer franchising and using management models for investment and management. This has led to a high degree of uniformity in the management systems and service quality requirements of hotels in various regions, and a high degree of consistency in the mechanisms for handling consumer conflicts and complaints, resulting in a low degree of regional variation in disputes. The Gini coefficient of catering disputes showed a significant decrease from 0.811 to 0.243 (70%) from the beginning to the end of the study period, with a significant reduction in regional differences. This is because, owing to the successive introduction of catering market regulatory policies and industry norms, the management of catering enterprises in all provinces was standardized and unified; the invisible division of resources, markets, and regulations was gradually eliminated; and the regional differences in catering disputes continued to narrow. The Gini coefficient of passenger transportation disputes exhibited a fluctuating upward and downward trend, decreasing from 0.681 in 2013 to 0.262 in 2021, and gradually rising to 0.462 between 2022 and 2024. The coefficients were lower than 0.4 in most periods, indicating that the spatial equilibrium of passenger transportation disputes was relatively high. This is because, since 2016, the provinces along the river have combined their efforts to use the golden waterway of the Yangtze River and the two major transport corridors of the north and south of the Shanghai–Ruili and Shanghai–Chengdu. A networked and integrated comprehensive transportation pattern was gradually developed, with the degree of interconnection and interoperability between the provinces and cities along the river significantly improving. The degree of interconnection and communication between provinces and cities along the Yangtze River has significantly improved, and regional differences in passenger transportation disputes have converged.

4.3.2. Intra-Regional Differences

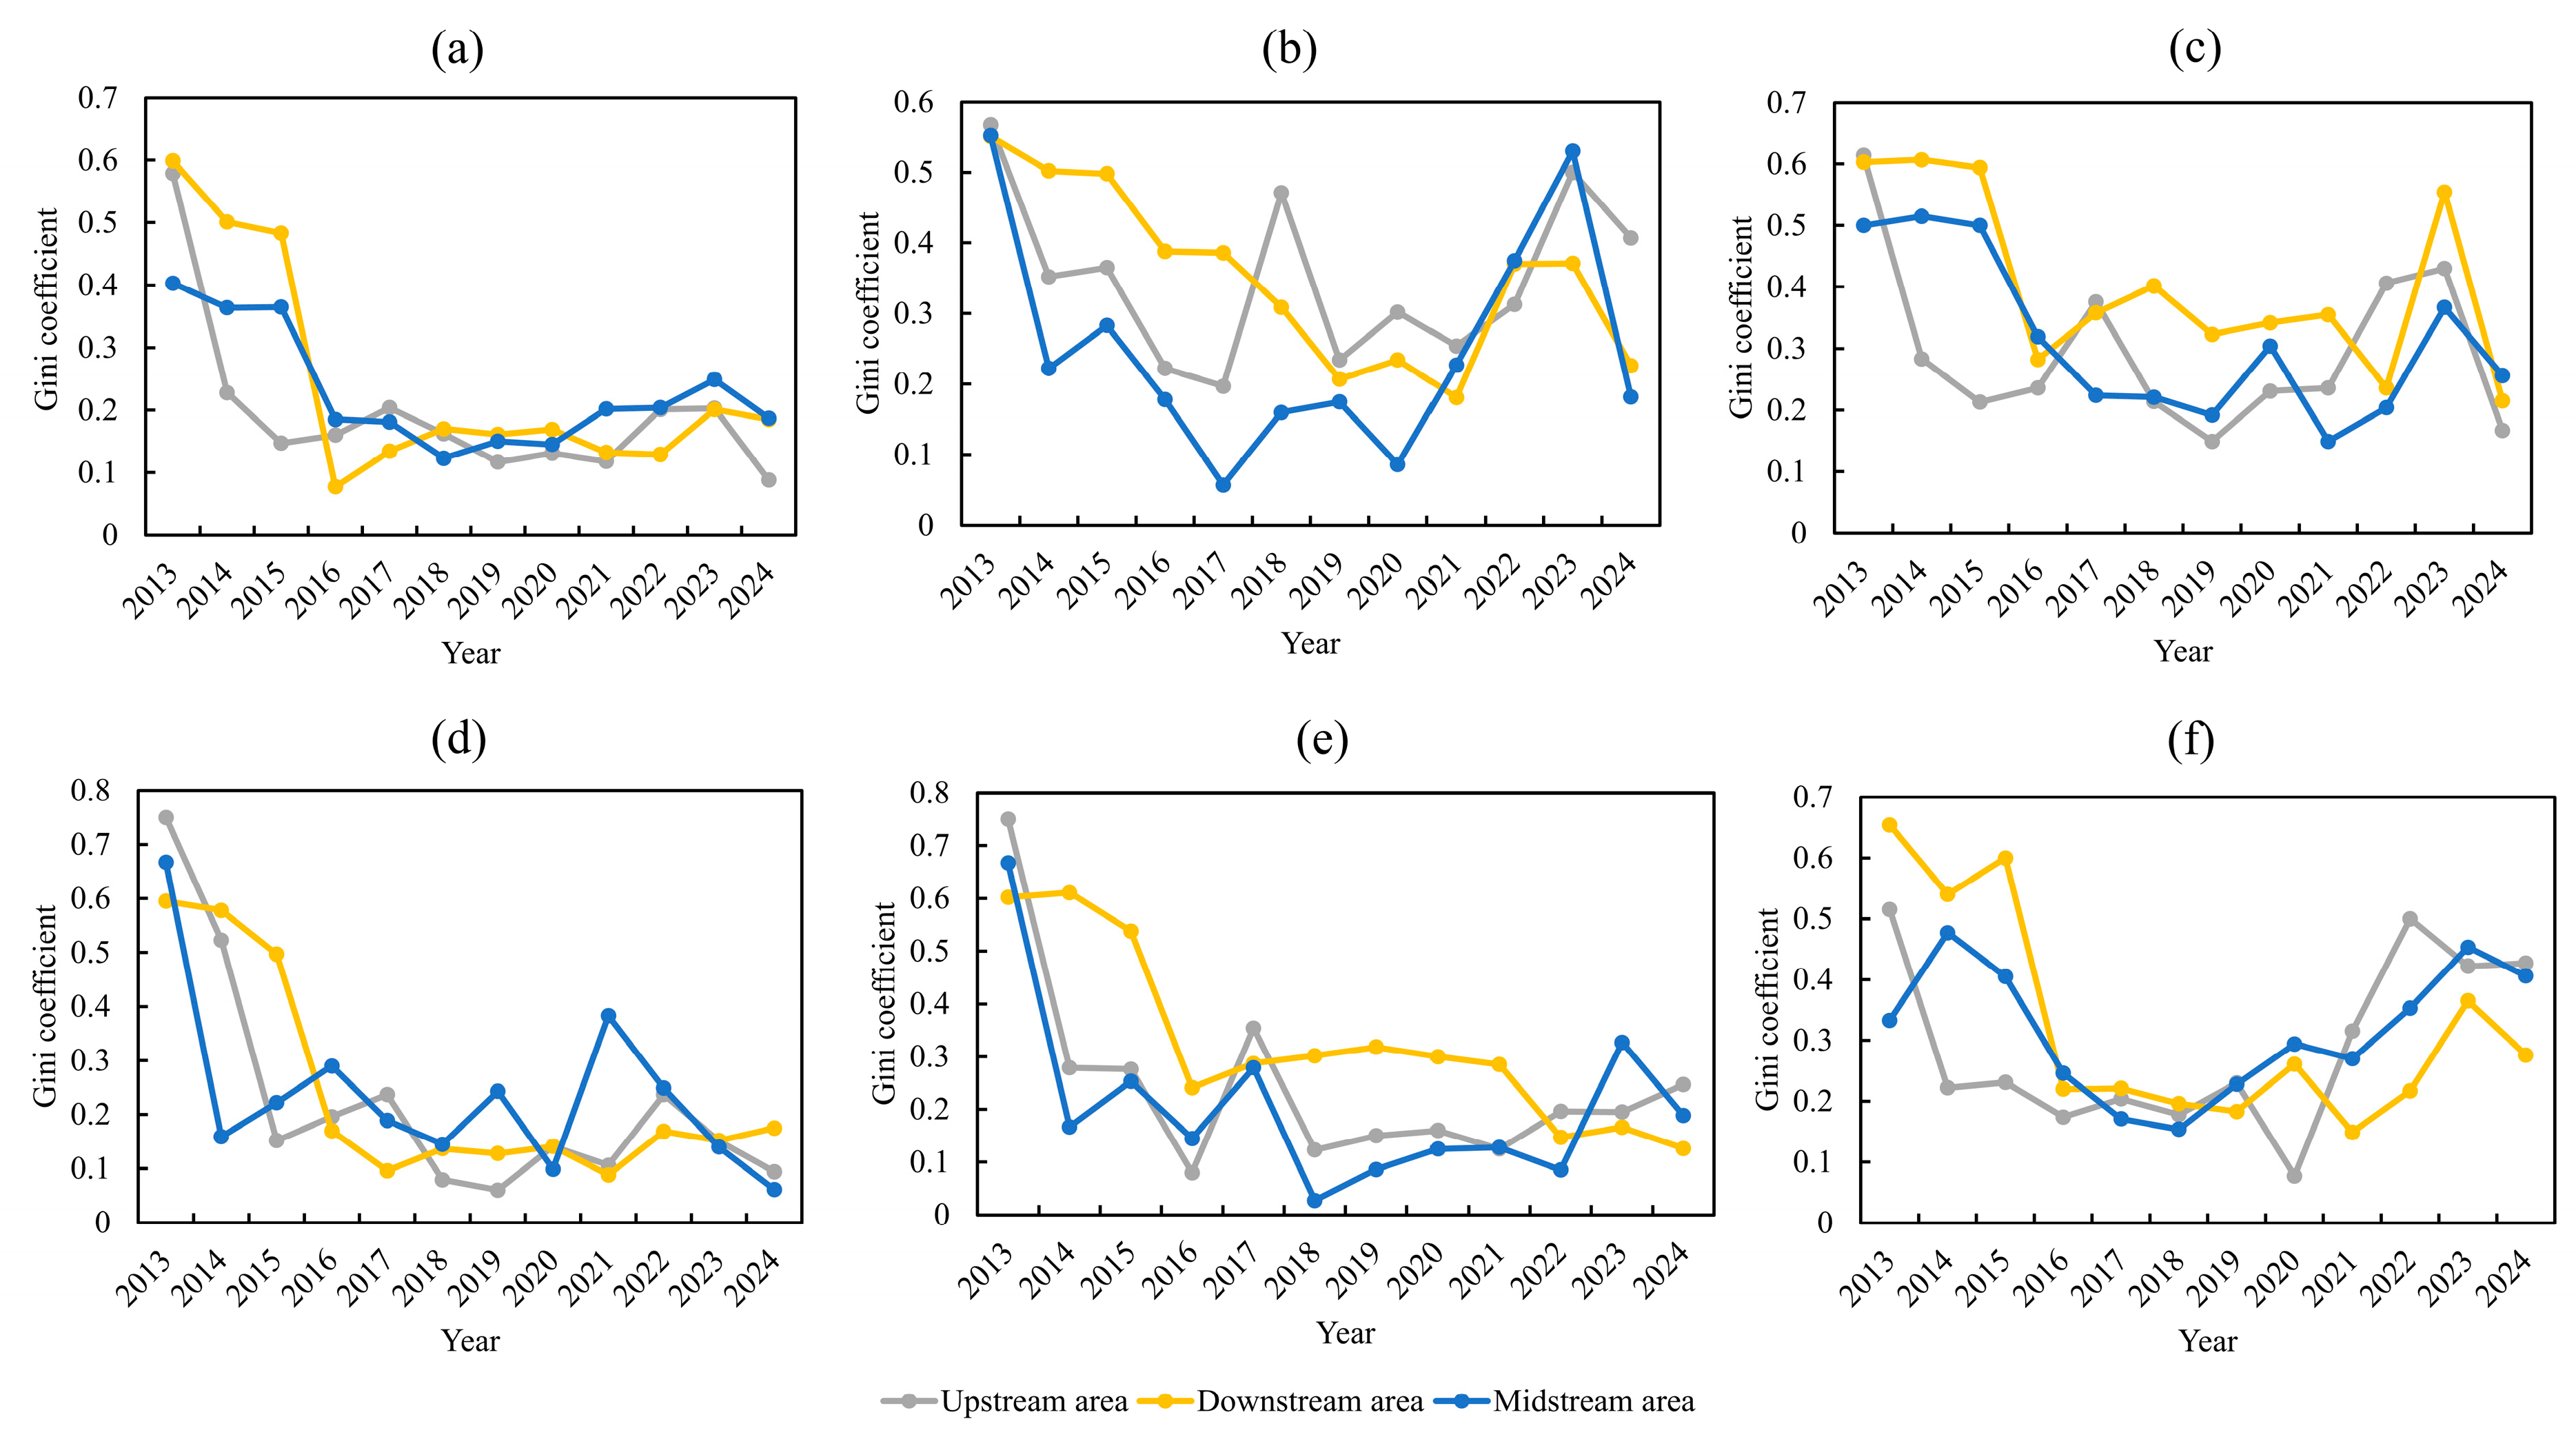
Scenic and catering disputes had greater intra-basin variations in downstream areas than in upstream and midstream areas (Figure 8a). The degree of intra-basin variation for the other types of disputes was not significantly higher. The fluctuation patterns of the Gini coefficients of all tourism disputes upstream, midstream, and downstream were similar during the study period. Between 2013 and 2016, the Gini coefficients decreased sharply, and they have remained below 0.3 since 2016, indicating that intra-regional disparities have remained low. This is because, influenced by the spatial proximity effect, the provinces within each region are geographically close, culturally homogeneous, and mutually integrated in their development, and the tourism industry is closely cooperating and efficiently connected. Furthermore, owing to the increased cooperation in cultural tourism, collaborative legislative cooperation, and other intra-regional cooperation mechanisms among the three provinces in the middle reaches of the Yangtze River, tourism law in various river basins was harmonized and unified. The distribution of disputes in the region became balanced, and differences decreased.
Hotel and restaurant disputes had Gini coefficients of less than 0.4, with small intra-regional differences, except for large intra-regional differences at the beginning of the study period (Figure 8b–f). For travel agency, scenic spot, and passenger transportation disputes, except at the beginning and end of the study period, the Gini coefficients of the upstream, midstream, and downstream regions were lower than 0.4, indicating that differences in disputes among regions were small. This is because, at the beginning of the study period, tourism law in the upper, middle, and lower reaches of the country varied, with significant differences in regulation between river basins; thus, the Gini coefficients were high. At the end of the study period, the Gini coefficient was high due to large differences in the development of the tourism industry and tourism law across the basins, influenced by the COVID-19 prevention and control policies. In the other study periods, close cooperation existed among the basins regarding tourism laws and tourism market governance, with less intra-regional variation in disputes and lower Gini coefficients.

4.3.3. Inter-Regional Differences

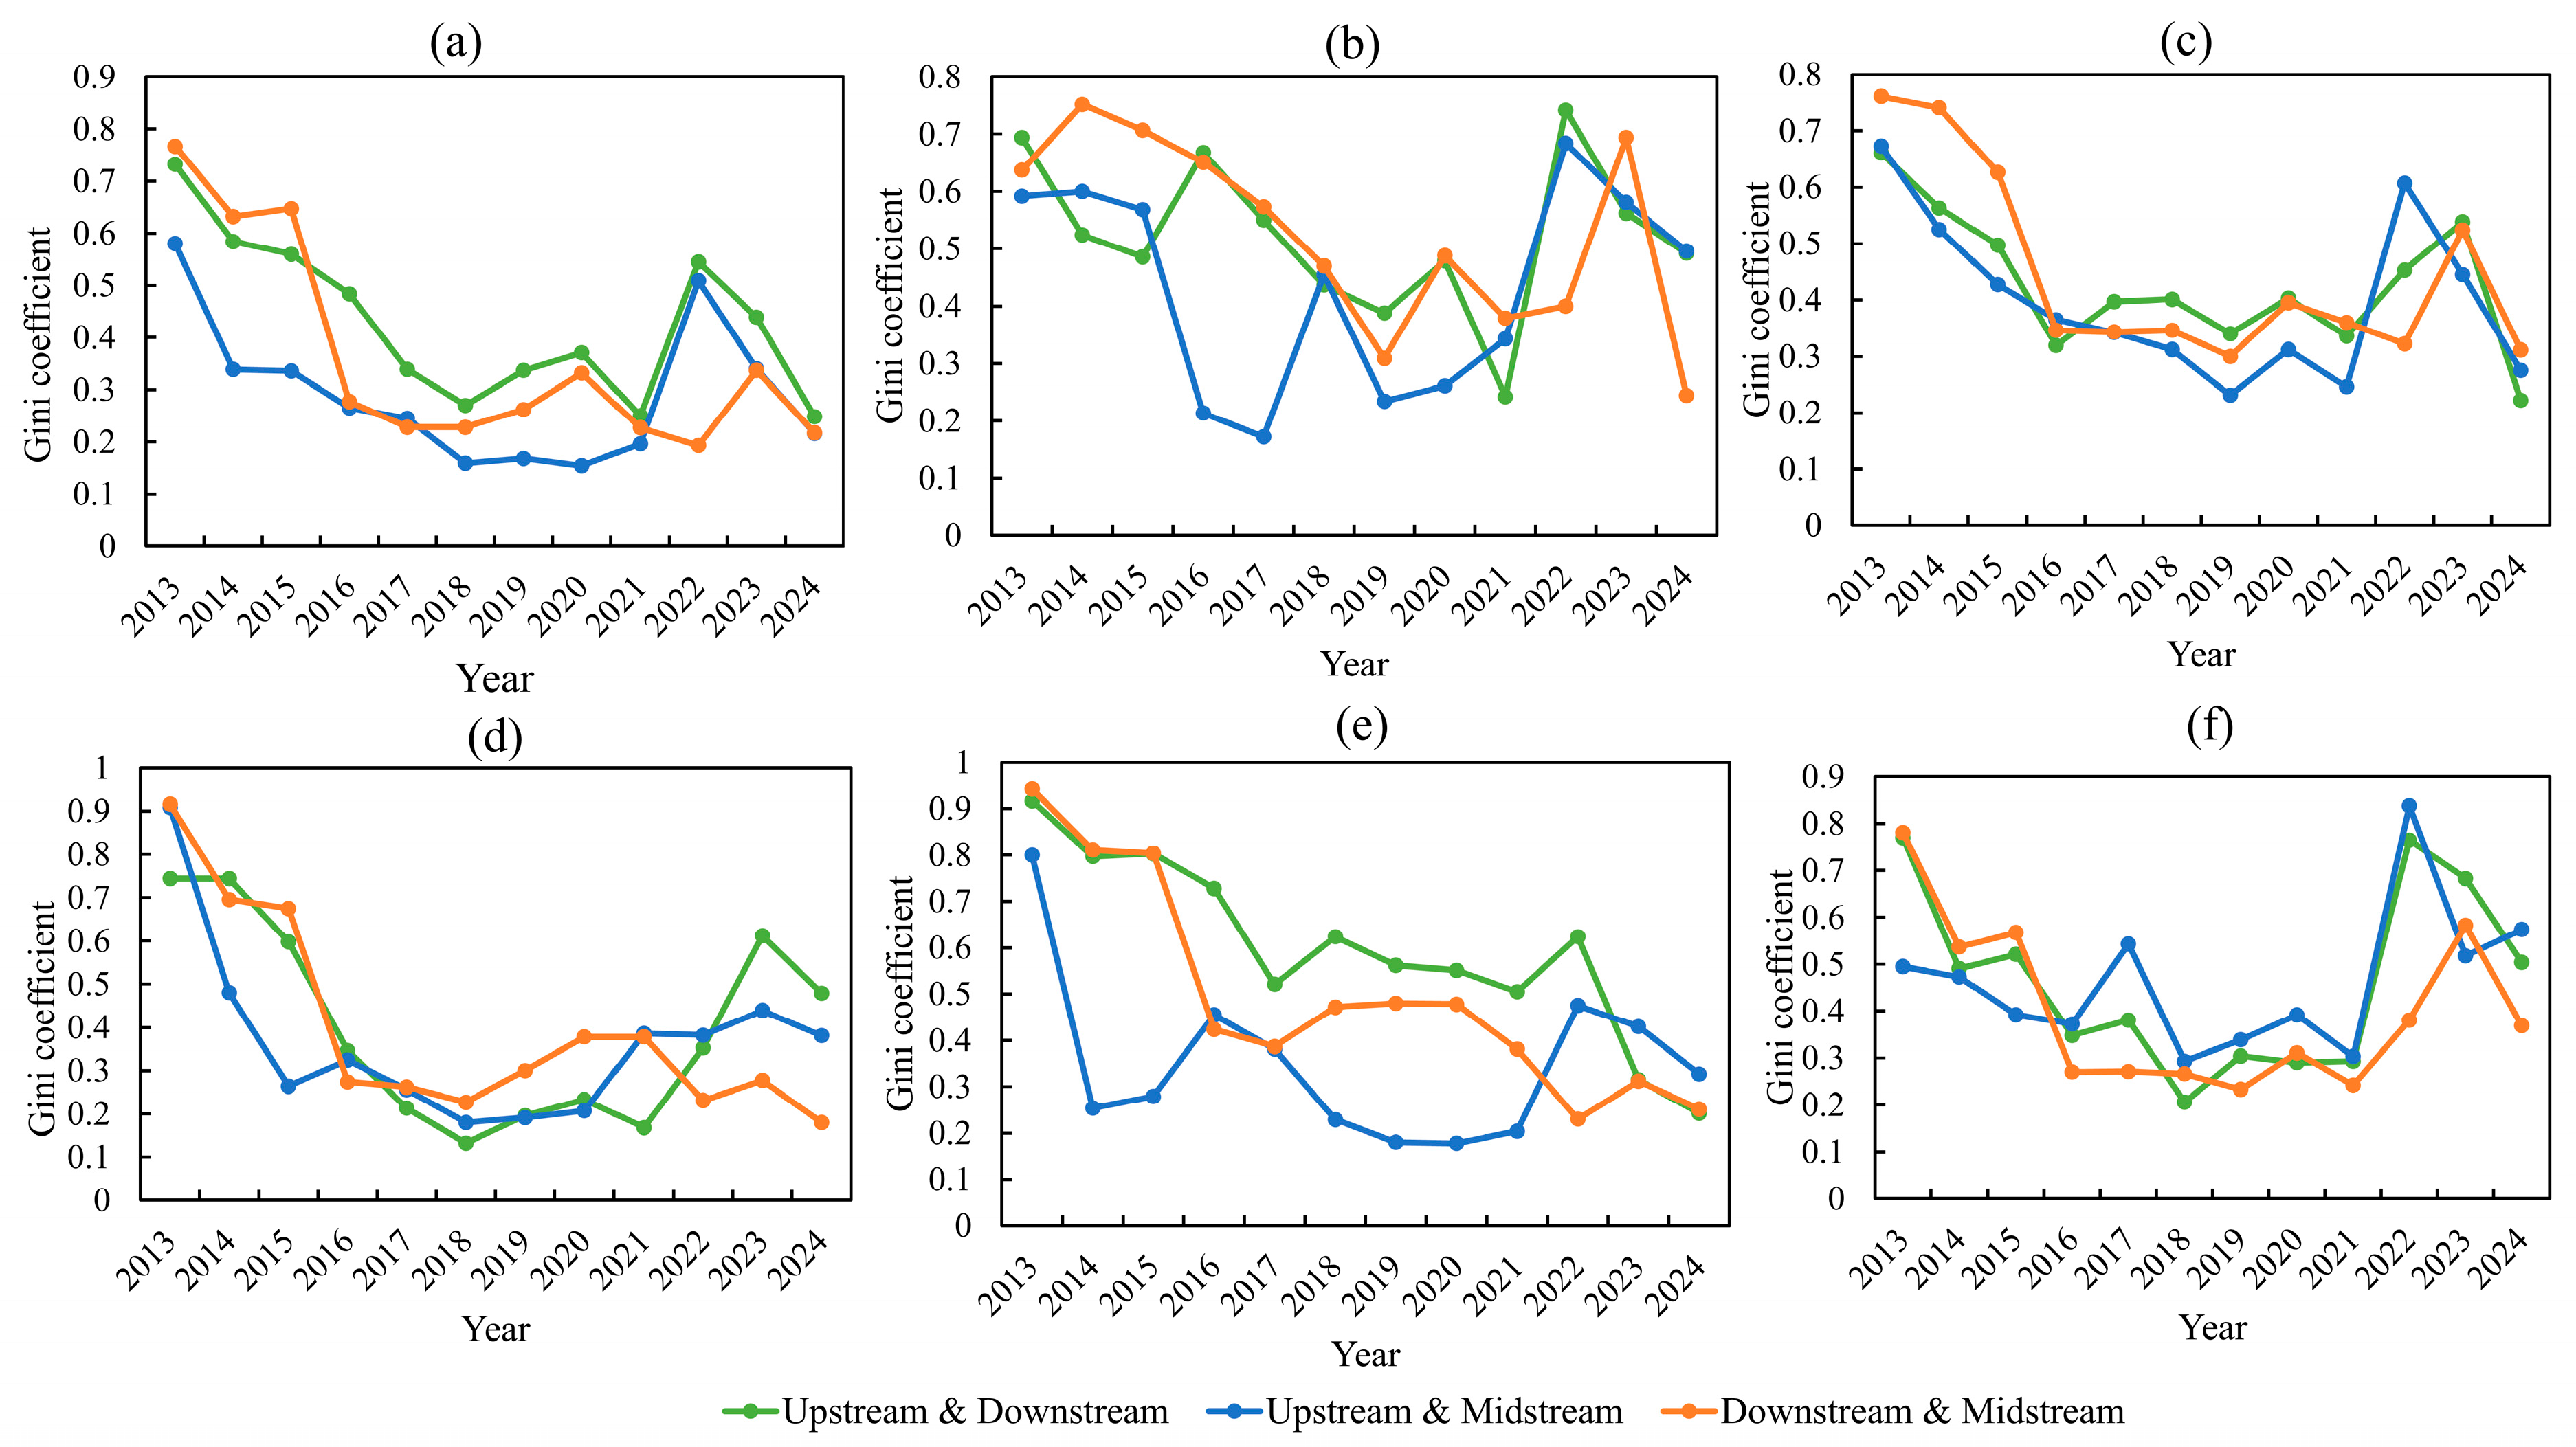
The Gini coefficient between regions exhibited a fluctuating downward trend from 2013 to 2021, with a continuous and steady improvement in regional disparities (Figure 9). This is mainly due to the increasing awareness of collaborative governance among upstream, midstream, and downstream regions, as well as the growing momentum of cross-regional cooperation in tourism market supervision. Tourism policies and markets are mutually reinforcing. This approach promotes tourism dispute resolution in a coordinated and consistent manner, further narrowing regional differences. Furthermore, the difference between the upstream and midstream regions was smaller than that between other regions, indicating that the synergistic development of the upstream and midstream regions was effective. In 2022, the upstream–downstream and upstream–midstream inter-regional differences changed significantly, and the Gini coefficient increased to over 0.4. This may be due to the implementation of COVID-19 pandemic prevention and control measures, which significantly impeded regional interaction and complementarity and hindered integration in the development of the tourism industry and its laws. Thus, inter-regional differences increased. From 2023 to 2024, China’s COVID-19 pandemic prevention and control measures were lifted, cross-regional tourism activities gradually resumed, the Gini coefficients declined again, and inter-regional disparities narrowed.
The trends in inter-regional differences in disputes over scenic spots, hotels, and passenger transportation were broadly similar. The Gini coefficient declined sharply to below 0.4 from 2013 to 2016, and remained mainly below 0.4 between 2016 and 2021, indicating that the cross-regional synergistic governance of tourism market management and legal supervision was effective and that inter-regional disparities gradually decreased. The Gini coefficient increased from 2022 to 2023 because, during this period, force majeure factors strengthened inter-regional controls, significantly limited cross-regional mobility, and widened inter-basin gaps. The situation improved in 2024, with inter-regional differences decreasing. The Gini coefficients for travel agency disputes were mainly higher than 0.4, indicating significant differences between the basins due to travel agency laws differing among the upstream, midstream, and downstream regions. Travel agency disputes increased and then decreased. Moreover, cross-regional cooperation in the regulation of travel agencies was ineffective, further exacerbating inter-regional disparities. Although the inter-regional Gini coefficients for upstream–downstream and downstream–midstream differences in catering disputes exhibited a fluctuating downward trend, they were mainly higher than 0.4, indicating that inter-regional disparities remained high. This is because catering industry laws were polarized among river basins, and market regulation effects differed. In addition, interest and regional barriers hindered the synergistic development of the catering industry in the upper, middle, and lower reaches of the river, and the gap between regions widened. The small difference between the upstream and midstream regions indicated that catering industry laws in the upstream and midstream regions were similarly effective, and that the gap between the basins was minimal.

4.4. Robustness Test

To ensure the robustness and reliability of the research results, we conducted a robustness analysis of the spatial correlation in this study. Two methods were employed for the robustness analysis: adjusting the study period and replacing the weight matrix. (1) Given the significant impact of the COVID-19 pandemic on China’s tourism industry, the study period was shortened to 2013–2019 to eliminate its interference with the research results. (2) Considering that the spatial weight matrix might influence the research results, the original adjacency matrix was replaced with a geographic distance matrix for verification. The geographic distance matrix was calculated using the latitude and longitude coordinates of the provincial capitals’ government seats to represent the inverse distance squared matrix. The robustness test results (Table 4) show that all p-values are less than 0.05, and all Moran’s I indices are greater than 0. This indicates that various types of tourism disputes exhibit spatial correlation and positive spatial correlation characteristics. This aligns with the previously mentioned spatial correlation empirical results, suggesting that the research conclusions possess a certain degree of reliability.

5. Discussion

5.1. Main Findings

The research findings indicate that during the period from 2013 to 2024, tourism disputes of various types along the Yangtze River Economic Belt primarily underwent four distinct phases: a rapid growth phase, a stable peak phase, a rapid decline phase, and a recovery phase. This phenomenon aligns with the developmental patterns of China’s tourism market governance [25,32,49]. Disputes involving scenic areas and travel agencies accounted for a significant proportion of the total. The underlying reason for this is that in the tourism market, operators of scenic spots and travel agencies hold key information regarding service details, risk hazards, and price structures, while tourists often find themselves at an informational disadvantage [7]. For example, scenic spots may lack standardized internal management, with maintenance records and safety inspection results for special equipment (such as cable cars and amusement facilities) not being publicly disclosed. Tourists are unable to anticipate potential risks, posing serious safety hazards for tourism consumers. To attract tourists, scenic spots exaggerate their promotions and disseminate misleading advertisements, infringing on consumers’ rights to know the truth [9]. Travel agencies often use lengthy, professional-style contracts to hide unfair terms and key information (such as high liquidated damages or unilateral termination rights), resulting in consumers’ rights to know being compromised [8]. In situations of information asymmetry, decision-making biases arise due to disparities in information access capabilities between the two parties [6]. This results in infringements on tourism consumers’ rights and interests, thereby triggering tourism-related consumer litigation disputes.
The study findings confirm that the spatial distribution patterns of tourism disputes vary across different types of regions within the Yangtze River Economic Belt, and that the occurrence of tourism disputes exhibits distinct geographical spatial characteristics. This conclusion aligns with the objective laws of the man–land relationship theory and production of space theory [12,13,15,16]. In the downstream regions of Shanghai, Jiangsu, Zhejiang, and Anhui, where tourism’s economic vitality is strong, conflicts and disputes between tourism consumers and operators are more likely to arise, resulting in a significantly higher number of tourism disputes compared to in the upstream and midstream regions. The reason for this lies in the fact that downstream regions have developed economies, well-developed tourism infrastructure, and high visitor volumes. However, disputes over tourism resource development rights and the distribution of commercial interests often arise between operators, local residents, and tourists. Under this social conflict model, tourism operators and consumers engage in disputes due to unequal resource distribution [50]. In contrast, upstream and midstream regions have lower levels of tourism development, resulting in relatively milder conflicts of interest and fewer tourism disputes.
The collaborative governance of tourism disputes emphasizes the joint participation of multiple stakeholders, including the government, market, and the public, through institutional design to achieve industry collaboration, regional collaboration, and basin collaboration [18,21]. Basin-wide integrated development is an important strategy for the development of tourism in the Yangtze River Economic Belt [40]. The results indicate that there are certain differences in tourism disputes between the upper, middle, and lower reaches of the Yangtze River Economic Belt. The differences between the upper, middle, and lower reaches are particularly significant in disputes involving travel agencies and catering services. This conclusion aligns with the findings of scholars such as Tang, X.Y. [49], Wang, W.F. [25], and Wang, C.P. [32], who have highlighted the imbalance in tourism law enforcement and regulatory oversight across Chinese basins, as well as the existence of basin-level barriers. The causes of this phenomenon include differences in tourism dispute resolution standards, enforcement intensity, and policy implementation among the upper, middle, and lower reaches, leading to inadequate collaborative governance. It is worth noting that at the beginning of the study period, there were significant disparities in tourism disputes across the river basin. However, in recent years, the Gini coefficient has shown an overall downward trend. This trend indicates that the coordinated effects of tourism development and dispute resolution in the Yangtze River Economic Belt are gradually improving, resulting in a reduction in disparities across the river basin. Therefore, each basin needs to break down administrative barriers and strengthen intra-basin and cross-basin cooperation in tourism market regulation and tourism legal system construction to achieve collaborative governance of tourism disputes.

5.2. Theoretical Implications

This study is based on the theory of accident causation, combined with the stakeholder theory, information asymmetry theory, social conflict theory, consumer rights protection theory, human–land relationship theory, and spatial production theory, to construct the causal mechanism and theoretical framework of tourism disputes. From a geographical and spatial perspective, it explores the temporal, spatial, and watershed differences in five types of tourism disputes: travel agencies, scenic spots, hotels, catering, and passenger transportation. The study completed the research process using phenomenon discovery, mathematical verification, and feature analysis. This study addresses the limitation of relying solely on quantitative research methods in tourism dispute studies, thereby enriching the methodological framework for such research. Furthermore, this study provided data support and theoretical guidance for various types of tourism disputes in different provinces and river basins based on local conditions, precise measures, and differentiated governance.

5.3. Practical Implications

A categorized approach to resolving tourism disputes, with a focus on regions where various types of disputes are highly concentrated, can be implemented. Concentrating resources and focusing on key areas effectively curbed the high incidence of disputes. (1) In areas with a high incidence of travel agency disputes, a travel agency credit scoring system can be promoted, incorporating complaint rates, contract fulfillment rates, and the number of administrative penalties into the rating criteria. A mandatory contract filing system for travel agencies should be implemented to further clarify accommodation standards, shopping frequency, and details of optional paid activities. The use of blockchain technology for storing travel contracts can be piloted. Electronic QR codes for travel agency contracts can be automatically generated, allowing tourists to scan and verify them. (2) For high-incidence areas of disputes involving scenic spots, a rapid response and public rectification mechanism can be established, with dispute resolution results disclosed within 24 h. The model of itinerant tourism courts can be promoted, establishing permanent legal service stations in 5A-rated scenic spots. Tourism judicial work such as “bringing the law to the grassroots” can continue to be conducted, enhancing the integrity-based business operation awareness of scenic spot staff. The existing tourism scenic spot mediation system can be deepened, implementing a three-tier dispute diversion system (on-site mediators → police stations → itinerant courts). A dedicated hotel attendant system, staffed with professional mediation specialists, can be established for each mid-to-high-end hotel. A hotel dispute arbitration system can be piloted and a professional and rapid adjudication channel can be established. (4) For areas with a high incidence of catering disputes, the live streaming model for restaurant kitchens can be promoted. A catering credit QR code can be established and dynamic point deduction management for merchants implemented. A food ingredient traceability system can be promoted to achieve full video recording and traceability of the weighing process. At the same time, uniform catering standards can be set and the measurement and pricing norms for seafood and other goods that are prone to disputes unified. (5) In areas with a high incidence of passenger transportation disputes, an online mediation platform for transportation disputes to enable 24/7 online resolution of disputes involving high-speed rail, long-distance bus services, etc., can be promoted. A service commitment system for tourism transportation can be piloted, requiring passenger transport companies to publicly disclose key indicators such as on-time rates and complaint rates. Joint enforcement stations for tourism transportation can be established to enable coordinated handling by multiple departments including transportation, culture and tourism, and market regulation.
Cross-regional and intra-regional collaborative governance of tourism disputes can be implemented to improve overall governance efficiency. (1) There are significant inter-regional differences in travel agency disputes and catering disputes. For the collaborative governance of travel agency disputes, the upstream, midstream, and downstream regions should jointly establish a travel agency credit blacklist database to achieve real-time sharing of information on travel agencies that violate regulations and joint punishment for businesses that repeatedly violate regulations should be implemented. Tourism service standards for the Yangtze River Economic Belt to unify the quality requirements for cruise ships, tour guides, and travel agencies should be jointly published. For the coordinated governance of catering disputes, the Yangtze River Economic Belt should jointly build a shared blacklist platform for tourism catering, implement joint inter-provincial punishment for acts such as shortchanging and price fraud, and establish a mechanism for the mutual recognition of inter-provincial catering standards. (2) There are more tourism disputes in the downstream areas of the Yangtze River Economic Belt than in the upstream and midstream areas. Therefore, it is necessary to focus on dispute governance in the downstream areas and release the multiplier effect of governance through internal joint governance. Regulatory coordination and law enforcement cooperation among core tourism cities in the downstream region (such as Shanghai, Hangzhou, Suzhou, and Nanjing) should be strengthened and cross-regional emergency response and joint law enforcement mechanisms should be established. For example, a cross-provincial tourism arbitration collaboration network and a tourism dispute resolution collaboration mechanism should be established, and mediation resources in the downstream region should be integrated. The four provinces of Shanghai, Jiangsu, Zhejiang, and Anhui can gradually achieve the interconnectivity of tourism public service data (such as merchant evaluations and complaint records), utilize big data to precisely monitor industries and regions with high incidence of tourism disputes, and jointly build a credit information sharing platform. For example, a mutual recognition system for hotel service standards can be established and regional joint sanctions implemented. A blacklist sharing mechanism to impose cross-regional joint sanctions on severely non-compliant passenger transport enterprises should be established.

5.4. Limitations and Future Research

This study had several limitations. First, this study conducted an empirical analysis of tourism disputes only from a geospatial perspective, and the research methodology and content were not sufficiently comprehensive. Future studies should incorporate qualitative research methods, such as ethnography, participatory observation, in-depth interviews, and the rootedness theory, to explore the causal factors and differences in tourism disputes. In addition, disputants’ individual characteristics, such as gender, age, and occupation, could be obtained from legal documents and used to explore the demographic distribution characteristics of tourism disputes. Second, the classification of various types of tourism disputes was relatively general. In addition to the topics investigated, the tourism industry comprises shopping, leisure, entertainment, and other related industries. Future comprehensive research could examine conflicts and disputes in tourism sub-sector and specific tourism markets, such as rural, medical, and sports tourism.
Furthermore, future studies could expand the discipline perspective to explore tourism disputes, law construction, and other extended issues. For instance, studies could use field surveys, eye movement experiments, questionnaire surveys, and other methods to explore the perceptions, behavioral tendencies, and influencing factors of tourism disputes among various stakeholders, such as tourism administrators, operators, and consumers. In addition, studies could construct an evaluation index system for tourism law construction and use comprehensive evaluation tools combining coordination models and other methods to measure the degree of coordination and spatial matching between tourism laws and economic levels. Moreover, studies could use the evolutionary game model to define the relationships among tourism enterprises, consumers, and other litigation participants and identify the distribution of interests and strategic choices of multiple litigation stakeholders.

Author Contributions

Data curation, N.W.; formal analysis, N.W.; investigation, N.W.; methodology, N.W.; validation, N.W.; visualization, N.W.; writing—original draft, N.W.; writing—review and editing, N.W.; conceptualization, G.W.; funding acquisition, G.W.; project administration, G.W.; supervision, G.W. All authors have read and agreed to the published version of the manuscript.

Funding

This research was funded by the National Social Science Fund of China, grant number 23BJY143.

Data Availability Statement

The raw data supporting the conclusions of this article will be made available by the authors on request.

Conflicts of Interest

The authors declare no conflicts of interest.

References

  1. Xu, Y.Y.; McGehee, N.G. Tour guides under zero-fare mode: Evidence from China. Curr. Issues Tour. 2017, 20, 1088–1109. [Google Scholar] [CrossRef]
  2. Cao, X. Challenges and potential improvements in the policy and regulatory framework for sustainable tourism planning in China: The case of Shanxi Province. J. Sustain. Tour. 2015, 23, 455–476. [Google Scholar] [CrossRef]
  3. Qasim, S.O.; Tumer, M.; Ozturen, A.; Kilic, H. Mediating role of legal services in tourism development: A necessity for sustainable tourism destinations. Curr. Issues Tour. 2020, 23, 2866–2883. [Google Scholar] [CrossRef]
  4. Theodoulidis, B.; Diaz, D.; Crotto, F.; Rancati, E. Exploring corporate social responsibility and financial performance through stakeholder theory in the tourism industries. Tour. Manag. 2017, 62, 173–188. [Google Scholar] [CrossRef]
  5. Song, H.M.; Zhu, C.S.; Fong, L.H.N. Exploring Residents’ Perceptions and Attitudes towards Sustainable Tourism Development in Traditional Villages: The Lens of Stakeholder Theory. Sustainability 2021, 13, 13032. [Google Scholar] [CrossRef]
  6. Lin, M.S.; Sharma, A.; Pan, B.; Quadri-Felitti, D. Information asymmetry in the innovation adoption decision of tourism and hospitality SMEs in emerging markets: A mixed-method analysis. Tour. Manag. 2023, 99, 104793. [Google Scholar] [CrossRef]
  7. Wu, D.D.; Li, H. Information Asymmetry in Tourism Market: The Bilateral Effects of ESG Practices on Firm Profitability. J. Travel Res. 2025, 00472875251332950. [Google Scholar] [CrossRef]
  8. Nedelea, A.; Balan, A. E-TOURISM AND TOURISM SERVICES CONSUMER PROTECTION. Amfiteatru Econ. 2010, 12, 492–503. [Google Scholar]
  9. Petrovic, J.; Milicevic, S. Consumer Protection as a Factor of Destination Competitiveness in the European Union. Amfiteatru Econ. 2017, 19, 432–446. [Google Scholar]
  10. Zmyslony, P.; Kowalczyk-Aniol, J.; Dembinska, M. Deconstructing the Overtourism-Related Social Conflicts. Sustainability 2020, 12, 1695. [Google Scholar] [CrossRef]
  11. Yang, Y.B.; Xie, A.L.; Cheng, K. Research on Spatio-Temporal Evolution Characteristics and Driving Factors of Tourism Destination Environmental System Resilience in Yangtze River Economic Belt. Pol. J. Environ. Stud. 2024, 33, 5429–5441. [Google Scholar] [CrossRef]
  12. Lu, L.; Bao, J.; Huang, J.F.; Zhu, Q.J.; Mu, C.L.; Chu, X.L.; Xu, Y.; Zha, X.L. Recent research progress and prospects in tourism geography of China. J. Geogr. Sci. 2016, 26, 1197–1222. [Google Scholar] [CrossRef]
  13. Meng, L.; Zhu, C.G.; Pu, J.; Wen, B.; Si, W.T. Study on the Influence Mechanism of Intangible Cultural Heritage Distribution from Man-Land Relationship Perspective: A Case Study in Shandong Province. Land 2022, 11, 1225. [Google Scholar] [CrossRef]
  14. Luo, F.; Moyle, B.D.; Bao, J.G.; Zhong, Y.D. The role of institutions in the production of space for tourism: National Forest Parks China. For. Policy Econ. 2016, 70, 47–55. [Google Scholar] [CrossRef]
  15. Kulusjärvi, O. Towards just production of tourism space via dialogical everyday politics in destination communities. Environ. Plan. C-Politics Space 2020, 38, 751–767. [Google Scholar] [CrossRef]
  16. Bi, G.H.; Yang, Q.Y. The spatial production of rural settlements as rural homestays in the context of rural revitalization: Evidence from a rural tourism experiment in a Chinese village. Land Use Policy 2023, 128, 106600. [Google Scholar] [CrossRef]
  17. Barandiarán, X.; Restrepo, N.; Luna, A. Collaborative governance in tourism: Lessons from Etorkizuna Eraikiz in the Basque Country, Spain. Tour. Rev. 2019, 74, 902–914. [Google Scholar] [CrossRef]
  18. Valderrama, E.L.; Polanco, J.A.; Hernandez-Diaz, P.M. Does collaborative governance mediate rural tourism to achieve sustainable territory development? Evidence of stakeholders’ perceptions in Colombia. Sustain. Dev. 2025, 33, 493–507. [Google Scholar] [CrossRef]
  19. Bichler, B.F.; Lösch, M. Collaborative Governance in Tourism: Empirical Insights into a Community-Oriented Destination. Sustainability 2019, 11, 6673. [Google Scholar] [CrossRef]
  20. Lin, M.S.; Zhang, H.Y.; Luo, Y.; Li, Y.P. Environmental, social, and governance (ESG) measurement in the tourism and hospitality industry: Views from a developing country. J. Travel Tour. Mark. 2024, 41, 154–168. [Google Scholar] [CrossRef]
  21. Tse, S.W.T.; Tung, V.W.S. Advocating Sustainable Tourism in China: A Transitory, Top-Down Stakeholder Engagement Perspective. Int. J. Tour. Res. 2025, 27, e70034. [Google Scholar] [CrossRef]
  22. Sontag, K.; Roux, F. Sporting and tourist activities: Legal aspects What legal framework for sports, leisure and tourism activities? Rev. Geogr. Alp.-J. Alp. Res. 2013, 101, 548–558. [Google Scholar] [CrossRef]
  23. Khater, M.; Ibrahim, O.; Sayed, M.N.E.; Faik, M. Legal frameworks for sustainable tourism: Balancing environmental conservation and economic development. Curr. Issues Tour. 2024, 27, 1–22. [Google Scholar] [CrossRef]
  24. Hobe, S. The legal regime for private space tourism activities-An overview. Acta Astronaut. 2010, 66, 1593–1596. [Google Scholar] [CrossRef]
  25. Wang, W.F.; Chang, Y.; Pearce, P.L. China’s first Tourism Law: Representations of stakeholders’ responses. J. Tour. Cult. Change 2018, 16, 309–327. [Google Scholar] [CrossRef]
  26. Serrat, J.M.B. Quality of hotel service and consumer protection: A European contract law approach. Tour. Manag. 2011, 32, 277–287. [Google Scholar] [CrossRef]
  27. Newlands, G.; Lutz, C. Fairness, legitimacy and the regulation of home-sharing platforms. Int. J. Contemp. Hosp. Manag. 2020, 32, 3177–3197. [Google Scholar] [CrossRef]
  28. Seta, M. Compulsory insurance for cruise vessels as a preparation for the next pandemic: Law of the sea perspective. Mar. Policy 2023, 152, 105586. [Google Scholar] [CrossRef]
  29. Nie, Y.Z.; Han, X.P. Research on consumers’ protection in advantageous operation of big data brokers. Clust. Comput.-J. Netw. Softw. Tools Appl. 2019, 22, S8387–S8400. [Google Scholar] [CrossRef]
  30. Liu, Y.X.; Yao, Y.B.; Fan, D.X.F. Evaluating Tourism Market Regulation from Tourists’ Perspective: Scale Development and Validation. J. Travel Res. 2020, 59, 975–992. [Google Scholar] [CrossRef]
  31. Shao, J.; Wang, M. Tourism law, labor supply and corporate performance in tourism listed firms. Financ. Res. Lett. 2024, 68, 105971. [Google Scholar] [CrossRef]
  32. Wang, C.P.; Xu, H.G. The role of local government and the private sector in China’s tourism industry. Tour. Manag. 2014, 45, 95–105. [Google Scholar] [CrossRef]
  33. Randle, E.J.; Hoye, R. Stakeholder perception of regulating commercial tourism in Victorian National Parks, Australia. Tour. Manag. 2016, 54, 138–149. [Google Scholar] [CrossRef]
  34. Dinica, V. Tourism on Curacao: Explaining the Shortage of Sustainability Legislation from Game Theory Perspective. J. Environ. Policy Plan. 2012, 14, 161–188. [Google Scholar] [CrossRef]
  35. Asongu, S.A.; Rahman, M.; Nnanna, J. Law, political stability, tourism management and economic development in sub-Saharan Africa. Curr. Issues Tour. 2023, 26, 2678–2691. [Google Scholar] [CrossRef]
  36. Dutta, N.; Kar, S. Relating rule of law and budgetary allocation for tourism: Does per capita income growth make a difference for Indian states? Econ. Model. 2018, 71, 263–271. [Google Scholar] [CrossRef]
  37. Gozgor, G.; Lau, C.K.M.; Zeng, Y.; Lin, Z.B. The effectiveness of the legal system and inbound tourism. Ann. Tour. Res. 2019, 76, 24–35. [Google Scholar] [CrossRef]
  38. Bayar, Y.; Gavriletea, M.D.; Remeikiene, R. Impact of the rule of law, corruption and terrorism on tourism: Empirical evidence from Mediterranean countries. Oeconomia Copernic. 2023, 14, 1009–1035. [Google Scholar] [CrossRef]
  39. Tan, S.K.; Zou, S.J.; Zhao, Y.; He, Q.S.; Zhang, M.M. Research on the Manifestation and Formation Mechanism of New Characteristics of Land Disputes: Evidence from the Yangtze River Economic Belt, China. Land 2024, 13, 1002. [Google Scholar] [CrossRef]
  40. Chen, Q.; Chen, W.X.; Wu, D.; Zheng, L.; Li, J.F. Spatiotemporal evolution and influencing factors of tourism development efficiency in the Yangtze River Economic Belt, China. J. Clean. Prod. 2022, 379, 134722. [Google Scholar] [CrossRef]
  41. Waligo, V.M.; Clarke, J.; Hawkins, R. Implementing sustainable tourism: A multi-stakeholder involvement management framework. Tour. Manag. 2013, 36, 342–353. [Google Scholar] [CrossRef]
  42. Hardy, A.; Pearson, L.J. Examining stakeholder group specificity: An innovative sustainable tourism approach. J. Destin. Mark. Manag. 2018, 8, 247–258. [Google Scholar] [CrossRef]
  43. Xuemei, L.; Wang, F.; Huili, C.; Jingwen, T. Development of an Indicator System for Evaluating Risks in Trekking Tourism. Leis. Sci. 2024, 1–20. [Google Scholar] [CrossRef]
  44. Tang, H.Y.; Li, D.D. Spatial Distribution Characteristics of Fringe Villages of Archipelagic City: A Case Study of Zhoushan. J. Coast. Res. 2020, 103, 469–473. [Google Scholar] [CrossRef]
  45. Sun, C.; Jiang, X.M.; Xie, L.; Zhang, L.F.; He, Z.H. Study on the Spatiotemporal Differentiation of Traditional Villages and the Factors Influencing Tourism Responsiveness: A Case of Three Provinces and One Municipality in the Yangtze River Delta Region of China. Pol. J. Environ. Stud. 2025, 34, 1771–1786. [Google Scholar] [CrossRef]
  46. Feng, Y.X.; Lv, X.Y.; Tian, Y.X.; Li, Z.; Xue, J.Y.; Chen, Y.L. A study on the spatial differences between the tourism network attention and tourism flow in Shanghai, China. Heliyon 2024, 10, e31990. [Google Scholar] [CrossRef]
  47. Wang, M.D.; Liu, J.M.; Zhang, S.Y.; Zhu, H.; Zhang, X. Spatial pattern and micro-location rules of tourism businesses in historic towns: A case study of Pingyao, China. J. Destin. Mark. Manag. 2022, 25, 100721. [Google Scholar] [CrossRef]
  48. Ji, J.Y.; Wang, D.F. Regional differences, dynamic evolution, and driving factors of tourism development in Chinese coastal cities. Ocean Coast. Manag. 2022, 226, 106262. [Google Scholar] [CrossRef]
  49. Tang, X.Y. The historical evolution of China’s tourism development policies (1949-2013)-A quantitative research approach. Tour. Manag. 2017, 58, 259–269. [Google Scholar] [CrossRef]
  50. Li, Y.Y.; Feng, X.; Gao, Y.; Zhao, Z.B. Perceived tourism implicit conflict among community residents and its spatial variation. Humanit. Soc. Sci. Commun. 2024, 11, 1291. [Google Scholar] [CrossRef]
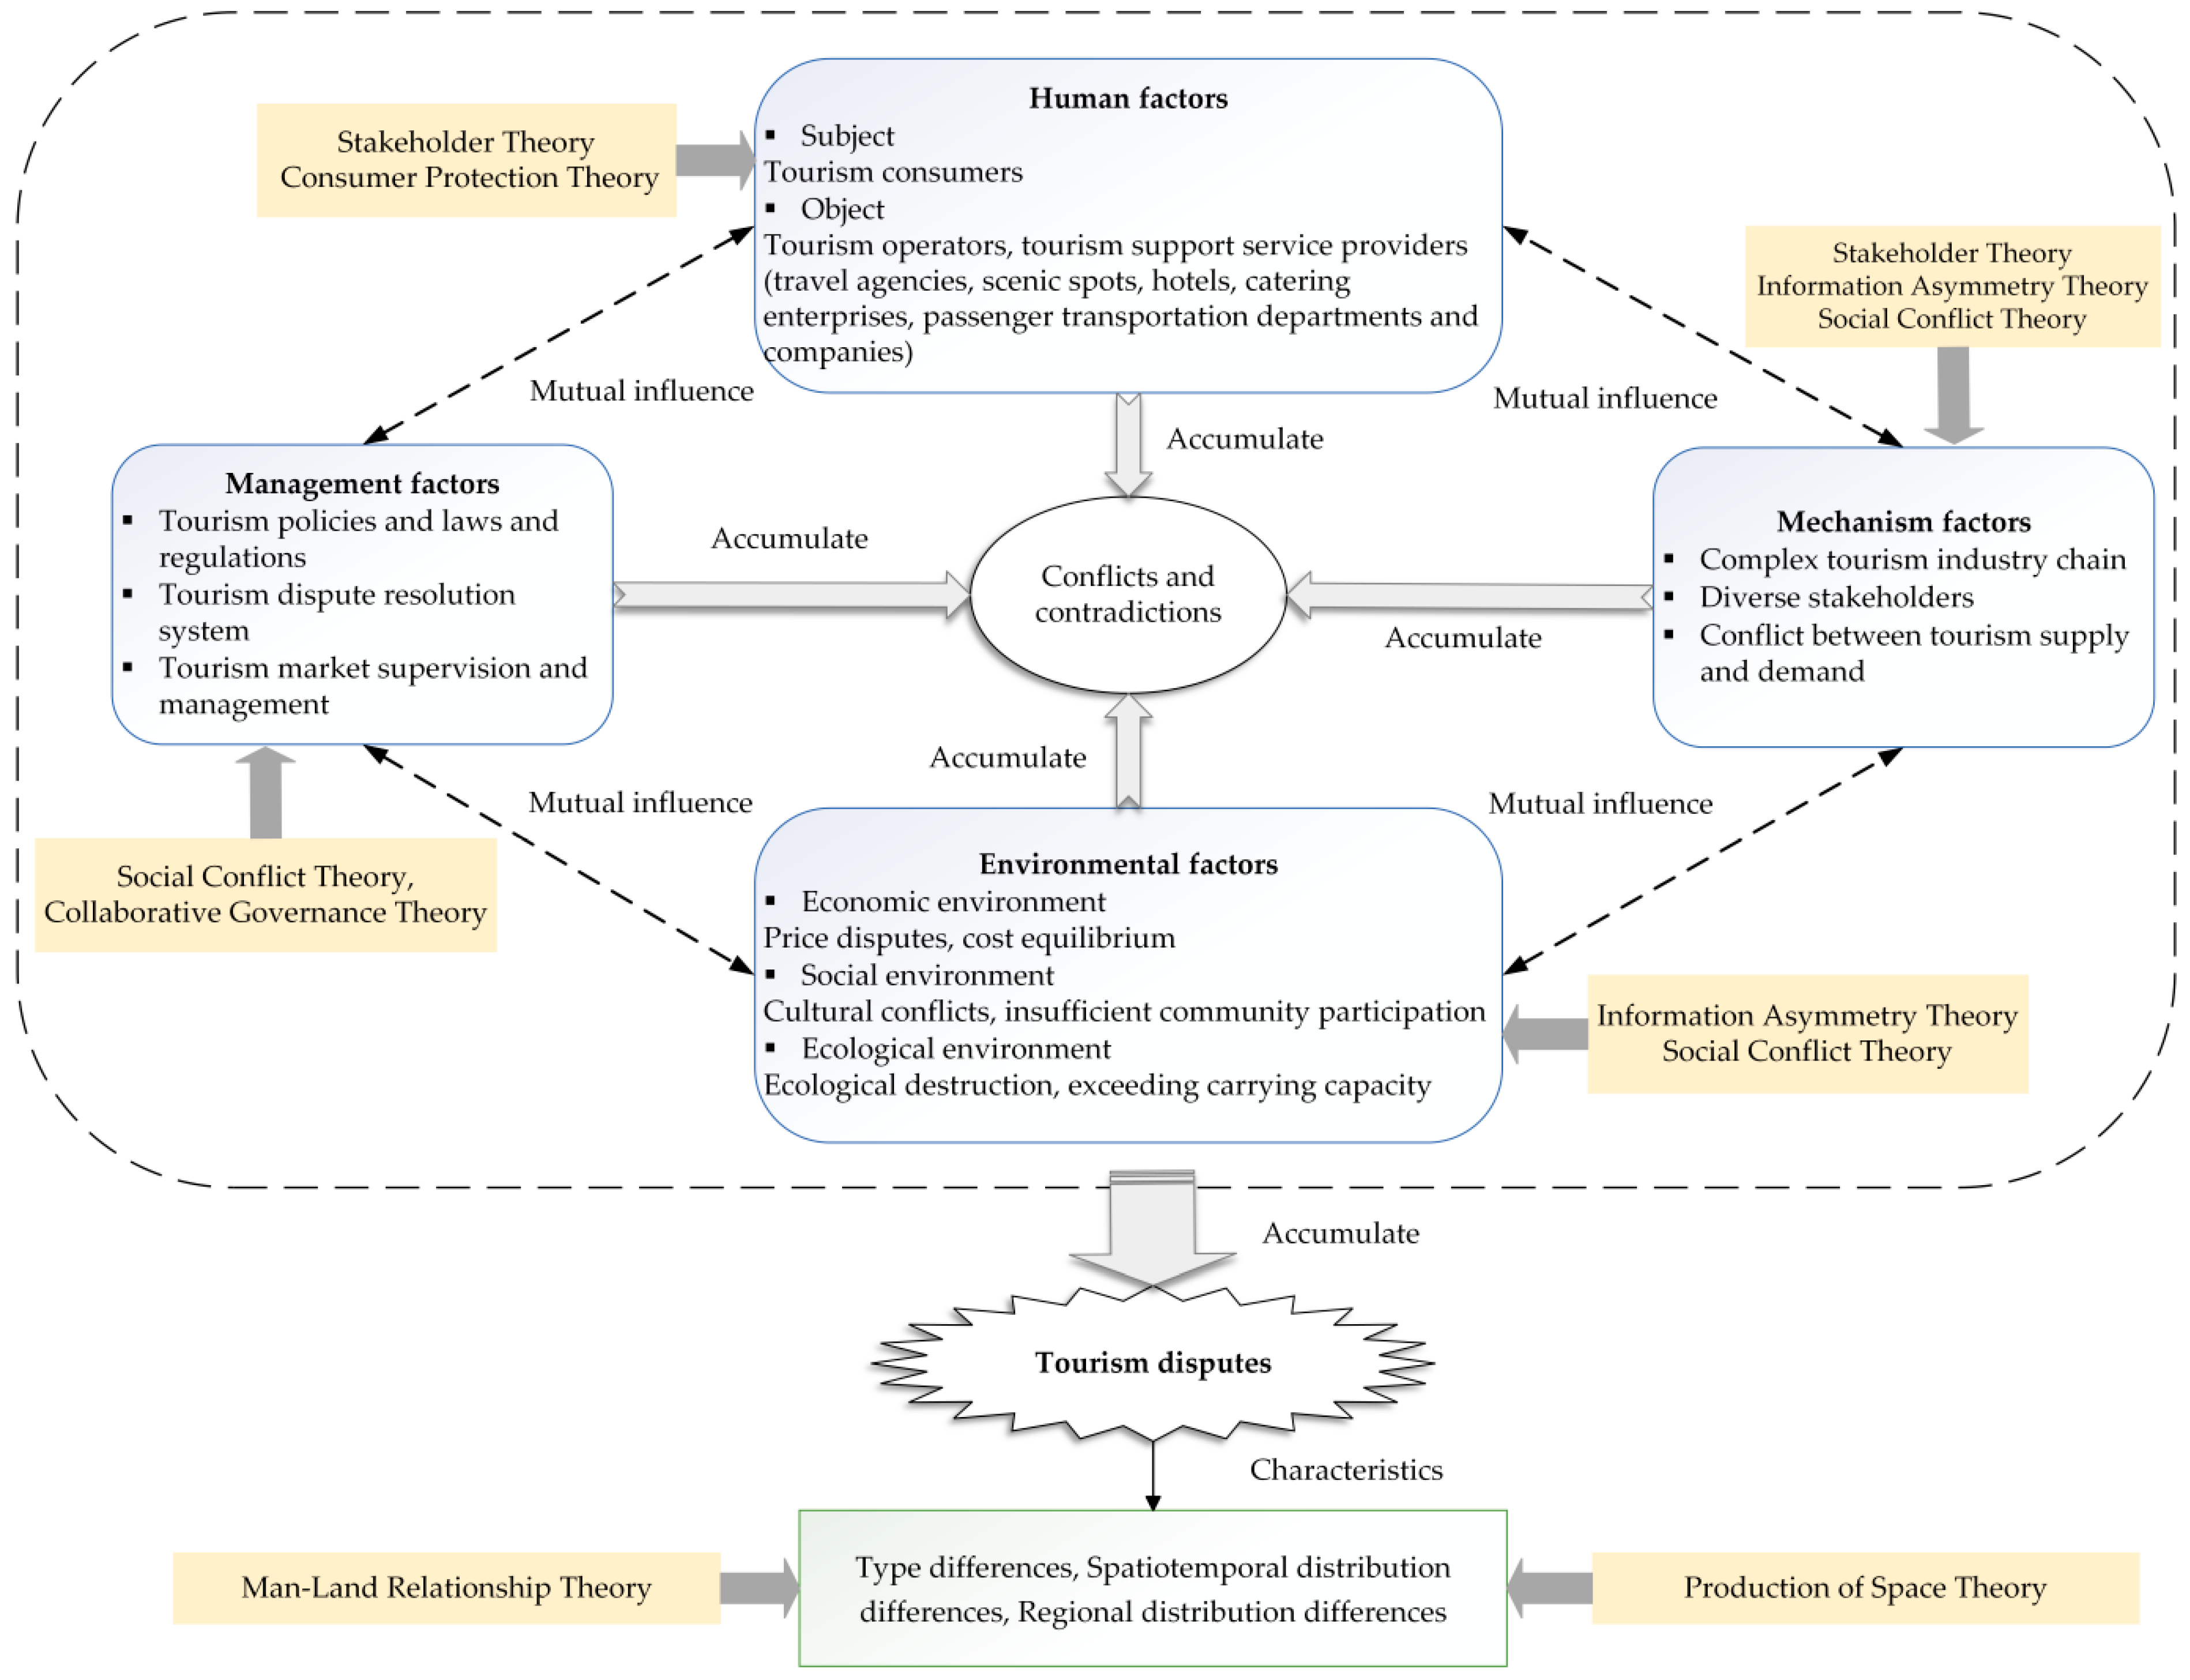
Figure 1. Theoretical framework of tourism disputes.
Systems 13 00473 g001
Figure 2. Research ideas and logic.
Systems 13 00473 g002
Figure 3. Number and proportion of tourism disputes.
Systems 13 00473 g003
Figure 4. Number and percentage of upstream, midstream, and downstream tourism disputes.
Systems 13 00473 g004
Figure 5. Spatial pattern of tourism disputes. (a) All tourism disputes. (b) Travel agency disputes. (c) Scenic spot disputes. (d) Hotel disputes. (e) Catering disputes. (f) Passenger transport disputes.
Systems 13 00473 g005aSystems 13 00473 g005b
Figure 6. The gravity center and the direction of standard deviational ellipse of tourism disputes.
Systems 13 00473 g006
Figure 7. Dagum Gini coefficient for overall differences in tourism disputes.
Systems 13 00473 g007
Figure 8. Intra-regional differences and trends. (a) All tourism disputes. (b) Travel agency disputes. (c) Scenic spot disputes. (d) Hotel disputes. (e) Catering disputes. (f) Passenger transport disputes.
Systems 13 00473 g008
Figure 9. Inter-regional differences and trends. (a) All tourism disputes. (b) Travel agency disputes. (c) Scenic spot disputes. (d) Hotel disputes. (e) Catering disputes. (f) Passenger transport disputes.
Systems 13 00473 g009
Table 1. Spatial concentration index, G.
YearAll Travel DisputesTravel Agency DisputesScenic Spots DisputesHotel DisputesCatering DisputesPassenger Transport Disputes
201343.8558.5941.5934.0936.7648.21
201443.9648.6441.0131.4542.5656.14
201544.4449.6144.1635.3644.9548.16
201644.3953.6339.2538.3945.5745.10
201744.6148.3541.6940.0546.6246.33
201844.5250.7242.6639.8248.2141.20
201944.5146.1242.1041.9552.1940.21
202044.3246.9643.0743.0353.4135.15
202143.7342.3435.0950.3557.9332.96
202242.5137.1038.6451.0563.4522.31
202342.9841.9527.4958.0055.9131.52
202442.8232.6563.0750.2441.4926.66
Table 2. Global Moran Index for tourism disputes.
Type of Tourism DisputeMoran Index (I)Expected Value E (I)Standard Deviation sd (I)Z Valuep Value
All Travel Disputes0.415−0.10.1872.6990.003
Travel Agency Disputes0.362−0.10.1872.4230.008
Scenic Spots Disputes0.398−0.10.1822.6090.005
Hotel Disputes0.410−0.10.1652.6710.004
Catering Disputes0.541−0.10.1883.3610.000
Passenger Transport Disputes0.527−0.10.1923.2850.001
Table 3. LISA clustering of tourism disputes.
Type of Tourism DisputeHigh–High ClusteringLow–High ClusteringLow–Low ClusteringHigh–Low Clustering
All Travel DisputesChongqing, Sichuan, Guizhou, YunnanHunanJiangxi, Shanghai, Jiangsu, Zhejiang, AnhuiHubei
Travel Agency DisputesChongqing, Sichuan, GuizhouYunnan, Hubei, HunanJiangxi, Jiangsu, Zhejiang, AnhuiShanghai
Scenic Spots Disputes/Chongqing, Yunnan, AnhuiJiangxi, Hunan, Shanghai, ZhejiangSichuan, Guizhou, Hubei, Jiangsu
Hotel DisputesSichuan, Guizhou, Yunnan, HunanChongqingJiangxi, Hubei, Shanghai, Jiangsu, Zhejiang, Anhui/
Catering DisputesSichuan, Guizhou, YunnanChongqingJiangxi, Hubei, Hunan, Shanghai, Jiangsu, Zhejiang, Anhui/
Passenger Transport DisputesSichuan, Guizhou, HunanChongqing, Yunnan, JiangxiShanghai, Jiangsu, Zhejiang, AnhuiHubei
Table 4. Robustness test of spatial correlation in tourism disputes.
Testing MethodType of Tourism DisputeMoran Index (I)Expected Value E (I)Standard Deviation sd (I)Z Valuep Value
Adjustment period for researchAll Travel Disputes0.438−0.10.1762.820 0.002 ***
Travel Agency Disputes0.273−0.10.1651.9540.025 ***
Scenic Spots Disputes0.301−0.10.1322.1020.018 ***
Hotel Disputes0.441−0.10.1822.8320.002 ***
Catering Disputes0.316−0.10.1942.1810.015 ***
Passenger Transport Disputes0.339−0.10.1842.3010.011 ***
Replace the weight matrixAll Travel Disputes0.475−0.10.2023.010 0.001 ***
Travel Agency Disputes0.354−0.10.1982.3770.009 ***
Scenic Spots Disputes0.261−0.10.1341.890 0.029 ***
Hotel Disputes0.300 −0.10.1562.0940.018 ***
Catering Disputes0.276−0.10.1761.9680.025 ***
Passenger Transport Disputes0.550 −0.10.1783.4040.000 ***
Note: *** indicates that the p value is <0.05, and the data has passed the significance test.
Disclaimer/Publisher’s Note: The statements, opinions and data contained in all publications are solely those of the individual author(s) and contributor(s) and not of MDPI and/or the editor(s). MDPI and/or the editor(s) disclaim responsibility for any injury to people or property resulting from any ideas, methods, instructions or products referred to in the content.