Article

Hierarchical Control Based on Ramp Metering and Variable Speed Limit for Port Motorway

1
Faculty of Maritime and Transportation, Ningbo University, Ningbo 315832, China
2
Collaborative Innovation Center of Modern Urban Traffic Technologies, Southeast University, Nanjing 211189, China
3
National Traffic Management Engineering & Technology Research Centre Ningbo University Sub-Centre, Ningbo 315832, China
4
Institute of Intelligent Transportation Systems, Zhejiang University, Hangzhou 310058, China
5
Department of Logistics and Maritime Studies, The Hong Kong Polytechnic University, Hongkong 999077, China
*
Author to whom correspondence should be addressed.
Systems 2025, 13(6), 446; https://doi.org/10.3390/systems13060446
Submission received: 11 May 2025 / Revised: 2 June 2025 / Accepted: 5 June 2025 / Published: 6 June 2025

Abstract

Congestion on port motorways often leads to reduced capacity and traffic efficiency, while the growing prevalence of connected vehicles (CVs) offers new opportunities for improving traffic control. This paper proposes a hierarchical control method integrating ramp metering (RM) and variable speed limits (VSLs) explicitly designed for port motorway environments dominated by CVs. The method uses real-time CV data to reduce congestion through a hierarchical control framework in which the upper-level optimization determines system-wide parameters, and the lower-level execution translates them into local control commands. A microscopic simulation using SUMO in the Guoju area of the Chuanshan Port Motorway demonstrated that the proposed method increases traffic capacity by approximately 16% compared to the no-control scenario and improves traffic efficiency by 4.8% and 4.5% compared to PI-ALINEA and MTFC-FB, respectively. Further experiments in varying CV penetration rates (MPRs) from 60% to 100% revealed that while lower MPRs result in higher traffic fluctuations, the method remains effective and robust, particularly when MPRs exceed 80%. This highlights its ability to mitigate congestion and enhance the utilization of the existing infrastructure.

1. Introduction

Port motorways in major ports often experience substantial spatiotemporal variability in traffic flow, especially during vessel arrivals and departures. This variability frequently leads to localized congestion [1] and capacity degradation [2] at critical segments, such as major junctions, posing serious challenges to terminal logistics and freight mobility. Traffic on these motorways is primarily composed of container trucks, which have limited maneuverability [3] and are required to maintain continuous communication with the port traffic management center; this results in a high-density connected vehicle (CV) network, enabling the real-time monitoring and sharing of traffic conditions [4]. Such a network provides a strong foundation for implementing adaptive traffic control strategies such as ramp metering (RM) and variable speed limits (VSLs). These strategies can be dynamically optimized in response to evolving traffic conditions, offering the potential to reduce bottlenecks, enhance flow stability, and optimize the use of existing road capacity.
Ramp metering (RM) is a widely used approach to control congestion by regulating vehicle entry onto motorways. Among the various RM strategies, feedback-based RM is the most common, with the ALINEA algorithm [5] and its extensions [6,7,8,9] being prominent examples. These methods work by adjusting the metering rate to maintain a target occupancy level on the mainline and have demonstrated strong performance in numerous real-world applications.
In contrast, feedforward RM strategies, such as demand–capacity (DC) control and occupancy (OCC) control, operate based on predefined traffic conditions without real-time adjustments [10]. While these methods provide a quick response, they lack adaptability, making them less effective in managing fluctuating traffic patterns. In contrast, feedback-based RM offers greater robustness and stability, though it typically reacts more slowly to sudden changes. To overcome the response delay of feedback methods, several hybrid and enhanced control strategies have been proposed. These include switching between downstream feedback controllers and upstream feedforward controllers based on predefined rules [11], incorporating feedforward elements into ALINEA to anticipate bottleneck density changes [12], and developing both centralized and decentralized event-triggered control schemes [13]. Other improvements involve adaptive control schemes that adjust metering rates according to the evolving traffic state [14,15].
Among these improvements, model predictive control (MPC) has emerged as a particularly promising approach [16,17]. MPC is a feedback control strategy that utilizes traffic models and predicted states to determine optimal control actions. Its framework and various adaptations have been validated across different traffic flow models [18,19,20]. However, MPC faces several challenges, including high computational demands [21], nonlinear behavior, and sensitivity to disturbances, which can affect system stability and performance. In response to these challenges, recent studies have increasingly focused on hierarchical control architectures [22,23,24,25,26,27]. These frameworks aim to reduce computational complexity while enhancing the system adaptability to changing traffic conditions and external disruptions, ultimately improving overall system efficiency and reliability.
Variable speed limit (VSL) control is a dynamic traffic management strategy that adjusts speed limits in real time to improve road safety [28,29] and optimize traffic flow. VSLs are typically applied in two main contexts. When safety is the primary concern, the VSL aims to reduce speed variability among vehicles, thereby lowering the risk of collisions, particularly rear-end and lane-change accidents. In addition to safety benefits, the VSL is used to enhance traffic efficiency by preventing capacity drops at bottlenecks and smoothing traffic flow. A range of control strategies has been developed for this purpose. These include integration with mainstream traffic flow control (MTFC) [30,31]; application of kinematic wave theory to model and predict traffic behavior under varying speed limits [32]; use of proportional–integral (PI) feedback regulators to adjust speed limits based on real-time traffic data; implementation of feedback control based on scalar conservation laws to manage traffic density and flow; deployment of rule-based controllers that adjust speed limits in response to traffic density near bottlenecks; and design of VSL systems using traffic flow ordinary differential equation models and two-phase fundamental diagrams to anticipate and mitigate congestion. The effective deployment of these strategies requires optimal placement of VSL zones to maximize their impact [33]. Additionally, robust system design is essential to ensure continued performance, particularly in the case of sensor malfunction or failures [34].
The integration of RM and VSLs has been extensively explored, leading to the development of various strategies for effective coordination. To address the computational challenges of complex optimization methods, heuristic algorithms have been proposed. One example activates VSLs when on-ramp queues exceed storage capacity, utilizing PI-ALINEA for RM and a cascaded feedback controller for VSLs [35]. These algorithms are computationally efficient and easy to implement but may not deliver optimal performance across diverse traffic conditions. To enhance system responsiveness and adaptability, alternative control methods have been explored. These include feedback control strategies [36,37] and logic-based traffic flow control methods [38,39] designed to improve the stability and performance of coordinated ATM strategies. Scenario-based receding horizon parametric control (RHPC) has been introduced to reduce the computational burden of robust controllers [40]. H-infinity (H∞) robust control methods have been applied to RM and VSLs to stabilize congested motorway flows [41]. Further innovations include the use of MPC frameworks combining ALINEA for RM and the SPECIALIST method for VSLs [42].
On the other hand, the emergence of CV technology has opened new possibilities for optimizing VSL systems. By enabling more accurate and timely data collection, CVs support real-time speed limit adjustments, significantly improving system effectiveness [43]. Moreover, CV technology has facilitated the development of advanced control strategies, such as H∞ state feedback controllers for coordinated RM and VSL control, further enhancing system adaptability and performance [44].
Hierarchical control frameworks have proven effective in managing complex, dynamic systems by structuring decision making across multiple temporal and spatial scales. These methods have been applied in various domains to enhance adaptability and efficiency, including unknown dynamic system tracking [45], autonomous navigation via deep reinforcement learning [46], trajectory tracking for aerial manipulators [47], and power distribution optimization in hybrid energy storage for ultrafast EV charging [48]. Such studies underscore the flexibility and strength of hierarchical control approaches.
Despite these advantages, few studies have explored integrated control strategies tailored to the specific operational dynamics of container truck traffic within an environment with a high prevalence of CVs. To bridge this research gap, this paper proposes a hierarchical control method integrating RM and VSLs explicitly designed for port motorway environments dominated by CVs. This method utilizes real-time traffic data collected from CVs to optimize traffic flow dynamically and mitigate congestion through a decision-making model at the optimization layer and integrated control mechanisms at the execution layer.
To evaluate the effectiveness and robustness of the proposed hierarchical control method, microscopic traffic simulation was conducted using the SUMO (Simulation of Urban Mobility) platform [49], chosen for its capability to accurately model individual vehicle dynamics, particularly the specialized maneuvering behavior of container trucks, and effectively simulate detailed CV communication and control strategies. The simulation scenario was based on the Guoju section of Chuanshan Port Motorway in Ningbo, representing a realistic and logistically significant operational environment. The simulation results, supported by MATLAB-based analytical tools, demonstrate that the proposed method significantly improves traffic throughput, reduces delay times and optimizes existing infrastructure utilization compared to conventional traffic management strategies.
The main contributions of this study are as follows:
  • A hierarchical traffic control method is proposed, which integrates RM and VSLs, explicitly tailored for port motorways dominated by CVs. The method uses real-time CV data to dynamically optimize traffic flow through a two-layer control structure.
  • The proposed method is evaluated using a microscopic simulation platform, which accurately models the specialized maneuvering behavior of container trucks and simulates detailed CV communication and control strategies within a realistic and logistically important section of the Chuanshan Port Motorway in Ningbo.
  • The results highlight the potential of advanced coordinated control methods in significantly enhancing the efficiency and sustainability of freight transportation operations.
The article is organized as follows:
Section 1 presents the introduction, including the motivation, unique characteristics of port motorway traffic, reviews related to work on traffic control in connected vehicle environments, and the research gap addressed by this study. Section 2 defines the traffic flow modeling framework and vehicle behavior assumptions and details the hierarchical control methodology, including the upper-level optimization model and lower-level control mechanisms. Section 3 introduces the simulation scenario, outlines the implementation in the SUMO-MATLAB co-simulation environment, and presents the experimental results and performance evaluation. Section 4 concludes the paper, summarizes the key findings, and outlines future research directions.

2. Hierarchical Traffic Control Framework for Port Motorways

Hierarchical traffic control is employed in this study to address the complexity and spatial heterogeneity of port motorway traffic in a CV environment. Given the dynamic nature of port-related traffic, characterized by fluctuating demand patterns, localized congestion, and operational constraints unique to container lorries, an integrated control strategy must balance overall system efficiency with local responsiveness.
The hierarchical framework achieves this by dividing control into two distinct layers: an upper-level optimization layer that sets system-wide control parameters based on real-time traffic conditions, and a lower-level execution layer that applies these parameters at specific control points such as on-ramps and speed limit zones. This separation of responsibilities enhances scalability, reduces computational demands, and improves the system to adapt flexibly to evolving traffic conditions. The hierarchical structure is therefore well suited to the port motorway context, where strategic oversight and localized action must function simultaneously to relieve bottlenecks and improve overall traffic performance in a near full-CV setting.

2.1. Research Scenario

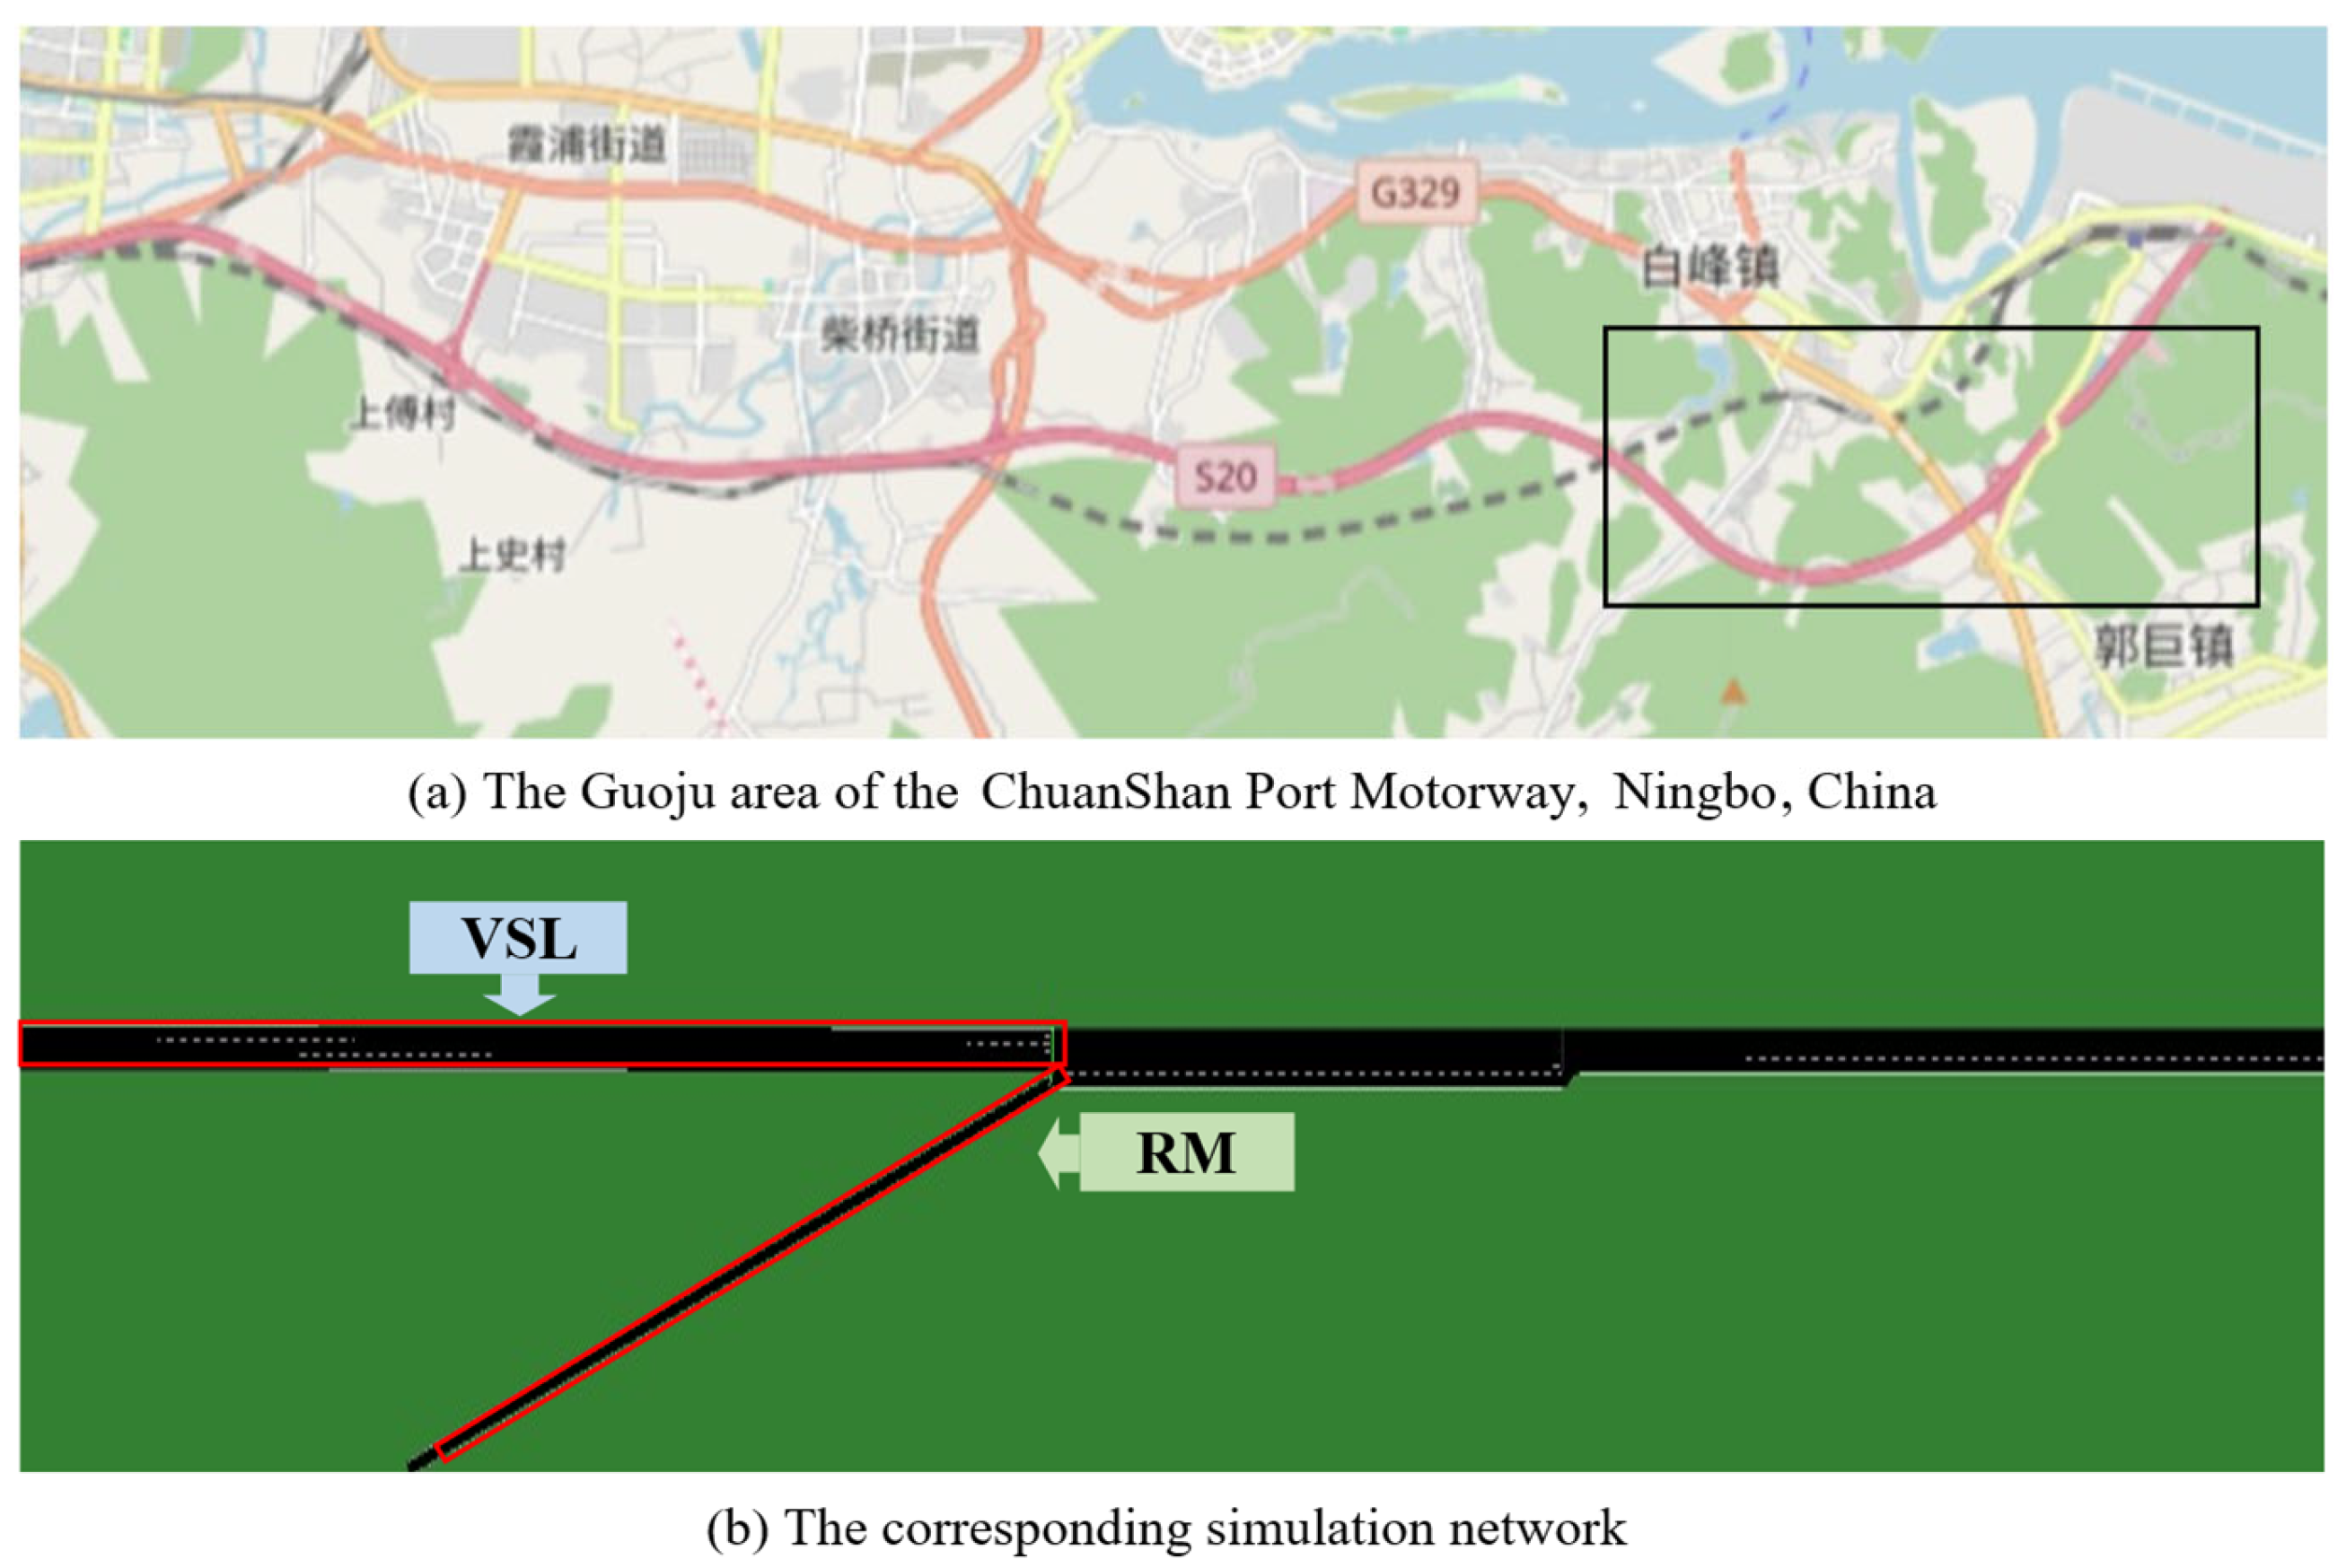
This study focuses on a single representative junction within the port motorway network (as shown in Figure 1) to allow a controlled and focused evaluation of the proposed hierarchical control strategy integrating RM and VSLs. The selected junction features high traffic volumes, recurrent congestion, and complex merging behavior, making it a critical bottleneck that reflects common operational challenges in port access corridors. Focusing on this isolated junction ensures that the effects of the control strategy can be assessed without interference from other network components, thereby improving the clarity and reliability of the experimental results. Furthermore, given that this research emphasizes methodological development and proof of concept within a CV environment, limiting the study scope to a single junction provides a practical and computationally efficient foundation. This approach enables a clear demonstration of the effectiveness of the hierarchical framework, laying the groundwork for future applications across broader and more complex networks.
To be specific, the space is divided into i = 1 , 2 , 3 segments of length L i (km), with the segment 1 serving as the VSL control area and the on-ramp as the RM area.
During the discrete time t = k T ,   k = 0 , 1 , 2 , , where T (s) represents the control period, the macroscopic variables of traffic flow after space–time discretization can be expressed as follows: ρ i ( k ) (veh/km) represents the traffic density in segment i at time step k ; v i ( k ) (km/h) is the average speed of all vehicles in segment i at time step k ; the traffic flow q i ( k ) (veh/h) is the number of vehicles leaving segment i at time step k . For each segment i at each time step k , the following equations are applied:
ρ i ( k + 1 ) = ρ i ( k ) + T L i [ q i n ( k + 1 ) + δ i r ( k + 1 ) q i ( k + 1 ) ] ,     i = 1
ρ i ( k + 1 ) = ρ i ( k ) + T L i [ q i 1 ( k + 1 ) + δ i r ( k + 1 ) q i ( k + 1 ) ] ,     i = 2 , 3
q i ( k + 1 ) = ρ i ( k ) v i ( k )
where δ i indicates whether there is on-ramp flow on the segment i ; if so, then δ i = 1 , otherwise, δ i = 0 . The flow q i n ( k ) (veh/h) represents the mainstream demand at time step k . The flow r ( k ) (veh/h) represents the merging flow at the on-ramp at time step k . Since the demand at time step k + 1 cannot be known in advance, it is assumed that q i n ( k + 1 ) = q i n ( k ) . While forecasting methods exist [50,51], their accuracy is limited in port environments due to uncertainties such as variable vessel berthing times [52] and stochastic terminal operations [3]. Additionally, more precise predictions increase computational complexity, which may reduce real-time responsiveness. Thus, using the current demand as an estimate balances practicality and control efficiency.
For the on-ramp, a simple queuing model is established, described by the following conservation equation:
w k + 1 = w k + T [ d ( k + 1 ) r ( k + 1 ) ]
where w ( k ) (veh) is the number of vehicles queuing at the on-ramp at time step k . The flow d ( k ) (veh/h) is the on-ramp demand at time step k . Similar to the mainstream demand, the on-ramp demand at time step k + 1 is also unavailable in advance and is assumed to be d ( k + 1 ) = d ( k ) .

2.2. Hierarchical Traffic Control Framework

2.2.1. The Upper-Level Layer

Based on Figure 1, the two inflows of the merging area are r and q 1 . When their sum exceeds the capacity q c a p (veh/h) of the downstream, congestion is likely to occur. To alleviate this congestion, r can be adjusted through RM, or q 1 can be regulated through VSL control. When RM and VSLs are applied in integration, it becomes necessary to determine the combination of r and q 1 . Different combinations may lead to significantly varying improvements in traffic efficiency and throughput. Therefore, given the traffic state information at time step k , an optimization problem can be formulated to identify the optimal flow combination of r * and q 1 * that maximizes both traffic throughput and traffic efficiency at time step k + 1 .
The objective function consists of two components. The first is to minimize the error between the density ρ i of each segment and its corresponding critical density ρ c r , i . The critical density is defined as the density at which traffic flow reaches its maximum capacity, and it can be derived from the fundamental diagram that characterizes the nonlinear relationship between traffic flow and density for each segment. When the density in the control area is below the critical density, the flow increases and reaches its capacity at the critical density. However, once the density exceeds this point, the flow becomes oversaturated and begins to decline, resulting in congestion. Therefore, minimizing the error contributes to maximizing traffic throughput.
The second component aims to minimize the total time spent (TTS), as lower time spent leads to higher overall traffic efficiency. TTS includes both the travel time (TTT) and the waiting time (TWT). TTT refers to the cumulative travel time of all mainstream vehicles from entering segment 1 to exiting segment 3. While minimizing TTT alone may lead to an unrealistic scenario where only a small number of vehicles enter the mainstream, the first component ensures that density remains close to the critical density. This condition allows the minimization of TTT without sacrificing traffic throughput, thereby improving efficiency. TWT refers to the cumulative waiting time of all on-ramp vehicles. Specifically, it is the duration (in seconds) during which the speed of the vehicle remains below 0.1 m/s after last exceeding this threshold. Essentially, the waiting time of a vehicle resets to 0 each time it resumes movement. Minimizing TWT is achieved by reducing the number of vehicles in the queue.
Based on the two components above, the objective function can be written as follows:
J = min i = 1 3 ρ i k + 1 ρ c r , i L i + i = 1 3 ρ i k + 1 L i + w k + 1
The constraints of the optimization problem consist of the following four components:
  • To ensure that the upstream arrival flow does not exceed its capacity q c a p m (veh/h), Equation (6) is considered.
    q 1 * ( k + 1 ) q c a p m
  • To ensure that the flow does not experience sudden changes, even under VSL control, Equation (7) is introduced. This constraint limits the deviation between the upstream arrival flow at time step k and that at the time step k + 1 within a controlled range, in order to prevent sudden fluctuations that may compromise traffic stability.
    q 1 k + 1 q 1 k Δ q max
    where Δ q m a x represents the flow adjustment bound, defining the maximum allowable variation in upstream arrival flow between two consecutive time steps.
  • To ensure that the merging flow does not exceed the actual demand on the on-ramp, Equation (8) limits the released flow to the sum of the demand and the number of vehicles queuing at the on-ramp.
    r * ( k + 1 ) d ( k + 1 ) + w ( k ) T
  • Since the on-ramp connects to segment 2, Equation (9) is considered to ensure that the merging flow remains within the residual capacity of segment 2, thereby preventing an unrealistic value.
    r * ( k + 1 ) r s o t   min { 1 , ρ max ρ 2 ( k ) ρ max ρ c r , 2 }
    where r s a t (veh/h) represents the saturation flow of the on-ramp. ρ m a x (veh/km) denotes the maximum density.
To ensure real-time responsiveness in the dynamic port motorway environment, this study adopts a single-step optimization approach. Compared with multi-step predictions, this method reduces computational complexity and avoids accumulated errors caused by uncertain factors such as variable vessel berthing times and stochastic terminal operations. The following optimization problem can be formulated:
J = min i = 1 3 | ρ i k + 1 ρ c r , i | L i + i = 1 3 ρ i k + 1 L i + w k + 1 s . t . q 1 * k + 1 q c o p m 0 q 1 k + 1 q 1 k Δ q max 0 r * k + 1 d k + 1 w k T 0 r * k + 1 r s a t min 1 , ρ max ρ 2 k ρ max ρ c r , 2 0
To solve the optimization problem efficiently, an appropriate modeling and solution tool is essential. In this study, the optimization problem is formulated using YALMIP [53], a modeling toolbox in MATLAB R2022b that provides a unified interface for defining and solving optimization problems. The solution is obtained using the fmincon solver, which is suitable for nonlinear constrained optimization. YALMIP allows concise and readable representation of objective functions and constraints, while fmincon provides efficient numerical solutions under the specified conditions.

2.2.2. The Lower-Level Layer

The lower-level execution layer is responsible for converting r * ( k + 1 ) and q 1 * ( k + 1 ) obtained from the upper-level optimization layer into actionable commands for the ramp vehicles and those in the VSL control area. This translation is essential for ensuring that the system operates effectively, allowing the strategic decisions made at the upper level to be applied to local traffic conditions.
For the implementation of RM, the flow r * ( k + 1 )  can be converted into the green-signal duration g ( k + 1 ) [ g min , 1 ]  (s) ∈ for allowing ramp vehicles to merge at time step k + 1 , as shown Equation (11). Vehicles unable to merge will queue on the on-ramp.
g ( k + 1 ) = ( r * ( k + 1 ) / r s a t ) T
To prevent the on-ramp from being closed, g m i n > 0 is the minimum green-signal duration. If g ( k ) = 1 , it indicates that no RM at the on-ramp has been applied. In mixed traffic environments, the signal is both transmitted to CVs and displayed on the on-ramp signal light. CVs can interpret the signal directly and adjust their acceleration or deceleration accordingly, while regular vehicles (RVs) respond upon seeing the signal light and react passively based on its indication.
For the implementation of VSL control, the flow q l * ( k + 1 ) can be converted into a speed limit V s l ( k + 1 ) (km/h) that regulates vehicle movement within the VSL control area at time step k + 1 , as defined in Equation (12). Since speed limits are typically set as an integer multiple of 10, a discrete set of VSL rates b { b min , b min + 0.1 . , , 1 } is defined, corresponding to V s l { V m i n , V m i n + 10 , , V m a x } , where V m i n (km/h) and V m a x (km/h) represent the minimum and maximum speed limits of the motorway, respectively. To ensure the applied speed limit can effectively adapt to the evolving traffic conditions and reduce fluctuations between time steps, a feedback control mechanism is introduced. Specifically, the controller for b is designated as an integral (I) controller:
b ( k + 1 ) = b ( k ) + K R [ q 1 * ( k + 1 ) q 1 ( k ) ]
where K R (h/veh) is the integral gain. When VSL control is implemented on motorways, the change in V s l between consecutive time steps is restricted to the range [ Δ V m a x , Δ V m a x ] to ensure driving safety and traffic flow stability [13]. Therefore, when the change exceeds this range: if V s l ( k + 1 ) > V s l ( k ) , then set V s l ( k + 1 ) = V s l ( k ) + Δ V max ; if V s l ( k + 1 ) < V s l ( k ) , then set V s l ( k + 1 ) = V s l ( k ) Δ V max . The speed limit V s l ( k + 1 ) is transmitted directly to the CVs and simultaneously displayed on variable message signs (VMSs). The CVs fully comply with the speed limit and can quickly adjust their speeds, while the RVs respond after seeing the updated speed on the VMS.

3. Simulation Implementation and Experimental Evaluation

Microscopic simulation is used in this study to provide high-resolution modeling of individual vehicle behaviors and interactions, which is essential for evaluating traffic control strategies in the complex operational environment of port motorways. The prevalence of container lorries with constrained maneuverability requires a modeling framework capable of capturing vehicle-level dynamics with precision.
Moreover, the high penetration of CVs requires a simulation environment capable of realistically replicating continuous communication between vehicles and the control center, along with real-time implementation of VSLs and RM. Unlike macroscopic or mesoscopic models, microscopic simulation supports the integration of external optimization algorithms and enables detailed performance assessment under dynamic traffic conditions. For this reason, SUMO, combined with MATLAB, is employed to implement and validate the proposed hierarchical control framework under realistic and data-rich conditions reflective of CV-dominated port corridors.

3.1. Simulation Experiment Design

This research extracted the Guoju area of the Chuanshan Port Motorway in Ningbo City from the open-source website OpenStreetMap (www.openstreetmap.org accessed on 21 September 2024) as the simulation application scenario (Figure 2). The corresponding segments 1, 2, and 3 of the Guoju area are 500 m, 200 m, and 300 m in length, respectively, with each segment consisting of three lanes. V m i n and V m a x for these segments are 40 km/h and 100 km/h, respectively. The on-ramp is connected to segment 2, has a length of 300 m, and contains a single lane. The current traffic state information is collected using SUMO and transmitted to MATLAB via the traci4matlab interface. MATLAB utilizes the YALMIP toolbox to solve for the optimal flows r * and q 1 * , which are then converted into control variables g and V s l . and sent back to SUMO. SUMO implements the corresponding instructions for vehicles in the next control period.
Given that port motorways are increasingly characterized by centralized dispatch systems and mandatory vehicle-to-infrastructure communication protocols, the proportion of CVs is expected to continue rising. This trend reflects both current operational practices and anticipated future developments in port motorway traffic. Accordingly, this experiment adopts a 100% CV penetration scenario to evaluate the proposed hierarchical control strategy. A fully connected environment provides a realistic and forward-looking foundation for evaluating the performance limits of the strategy and enables a clear assessment of system behavior [54] under ideal communication and compliance conditions. Since CVs are characterized by full compliance with traffic signals and speed limits, low behavioral variability, and precise acceleration and deceleration responses, the parameters Speed-Factor, Sigma, and Speed-Dev are set to 1, 0, and 0, respectively, in this experiment to better reflect these characteristics.
Field observations indicate that container trucks account for approximately 60% of the traffic in this area, with half of these trucks carrying a twenty-foot equivalent unit (TEU) and the other half carrying a forty-foot equivalent unit (FEU). Thus, the vehicle composition for both mainstream and on-ramp demand is set to 40% cars, 30% TEU-carrying container trucks, and 30% FEU-carrying container trucks. The specific parameters for each vehicle type are shown in Table 1.
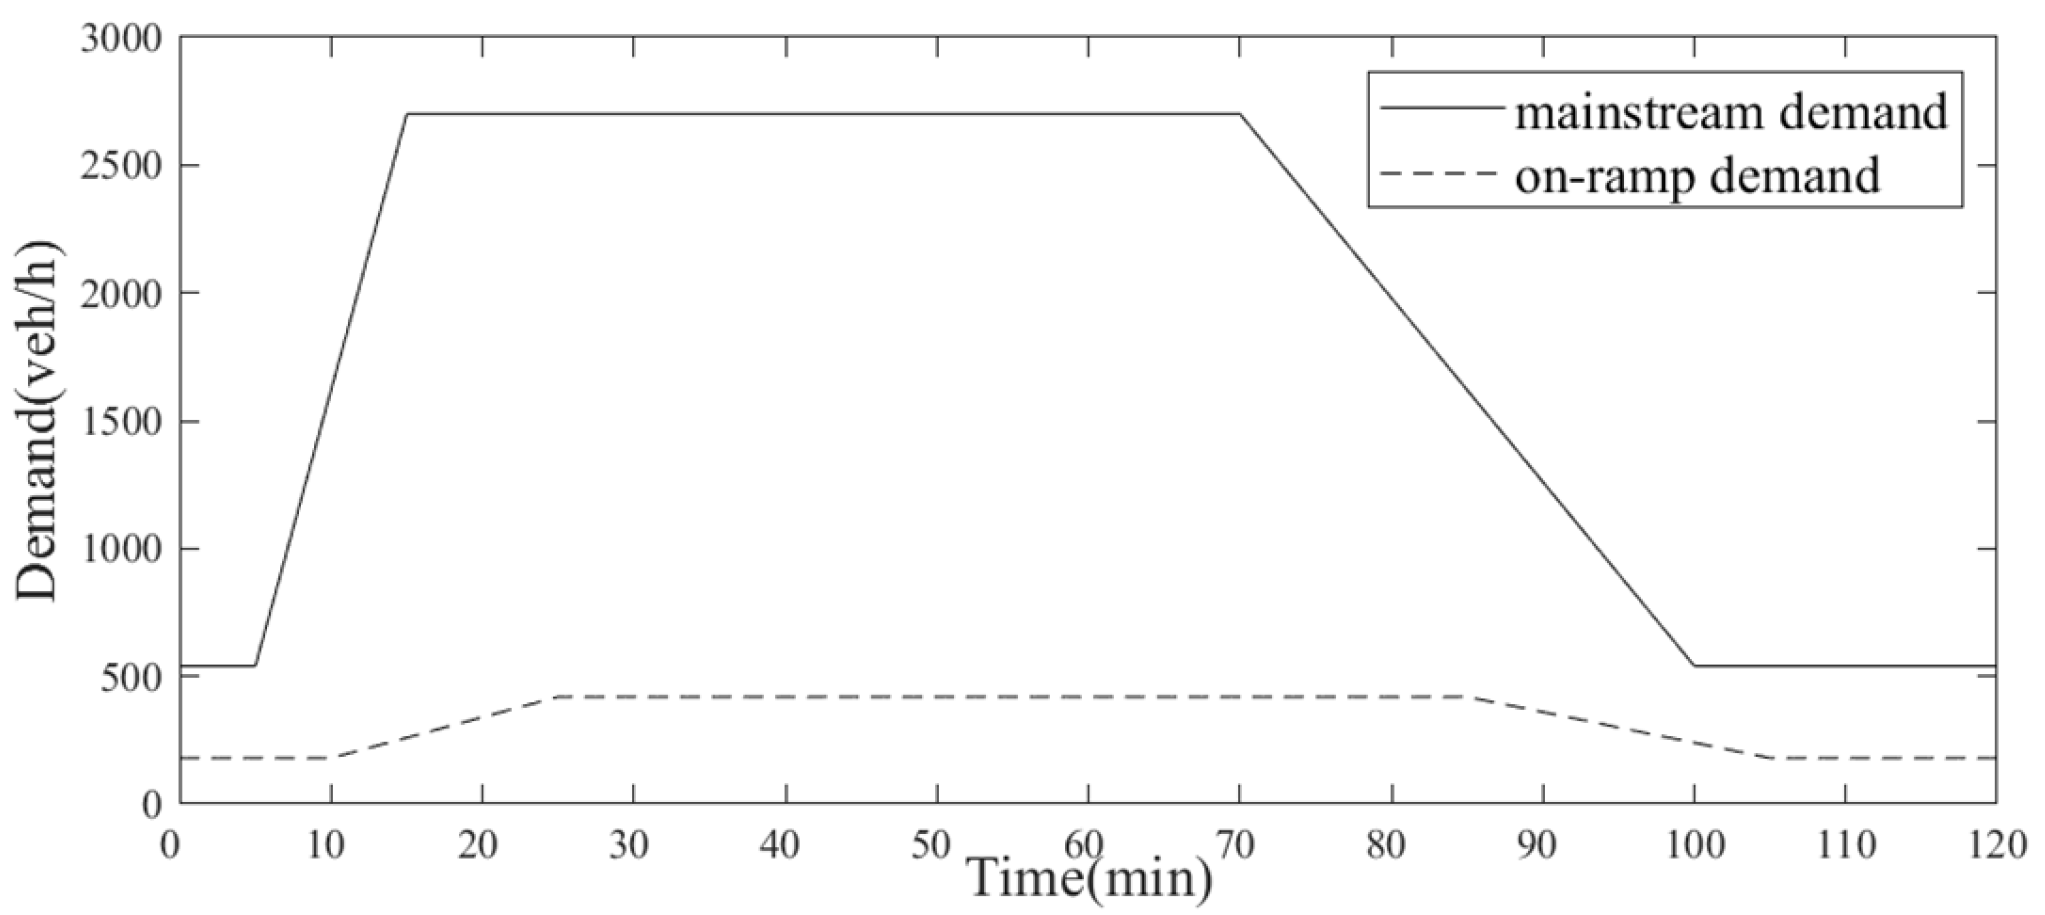
In this experiment, the downstream capacity q c a p is estimated to be approximately 3400 veh/h, as based on a motorway design capacity of 1750 pcu/h/ln, adjusted using vehicle equivalence factors (1 car = 1 pcu, 1 TEU truck = 2 pcu, 1 FEU truck = 3 pcu), and reflects the specific vehicle composition used in the simulation. The trapezoidal demand scenarios (shown in Figure 3) are developed to simulate different congestion patterns, following the demand variation method in [9] and the flow levels referenced in [38,55].
The control update interval is set to 30 s, with an optimization horizon of one step. At each interval, the controller predicts and applies optimal control action for the immediate next period. This setting allows a fast response to frequent traffic fluctuations, making it well suited to the dynamic nature of port motorways. Other parameter settings are based on references [56,57,58] and are summarized in Table 2.
The experiment includes four different scenarios: no-control, PI-ALINEA [9], MTFC-FB [31], and the proposed hierarchical control. Among these, the no-control scenario serves as a baseline for comparison; PI-ALINEA improves downstream capacity and mainstream traffic efficiency by regulating on-ramp flow, while MTFC-FB enhances capacity by delaying vehicle arrivals at the bottlenecks and reduces on-ramp delays to improve traffic flow efficiency. Both controllers share the same optimization objectives as the proposed method, maximizing traffic capacity and efficiency, ensuring a fair and relevant comparative evaluation. All the scenarios are tested under consistent simulation settings, and control performance in each scenario is evaluated using density, speed, flow, and total travel time.

3.2. Density, Speed, and Flow Analysis in Different Scenarios

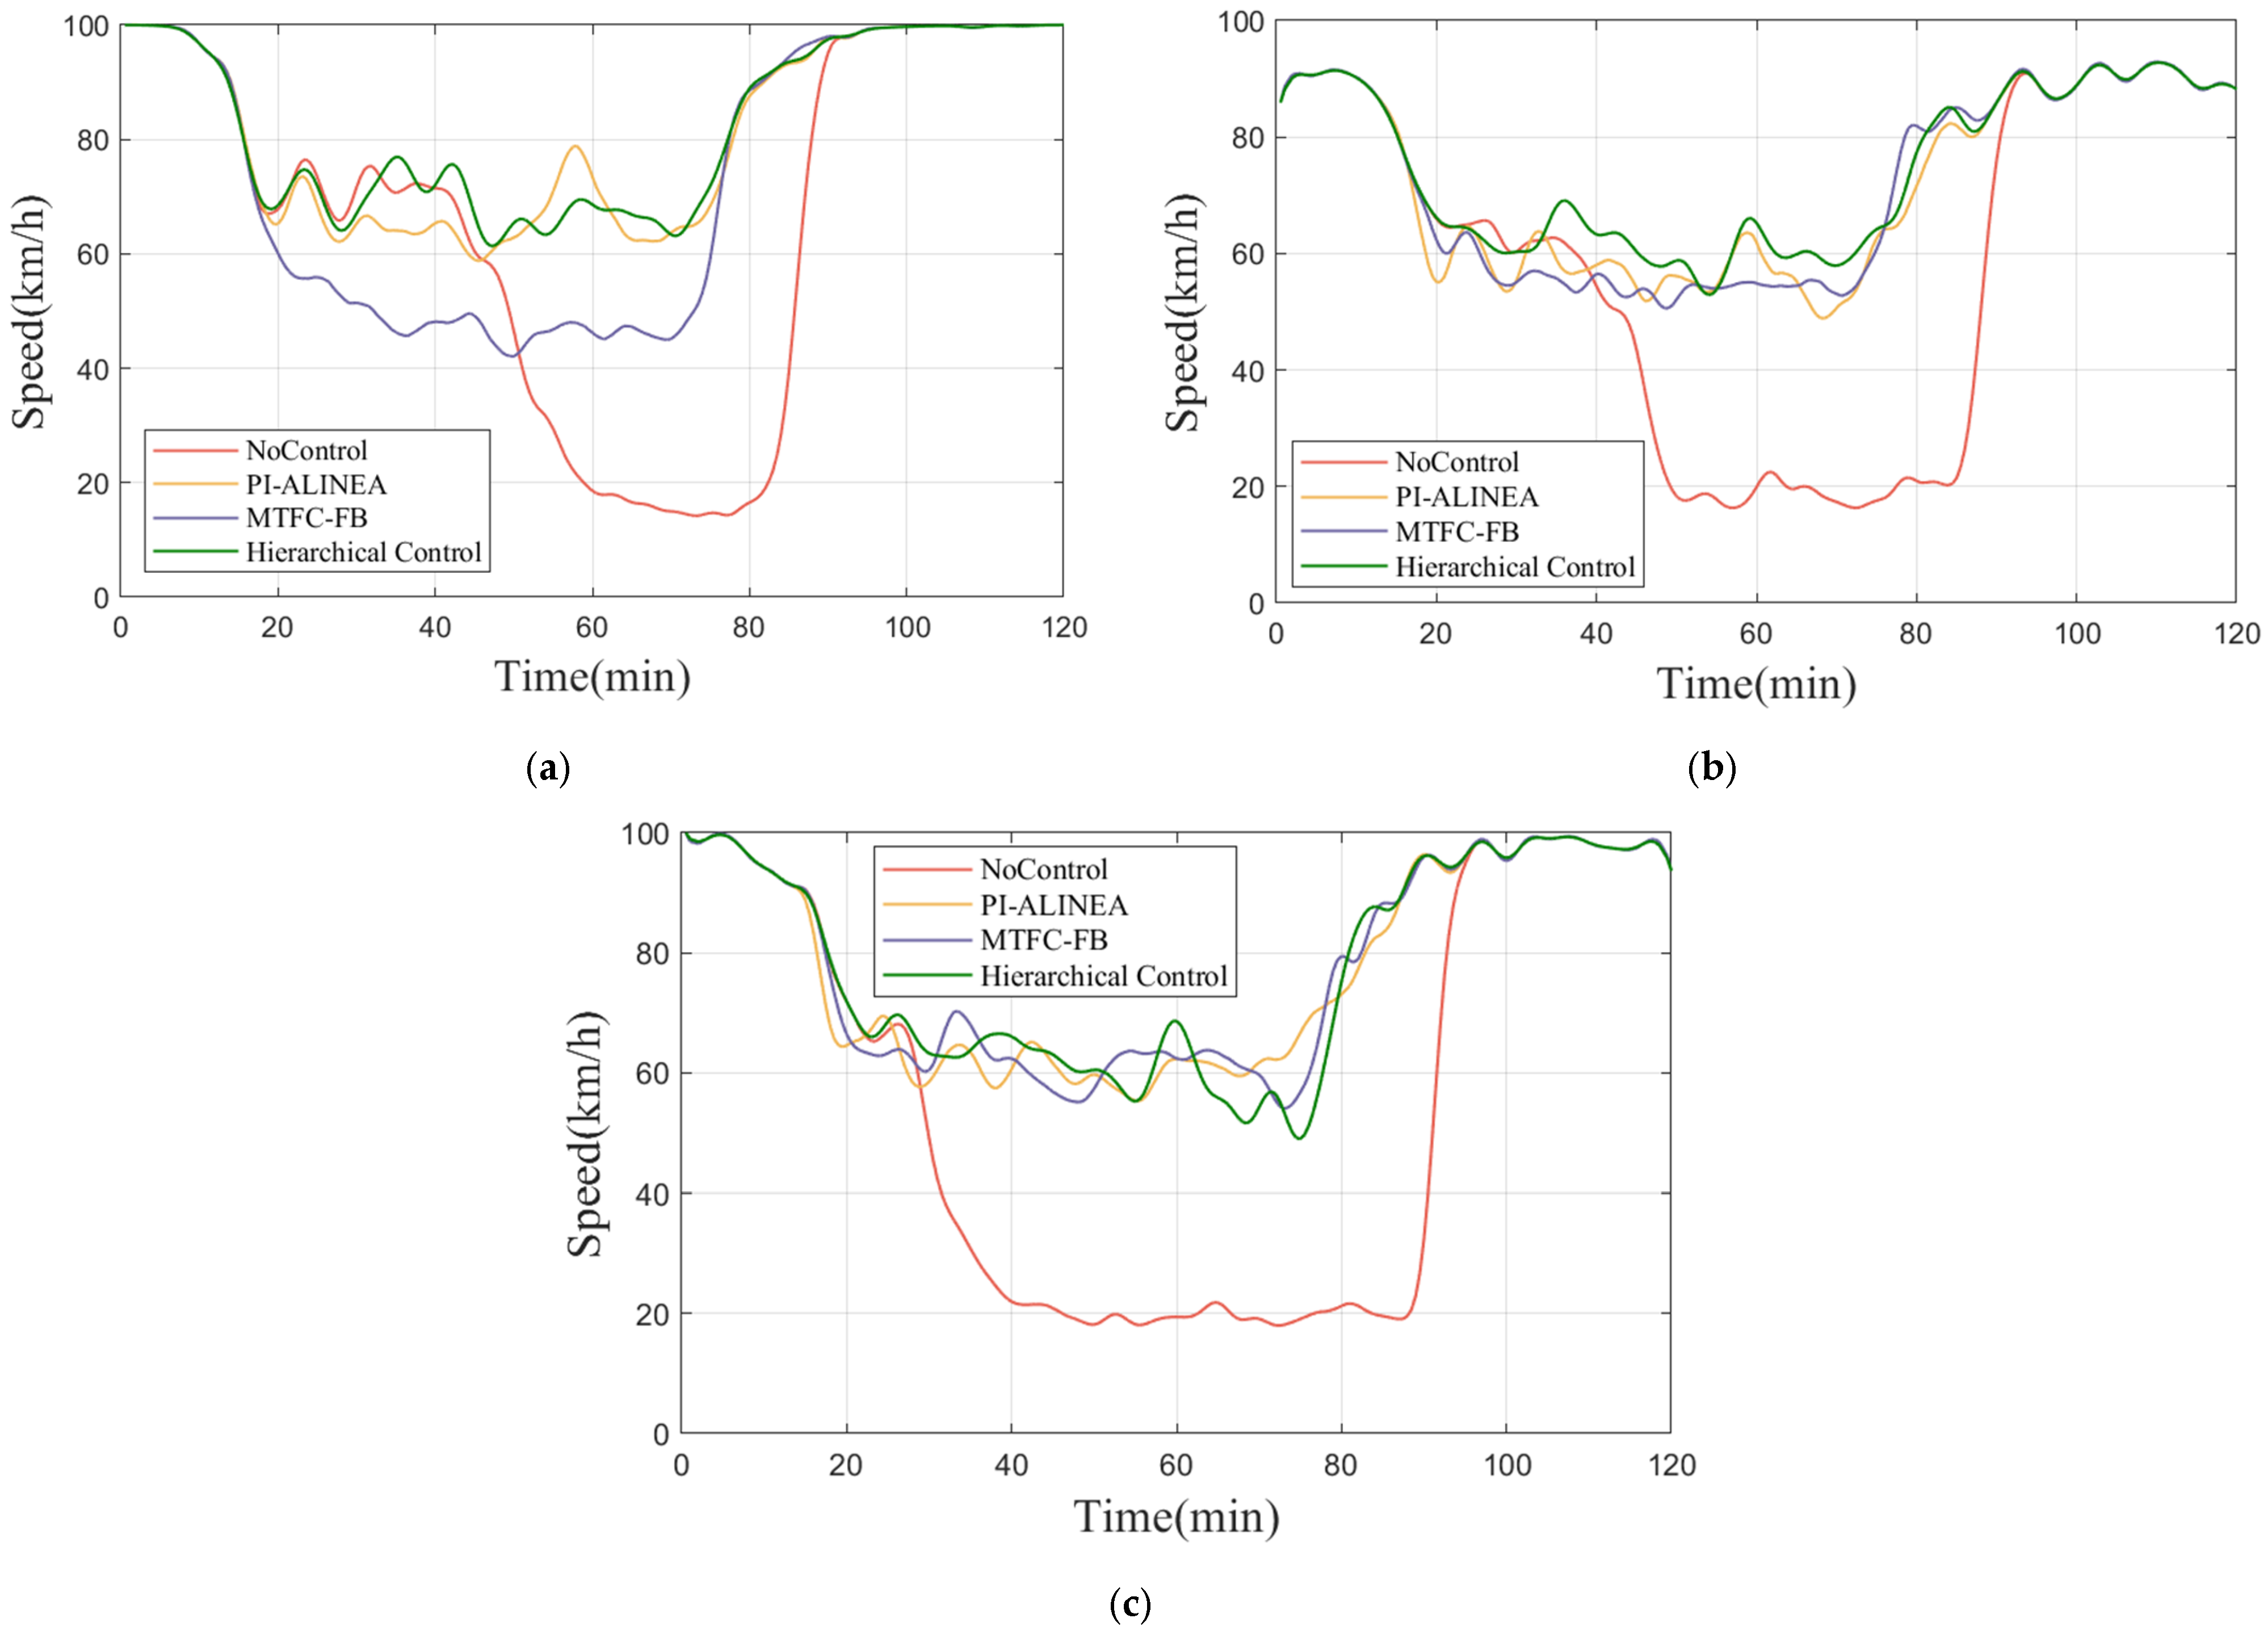
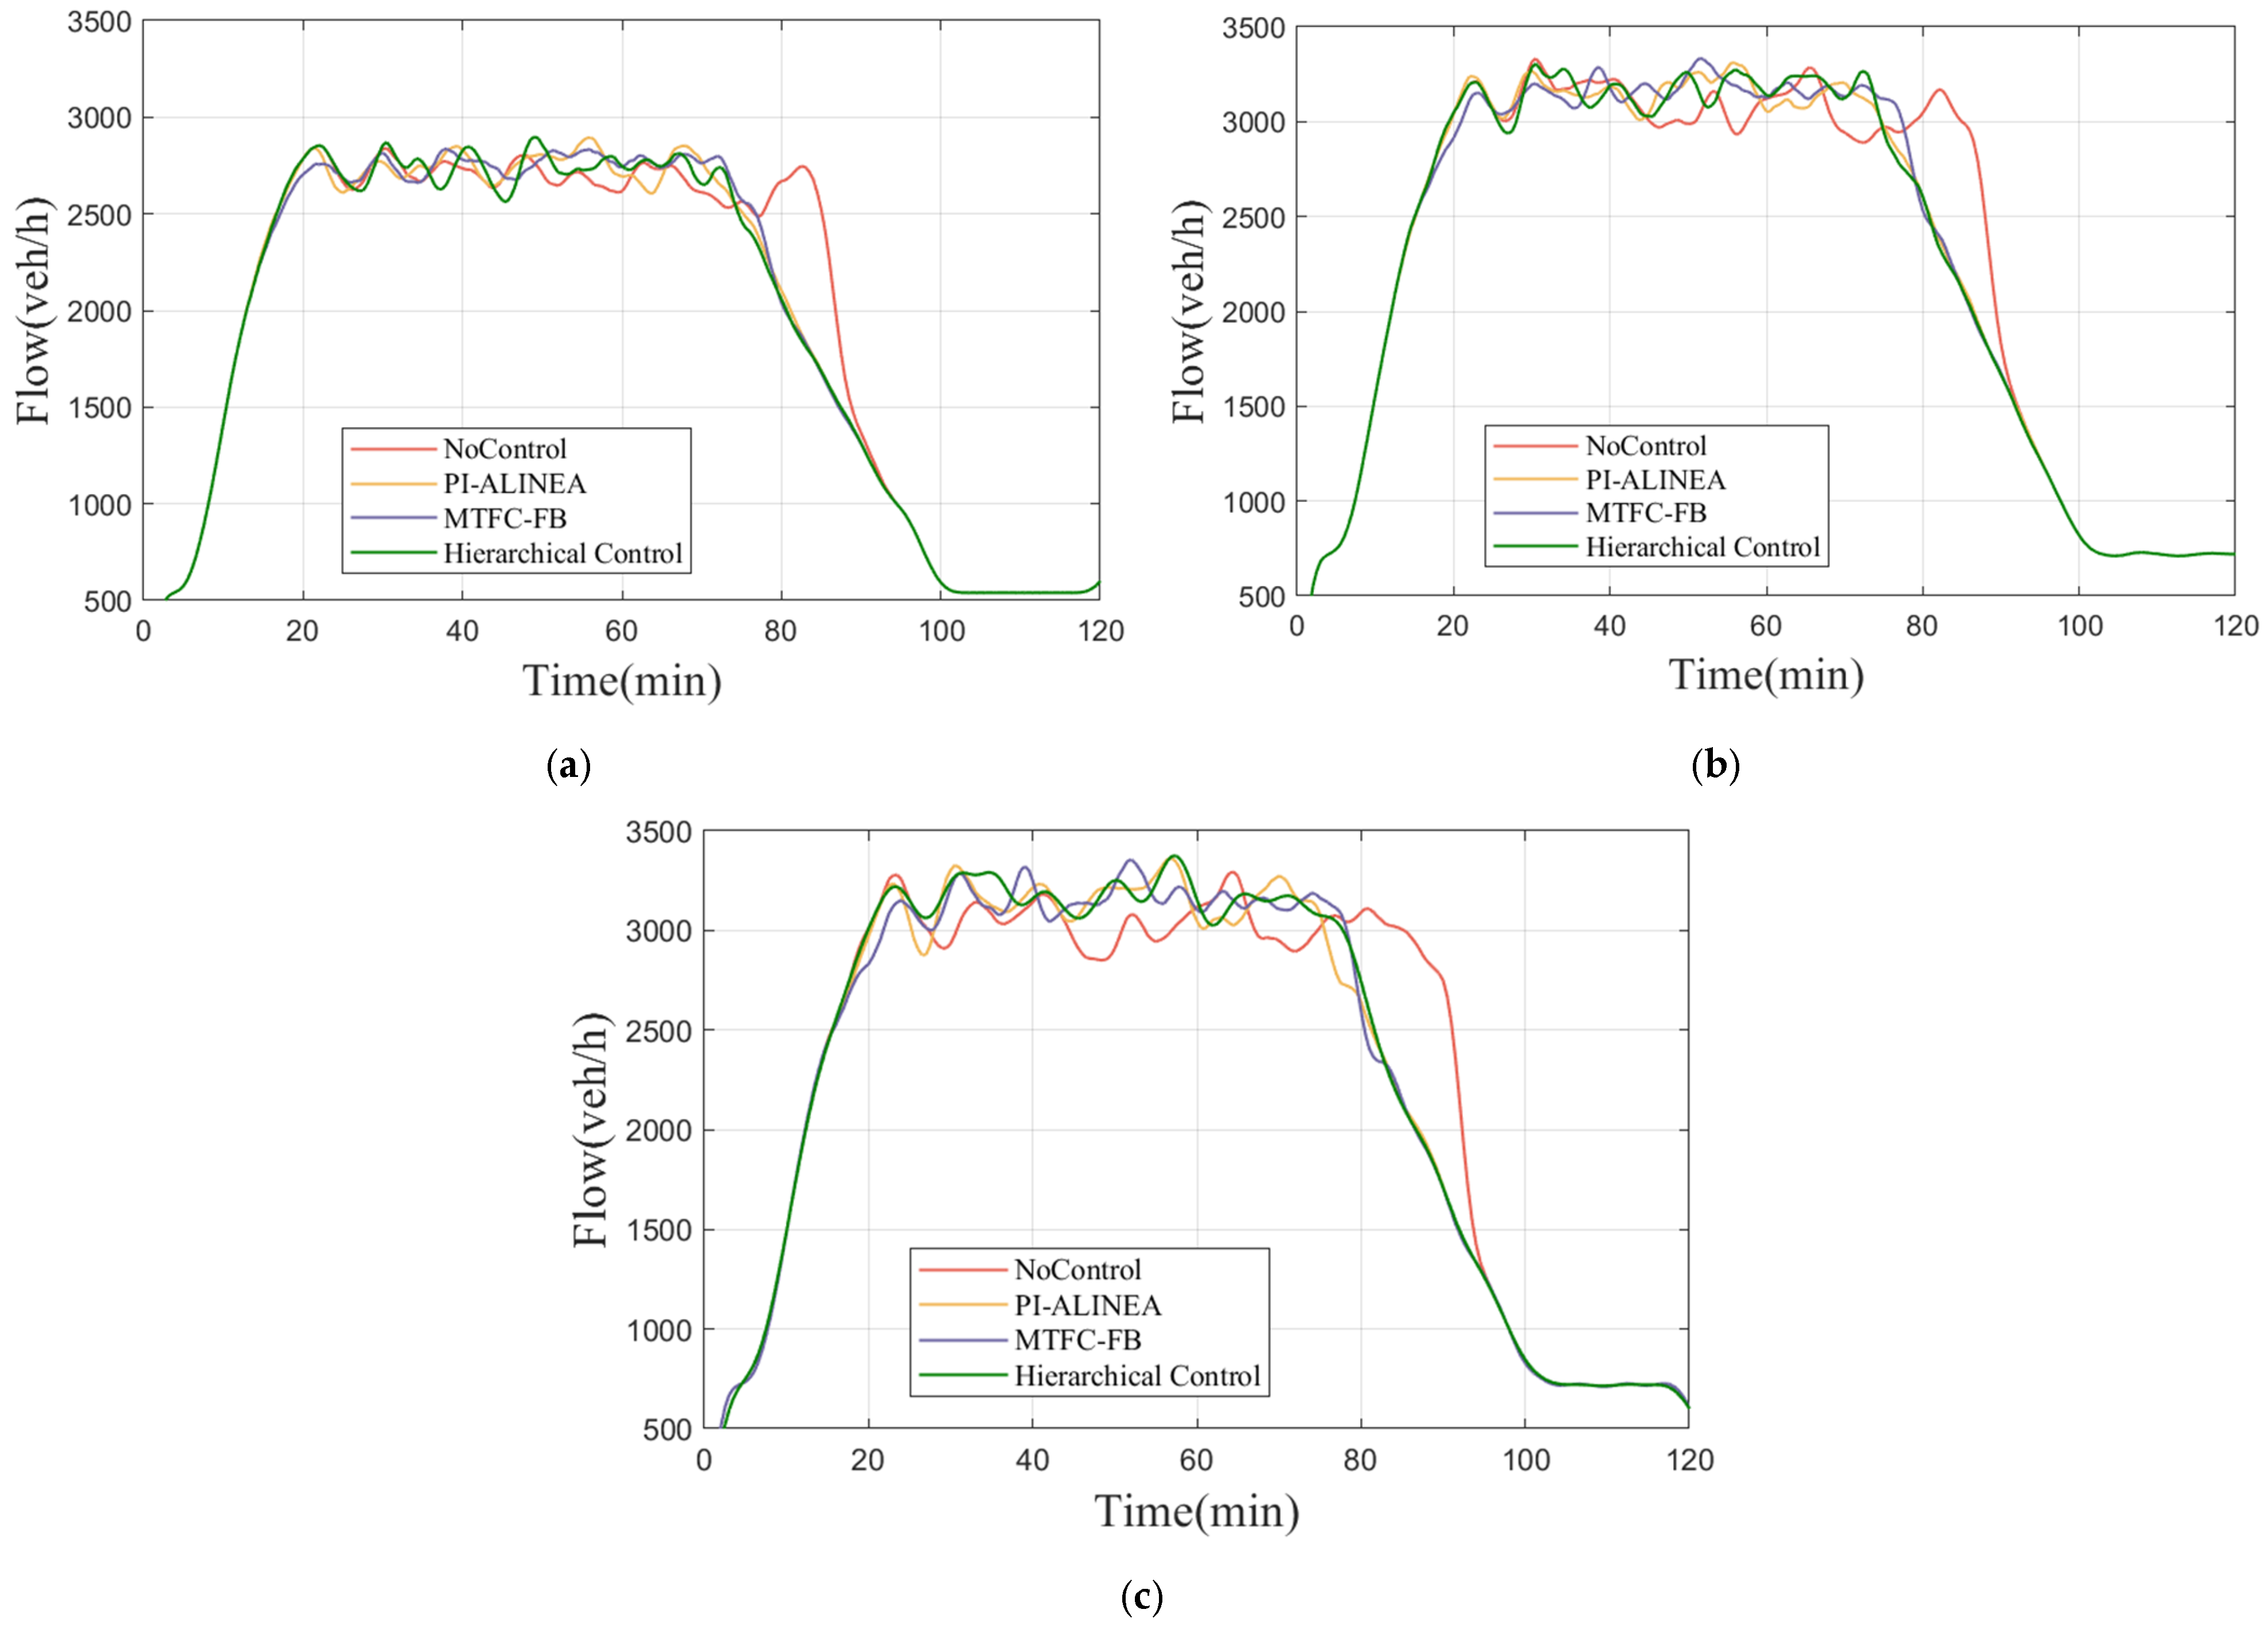
Figure 4, Figure 5 and Figure 6 illustrate the variations in density, speed, and flow across each segment under different scenarios. In the no-control scenario, congestion occurs when the combined upstream arrival inflow and on-ramp merging flow exceeds the segment capacity. At 30 min, the density in segment 3 rises sharply, peaking at approximately 250 veh/km at 50 min. Correspondingly, the speed drops abruptly to below 20 km/h, and the flow decreases by approximately 16%. The congestion wave then propagates upstream, causing a significant density increase in segment 2 and segment 1 between 40 and 60 min, with peak densities approaching 180 veh/km. The minimum speeds fall to around 15 km/h, and the flow decreases by 8% to 12%. These results indicate that, in the absence of control, congestion originating in segment 3 spreads rapidly upstream, severely degrading the overall traffic performance.
In the PI-ALINEA scenario, the integral and proportional gains are set to 300 km/h and 130 km/h, respectively, as determined through repeated experiments conducted around the empirical values provided in [35]. PI-ALINEA effectively maintains the density of segment 3 around the critical occupancy level of 90 veh/km, with the speed increasing to approximately 60 km/h. Although flow fluctuates by more than 400 veh/h between 20 and 30 min, it gradually stabilizes after 30 min, without the significant flow reduction as seen in the no-control scenario. The densities of segments 2 and 1 remain relatively stable; however, the average speed in segment 2 is generally 10–20 km/h lower than in segment 1. This speed distribution suggests that although PI-ALINEA improves flow in the bottleneck segment, the reduced speed of merging vehicles due to ramp metering affects mainstream traffic, leading to localized flow instability.
In the MTFC-FB scenario, the gains of the primary controller are set to 9 km/h and 55 km/h, respectively, while the secondary (VSL rate) controller uses an integral gain of 0.0015 h/veh. These values are determined with reference to the empirical values reported in [59,60] and are further refined through repeated experiments. The results show that the densities of each segment remain relatively stable in this scenario. Compared to the PI-ALINEA, the density in segment 1 is approximately 20 veh/km higher, while the speed is about 30 km/h lower. This is because lower speed limits are applied in segment 1 to reduce vehicle speeds and delay their arrival at the downstream bottleneck. Due to the limited acceleration capability of container trucks, they are unable to recover speed over a short distance after exiting the VSL control area. As a result, the speed in segment 2 is about 5 km/h lower than in the PI-ALINEA scenario. Despite these speed reductions, flow variations in MTFC-FB are more stable, remaining within 200 veh/h, compared to the larger fluctuations observed with PI-ALINEA. These findings suggest that MTFC-FB effectively smooths traffic flow by regulating upstream vehicle speeds.
In the hierarchical control scenario, the integral gain of the VSL rate controller is set to 0.0015 h/veh, as determined through repeated experiments conducted around the empirical values provided in [59]. In terms of density, the segment densities in this scenario are comparable to those in the PI-ALINEA scenario, with segment 2 exhibiting even greater stability. For example, PI-ALINEA shows fluctuations of over 15 veh/km between 60 min and 70 min, whereas the hierarchical control scenario maintains stable densities during the same period without noticeable variation. In terms of speed, the hierarchical control scenario achieves a significant improvement compared to the no-control scenario, maintaining a steady level in each segment of around 60 km/h, which indicates effective congestion mitigation. Compared to MTFC-FB, the speeds in segments 1 and 2 increase by approximately 10 to 20 km/h. This suggests that integrated ramp metering prevents the prolonged application of low speed limits in segment 1, thereby mitigating the negative impact caused by the poor acceleration and deceleration performance of container trucks, and consequently improving the mainstream traffic speed. Finally, the hierarchical control scenario improves traffic throughput. In segment 3, the flow remains around 3300 veh/h between 20 and 60 min, representing an increase of approximately 16% compared to the no-control scenario. No significant flow drops are observed in segments 1 and 2, indicating a stable and well-regulated traffic state.
In summary, by integrating both VSL and RM strategies, the hierarchical control scenario provides higher traffic flow stability than PI-ALINEA and achieves better speed performance than MTFC-FB.

3.3. Total Time Spent Analysis in Different Scenarios

Total time spent (TTS) refers to the sum of the total travel times (TTTs) for all vehicles in segments 1–3, and the total waiting times (TWTs) for all the vehicles on the on-ramp. The TTS values for each scenario are summarized in Table 3 and serve as a reference for evaluating traffic efficiency across different scenarios.
In the no-control scenario, the TTS reached as high as 13,966.0 min. Without any control measures, congestion frequently developed downstream of the on-ramp during periods of high demand increase. Once congestion set in, the vehicles moved slowly with frequent acceleration and deceleration, resulting in a stop-and-go traffic pattern that significantly prolonged travel times.
In the PI-ALINEA scenario, the TTS was reduced to 7526.4 min, representing a 46.1% improvement compared to the no-control scenario. By regulating the inflow from the on-ramp to the mainline, traffic density was effectively reduced, particularly in segment 2. This prevented congestion caused by excessive on-ramp merging and resulted in an optimized TTT of 6870.4 min. However, to achieve this flow control, the vehicles needed to wait at the on-ramp entrance, resulting in a TWT of 656.0 min.
In the MTFC-FB scenario, the TTS was further reduced to 7490.2 min, a 46.4% improvement over the no-control scenario. Although this represents slightly better overall performance than PI-ALINEA, the TTT is higher. This is mainly because low speed limits are imposed upstream for an extended period, and container trucks are unable to accelerate quickly after exiting the VSL control area due to their limited acceleration and deceleration capabilities. While this strategy improves flow stability, it also results in longer travel times for vehicles on the mainline.
In comparison, the hierarchical control scenario achieved the best performance in terms of traffic efficiency. The TTS was reduced to 6851.6 min, representing a 50.9% improvement over the no-control scenario, a 4.8% improvement over PI-ALINEA, and a 4.5% improvement over MTFC-FB. This improvement resulted from the integrated application of RM and VSL control. On one hand, the hierarchical control can alleviate congestion without imposing prolonged low speed limits on upstream vehicles, thereby avoiding the increased travel times associated with the limited acceleration and deceleration capabilities of container trucks. As a result, the TTT is further reduced to 6757.6 min, representing a 9.8% improvement compared to the MTFC-FB. By precisely controlling ramp inflow, unnecessary waiting time is effectively reduced, optimizing the TWT to 94.0 min, which is significantly lower than in the PI-ALINEA scenario.

3.4. Stability Analysis of Hierarchical Control in Different Penetration Rates

Although a fully CV environment offers maximum benefits for control strategies, achieving full CV deployment remains a long-term goal. During this transition, mixed traffic scenarios involving both CVs and RVs will inevitably persist for an extended period. To assess the proposed control method under these transitional conditions, this subsection analyzes its performance across different market penetration rates (MPRs). MPRs are gradually reduced from 100% to 60% in 10% decrements, resulting in five distinct scenarios. For the RVs in the mixed scenarios, the parameter settings are as follows: Sigma is set to 0.2 to represent driver behavior variability, and Speed-Dev is set to 0.1 to reflect speed variation among drivers.

3.4.1. Density, Speed, and Flow Analysis in Different MPRs

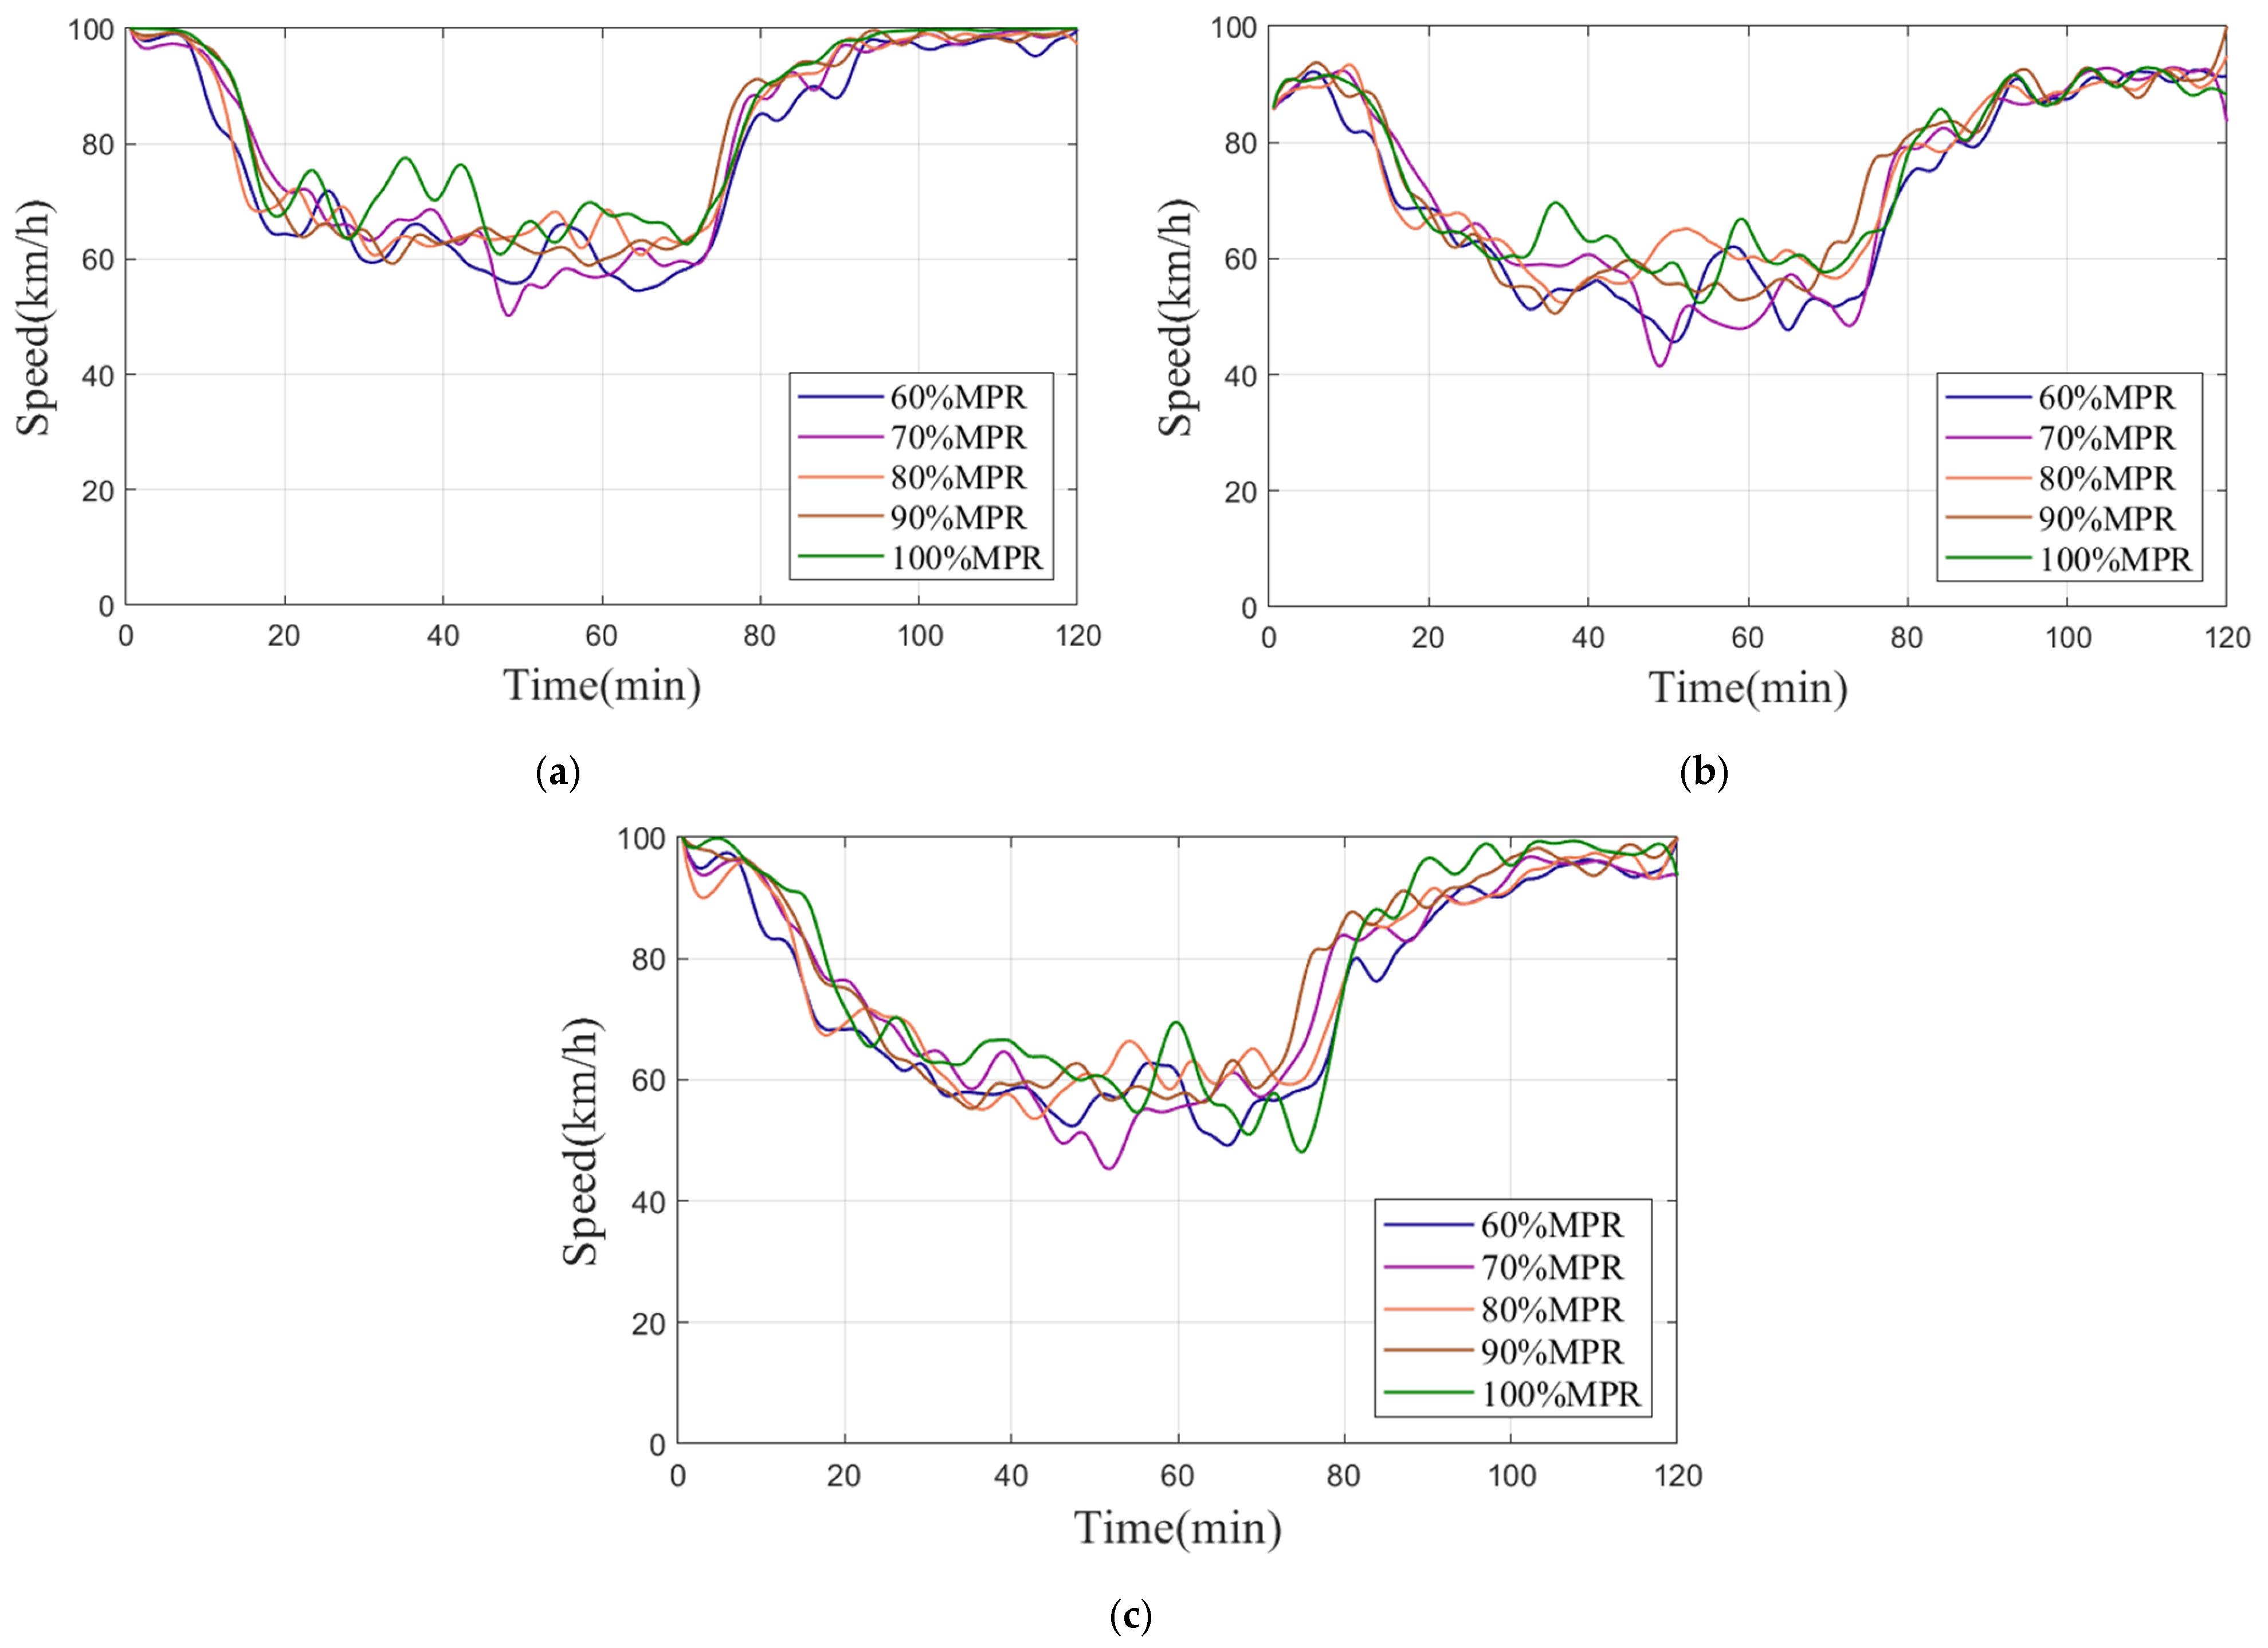
Figure 7, Figure 8 and Figure 9 illustrate the variations in density, speed, and flow across each segment under different MPRs. As shown in Figure 7, although the segment densities at different MPRs generally remain near their respective critical values, overall density tends to increase and exhibit greater fluctuations as the MPR decreases. For example, in the 70% MPR scenario, the peak density in segment 3 exceeds 100 veh/km, while in the 60% MPR scenario, the density fluctuations between 50 and 70 min surpass 25 veh/km. This is mainly because RVs do not fully comply with control commands, and as their proportion increases, the effectiveness of the control is significantly reduced.
Figure 8 further illustrates that average speed decreases as the MPR declines, and the speed differences between segments become more pronounced. In the 80%, 90%, and 100% MPR scenarios, the vehicle speeds across all segments generally remain within the range of 60–80 km/h. In contrast, the speeds in the 60% and 70% MPR scenarios are mostly below 60 km/h. For instance, in the 60% MPR scenario, the average speed in segment 2 is about 10 km/h lower than in segment 1. This is primarily due to the fact that some conservative RV drivers tend to travel at lower speeds, thereby reducing the overall average speed. In addition, RVs lack the ability to quickly perceive and respond to dynamic traffic conditions. When encountering disturbances such as on-ramp vehicle merging, they are less capable of adjusting speed promptly, further amplifying the differences between segments.
As shown in Figure 9, the flow trends closely mirror the patterns observed in density, with significantly increased fluctuations as the MPR decreases. For example, in the 60% MPR scenario, the flow fluctuations in segment 2 exceed 400 veh/h between 50 min and 70 min; in the 70% MPR scenario, the fluctuations also exceed 400 veh/h between 45 min and 55 min. In contrast, in the higher MPR scenarios, the flow remains relatively stable overall.
Overall, a decrease in the MPR leads to increased traffic instability, characterized by higher densities, lower speeds, and greater fluctuations in flow. Nonetheless, the proposed method remains effective in improving traffic performance, with its advantages becoming more prominent when the MPR is 80% or higher. This is because the hierarchical control structure enables effective regulation of traffic flow even with partial non-compliance, especially near bottlenecks where connected vehicles have greater influence and control actions are more impactful.

3.4.2. Total Time Spent Analysis in Different MPRs

Table 4 presents the TTS under different MPRs. It can be observed that the TTS increases as the MPR decreases, indicating a decline in overall traffic efficiency. Specifically, the TTT rises from 6757.6 min at 100% MPR to 7250.5 min at 60% MPR, mainly because RVs are less responsive to control commands, leading to reduced driving efficiency. Meanwhile, the TWT generally increases with decreasing MPR. However, the TWT at 70% MPR reaches 288.7 min, which is notably higher than the 230.6 min observed at 60% MPR. This irregularity may be due to the fact that as the MPR decreases, the interaction between CVs and RVs becomes more complex, leading to temporary queuing when ramp vehicles merge.
Overall, the proposed method maintains relatively stable traffic efficiency with different MPRs and demonstrates better control performance with an increase in the proportion of CVs.

4. Conclusions and Future Work

This paper proposes a hierarchical control method that integrates ramp metering (RM) and variable speed limits (VSLs), specifically tailored for port motorway environments with high CV penetration. The method adopts a hierarchical traffic control framework in which the upper-level optimization layer determines system-wide control parameters, including the optimal flow combination for the next time step, based on real-time traffic conditions. The lower-level execution layer then translates these parameters into actionable control commands at the local level, such as speed limits and ramp signals. By leveraging continuous traffic state information and accounting for the operational characteristics of container truck traffic, the proposed approach supports both global efficiency and local adaptability, enabling effective and responsive traffic regulation in complex port logistics scenarios.
To evaluate the performance of the proposed method, a microscopic simulation was conducted using SUMO, based on the Guoju area of the Chuanshan Port Motorway in Ningbo. This site reflects realistic port traffic characteristics, including a high proportion of container trucks and a near-complete penetration of CVs. The simulation, integrated with MATLAB-based optimization and analytical tools, was used to implement the hierarchical control framework and examine its effectiveness under dynamic traffic conditions. The results demonstrate that the proposed method significantly alleviates junction congestion, increasing throughput by up to 16% over the baseline scenario without control. It also improves traffic efficiency by 50.9% over the no-control case, 4.8% over PI-ALINEA, and 4.5% over MTFC-FB.
Furthermore, to assess the robustness of the proposed method in more realistic deployment scenarios where full CV penetration is not guaranteed, additional experiments were conducted with CV market penetration rates (MPRs) ranging from 60% to 100%. The results show that as the MPR decreases, the traffic exhibits greater density fluctuations, reduced average speeds, and increased flow variability. Nonetheless, the method remains effective and demonstrates robust performance, particularly when the MPR reaches 80% or higher.
Despite its promising results, this study has several limitations. The simulation assumes ideal communication and full compliance from CVs, which may not fully reflect real-world uncertainties such as delays or partial responsiveness. In addition, the traffic composition is fixed, without accounting for variations in the proportion of container trucks during different operational periods. Future work will address these limitations by incorporating more realistic communication environments, heterogeneous vehicle behaviors, and dynamic traffic compositions to better reflect real-world scenarios. Moreover, a more systematic tuning approach for the integral gain of the VSL controller could be explored, to further enhance control robustness and adaptability.

Author Contributions

Conceptualization, W.Y. and P.Z.; methodology, W.Y., H.Y., Y.W. and P.Z.; software, W.Y.; validation, W.Y., Y.W. and Y.Z.; formal analysis, W.Y., H.Y., M.L. and P.Z.; investigation, W.Y., H.Y. and M.L.; Resources, P.Z.; data curation, W.Y., H.Y. and M.L.; writing—original draft, W.Y.; writing—review & editing, Y.Z. and P.Z.; visualization, W.Y.; supervision, P.Z.; project administration, H.Y. and P.Z.; funding acquisition, P.Z. All authors have read and agreed to the published version of the manuscript.

Funding

The work was supported in part by the National Natural Science Foundation of China (52272334), Ningbo International Science and Technology Cooperation Project (2023H020), Key R&D Program of Zhejiang Province (2024C01180), EC H2020 Project (690713), National Key Research and Development Program of China (2017YFE0194700), and the Fundamental Research Funds for the Provincial Universities of Zhejiang (SJLY2025006).

Data Availability Statement

The code used in this study is available from the authors upon reasonable request.

Acknowledgments

We would like to thank the National ‘111’ Centre on the Safety and Intelligent Operation of Sea Bridges (D21013), and the Zhejiang 2011 Collaborative Innovation Center for Port Economy for the support in providing academic and technical resources. The authors would like to thank the K.C. Wong Magna Fund at Ningbo University for their sponsorship.

Conflicts of Interest

The authors declare no conflicts of interest.

References

  1. Calvert, S.C.; Schakel, W.J.; van Arem, B. Evaluation and modelling of the traffic flow effects of truck platooning. Transp. Res. Part C Emerg. Technol. 2019, 105, 1–22. [Google Scholar] [CrossRef]
  2. Yang, D.; Kuijpers, A.; Dane, G.; der Sande, T.V. Impacts of large-scale truck platooning on dutch highways. Transp. Res. Procedia 2019, 37, 425–432. [Google Scholar] [CrossRef]
  3. Carboni, A.; Deflorio, F.; Caballini, C.; Cangelosi, S. Advances in terminal management: Simulation of vehicle traffic in container terminals. Marit. Econ. Logist. 2024. [Google Scholar] [CrossRef]
  4. Ma, W.; He, Z.; Wang, L.; Abdel-Aty, M.; Yu, C. Active traffic management strategies for expressways based on crash risk prediction of moving vehicle groups. Accid. Anal. Prev. 2021, 163, 106421. [Google Scholar] [CrossRef]
  5. Papageorgiou, M.; Hadj-Salem, H.; Blosseville, J. ALINEA: A local feedback control law for on-ramp metering. Transp. Res. Rec. 1991, 1320, 58–67. [Google Scholar]
  6. Faulkner, L.; Dekker, F.; Gyles, D.; Papamichail, I.; Papageorgiou, M. Evaluation of HERO-coordinated ramp metering installation at m1 and m3 freeways in queensland, australia. Transp. Res. Rec. J. Transp. Res. Board 2014, 2470, 13–23. [Google Scholar] [CrossRef]
  7. Smaragdis, E.; Papageorgiou, M.; Kosmatopoulos, E. A flow-maximizing adaptive local ramp metering strategy. Transp. Res. Part B Methodol. 2004, 38, 251–270. [Google Scholar] [CrossRef]
  8. Papamichail, I.; Papageorgiou, M. Traffic-responsive linked ramp-metering control. IEEE Trans. Intell. Transp. Syst. 2008, 9, 111–121. [Google Scholar] [CrossRef]
  9. Wang, Y.; Kosmatopoulos, E.B.; Papageorgiou, M.; Papamichail, I. Local ramp metering in the presence of a distant downstream bottleneck: Theoretical analysis and simulation study. IEEE Trans. Intell. Transp. Syst. 2014, 15, 2024–2039. [Google Scholar] [CrossRef]
  10. Masher, D.P.; Ross, D.W.; Wong, P.J.; Tuan, P.L.; Zeidler, H.M.; Petracek, S. Guidelines for Design and Operation of Ramp Control Systems; Stanford Research Institute: Menlo Park, CA, USA, 1975. [Google Scholar]
  11. Ferrara, A.; Sacone, S.; Siri, S.; Vivas, C.; Rubio, F.R. Switched observer-based ramp metering controllers for freeway systems. In Proceedings of the 2016 IEEE 55th Conference on Decision and Control (CDC), Las Vegas, NV, USA, 12–14 December 2016; pp. 6777–6782. [Google Scholar]
  12. Frejo, J.R.D.; De Schutter, B. Feed-forward ALINEA: A ramp metering control algorithm for nearby and distant bottlenecks. IEEE Trans. Intell. Transp. Syst. 2019, 20, 2448–2458. [Google Scholar] [CrossRef]
  13. Wolshon, B.; Ishak, S.; Qi, Y.; Korkut, M.; Sun, X.; Alecsandru, C. Trucker perceptions of lane restriction and differential speed limit policies on freeways. J. Transp. Saf. Secur. 2009, 1, 101–120. [Google Scholar] [CrossRef]
  14. Chen, J.; Lin, W.; Yang, Z.; Li, J.; Cheng, P. Adaptive ramp metering control for urban freeway using large-scale data. IEEE Trans. Veh. Technol. 2019, 68, 9507–9518. [Google Scholar] [CrossRef]
  15. Liu, Z.; Wu, Y.; Cao, S.; Zhu, L.; Shen, G. A ramp metering method based on congestion status in the urban freeway. IEEE Access 2020, 8, 76823–76831. [Google Scholar] [CrossRef]
  16. Bellemans, T.; De Schutter, B.; De Moor, B. Model predictive control for ramp metering of motorway traffic: A case study. Control Eng. Pract. 2006, 14, 757–767. [Google Scholar] [CrossRef]
  17. Gu, C.; Wu, C.; Teo, K.L.; Wu, Y.; Wang, S. A smoothing method for ramp metering. IEEE Trans. Intell. Transp. Syst. 2022, 23, 13358–13371. [Google Scholar] [CrossRef]
  18. Han, Y.; Ramezani, M.; Hegyi, A.; Yuan, Y.; Hoogendoorn, S. Hierarchical ramp metering in freeways: An aggregated modeling and control approach. Transp. Res. Part C Emerg. Technol. 2020, 110, 1–19. [Google Scholar] [CrossRef]
  19. Tabadkani Aval, S.S.; Eghbal, N. Feedback-based cooperative ramp metering for highway traffic flow control: A model predictive sliding mode control approach. Int. J. Robust. Nonlinear Control 2020, 30, 8259–8277. [Google Scholar] [CrossRef]
  20. Gu, C.; Zhou, T.; Wu, C. Deep koopman traffic modeling for freeway ramp metering. IEEE Trans. Intell. Transp. Syst. 2023, 24, 6001–6013. [Google Scholar] [CrossRef]
  21. Georgantas, A.; Lazarou, M.; Timotheou, S.; Stathaki, T.; Panayiotou, C.G. Highway traffic control with ramp metering utilizing variational autoencoders. IFAC-Pap. 2022, 55, 75–80. [Google Scholar] [CrossRef]
  22. Lemarchand, A.; Martinez, J.J.; Koenig, D. Hierarchical coordinated freeway on-ramp metering using switching system theory. IFAC Proc. Vol. 2010, 43, 342–349. [Google Scholar] [CrossRef]
  23. Papamichail, I.; Kotsialos, A.; Margonis, I.; Papageorgiou, M. Coordinated ramp metering for freeway networks—A model-predictive hierarchical control approach. Transp. Res. Part C Emerg. Technol. 2010, 18, 311–331. [Google Scholar] [CrossRef]
  24. Geroliminis, N.; Srivastava, A.; Michalopoulos, P. A dynamic-zone-based coordinated ramp-metering algorithm with queue constraints for minnesota’s freeways. IEEE Trans. Intell. Transp. Syst. 2011, 12, 1576–1586. [Google Scholar] [CrossRef]
  25. Zhang, G.; Wang, Y. Optimizing coordinated ramp metering: A preemptive hierarchical control approach. Comput-Aided Civ. Infrastruct. Eng. 2013, 28, 22–37. [Google Scholar] [CrossRef]
  26. Ferrara, A.; Incremona, G.P.; Piacentini, G. A hierarchical MPC and sliding mode based two-level control for freeway traffic systems with partial demand information. Eur. J. Control 2021, 59, 152–164. [Google Scholar] [CrossRef]
  27. Pasquale, C.; Sacone, S.; Siri, S.; Ferrara, A. Hierarchical centralized/decentralized event-triggered control of multiclass traffic networks. IEEE Trans. Control Syst. Technol. 2021, 29, 1549–1564. [Google Scholar] [CrossRef]
  28. Xu, P.; Xiao, X.; Yao, S. A review of train passenger safety—Inspiration from passive safety passenger protection technology of automobile. Transp. Saf. Env. 2021, 4, tdab032. [Google Scholar] [CrossRef]
  29. Obeidat, M.S.; Obeidat, R.M.; Dweiri, F. Unravelling the veil of traffic safety: A comprehensive analysis of factors influencing crash frequency across US states. Transp. Saf. Env. 2024, 6, tdae016. [Google Scholar] [CrossRef]
  30. Zhang, J.; Chang, H.; Ioannou, P.A. A simple roadway control system for freeway traffic. In Proceedings of the 2006 American Control Conference, Minneapolis, MN, USA, 14–16 June 2006; p. 6. [Google Scholar]
  31. Carlson, R.C.; Papamichail, I.; Papageorgiou, M. Local feedback-based mainstream traffic flow control on motorways using variable speed limits. IEEE Trans. Intell. Transp. Syst. 2011, 12, 1261–1276. [Google Scholar] [CrossRef]
  32. Chen, D.; Ahn, S.; Hegyi, A. Variable speed limit control for steady and oscillatory queues at fixed freeway bottlenecks. Transp. Res. Part B Methodol. 2014, 70, 340–358. [Google Scholar] [CrossRef]
  33. Martínez, I.; Jin, W. Optimal location problem for variable speed limit application areas. Transp. Res. Part B Methodol. 2020, 138, 221–246. [Google Scholar] [CrossRef]
  34. Du, S.; Razavi, S. Fault-tolerant control of variable speed limits for freeway work zone using likelihood estimation. Adv. Eng. Inf. 2020, 45, 101133. [Google Scholar] [CrossRef]
  35. Carlson, R.C.; Papamichail, I.; Papageorgiou, M. Integrated feedback ramp metering and mainstream traffic flow control on motorways using variable speed limits. Transp. Res. Part C Emerg. Technol. 2014, 46, 209–221. [Google Scholar] [CrossRef]
  36. Iordanidou, G.; Papamichail, I.; Roncoli, C.; Papageorgiou, M. Feedback-based integrated motorway traffic flow control with delay balancing. IEEE Trans. Intell. Transp. Syst. 2017, 18, 2319–2329. [Google Scholar] [CrossRef]
  37. Shaaban, K.; Khan, M.A.; Kim, I.; Hamila, R. Queue discharge at freeway on-ramps using coordinated operation of a ramp meter and an upstream traffic signal. Procedia Comput. Sci. 2020, 170, 347–353. [Google Scholar] [CrossRef]
  38. Frejo, J.R.D.; De Schutter, B. Logic-based traffic flow control for ramp metering and variable speed limits—Part 1: Controller. IEEE Trans. Intell. Transp. Syst. 2020, 22, 2647–2657. [Google Scholar] [CrossRef]
  39. Frejo, J.R.D.; De Schutter, B. Logic-based traffic flow control for ramp metering and variable speed limits—Part 2: Simulation and comparison. IEEE Trans. Intell. Transp. Syst. 2020, 22, 2658–2668. [Google Scholar] [CrossRef]
  40. Liu, S.; Sadowska, A.; Frejo, J.R.D.; Núñez, A.; Camacho, E.F.; Hellendoorn, H.; De Schutter, B. Robust receding horizon parameterized control for multi-class freeway networks: A tractable scenario-based approach. Int. J. Robust. Nonlinear Control 2016, 26, 1211–1245. [Google Scholar] [CrossRef]
  41. Chiang, Y.; Juang, J. Control of freeway traffic flow in unstable phase by $ h_ {\infty} $ theory. IEEE Trans. Intell. Transp. Syst. 2008, 9, 193–208. [Google Scholar] [CrossRef]
  42. Van de Weg, G.S.; Hegyi, A.; Hoogendoorn, S.P.; De Schutter, B. Efficient freeway MPC by parameterization of ALINEA and a speed-limited area. IEEE Trans. Intell. Transp. Syst. 2019, 20, 16–29. [Google Scholar] [CrossRef]
  43. Mittal, A.; Kim, E.; Mahmassani, H.S.; Hong, Z. Predictive dynamic speed limit in a connected environment for a weather affected traffic network: A case study of chicago. Transp. Res. Rec. J. Transp. Res. Board 2018, 2672, 13–24. [Google Scholar] [CrossRef]
  44. Silgu, M.A.; Erdagi, I.G.; Goksu, G.; Celikoglu, H.B. Combined control of freeway traffic involving cooperative adaptive cruise controlled and human driven vehicles using feedback control through SUMO. IEEE Trans. Intell. Transp. Syst. 2022, 23, 11011–11025. [Google Scholar] [CrossRef]
  45. Radac, M.; Lala, T. Hierarchical cognitive control for unknown dynamic systems tracking. Mathematics 2021, 9, 2752. [Google Scholar] [CrossRef]
  46. Zhu, W.; Hayashibe, M. A hierarchical deep reinforcement learning framework with high efficiency and generalization for fast and safe navigation. IEEE Trans. Ind. Electron. 2022, 70, 4962–4971. [Google Scholar] [CrossRef]
  47. Zhuo, H.; Yang, Z.; You, Y.; Xu, N.; Liao, L.; Wu, J.; He, J. A hierarchical control method for trajectory tracking of aerial manipulators arms. Actuators 2024, 13, 333. [Google Scholar] [CrossRef]
  48. Blanch-Fortuna, A.; Zambrano-Prada, D.; López-Santos, O.; Aroudi, A.E.; Vazquez-Seisdedos, L.; Martinez-Salamero, L. Hierarchical control of power distribution in the hybrid energy storage system of an ultrafast charging station for electric vehicles. Energies 2024, 17, 1393. [Google Scholar] [CrossRef]
  49. Griggs, W.M.; Ordonez-Hurtado, R.H.; Crisostomi, E.; Hausler, F.; Massow, K.; Shorten, R.N. A large-scale SUMO-based emulation platform. IEEE Trans. Intell. Transp. Syst. 2015, 16, 3050–3059. [Google Scholar] [CrossRef]
  50. Chen, X.; Wu, S.; Shi, C.; Huang, Y.; Yang, Y.; Ke, R.; Zhao, J. Sensing data supported traffic flow prediction via denoising schemes and ANN: A comparison. IEEE Sens. J. 2020, 20, 14317–14328. [Google Scholar] [CrossRef]
  51. Liu, X.; Qiu, L.; Fang, Y.; Wang, K.; Li, Y.; Rodríguez, J. Event-driven based reinforcement learning predictive controller design for three-phase NPC converters using online approximators. IEEE Trans. Power Electron. 2024, 40, 4914–4926. [Google Scholar] [CrossRef]
  52. Chen, X.; Wei, C.; Xin, Z.; Zhao, J.; Xian, J. Ship detection under low-visibility weather interference via an ensemble generative adversarial network. J. Mar. Sci. Eng. 2023, 11, 2065. [Google Scholar] [CrossRef]
  53. Lofberg, J. YALMIP: A toolbox for modeling and optimization in MATLAB. In Proceedings of the 2004 IEEE International Conference on Robotics and Automation (IEEE Cat. No. 04CH37508), Taipei, Taiwan, 2–4 September 2004; pp. 284–289. [Google Scholar]
  54. Chen, S.; Piao, L.; Zang, X.; Luo, Q.; Li, J.; Yang, J.; Rong, J. Analyzing differences of highway lane-changing behavior using vehicle trajectory data. Phys. A Stat. Mech. Its Appl. 2023, 624, 128980. [Google Scholar] [CrossRef]
  55. Wang, C.; Xu, Y.; Zhang, J.; Ran, B. Integrated traffic control for freeway recurrent bottleneck based on deep reinforcement learning. IEEE Trans. Intell. Transp. Syst. 2022, 23, 15522–15535. [Google Scholar] [CrossRef]
  56. Spiliopoulou, A.D.; Papamichail, I.; Papageorgiou, M. Toll plaza merging traffic control for throughput maximization. J. Transp. Eng. 2010, 136, 67–76. [Google Scholar] [CrossRef]
  57. Papageorgiou, M.; Kotsialos, A. Freeway ramp metering: An overview. IEEE Trans. Intell. Transp. Syst. 2002, 3, 271–281. [Google Scholar] [CrossRef]
  58. Feng, J.; Lin, K.; Shi, T.; Wu, Y.; Wang, Y.; Zhang, H.; Tan, H. Cooperative traffic optimization with multi-agent reinforcement learning and evolutionary strategy: Bridging the gap between micro and macro traffic control. Phys. A Stat. Mech. Its Appl. 2024, 647, 129734. [Google Scholar] [CrossRef]
  59. Carlson, R.C.; Papamichail, I.; Papageorgiou, M. Mainstream traffic flow control on freeways using variable speed limits. Transportes 2014, 21, 56–65. [Google Scholar] [CrossRef]
  60. Carlson, R.C.; Manolis, D.; Papamichail, I.; Papageorgiou, M. Integrated ramp metering and mainstream traffic flow control on freeways using variable speed limits. Procedia—Soc. Behav. Sci. 2012, 48, 1578–1588. [Google Scholar] [CrossRef]
Figure 1. The single representative junction.
Systems 13 00446 g001
Figure 2. The Guoju area of Chuanshan Port Motorway in Ningbo.
Systems 13 00446 g002
Figure 3. Mainstream demand and on-ramp demand.
Systems 13 00446 g003
Figure 4. Density comparison of each segment in different scenarios. (a) Segment 1. (b) Segment 2. (c) Segment 3.
Systems 13 00446 g004
Figure 5. Speed comparison of each segment in different scenarios. (a) Segment 1. (b) Segment 2. (c) Segment 3.
Systems 13 00446 g005
Figure 6. Flow comparison of each segment in different scenarios. (a) Segment 1. (b) Segment 2. (c) Segment 3.
Systems 13 00446 g006
Figure 7. Density comparison of each segment in different MPRs. (a) Segment 1. (b) Segment 2. (c) Segment 3.
Systems 13 00446 g007
Figure 8. Speed comparison of each segment in different MPRs. (a) Segment 1. (b) Segment 2. (c) Segment 3.
Systems 13 00446 g008
Figure 9. Flow comparison of each segment in different MPRs. (a) Segment 1. (b) Segment 2. (c) Segment 3.
Systems 13 00446 g009
Table 1. Parameters for different vehicle types.
Vehicle TypeLength (m)Accelerate (m/s2)Decelerate (m/s2)
Car5.02.64.5
Container Truckcarry TEU10.01.02.0
carry FEU16.00.31.0
Table 2. Summary of simulation parameters.
ParametersValuesParametersValues
T (s)30 ρ c r , 1 (veh/km)40
g m i n (s)3 ρ c r , 2 (veh/km)60
q c a p (veh/h)3400 ρ c r , 3 (veh/km)90
q c a p m (veh/h)2700 ρ m a x (veh/km)255
r s a t (veh/h)840 Δ V m a x (km/h)20
Δ q m a x (veh/h)600 b m i n 0.4
Table 3. Summary of TTS for simulated scenarios.
ScenarioTTT (min)TWT (min)TTS (min)
No-Control13,966.0013,966.0
PI-ALINEA6870.4656.07526.4 (−46.1%)
MTFC-FB7490.207490.2 (−46.4%)
Hierarchical Control6757.694.06851.6 (−50.9%)
Table 4. Summary of TTS for different MPRs.
ScenarioTTT (min)TWT (min)TTS (min)
60%MPR7250.5230.67481.1
70%MPR7093.9288.77382.6
80%MPR6915.3158.57073.8
90%MPR6885.1127.47012.5
100%MPR6757.694.06851.6
Disclaimer/Publisher’s Note: The statements, opinions and data contained in all publications are solely those of the individual author(s) and contributor(s) and not of MDPI and/or the editor(s). MDPI and/or the editor(s) disclaim responsibility for any injury to people or property resulting from any ideas, methods, instructions or products referred to in the content.